nber working paper series surviving … · we both gratefully acknowledge the support of nih grant...
TRANSCRIPT

NBER WORKING PAPER SERIES
SURVIVING ANDERSONVILLE:THE BENEFITS OF SOCIAL NETWORKS IN POW CAMPS
Dora L. CostaMatthew E. Kahn
Working Paper 11825http://www.nber.org/papers/w11825
NATIONAL BUREAU OF ECONOMIC RESEARCH1050 Massachusetts Avenue
Cambridge, MA 02138December 2005
We both gratefully acknowledge the support of NIH grant R01 AG19637 and Dora Costa also gratefullyacknowledges the support of NIH grant P01 AG10120. We thank Claude Fischer, Alan Krueger, and theparticipants of workshops at the University of Chicago, Stanford University, the University of California atSan Diego, Harvard University, MIT, Wharton, the University of California at Berkeley, the University ofDelaware, the University of Rome Tor Vergata and the University of Rome La Sapienza for comments. Wethank the National Park Service for the use of their Andersonville database, Heather de Somer for researchassistance, and Noelle Yetter for advice on data collection. The views expressed herein are those of theauthor(s) and do not necessarily reflect the views of the National Bureau of Economic Research.
©2005 by Dora L. Costa and Matthew E. Kahn. All rights reserved. Short sections of text, not to exceed twoparagraphs, may be quoted without explicit permission provided that full credit, including © notice, is givento the source.

Surviving Andersonville: The Benefits of Social Networks in POW CampsDora L. Costa and Matthew E. KahnNBER Working Paper No. 11825December 2005JEL No. I120, Z130
ABSTRACT
Twenty-seven percent of the Union Army prisoners captured July 1863 or later died in captivity. At
Andersonville the death rate may have been as high as 40 percent. How did men survive such
horrific conditions? Using two independent data sets we find that friends had a statistically
significant positive effect on survival probabilities and that the closer the ties between friends as
measured by such identifiers as ethnicity, kinship, and the same hometown the bigger the impact of
friends on survival probabilities.
Dora L. CostaDepartment of Economics, E52-274CMIT50 Memorial DriveCambridge, MA 02142and [email protected]
Matthew E. KahnThe Fletcher SchoolTufts UniversityMedford, MA [email protected]

1 Introduction
For most of history soldiers captured by the enemy were either slaughtered or enslaved to die
quickly in a mine or galley ship or other lethal place. The concept of prisoners of war developed
during the seventeenth and eighteenth centuries both because of Enlightenment ideas and because
the mercenaries widely used by seventeenth century armies sought to save their own lives. During
the Napoleonic Wars, the first to employ mass conscription, captured troops were often kept in
prison camps and later exchanged. The first total war, the American Civil War, saw the first formal
code of conduct for dealing with prisoners of war, drawn up in 1863 at President Lincoln’s request.
It stipulated that captured troops had to be imprisoned, fed, and given medical treatment and could
not be enslaved, tortured, or killed (Malkin 2001). The Civil War reality, however, did not match
the ideals of the code. The death rate for imprisoned POWs was 12 percent in the North and 16
percent in the South (Rhodes 1904: 507-508). Some prison camps achieved notoriety, particularly
Andersonville in the South and to a lesser extent Florence and Salisbury in the South and Elmira
in the North. At Andersonville, which at its peak capacity was the fifth largest city in the south,
roughly one-third of the men died within 7 months (Rhodes 1904: 404) and forty percent of the
men who passed through Andersonville died there.1
How did men survive the horrific conditions of Civil War POW camps? This paper uses a
unique longitudinal database of Union Army soldiers and a cross-sectional database of the popu-
lation of Andersonville to examine the role of social networks in ensuring survival in Confederate
POW camps. A prison camp, with its absence of law enforcement, property rights, and formal mar-
kets and its subsistence income level is closer to a primitive society than to a civil society. Social
networks are therefore particularly likely to be important. The consumption smoothing literature
has emphasized that in developing countries the family plays a key role in smoothing idiosyncratic
1See United States War Department (1880- 1901), Series II, Vol. VIII, pp. 615, 781. In the longitudinal samplethat we subsequently use roughly 38 percent of the 554 men held at Andersonville died there. In the cross-sectionaldata that we subsequently use 40 percent of the listed men died at Andersonville.
1

shocks (Rosenzweig 1988; Townsend 1995; Grimard 1997; Fafchamps and Lund 2003). Social
networks can play the same role. The accounts of survivors of Civil War POW camps, Nazi con-
centration camps, the Soviet Gulag and Vietnamese POW internment mention the role of friends in
addition to various psychological mechanisms, collaboration with the enemy, preying upon fellow
prisoners, own youth, health, and physical strength and pure luck (Ransom 1963; McElroy 1957;
Appelbaum 2003; Eitinger 1964; Jones 1979; Schmolling 1984). Schmolling (1984) argued that
friends were the single most important key to survival of Nazi concentration camps. Those with-
out friends might end up with short rations and had more trouble adapting psychologically. In the
Gulag of the late 1940s the Ukranians, Balts, and Poles created their own systems of mutual assis-
tance in the camps where they were in large numbers (Appelbaum 2003: 380). Health researchers
have argued that the quality of social attachments affects health through its impact on the immune
and neuroendocrine systems (e.g. Berkman 1995). Civil War diaries indicate that friends in POW
camps provided the moral support necessary to avoid depression, provided extra food or clothing
through trade of valuables or from work on prison detail such as the bakery, ensured that none
strayed too close to the “dead line,” protected against the predations of other prisoners, and tended
to the sick. John Ransom (1963: 93) wrote in his Andersonville diary,“I have always been blessed
with friends, and friends too, of the right sort.”
This paper contributes to the growing empirical literature on the benefits of participating in a
social network. Many network papers focus on information acquisition. Social networks are impor-
tant sources of job tips (Ioannides and Loury 2004; Bayer, Ross, and Topa 2005), retirement plan
information (Duflo and Saez 2003), and of other types of assistance. Migrants are drawn to desti-
nations where their peers previously moved (Munshi 2003; Moretti 1999; Costa and Kahn 2004b).
Networks may be an important determinant of government program participation (Bertrand, Mul-
lainathan, and Luttmer 2000; Aizer and Currie 2004). Like these papers, we examine how the
quantity and quality of social networks affects outcome indicators. A distinguishing feature of our
2

study is that our outcome measure, death, represents “higher stakes” than the outcome measures
in these other studies. Another distinguishing feature of our study is that our setting is one of
unusually high stress. In such a setting, friends may be particularly valuable because there are no
market substitutes but they could also be less valuable because in an environment where infectious
disease is rampant they can offer little protection.
2 Confederate POW Camps
An estimated 211,411 Union soldiers were captured during the Civil War. 16,668 were never
imprisoned because they were paroled on the field, but of the remaining 194,743 men, 30,218 died
while in captivity (Rhodes 1904: 507). Thus, 7 percent of all U.S. soldiers were ever imprisoned
compared to figures of 0.8 percent for World War II and 0.1 percent for Korea.2 Until mid-1863
many POWs were exchanged immediately. Prisoner exchanges stopped as the two sides argued
over the terms (particularly the treatment of black soldiers and their white officers). General Grant
opposed re-establishing a system of exchange, stating, “If we commence a system of exchange
which liberates all prisoners taken, we will have to fight on until the whole South is exterminated.”3
Forty-three percent of the men in the longitudinal sample that we use were captured July 1863 or
later. The mean number of days spent in prison until death or release for men who were captured
prior to mid-1863 was 20 whereas it was 92 for men who were captured after mid-1863.
Men who were captured after mid-1863 faced ever worsening conditions as the crowds of
prisoners increased.4 In our longitudinal data only 4 percent of the men captured before July of
1863 died in captivity whereas 27 percent of those captured July 1863 or later died in captivity.
2Estimated from the figures in U.S. Department of Veterans Affairs (2004) and fromhttp://www.cwc.lsu.edu/cwc/other/stats/warcost.htm.
3See United States War Department (1880-1901), Series II, Vol. VII, p. 607.4Northern complaints about Southern prisons began in 1862. For example, on February, 22 1862 Harper’s reported
that “The condition of our soldiers ... is indeed fearful ... covered with vermin, ... half-starved and nearly naked ...”See http://www.sonofthesouth.net/leefoundation/the-civil-war.htm.
3

(In contrast, the total wartime mortality rate was 14 percent.) Men suffered from poor and meager
rations, from contaminated water, from grounds covered with human excrement and with other
filth, from a want of shoes, clothing, and blankets (having often been stripped of these by needy
Confederate soldiers), from a lack of shelter in the open stockades that constituted camps such
as Andersonville and Millen, from the risk of being robbed and murdered by fellow prisoners,
and from trigger-happy guards. John Ransom recounted in his diary that when taken prisoner he
weighed 178 pounds and when he left Andersonville suffering from scurvy and dropsy he weighed
only 95 pounds (Ransom 1963:142).
Conditions across prisons varied widely and within prisons varied widely across time. Ander-
sonville which with a maximum capacity of 10,000 men held at one point 32,899 men was the
most notorious (Speer 1997: 332). The chief causes of death were scurvy, diarrhea, and dysen-
tery. Scorbutic ulcers became gangrenous.5 In contrast to Andersonville, prisoners at Savannah,
for example, received better and more plentiful rations. However, at camps such as Florence and
Salisbury, food was scarce and the monthly death rates rivaled those at Andersonville. Florence
became notorious for the number of cases of gangrene, brought on by frostbite, that led men to cut
off their own putrefying limbs with pocket knives (Speer 1997: 276).
Captured men were transferred to a prison by rail, tightly packed in cattle cars, with the choice
of prison camp determined largely by time and place of capture. Prisoners were subsequently trans-
ferred, 400 to 700 per day, when the Union Army threatened a location (Hesseltine 1930; Speer
1997). In 1863 the majority of prisoners were held at Richmond but prisoners were rapidly moved
out of Richmond in February and March of 1864 in response to prison escapes to nearby Union
lines and to a (failed) Union raid to free prisoners. Andersonville was emptied of men in Septem-
ber of 1864 when Sherman’s army threatened. Prisoners were then moved to Charleston, Florence
(SC), Millen (GA), and Savannah, among others. When a November raid by Sherman forced the
5Testimony from the trial of Captain Wirtz, reprinted in Ransom (1963).
4

abandonment of the prison at Millen, prisoners were sent to Blackshear and Thomasville, GA.
The choice of prison appears to have largely depended upon when the prisoners were moved; for
example, prisoners could not be sent to Millen until the stockade had been constructed (Hesseline
1930).
Once within a prison camp, the prisoners were responsible for scavenging their own living
quarters and at Andersonville for policing themselves.6 Officers, except those commanding colored
troops, received preferential treatment and were either kept in separate quarters within the same
prison or in prisons reserved for officers (Speer 1997: 58).
3 Survival and Social Networks
A prisoner’s objective is to survive a POW camp. His survival probability, S, is a function of his
consumption, C, and of the disease environment, D,
S = f(C, D) . (1)
Consumption in turn is a function of individual characteristics (I) such as initial health endowment,
human capital, and physical capital; the social network (N); macro camp conditions (M), and
random shocks, ε1. The disease environment is a function of macro camp conditions, of the social
network because of local contagion effects, and of random shocks, ε2.
C = g(I, N, M, ε1) (2)
D = h(N, M, ε2) . (3)
6Although for the purpose of issuing rations and for roll calls within the camps newcomers were divided intosquads (generally 100 men but 270 men at Andersonville) which in turn were subdivided into messes (generally 20but 90 at Andersonville), units of friends were not necessarily in the same squad or mess (Hesseltine 1930: 137, 161;McElroy 1957: 249-50).
5
Unlike the typical producer who has access to input markets, each POW cannot purchase the inputs
necessary for survival. He has no control over camp conditions and his individual characteristics
are given.
This paper’s primary focus is on the effect of N on survival probabilities. Social networks have
both costs and benefits, i.e. ∂S∂N
could be either positive or negative. We expect both the number
of men in a network and the strength of their ties to each other, the “quality” of the network, to
affect mortality. A group member could benefit from the extra food or clothing that his friends
could provide, from the care his friends provided when he was sick, from moral support, and from
protection against other prisoners. But, his close physical proximity to the men in his network
would increase the risk of disease transmission.
Upon entering a camp, a man could either have as his social network men he already knows
such as those from the same company, regiment, or hometown or he could form new social net-
works. Because of the costs of learning about new people, we expect that the men he already
knows would be the default network. Since a POW has relatively little choice over his community,
this reduces selection problems inherent in estimating neighborhood effects (Durlauf 2004). In the
next section, we will discuss the impact of unobserved network formation on the estimates.
The theoretical literature has advanced several hypotheses concerning who forms cohesive
groups. Social identity theory predicts that a prisoner would know those of his own kind (e.g.
members of the same ethnic group or same town) best because individual utility depends upon
being in a group with members of own’s own type (Alesina and La Ferrara 2000; Akerlof and
Kranton 2000, 2005). One’s own kind would be more likely to inspire trust and altruism and to
spur group members to exert greater efforts on each others’ behalf. McElroy (1957: 81-82) de-
scribed how at Andersonville the POWs “were strangers to each other and distrustful of all outside
their own little circles,” sticking with comrades from the same state or group of states. They also
formed their own ethnic ghettos (Marvel 1994: 111).
6

Even with no preference for one’s own type, it may be optimal to transact with members of
one’s own kind when there are market imperfections (Greif 1993). Contracts in POW camps could
not be legally enforced. Intertemporal trade, not just of valuables but also of care in sickness,
could be possible within a group because the group would have full information on its members
and could impose sanctions on violaters (Ellickson 1991; Dixit 2004). In addition, if the group
existed in civilian life, a prisoner would be concerned about reputation effects once he returned
home. Of course, once “Nearly all of us had given up all hopes of being exchanged or seeing our
homes again ... everyone was for himself regardless of consequences ...” (Sneden 2000: 229).7
Although the costs of getting to know new people, tastes, and strategic considerations would
lead prisoners to turn to their own kind, a successful group might need members with complemen-
tary skills in production (Alesina, Spolaore, and Wacziarg 2000). A group with a good trader, a
good gambler, and a good baker who could steal food from his prison detail might be more suc-
cessful than a group of good farmers. Physical capital would also matter. Sneeden (2000: 222)
described how he took a new “chum” into his Andersonville shanty who because he had “two poles
and two pieces of board, with a blanket and two half canteens and knife for cutting large sticks,
made it quite an object for me to have to share my shanty.” But, there is a tradeoff between the
benefits of heterogeneous skills in production and the costs that arise from difficulties in communi-
cations or in agreement on basic behavioral norms (Lazear 1999a,b). McElroy (1957: 82) reported
that at Andersonville because the men from Ohio, Indiana, Illinois, Iowa, and Kansas “spoke the
same dialect, read the same newspapers, had studied McGuffey’s Readers, Mitchell’s Geography
and Ray’s Arithmetics at school, admired the same great men and generally held the same opinions
on any given subject, [i]t was never difficult to get them to act in unison. They did it spontaneously,
while it required an effort to bring about harmony of action with those of other sections.”
7The expectation that group interactions in a POW camp are not an infinitely repeated game implies that reciprocitybetween strangers is unlikely.
7

4 Trade and Survival Within a POW Camp
Trade in POW camps is commonplace (e.g. Radford 1945) and Civil War POW camps were no
exception. Men bartered and traded with each other and with guards to obtain food, clothing, shoes,
blankets, sticks of wood, and tools for greenbacks, metal buttons, valuables, or even preferred real-
estate in the camp. Men too sick to consume their cornmeal rations would trade them for soup
and men would trade their rations for services such as haircuts or shaves (Ransom 1963; McElroy
1957).
Could men ”buy” a friend? As shown in Equations 1 and 2, own consumption and networks
are substitutes in determining survival. If there were no market in friends, perhaps because of lack
of trust between stangers or the inability to credibly punish those who betray their new friends,
then the default network of men who already know each other correctly measures a network’s size.
Suppose, however, that a POW could trade consumption to purchase a larger network. (While a
POW might not literally purchase a friend he could purchase a bodyguard.) A POW who enters
a camp with no friends might have to sacrifice consumption to buy a friend whereas a POW who
enters a camp with friends has a much larger initial endowment. This endowment acts as an income
effect. If friends have a causal effect on survival, then men who enter with no friends will sacrifice
the most energy and consumption to make friends. In equilibrium, there could be few actual
differences in network sizes between those who entered the camp with a network and those who
purchased a network, but we would expect the former to have a greater life expectancy because the
income effect allows them to eat more.
5 Data and Empirical Framework
We use both longitudinal data on Union Army soldiers and cross-sectional data on the population
of Andersonville to investigate the role of friends in ensuring survival. Our longitudinal data allow
8

us to sample from multiple prisons at different points in time and provide a rich set of covariates
that permit us to examine many of the observable dimensions of herogeneity in who enters a POW
camp, what shape a soldier was in when he entered a POW camp, and how a soldier reacted to
camp life. These longitudinal data consist of a full sample of all men within 303 randomly chosen
companies (with roughly 100 men in each company).8 Complete military records are available for
these men and these provide information on wartime service and on demographic and socioeco-
nomic characteristics at enlistment. The data are also linked to the 1860 census which provides
additional information on demographic and socioeconomic characteristics. Within these data we
have 3,175 cases of captivity with known dates of capture and of release or death for 3,040 men.9
We know which prison a man entered and on what date, whether he survived or whether he died,
and how many men from his company were in the prison with him on any given day. In our anal-
ysis we exclude one company (Company I of the 16th Illinois regiment) as an outlier, leaving us
with 3026 cases of captivity for 2972 men.10 We are not assuming that POWs are a random subset
of soldiers. If a subset of men “fight to the death” we would never see them in a POW camp. Thus,
we are less likely to sample the most ideological men.
We use the longitudinal data to estimate a hazard model of days until death, censoring on
release from captivity.11 That is, we estimate an exponential hazard function such that the hazard
at time t is
h(t) = exp(β1F + β2I + β3COD + β4CC) (4)
where F is the number of friends (defined as members of the same company in the same camp in
8The data are available at http://www.cpe.uchicago.edu and were collected by a team of researchers led by RobertFogel.
9Because of the system of prisoner exchange (and the hope that it would be revived), the South had an incentive torecord information on men who were captured.
10This company was not an outlier in terms of other observable characteristics.11We use an exponential hazard model because when we used a Weibull hazard we found that the hazard was
constant.
9

the same month) and the remaining control variables are a vector of individual characteristics (I),
the fraction of friends who died in the previous month (COD), and an indicator of camp conditions
(CC). The variables F, COD, and CC vary by month. The number of friends could either reduce
(β1 < 0) or increase mortality rates (β1 > 0) because although friends provide assistance, they
are also sources of local contagion, particularly since men slept huddled together for warmth. We
control for this using the fraction of friends who died during the previous month. As a measure of
camp conditions we will primarily be using camp and month dummies.12 However, we can also
proxy for camp congestion (macro contagion) by using the number of prisoners in camp in each
month for a subset of the data.
Using the longitudinal data, we cannot observe idiosyncratic networks outside of the company.
Men who are in a POW camp with no one else from the same company have the greatest incentive
to seek out new friends. Since observed friends, F, is likely to be negatively correlated with unob-
served ”new” friends our estimate of β1 in Equation 4 probably underestimates the true effect of
friends on survival probabilities if there are decreasing returns to friends and if it is not possible to
buy a friend.
We interpret the estimate of β1 in Equation 4 as reflecting both exogenous and endogeneous
social interactions (Manski 1993; Moffitt 2001). A POW may become depressed if all of his friends
die (an endogenous social interaction). The characteristics of his friends (e.g. their skills or other
endowments) could also affect his survival probabilities (an exogenous social interaction).
Our first estimation strategy initially assumes that the number of friends is uncorrelated with
a POW’s unobserved health or with his will to live. We can control for a rich set of pre-war
covariates and also for war experience prior to entering the camp. We control for company death
rates prior to capture as a measure of hardships endured prior to capture. Individual characteristics
that we control for include age, whether or not the soldier was wounded 10 days before capture,
12Unfortunately climate data are unavailable because weather stations in the south were shut during the Civil War.
10

whether the soldier enlisted in a large city (a measure of prior disease exposure), the soldier’s
occupation at enlistment since artisans and professionals may have had skills that were either
marketable in the camp or that were needed by the Confederacy, his family income (a soldier
who could hide money or other valuables could buy food and clothing from the guards or from
other prisoners), and his height, both an indicator of his health during his growing years and of
his caloric needs while in the POW camp. In Section 5 we will examine how the observable
characteristics of POWs with many friends differed from those with few friends. We will also
later discuss instrumental variables results where we use prison transfers as one plausible source
of exogenous within company variation in friend counts at a particular prison.
What is novel and unusual about our mortality specification is examining the impact of friends;
unfortunately, our longitudinal sample is too small to examine the effect of the quality of the
network (e.g. how close individuals are to each other) on survivorship and our longitudinal data do
not allow us to examine networks outside of the company. However, we can augment our analysis
with cross-sectional data on the single largest POW camp – Andersonville, which held roughly 17
percent of all men who were ever POWs.
The National Park Service’s Andersonville database contains 35,323 men and was drawn from
such disparate sources as the lists of the dead and published state muster rolls. While the sam-
ple does not cover the entire population of Andersonville (and probably never can given the lack
of complete records), it comes close. An estimated 45,000 men passed through Andersonville
(United States War Department (1880-1901), Series II, Vol. VIII, p. 789). The data provide infor-
mation on the soldier’s name, rank, regiment, and company. We collected company information
for 3,110 of the men from the National Park Service’s on-line Soldiers and Sailors system, giv-
ing us a total of 31,688 men with complete company information in 1,570 regiments and 7,451
companies. We inferred ethnicity from the soldier’s last name and infer town or county of origin
from where the regiment was organized. (Details are available in the data Appendix.) For ease of
11

comparability with the longitudinal data, we exclude two companies in the Andersonville data as
outliers and mainly focus on regression results in which the number of friends is entered as a linear
term. However, we also show the non-linearities that arise when we include these two companies.
The two excluded companies in the Andersonville data were from two regiments of Massachusetts
Heavey Artillery and were part of the “Plymouth Pilgrims” (so called because they were guarding
Plymouth, SC). The entire companies were captured and suffered unusually high mortality. Ac-
cording to McElroy (1954: 41), “They gave up the moment the gates were closed upon them and
began pining away.”13
The Andersonville data provide us with a rich set of social network measures. We use as mea-
sures of social networks the number of men in the company, the number of men in the regiment, the
number of men of the same ethnicity in the company, the number of men with the same last name
in the regiment (a measure of kinship), and the fraction of men in the same company with a rank
of sergeant or higher (a measure of how well the company’s command structure was preserved).
We use the cross-sectional Andersonville data to estimate a probit model of the probability
of death as a function of the number of friends and of demographic characteristics. That is, we
estimate the probability of death, D, as
Pr(D = 1) = Φ(β1F + β2I) (5)
where F is a vector of the number of friends and I is a vector of individual characteristics. We
examine the quality of the network by running regressions of the form
Pr(D = 1) = Φ(β1Fi + β2Fij + β3I|ethnicity = j) (6)
These static regressions underestimate the effect of friends on mortality rates because we can only
13These two companies were captured in April of 1864. The proportion of company that had died by the end ofJuly, August, and September was 9, 25, and 38 percent respectively, for a total mortality rate of 48 percent.
12

observe the total number of friends who were ever in the camp, but the network varies over time.
By using the total number of friends who were ever in the camp we are using a measure of the
maximum possible number of friends.14
6 POW Characteristics
Our longitudinal data allow us to examine heterogeneity in who became a POW. Table 1 shows
that men who were POWs were more likely to be volunteers, to have enlisted earlier (1862), to
be slightly better off, and to be from companies that experienced higher death rates, as might be
expected from men who were captured in the field. When we run a probit in which the dependent
variable is POW status and the independent variables are individual economic and demographic
characteristics and the number of men in the company who were ever wounded or who ever died
we find that these two company characteristics were the main predictors of POW status. The
derivative on the number of men in the company who ever died was 0.257 (robust σ =0.257) and
the derivative on the number of men who were ever wounded was 0.139 (robust σ =0.042).
Why did some POWs have many friends and others few? Men who were caught on scouting
missions and men who became lost on the battlefield in the haze and smoke were more likely
to be caught singly whereas those who surrendered were more likely to be caught together (and
the surrender decision would be made by the commanding officers). The largest numbers of men
surrendering together would be the defenders of a fort, not men on the battlefield. Friends would
then be lost to transfers. While we do not know how most men were caught, we can compare those
caught with several friends with those caught with few friends. Table 2 shows that men who had
three or more friends (men from the same company) in the same camp in their first 2 weeks of
14Only in 62 percent of all cases do we observe that two or more men from the same company have the samecapture year and month. A simple numerical example provides some intuition for why we underestimate the effectof friends on mortality. Suppose the true relationship between the probability of death and the number of friends isPr(D = 1) = .8− .01×F . A man with no friends would have an 80 percent chance of dying. Suppose also that menwho really have 5 friends are coded as having 10 friends we will recover a slope of -0.005 rather than -0.01.
13

captivity were more likely to be US-born, came from wealthier households, and were less likely to
have been wounded 10 days before capture (we expect that men who were wounded on the day of
captivity are most likely undernumerated). The companies that these men came from did not differ
in battlefield experience from the companies of men with few friends nor did they differ in terms
of birth place or occupational heterogeneity. When we ran a probit in which the covariates were all
of the characteristics in Table 2, we found that the only statistically significant predictors of having
3 or more friends were being German-born (which decreased the number of friends relative to the
US-born) and age (the young had more friends). We also compared the characteristics of men with
many friends and those with few by capture date. Men who were captured in 1864 or 1865 would
have no hope of a quick exchange. However, even conditioning on capture date we did not find
that there was any difference in company characteristics nor in whether a POW was wounded 10
days before capture between men with 3 or more friends and men with less than 3 friends by a late
capture date.
7 POW Survival Results
7.1 Evidence from Longitudinal Data
The longitudinal data show that the number of friends reduced mortality, with an additional friend
leading to a mortality hazard that is 0.98 times lower (see Table 3 which presents three different
specifications of Equation 4, which differ in their controls for local and camp level contagion
effects and for state fixed effects). As the number of friends increases from 0 to 5 the predicted
probability of death, using the second specification in Table 3, decreases from 0.31 to 0.28 and as
the number of friends increases to 10 the predicted mortality probability falls to 0.26. (The mean
number of friends in each month was 5.6 with a standard deviation of 9.2 and the median was 2.)
Assuming that the value of life circa 1860 was around 152 to 456 thousand 2005 dollars (Costa and
14

Kahn 2004a), the value of a friend was around 900 to 2700 2005 dollars. Even when we included
state of regiment fixed effects in the third specification, the hazard ratio on the number of friends
remained statistically significant at the 1 percent level.
We found that both local and camp level contagion increased mortality. Using the second
specification in Table 3 a one unit increase in the logarithm of the number of men in the camp
increased the mortality hazard 1.5 times and a one unit increase in the fraction of friends dying in
the previous month increased the mortality hazard 5.9 times. An increase in the number of men
from 7500 to 15,000 and then to 30,000, as happened at Andersonville, increased the predicted
probability of death from 0.17 to 0.21 and then to 0.26. As the fraction of friends who died in the
past month rose from 0 to 0.1 and to 0.2 the predicted probability of death rose from 0.15 to 0.17
and then to 0.20. How many friends were needed to compensate for these mortality increases? As
the number of men in the camp rose from 7,500 to 15,000, the number of friends needed to keep
mortality rates constant was 15, far above the median number. As the fraction of friends who died
rose from 0 to 0.05, more than 50 friends were needed to keep mortality rates constant.
The regressions also show that individual characteristics affected survival. A corporal, sergeant,
or officer faced an odds of death that was 0.5 times that of a private; a professional or proprietor
faced an odds of death that was 0.5 to 0.6 times that of a farmer and a laborer faced an odds of
death that was 1.3 to 1.5 times higher than that of a farmer. The US-born and the German-born
were more likely to die than those born in foreign countries other than Germany. Age increased
mortality rates. When we controlled for state fixed effects we found that the tall were more likely
to die. We did not find that company-level stress, as measured by the fraction of the company dying
before captivity mattered. Our other covariates, including wealth, marital status, literacy, whether
or not the soldier was wounded 10 days before capture, and size of city of enlistment, were not
statistically significant predictors of mortality (not shown).
When we use a Weibull rather than an exponential specification, we found no evidence of dura-
15

tion dependence – the survivors did not toughen up and become less likely to die after their initial
time in the POW camps nor did they become weaker and more likely to die after their time in the
camps.15 We found no evidence of individual level heterogeneity when we re-estimated our specifi-
cations modelling unobserved heterogeneity by introducing an unobserved multiplicative effect on
the hazard function. We therefore suspect that in an environment where infectious diseases that are
not immunity dependent are endemic, past experiences may have provided very little protection.
Throughout this section we have assumed that the number of friends is an exogenous variable
and is uncorrelated with the unobserved characteristics of the prisoner. However, we recognize
that within a company the number of friends may merely reflect mortality conditions in the camp
and therefore an individual’s unobserved health.16 Fortunately, we have a set of within company
instruments and are able to estimate an equation similar to the second specification of Table 3
augmented with company specific fixed effects. We instrumented using a control function approach
(Newey, Powell, and Vella 1999) and instrumented for the number of friends in each month with
new transfers into the camp and with a dummy variable equal to one if the POW was transferred.
Newly captured men and previously captured men who were transferred because the Union Army
was threatening a location arguably provide a source of exogenous within company variation in
the number of friends.17
Table 4 shows that the number of friends in a company continues to have a positive and sta-
tistically significant effect on mortality even when we control for company fixed effects and when
we instrument using transfers. When we do not instrument but control for company fixed effects,
we obtain a hazard ratio of 0.98 on the number of friends. When we instrument we find that in
our first stage regression our R2 was greater than 0.5 and in our second stage regression the hazard
15Our results remained unchanged when we split the sample into the exchange and post-exchange periods, suggest-ing that our results are not driven by bias introduced from exchanges cutting short the duration of the sick.
16The number of friends (F) at time t can be written as Ft = (1 − φ)Ft−1 + ΔT where φ is the fraction of friendswho died in the previous month and ΔT is net transfers into the camp.
17We recognize that the characteristics of “friends” who were transferred in may differ from those of friends whowere already there if only those who could walk could be transferred.
16

ratio on the number of friends was 0.89. While this estimate is high, it reflects both the effects of a
bigger network and an income effect if the newly captured entered the camp with better health and
physical capital.
How did friends affect survival? Was it through their provision of food, care, or moral support?
Unfortunately, we cannot tease out the precise causal mechanism because we do not have infor-
mation on the daily consumption of each prisoner. If we had, we could have used full insurance
tests to see if group level consumption growth was a sufficient statistics for individual consumption
growth and we could have tested whether individual consumption was increased to offset health
shocks.
7.2 Cross-Sectional Andersonville Data
A weakness of our longitudinal data is that because it does not provide a census of a POW camp,
we may miss existing networks such as those based on hometown. Fortunately, the Andersonville
data allow us to test a variety of hypotheses concerning how different networks affect survival (see
Table 5). An additional POW from the same regiment reduced a POW’s own mortality probability
by only 0.0004 in a sample where the overall probability of death was 0.41. An additional POW
from the same company reduced a POW’s own mortality by 0.003 and an additional POW of the
same last name within the same regiment, a measure of kinship, lowered mortality by 0.034.18 We
do not find any mortality differences between companies where men were captured together and
companies where they were not captured together, suggesting that friendships with men who were
familiar with camp ways or who had favorable squatters’ rights within the camp were not the main
benefits of friendship.
18We can use the longitudinal data to test our claim that by using the maximum possible number of men who wereever in the camp we are underestimating the effect of friends on mortality. When we run a hazard model of the formgiven in column 1 of Table 3 and instead of using the number of men in the same company in the camp in each monthuse the maximum number of men in the same company in the camp, we obtain a hazard ratio of 0.986 on the numberof friends rather than one of 0.983.
17

The relationship between friends and mortality is non-linear when we include our two outlier
companies (see Table 6). We find that the logarithm of the number of men from the same company
is statistically significant, with a derivative on the coefficient of -0.021 (σ = 0.007). Our results are
robust to including state of origin fixed effects.19 We also find that among men from smaller towns
mortality was lower the greater the number of POWs from the same town. When we restricted the
sample to exclude deaths after September of 1864 and captures prior to October of 1864 because
only the dying may have been left at Andersonville once men were transferred out, our results
remained unchanged. The derivative of the coefficient on the number of men in the company was
-0.003 (σ =0.001) and the derivative of the coefficient on the number of men in the regiment with
the same last name was -0.035 (σ =0.007).
Ethnic similarity between men within the same company reduced mortality, suggesting that the
quality of social networks matters (see Table 7). Among the Irish, the Germans, and the French
(or French Canadian) an additional POW from the same company reduced mortality by roughly
0.002 to 0.003. But, an additional POW in the same regiment who was Irish reduced the mortality
of the Irish by 0.030; an additional POW in the same regiment who was German reduced the
mortality of the Germans by 0.030; and, an additional POW in the same regiment who was French
reduced the mortality of the French by 0.019.20 These results bolster the recent theoretical literature
emphasizing the importance of group loyalty as a determinant of choices and economic outcomes
(Akerlof and Kranton 2000).
We can test for one more indicator of network quality. For each company, we know what share
of men in the camp have the rank of sergeant or higher from the same company. All else equal, a 10
percentage point increase in the fraction of higher ranked men lowers mortality by 1.2 percentage
19When we include regiment fixed effects our coefficient on the number of men in the company falls to -0.0002(σ =0.0004) and our coefficient on the number of men with the same last name falls slightly to -0.0221 (σ =0.0047).When we use the logarithm of the number of men in the company rather than the number of men, we obtain astatistically borderline insignificant coefficient.
20There were too few colored troops at Andersonville to examine their social networks. We found no mortalitydifference between the non-officers of the colored troops and the rest of the Andersonville population.
18

points. We hypothesize that in these companies organizational capital was preserved through the
chain of command. The fraction of sergeants or higher is not a reflection of own officer mortality.
When we restricted the sample to privates we found that the derivative of this coefficient rose to
-0.115 (σ =0.054).21
8 Costs of Social Networks
We have stressed that social networks assisted survival in POW camps because of the care that
friends provided. But, there could be a “dark” side to this care if the most effective groups were
gangs who robbed and murdered their fellow prisoners. Sneden (2000: 235) described the Ander-
sonville Raiders as being “all strong, as they bought food from the sutler and other dealers with
stolen money, or robbed some poor prisoner of his whole stock of food.” Although we cannot ob-
serve how friends assisted survival, we do not observe a decline in deaths in the Andersonville data
after July 11, 1864 when 6 of the Raiders were hanged. One implication of the gangs hypothesis
is that there are increasing returns to friends; in a zero sum game for calories within the camp,
bigger groups could steal from smaller groups. Although we cannot formally test the hypothesis
that relative size matters because we do not have a census of the camp at different points in time,
Table 6 suggests that there are diminishing returns to friends.
Social networks may have imposed costs on their members. One way to survive was to col-
laborate with the enemy. In the extreme case this meant joining the Confederate Army. Sneden
(2000: 190) commented on one recruitment effort that “If any of us had showed any symptoms
of recruiting to the Rebels, he would have been murdered at once by his comrades.” Out of our
21The Andersonville data show that officers had a distinct mortality advantage. According to Marvel (1994: 112),most of the officers in the Andersonville stockade, except for the officers of the few colored troops who were there,“still wore sergeants’ stripes, either because their commissions had arrived at regimental headquarters after they werecaptured or because they had not yet been mustered in.” Other officers were kept in a nearby pen called Castle Reed(Speer 1997: 261). Only one officer in the Andersonville data was listed as being kept at Castle Reed. Those with arank of lieutenant or higher had a death probability that was 0.31 to 0.35 lower than that of privates. Even sergeantsand corporals had a mortality probability that was lower by 0.08 and 0.05, respectively, than that of privates.
19

3175 cases of captivity in the longitudinal data we observe only 17 enlistments in the Confederate
Army (all out of Salisbury). A probit regression that controls for individual characteristics shows
that men who enlisted were more likely to be foreign-born, to be married, to be wealthier, to be
non-farmers, and to have been caught with fewer men. The derivative of the coefficient on number
of comrades originally captured with was -0.00015, (σ =.00001). Given the small numbers these
results can only be suggestive. Also suggestive of friends not always helping survival is that among
the men at Andersonville we find no evidence that the number of friends predicted whether or not
an individual was one of the 140 who escaped.
9 Conclusion
In Civil War camps such as Andersonville starving men were crowded into a space where “[t]here
was hardly any room for all to lie down at night, and to walk a few hundred feet in any direction
would require an hour’s patient threading of the mass of men and tents” (McElroy 1957: 98). “The
dead and dying lie alongside each other” and each day the corpses “piled up near the dead line ...
nearly all naked, black as crows, festering in the hot sun all day, covered with lice and maggots”
until they were “loaded up in the ration wagon like cordwood.” “The ground in the thickest part
settled in the camp is fairly alive and moves with maggots or lice” (Sneden 2000: 229). Such
horrific conditions made a mockery of most survival strategies. In two independent data sets we
found that friends had a statistically significant positive effect on survival probabilities and that the
closer the ties between friends as measured by such identifiers as ethnicity, kinship, and the same
hometown the bigger the effect. Although the impact of friends could not outweigh the effects
of contagion, it is nonetheless striking that even under such duress, friends continued to have a
positive effect on survival probabilities.
20

Data Appendix
Longitudinal Data
Our longitudinal data consist of the POWs in a sample of 35,570 men in 303 companies.22 The
sample of 35,570 represents roughly 1.3 percent of all whites mustered into the Union Army and
8 percent of all regiments that comprised the Union Army and are available as the dataset Aging of
Veterans of the Union Army, Robert W. Fogel, Principal Investigator, http://www.cpe.uchicago.edu.
Ninety-one percent of the sample consists of volunteers, with the remainder evenly divided be-
tween draftees and substitutes. The primary data source that we use consists of men’s military
service records. These records provide such basic information as year of muster, age, birthplace,
and height in inches, and also information on what happened to the soldier during his military ser-
vice. Men were linked to the manuscript schedules of the 1860 census which provides information
on the value of personal property for all individuals in the household and on illiteracy and allows
us to infer marital status. This linkage allows us to determine that the sample is representative of
the Northern population of military age in terms of 1860 real estate and personal property wealth
and in terms of literacy rates.
Dependent Variable
We calculated days from capture until death in captivity. We allowed for censoring by calculating
days from capture until exchange, escape, or release. When day (but not month or year) of death,
exchange, escape, or release is uknown we set it equal to 15.
Independent Variables
22The data are based upon a 100 percent sample of all enlisted men in 331 randomly chosen companies. Our sampleis limited to 303 companies because complete data have not yet been collected on all 331 companies. Among theoriginal 331 companies, New England is under-represented and the Midwest over-represented relative to the armyas a whole. The companies that have not yet been collected are from Indiana and Wisconsin, states that were verycommitted to the Union cause.
21

1. Number of friends. Number of company members in the camp at the same time. Whenthe number of friends is unknown either because the camp is unknown or the dates when thePOW was in the camp are unknown the number of friends is set equal to 0 and a dummyvariable indicating whether or not the number of friends is unknown is set equal to one. Thenumber of friends was more likely to be unknown if the POW was captured before July of1863 – men who were exchanged in the field immediately after capture would never haveseen a POW camp.
2. Number of friends dying in the previous month. The number of friends in the camp dyingin the previous month. If a POW had no friends in the camp in previous month the numberof friends dying in the previous month is set equal to 0 and a dummy variable indicating thatthe variable is unknown is set equal to 1.
3. Log(total number of men in the camp). The logarithm of the total number of men in thecamp by month, as found in United States War Department (1880-1901), Series II. When thetotal number of men in the camp is unknown the variable is set equal to the logarithm of 40and a dummy variable indicating that the total number of men in the camp is unknown is setequal to 1.
4. Fraction company dying before capture. The fraction of the company dying before thePOW’s capture.
5. Camp dummies Eleven camp dummies indicating if the camp was Andersonville, Salisbury,Richmond, Danville, one of the Texas camps, one of the Arkansas, Florida, Mississippi,Louisiana, or Alabama camps, one of the other North Carolina or Georgia camps, Charlestonor Columbia, Florence, one of the Tennessee or other Virginia camps, and other or unknown.
6. Year dummies Dummy variables indicating the year.
7. Month dummies Dummy variables indicating the month.
8. Occupation. Dummy variables indicating whether at enlistment the recruit reported hisoccupation as farmer, artisan, professional or proprietor, or laborer. Farmers’ sons who werenot yet farmers in their own right would generally report themselves as farmers.
9. Birth place Dummy variables indicating whether at enlistment the recruit reported his birthplace as the US, Germany, Ireland, Great Britain, or other.
10. Corporal, sergeant, or officer. A dummy equal to one if the POW’s rank before capturewas corporal, sergeant, or officer.
11. Age at captivity. Age when captured.
12. Height in inches. Height in inches at enlistment preceeding capture.
13. Wounded 10 days before capture. A dummy set equal to one if the POW was wounded 10days before capture.
22

14. Enlisted in large city. A dummy equal to one if the POW enlisted in a city of 50,000 ormore (one of the 13 largest cities in the United States).
15. Married in 1860. This variable is inferred from family member order and age in the 1860census. This variable was set equal to 0 if the recruit was not linked to the 1860 census.
16. Log(total household personal property) in 1860. This variable is the sum of personalproperty wealth of everyone in the recruits’ 1860 household. This variable is set equal to 0is the recruit was not linked to the 1860 census.
17. Missing census information. A dummy equal to one if the recruit was not linked to the1860 census. Linkage rates from the military service records to the 1860 census were 57percent. The main characteristic that predicted linkage failure was foreign birth.
18. Illiterate. This variable is from the 1860 census and provides illiteracy information only forthose age 20 and older.
19. Missing illiteracy information. A dummy equal to one if we do not know whether therecruits was illiterate, either because he was not linked to the 1860 census or because he wasless than age 20 in 1860.
Andersonville Database
We obtained the Andersonville database from the National Park Service. A searchable version of
the database is available on-line as part of the Soldiers and Sailors system at http://www.itd.nps.gov/cwss.
Because company information was missing for some POWs we collected this information for 3,110
men using the soldiers database that is part of the Soldiers and Sailors system. We obtained infor-
mation on what town a regiment was organized in from Dyer (1908).
Dependent Variable
Our dependent variable is a dummy equal to one if the POW died at Andersonville.
Independent Variables
1. Number of men in the regiment. The number of men in the regiment excluding the POW’sown company.
2. Number of men in company. The number of men in the POW’s own company.
23

3. Fraction of company with rank sergeant or higher. The fraction of men in the companywith rank of sergeant or higher.
4. Number of men with same last name in the regiment. The number of men in the regimentwith the same last name. Because regiments were formed locally, we interpret this variableas a measure of kinship.
5. Log(Number of men in camp from same town). The logarithm of the number of men inthe camp from the same town, where same town refers to the town where the regiment wasformed.
6. Dummy if town population < 9552. A dummy equal to one if the regiment was not orga-nized in a town that was not one of the 100 most populous towns.
7. Rank. Dummies indicating if the POW was a private, officer, sergeant, corporal, or otherrank (e.g. support position or musician).
8. Irish, German, French, and Continental surnames. Dummies equal to one if the POW’slast name was an Irish, German, French, or Continental surname. We determined the na-tionality of a surname by looking at the entire 1880 census. We called a surname Irish, forexample, if only individuals born in Ireland and not in other European countries had thatsurname.
9. Year of capture dummies. Year of capture, including year of capture unknown, dummies.
24

References
[1] Aizer, Anna and Janet Currie. 2004. “Networks or Neighborhoods? Correlations in the Use ofPublicly-Funded Maternity Care in California.” Journal of Public Economics. 88(12): 2573-85.
[2] Akerlof, George A. and Rachel E. Kranton. 2000. “Economics and Identity.” Quarterly Jour-nal of Economics. 115(3): 715-53.
[3] Akerlof, George A. and Rachel E. Kranton. 2005. “Identity and the Economics of Organiza-tions.” Journal of Economic Perspectives. 19(1): 9-32.
[4] Alesina, Alberto and Eliana La Ferrara. 2000. “Participation in Heterogeneous Communi-ties.” Quarterly Journal of Economics. 115(3): 847-904.
[5] Alesina, Alberto, Enrico Spolaore, and Romain Wacziarg. 2000. “Economic Integration andPolitical Disintegration.” American Economic Review. 90(4): 1276-96.
[6] Applebaum, Anne. 2003. Gulag: A History. New York: Doubleday.
[7] Bayer, Patrick, Stephen Ross, and Giorgio Topa. 2005. “Place of Work and Place of Resi-dence: Informal Hiring Networks and Labor Market Outcomes.” NBER Working Paper No.11019.
[8] Berkman, Lisa F. 1995. “The Role of Social Relations in Health Promotion.” PsychosomaticMedicine. 57(3): 245-54.
[9] Bertrand, Marianne, Erzo Luttmer, and Sendhil Mullainathan. 2000. “Network Effects andWelfare Culture.” Quarterly Journal of Economics. 115(3): 1019-55.
[10] Costa, Dora L. and Matthew E. Kahn. 2004a. “Changes in the Value of Life, 1940-1980.”Journal of Risk and Uncertainty. 92(2): 159-80.
[11] Costa, Dora L. and Matthew E. Kahn. 2004b. “Forging a New Identity: The Costs and Bene-fits of Diversity in Civil War Combat Units for Black Slaves and Freemen.” NBER WorkingPaper No. 11013.
[12] Dixit, Avinash. 2004. Lawlessness and Economics: Alternative Modes of Governance.Princeton, NJ: Princeton University Press.
[13] Duflo, Esther and Emmanuel Saez. 2003. “The Role of Information and Social Interactionsin Retirement Plan Decisions: Evidence from a Randomized Experiment.” Quarterly Journalof Economics. 118(3): 815-42.
[14] Durlauf, Steven N. 2004. “Neighborhood Effects.” In J.V. Henderson and J.-F. Thisse,Eds., Handbook of Regional and Urban Economics. Vol 4, Economics. Amsterdam: North-Holland.
25

[15] Dyer, Frederick H. 1908. A Compendium of the War of the Rebellion: compiled and arrangedfrom official records of the federal and Confederate armies. Des Moines, Iowa: The DyerPublishing Company.http://www.civilwararchive.com/regim.htm orhttp://www.soldierquest.org/dyers compendium.htm
[16] Eitinger, Leo. 1964. Concentration Camp Survivors in Norway and Israel. Oslo: Univer-sitetsforlaget.
[17] Ellickson, Robert C. 1991. Order without Law: How Neighbors Settle Disputes. Cambridge,MA: Harvard University Press.
[18] Fafchamps, Marcel and Susan Lund. 2003. “Risk-sharing networks in rural Philippines.”Journal of Development Economics. 71(2): 261-87.
[19] Greif, Avner. 1993. “Contract Enforceability and Economic Institutions in Early Trade: TheMaghribi Traders’ Coalition.” American Economic Review. 83(3): 525-48.
[20] Grimard, Franque. 1997. “Household Consumption Smoothing Through Ethnic Ties: Evi-dence from Cote d’Ivoire.” Journal of Development Economics. 53(2): 391-422.
[21] Hesseltine, William Best. 1930. Civil War Prisons: A Study in War Psychology. Columbus,Ohio: The Ohio State University Press.
[22] Ioannides, Yannis M. and Linda Datcher Loury. 2004. “Job Information Networks, Neigh-borhood Effects, and Inequality.” Journal of Economic Literature. 42(4): 1056-93.
[23] Jones, DR. 1979. “What the POWs write about themselves.” In Proceedings of the Twenty-Sixth Annual Conference of Air Force Behavioral Scientists, RA Levy, Ed. Brooks Air ForceBase Texas: USAF School of Aerospace Medical Division.
[24] Lazear, Edward P. 1999a. “Globalization and the Market for Team-Mates.” Economic Jour-nal. 109(454): 15-40.
[25] Lazear, Edward P. 1999b. “Culture and Language.” Journal of Political Economy. Supple-ment. 107(S6): 95-126.
[26] Malkin, Lawrence. 2001. “Prisoners of War.” In Robert Cowley and Geoffrey Parker, Eds.,Reader’s Companion to Military History. Boston-New York: Houghton Mifflin.http://college.hmco.com/history/readerscomp/mil/html/mh 000101 publicationd.htm
[27] Manski, Charles. 1993. “Identification of Endogenous Social Effects: The Reflection Prob-lem.” Review of Economic Studies. 60(July): 531-42.
[28] Marvel, William. 1994. Andersonville: The Last Depot. Chapel Hill and London: The Uni-versity of North Carolina Press.
26

[29] McElroy, John. 1957. This Was Andersonville. New York: McDowell, Obolensky, Inc.
[30] Moffitt, Robert A. 2001. “Policy Interventions, Low-Level Equilibria, and Social Interac-tions.” In Steven Durlauf and Payton Young, Eds., Social Dynamics. Cambridge, MA: MITPress.
[31] Moretti, Enrico. 1999. “Social Migrations and Networks: Italy 1889-1913.” InternationalMigration Review.
[32] Munshi, Kaivan. 2003. “Networks in the Modern Economy: Mexican Migrants in the U.S.Labor Market.” Quarterly Journal of Economics. 118(2): 549-99.
[33] Newey, Whitney K, James L Powell, and Francis Vella. 1999. “Nonparametric Estimation ofTriangular Simultaneous Equations Models.” Econometrica. 67(3): 565-603.
[34] Radford, R.A. 1945. “The Economic Organization of a P.O.W. Camp.” Economica. 12(48):189-201.
[35] Ransom, John. 1963. John Ransoms Andersonville Diary. New York: Berkley Books.
[36] Rhodes, James Ford. 1904. History of the United States of America: From the Compromise of1850 to the McKinley-Bryan Campaign of 1896, Vol. 5, 1864-1866. New York: Macmillan.
[37] Rosenzweig, Mark R. 1988. “Risk, Implicit Contracts and the Family in Rural Areas of LowIncome Countries.” Economic Journal. 98(393): 1148-70.
[38] Schmolling, Paul. 1984. “Human Reactions to the Nazi Concentration Camps: A SummingUp.” Journal of Human Stress. 10(3): 108-20.
[39] Sneden, Robert Knox. 2000. Eye of the Storm. Edited by Charles E. Bryan and Nelson D.Lankford. New York: The Free Press.
[40] Speer, Lonnie R. Portals to Hell: Military Prisons of the Civil War. Mechanicsburg, PA:Stackpole Books.
[41] Townsend, Robert M. 1995. “Consumption Insurance: An Evaluation of Risk-Bearing Sys-tems in Low Income Economies.” Journal of Economic Perspectives. 9(3): 83-102.
[42] United States. Department of Veterans Affairs. Office of Policy. 2004. Former American Pris-oners of War (POWs).http://www.vba.va.gov/bln/21/Benefits/POW/DOCS/POW6-29-04.doc.
[43] United States. War Department. 1880-1901. The War of the Rebellion: a Compilation of theOfficial Records of the Union and Confederate Armies. Washington DC: Government PrintingOffice.http://cdl.library.cornell.edu/moa/browse.monographs/waro.html
27

Table 1: Characteristics of Soldiers by POW and Deserter Status
Died and Never Non-All Never POW POW POW deserter Deserter
US Born 0.745 0.815 0.746 0.743 0.764 0.606Irish 0.087 0.064 0.086 0.102 0.077 0.165German 0.074 0.055 0.075 0.062 0.073 0.083British 0.039 0.025 0.039 0.034 0.035 0.065Other 0.054 0.040 0.055 0.043 0.050 0.080
Artisan 0.200 0.165 0.199 0.212 0.194 0.250Farmer 0.506 0.629 0.505 0.507 0.529 0.328Professional or proprietor 0.075 0.053 0.077 0.061 0.073 0.090Laborer 0.212 0.148 0.212 0.212 0.197 0.326Unknown 0.007 0.005 0.007 0.008 0.007 0.006
Enlisted in 1861 0.210 0.281 0.205 0.263 0.206 0.236Enlisted in 1862 0.344 0.455 0.331 0.487 0.343 0.353Enlisted in 1863 0.068 0.055 0.066 0.087 0.062 0.110Enlisted in 1864 0.256 0.167 0.266 0.147 0.266 0.182Enlisted in 1865 0.122 0.042 0.132 0.009 0.122 0.118
Volunteer 0.909 0.945 0.905 0.951 0.915 0.859Height in Inches 67.600 67.920 67.589 67.708 67.646 67.258Household Property Income in 1860 533.913 496.061 531.468 558.200 541.193 437.905
Company Birthplace Fragmentation 0.642 0.639 0.644 0.620 0.638 0.676Company Occupation Fragmentation 0.559 0.525 0.558 0.570 0.550 0.626Fraction company died as non-POWs 0.133 0.203 0.132 0.156 0.132 0.143
Sample Size 34594 3933 31977 3042 30849 4170
All tabulations are from our longitudinal data. To estimate company birthplace fragmentation, we calculated, bycompany, the fraction of individuals born in the US in New England, in the Middle Atlantic, in the East North Central,in the West North Central, the Border states, the south, and the west and born abroad in Germany, Ireland, Canada,Great Britain, Scandinavia, northwestern Europe (France, Belgium, Luxembourg, the Netherlands), other areas ofEurope, and other areas of the world. Our birthplace fragmentation index, fi, is then
fi = 1 −∑
k
s2ki ,
where k represents the categories and where ski is the share of men of born in place k in company i. To estimatecompany occupational fragmentation, we calculated, by company, the fraction of individuals who were farmers, higherclass professionals and proprietors, lower class professionals and proprietors, artisans, higher class laborers, lowerclass laborers, and unknown. Our occupational fragmentation index is then calculated similarly to our birthplacefragmentation index.
28
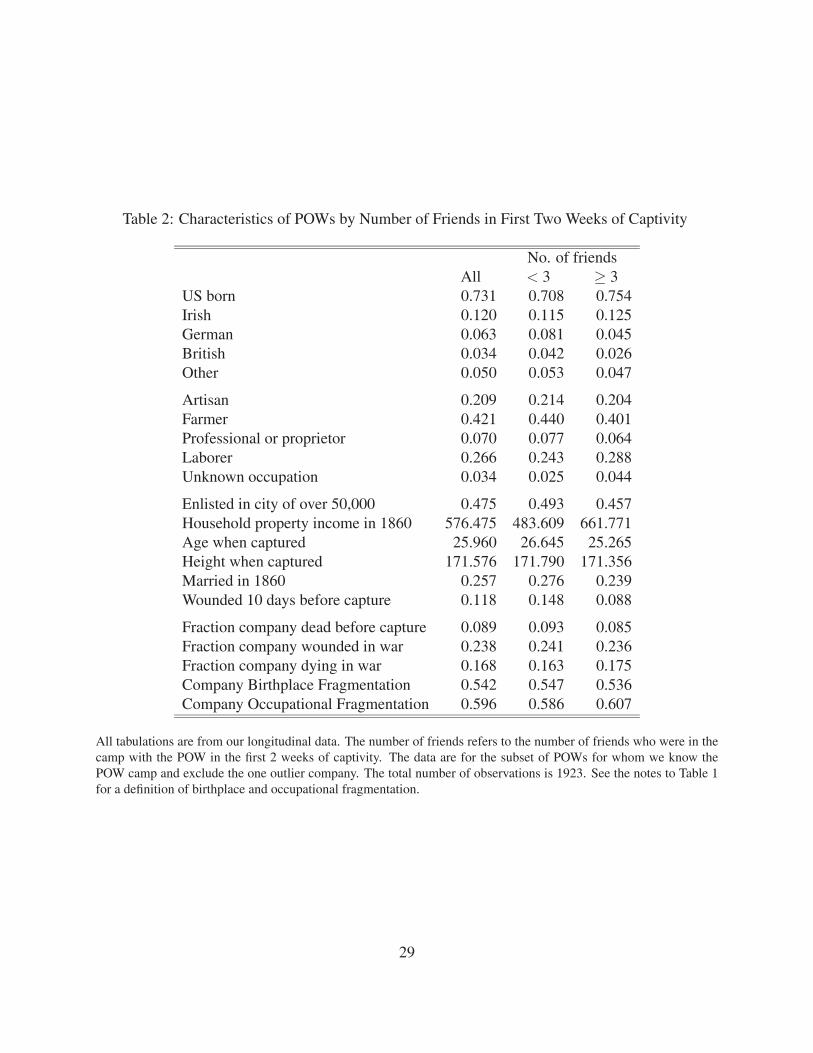
Table 2: Characteristics of POWs by Number of Friends in First Two Weeks of Captivity
No. of friendsAll < 3 ≥ 3
US born 0.731 0.708 0.754Irish 0.120 0.115 0.125German 0.063 0.081 0.045British 0.034 0.042 0.026Other 0.050 0.053 0.047
Artisan 0.209 0.214 0.204Farmer 0.421 0.440 0.401Professional or proprietor 0.070 0.077 0.064Laborer 0.266 0.243 0.288Unknown occupation 0.034 0.025 0.044
Enlisted in city of over 50,000 0.475 0.493 0.457Household property income in 1860 576.475 483.609 661.771Age when captured 25.960 26.645 25.265Height when captured 171.576 171.790 171.356Married in 1860 0.257 0.276 0.239Wounded 10 days before capture 0.118 0.148 0.088
Fraction company dead before capture 0.089 0.093 0.085Fraction company wounded in war 0.238 0.241 0.236Fraction company dying in war 0.168 0.163 0.175Company Birthplace Fragmentation 0.542 0.547 0.536Company Occupational Fragmentation 0.596 0.586 0.607
All tabulations are from our longitudinal data. The number of friends refers to the number of friends who were in thecamp with the POW in the first 2 weeks of captivity. The data are for the subset of POWs for whom we know thePOW camp and exclude the one outlier company. The total number of observations is 1923. See the notes to Table 1for a definition of birthplace and occupational fragmentation.
29

Table 3: Effect of Social Networks, Contagion, and Individual Characteristics on Mortality
(1) (2) (3)Haz. Std. Haz. Std. Haz. Std.Rat. Err. Rat. Err. Rat. Err
Number of friends 0.983† 0.008 0.977‡ 0.009 0.977‡ 0.009Fraction of company dying in previous 6.748‡ 2.893 5.863‡ 2.704
monthLog(total number of men in the camp) 1.512‡ 0.137 1.514‡ 0.138Fraction company dying before capture 1.091 0.782 0.938 0.671 1.268 1.085Dummy=1 if occupation at enlistment
FarmerProfessional or proprietor 0.567† 0.146 0.568† 0.145 0.513‡ 0.133Artisan 0.944 0.119 0.944 0.119 0.860 0.114Laborer 1.298† 0.154 1.282† 0.152 1.146 0.146
Dummy=1 if born inUSGermany 1.197 0.215 1.175 0.214 1.129 0.214Ireland 0.768∗ 0.121 0.761∗ 0.118 0.725† 0.116Great Britain 0.641∗ 0.171 0.662 0.176 0.640∗ 0.173Other foreign country 0.658∗ 0.154 0.623† 0.150 0.584† 0.143
Dummy=1 if sergeant, corporal, or officer 0.549‡ 0.115 0.538‡ 0.111 0.559‡ 0.113Age at captivity 1.045‡ 0.007 1.043‡ 0.007 1.040‡ 0.007Height at enlistment 1.010 0.007 1.011 0.007 1.014† 0.007
State fixed effects? N N YLog pseudolikelihood -1324.607 -1300.909 -1284.888
Estimated from the longitudinal data. The number of friends is the number of men in the company in the samePOW camp in the same month. Additional controls include a dummy equal to one if married, a dummy equal to one ifilliterate, a dummy equal to one if wounded 10 days before captivity, a dummy equal to one if the individual enlisted ina city of 50,000 or more, year dummies, month dummies, 11 camp dummies (including a dummy indicating that campinformation was missing), dummies indicating if rank, occupation, illiteracy information, and deaths in the previousmonth were missing, a dummy indicating if the soldier was not linked to the 1860 census, a dummy indicating if thenumber of friends is unknown, and a dummy indicating if the total number of men in the camp was unknown. Whenthe number of friends is unknown (either because the camp is unknown or because dates are unknown) the number offriends is set equal to 0. When the total number of men in the camp is unknown the value is set equal to 40. When thenumber of deaths in the previous month was missing the value was set to 0 (this includes the cases where the POWhad no friends). 3026 observations. The symbols ‡, †, and ∗ indicate that the hazard ratio differs from 1 at the 1, 5,and 10 percent level of statistical significance.
30

Table 4: Effect of Social Networks on Mortality, with Company Fixed Effects and Instrumented
IV IVHaz. Std. Haz. Std. Haz. Std. Haz. Std.Rat. Err. Rat. Err. Rat. Err. Rat. Err.
Number of friends 0.978∗ 0.012 0.979∗ 0.012 0.895† 0.055 0.885† 0.066Fraction of company dying in previous month 1.534 0.776 0.939 0.781Log(total number of men in the camp) 1.437‡ 0.122 1.436‡ 0.123 1.537‡ 0.196 1.547‡ 0.198Residual 1.106† 0.071 1.120† 0.088
The instruments are time-varying and are a dummy for whether the soldier was transferred and the count of men in hiscompany transferred into the camp. All regressions contain company fixed effects and all of the variables used in thesecond specification in Table 3 with the exception that instead of the full set of camp dummies only an Andersonvilledummy is used. The number of friends is the number of friends in the same POW camp in the same month. Theregressions exclude observations where the number of friends is unknown because the camp is unknown or becausedates within the camp are unknown. The total number of cases of captivity is 1824. We report bootstrap standarderrors for the IV regressions. The symbols ‡, †, and ∗ indicate that the hazard ratio differs from 1 at the 1, 5, and 10percent level of statistical significance.
31

Table 5: Effect of Social Networks on Probability of Death
From Small TownMean ∂P
∂x∂P∂x
∂P∂x
∂P∂x
∂P∂x
Number of men in regiment 9.157 -0.004‡
÷ 10 (10.358) -(0.001)Number of men in company 12.899 -0.003‡ -0.002‡ -0.003‡ -0.002‡
(15.390) (0.001) (0.001) (0.001) (0.001)Fraction of company with rank 0.073 -0.120‡ -0.128‡ -0.079‡ -0.152∗ -0.085
sergeant or higher (0.034) (0.034) (0.032) (0.061) (0.056)Number of men with same last 1.190 -0.033‡ -0.033‡ -0.036‡ -0.018† -0.023‡
name in regiment (0.599) (0.007) (0.007) (0.006) (0.009) (0.009)log(Number of men in camp from 5.101 0.003 0.002 0.000 -0.018† -0.026‡
same town) (1.994) (0.005) (0.005) (0.005) (0.009) (0.008)Dummy=1 if
Town population < 9552 0.423 -0.037‡ -0.034‡ -0.032‡
(0.014) (0.014) (0.013)Private 0.824Officer 0.003 -0.347‡ -0.347‡ -0.354‡ -0.311‡ -0.328‡
(0.027) (0.027) (0.021) (0.038) (0.025)Sergeant 0.068 -0.080‡ -0.080‡ -0.083‡ -0.084‡ -0.088‡
(0.011) (0.011) (0.011) (0.017) (0.018)Corporal 0.078 -0.055‡ -0.055‡ -0.046‡ -0.064‡ -0.054‡
(0.011) (0.011) (0.011) (0.017) (0.018)Other rank 0.010 -0.028 -0.034 -0.030 -0.067 -0.046
(0.030) (0.030) (0.030) (0.049) (0.050)Irish surname 0.023 -0.020 -0.022 -0.017 -0.069† -0.059∗
(0.019) (0.019) (0.019) (0.030) (0.030)German surname 0.043 0.009 0.009∗ 0.016 0.001 0.025
(0.015) (0.015) (0.015) (0.024) (0.025)French surname 0.028 -0.028 -0.028 -0.028 -0.033 -0.032
(0.017) (0.017) (0.017) (0.027) (0.028)Continental surname 0.029 -0.006 -0.007 0.004 0.021 0.029
(0.018) (0.018) (0.018) (0.032) (0.032)State fixed effects? N N Y N YPseudo R2 0.043 0.044 0.087 0.048 0.115Observations 31,336 31,336 31,336 31,330 12,002 12,002
Estimated from the Andersonville data. Additional control variables include year of capture dummies, a dummyvariable indicating whether the regiment’s town of formation was unknown and a dummy variable indicating whetheryear of capture was unknown. Standard errors, clustered on the company, in parentheses. The symbols ‡, †, and ∗indicate that the coefficient is different from 0 at the 1, 5, and 10 percent level of statistical significance. A smalltown is defined as one of less than 9,552 persons and one that excludes the large military camps in Springfield, IL andReadville, MA.
32

Table 6: Effect of Social Networks on Probability of Death, Logarithmic Form
From Small TownMean ∂P
∂x∂P∂x
∂P∂x
∂P∂x
∂P∂x
Log(Number of men in regiment) 3.865 -0.011†
(1.290) (0.005)Log(Number of men in company) 2.052 -0.019‡ -0.010∗ -0.028† -0.020†
(1.180) (0.007) (0.006) (0.012) (0.009)Fraction of company with rank 0.072 -0.133‡ -0.132‡ -0.078† -0.151‡ -0.078
sergeant or higher (0.035) (0.034) (0.032) (0.061) (0.056)Log(Number of men with same last 0.113 -0.101‡ -0.095‡ -0.096‡ -0.061‡ -0.063‡
name in regiment) (0.305) (0.012) (0.012) (0.011) (0.018) (0.017)log(Number of men in camp from 5.114 -0.003 -0.000 -0.003 -0.024‡ -0.031‡
same town) (1.991) (0.005) (0.005) (0.005) (0.009) (0.008)
State fixed effects? N N Y N YPseudo R2 0.039 0.040 0.084 0.044 0.113Observations 31,678 31,678 31,678 31,678 12,025 12,025
Estimated from the Andersonville data. The same control variables are used as in Table 5. That is, additional controlvariables include a dummy equal to one if the town population is less than 9552, rank dummies, ethnicity dummies,year of capture dummies, a dummy variable indicating whether the regiment’s town of formation was unknown anda dummy variable indicating whether year of capture was unknown. Standard errors, clustered on the company, inparentheses. The symbols ‡, †, and ∗ indicate that the coefficient is different from 0 at the 1, 5, and 10 percent levelof statistical significance. A small town is defined as one of less than 9,552 persons and one that excludes the largemilitary camps in Springfield, IL and Readville, MA.
33

Table 7: Effect of Ethnic Networks on Probability of Death
Irish German FrenchStd Std Std
∂P∂x
Err ∂P∂x
Err ∂P∂x
ErrNo. of men in company -0.003† 0.002 -0.003† 0.001 -0.002 0.002No. of men of own ethnicity -0.030 0.036 -0.030† 0.013 -0.019 0.026
in companyDummy=1 if
Private 0.046 0.049 0.078† 0.037 0.093† 0.043From small town -0.100‡ 0.040 -0.036 0.031 -0.054 0.036Captured 1864 or 1865 -0.239‡ 0.077 -0.282‡ 0.049 -0.388 0.058
Pseudo R2 0.036 0.059 0.058χ2(2) test for joint significance ofNo. of men in company and No. ofmen of own ethnicity 8.60 22.01 3.20Observations 735 1355 869
Estimated from the Andersonville data. The regressions include a dummy indicating if capture date was unknown.The symbols ‡, †, and ∗ indicate that the coefficient is different from 0 at the 1, 5, and 10 percent level of statisticalsignificance. Standard errors are clustered on the company.
34