nber working paper series do minimum … working paper series do minimum wages affect non-wage job...
TRANSCRIPT
NBER WORKING PAPER SERIES
DO MINIMUM WAGES AFFECTNON-WAGE JOB ATTRIBUTES?
EVIDENCE ON FRINGE BENEFITSAND WORKING CONDITIONS
Kosali Ilayperuma SimonRobert Kaestner
Working Paper 9688http://www.nber.org/papers/w9688
NATIONAL BUREAU OF ECONOMIC RESEARCH1050 Massachusetts Avenue
Cambridge, MA 02138May 2003
The views expressed herein are those of the authors and not necessarily those of the National Bureau ofEconomic Research.
©2003 by Kosali Ilayperuma Simon and Robert Kaestner. All rights reserved. Short sections of text not toexceed two paragraphs, may be quoted without explicit permission provided that full credit including©notice, is given to the source.
Do Minimum Wages Affect Non-wage Job Attributes? Evidence on Fringe Benefits andWorking ConditionsKosali Ilayperuma Simon and Robert KaestnerNBER Working Paper No. 9688May 2003JEL No. I1, J3
ABSTRACT
Neoclassical labor market theories imply that employers will react to binding minimum wages bychanging the level of employment. A multitude of studies consider this aspect of minimum wages,yet fail to reach a consensus as to its employment effects. While the employment effects of theminimum wage are certainly important, the empirical literature has not adequately explored thepossibility that employers may also adjust non-wage components of the job such as fringe benefits,job safety, and access to training opportunities. We study the effect of minimum wage legislationon fringe benefits (employer provision of health insurance, pension coverage, dental insurance,vacation pay, and training/educational benefits) and working conditions (shift work, irregular shifts,and workplace safety) during the period 1979 to 2000 using the National Longitudinal Survey ofYouth and the Current Population Survey. We examine effects of state and federal variation in theminimum wages on groups likely to be affected by the minimum wage. These effects are comparedto estimates found for groups unlikely to be affected by minimum wages. Our results indicate nodiscernible effect of the minimum wage on fringe benefit generosity for low-skilled workers. Thisconclusion is unchanged whether we use only state level variation or federal and state variation inminimum wages.
Kosali Ilayperuma Simon Robert KaestnerDepartment of Policy Analysis and Management Institute of Government and Public Affairs 106 MVR Hall University of Illinois at Chicago Cornell University 815 West Van Buren Street, Suite 525 Ithaca, NY 14853-4401 Chicago, Illinois 60607 and NBER and [email protected] [email protected]
1
Introduction
The minimum wage is a perennial issue on the agendas of federal and state policy makers. Its popularity
among politicians stems from the public’s overwhelming support for such a policy. Polls taken by ABC News and
the Los Angeles Times in 1999 report that over 80 percent of Americans support an increase in the minimum wage.
Moreover, increasing the minimum wage does not require any direct government outlays. What then keeps the
debate over the minimum wage simmering? The primary point of contention is whether or not an increase in the
minimum wage will adversely affect the employment of low-skilled workers—those it aims to help. Proponents of
a minimum wage increase cite studies showing that past increases in the minimum wage had little effect on the
employment of low-wage workers, and in fact may have led to a small increase in employment.1 Critics of the
policy point to other studies that show adverse employment effects, and suggest that other tools such as the Earned
Income Tax Credit may be preferable methods of helping the working poor.2 Although there have been some
attempts to reconcile the two strands of evidence, the controversy persists and research efforts continue to focus on
the employment effects of the minimum wage.3
While the employment effects of the minimum wage are certainly important, the empirical literature has
not adequately explored other potentially important effects—for example, the effects of a minimum wage on non-
monetary attributes of employment such as fringe benefits, job safety, and access to training opportunities. To the
extent that employers can change non-wage compensation and working conditions for low-wage workers,
adjustments of this type would take some of the bite out of minimum wage increases and weaken the effect of
minimum wages on employment.4 Non-wage compensation accounts for 25 percent of total compensation, with 15
percent being voluntary compensation (Pierce 2001). To the extent that non-wage compensation is voluntary and
flexible, it can compensate for regulation-induced changes in wage compensation.
The purpose of this study is to provide evidence of the direct effect of minimum wages on fringe benefits
and job characteristics. We undertake a comprehensive analysis using two complementary data sets. First, using
1 Typically included in such lists are the studies by Card (1992a, 1992b), Card and Krueger (1994), Katz and Krueger (1992), Machin and Manning (1994), and Bernstein and Schmitt (1998). 2 Recent studies showing adverse employment effects include Neumark and Wascher (1992), Deere, Murphy and Welch (1995), Baker, Benjamin and Stanger (1999), Abowd, Kramarz, Margolis (1999) and Burkhauser, Couch and Wittenburg (2000a). See Burkhauser, Couch and Wittenburg (2000b) for a recent review. 3 Studies that attempt to reconcile the findings are Burkhauser et al (2000b), Baker, Benjamin and Stanger (1999), Manning (1995). 4 This point is fully developed by Wessels (1981).
2
data from the National Longitudinal Survey of Youth (NLSY), we study the relationship between state and federal
changes in minimum wages in the early 1980s and early 1990s and employee access to health insurance, dental
insurance, vacation pay and training/educational benefits. We also use the NLSY to examine the effect of
minimum wages on job safety (e.g., incidence of an accident or injury) and the incidence of irregular shift work.
The second analysis uses the Current Population Survey (CPS) to study the effect of minimum wages on the
incidence and generosity of employer health insurance and the incidence of employer pension coverage during the
periods 1979 to 1986 and 1987 to 2000. If minimum wages affect provision of fringe benefits, we can address
whether or not these adjustments can explain the smaller than expected effect of minimum wages on employment
found in some studies. Our analysis of the relationship between minimum wages and fringe benefit provision also
adds to the literature exploring compensating wage differentials for fringe benefits. Variation in wages caused by
changes in minimum wage laws is exogenous to productivity, and therefore provides an excellent opportunity to
examine the effect of wage changes on fringe benefits.
Previous Literature
There are relatively few studies of the effect of minimum wages on fringe benefits and working conditions.
Card and Krueger (1995) review the limited evidence as to the importance of these alternative adjustment
mechanisms and conclude that the evidence is mixed. For example, Mincer and Leighton (1981) and Hashimoto
(1982) find that an increase in the minimum wage significantly reduces on-the-job training, but Lazear and Miller
(1981) find no effect of minimum wages on training. Two recent papers explored this issue further and report
mixed results. Neumark and Wascher (2001) find that minimum wages reduce on-the-job training, but that there is
no commensurate increase in training needed to obtain jobs. Acemoglu and Pischke (1999) find that minimum
wages do not appear to affect training. Similarly, Wessels (1980) and Alpert (1986) report small reductions in
fringe benefits in response to a minimum wage increase in the retail and restaurant industries, respectively, but Card
and Krueger (1994) find that fast food restaurants do not reduce free or reduced price meal benefits. Finally,
Holzer, Katz and Krueger (1991) show that queues (i.e., applicants) for minimum wage jobs are longer than queues
for jobs paying more than the minimum wage, which suggest that rents on minimum wage jobs are not dissipated
by non-wage offsets. In contrast, Sicilian and Grossberg (1994) show that quit rates on minimum wage jobs are
higher than on non-minimum wage jobs. This finding suggests that the rent on minimum wage jobs is more

3
illusory (because of the higher money wage) than real and that non-wage attributes of minimum wage jobs diminish
their appeal.
Besides our study, the only other study that we are aware of that looks at the effect of minimum wages on
health insurance, pensions, and sick leave is by Royalty (2000). She uses data from the Current Population Survey,
Employee Benefits Supplements of 1988 and 1993 and focuses on variation in state minimum wages that occurred
between these two years. She reports that for low-educated workers, minimum wage increases between 1988 and
1993 have a somewhat surprising effect: increases of up to approximately 50 cents (2001 terms) are associated with
statistically significant increases in offers of health insurance and pension benefits, but larger increases in minimum
wages are associated with statistically significant decreases in offers of health and pension benefits. For the range
of state minimum wage variation observed in her sample (between $.02 and $1.00, with values above $.50 only
observed once each for Hawaii, District of Columbia, and New Jersey), most of the predicted results indicate that
an increase in the minimum wage increased the eligibility for fringe benefits. Our research differs from Royalty
(2000) in several ways. First, we use variation in both federal and state minimum wages between 1979 and 2000 to
identify the effect of minimum wages on fringe benefit and working conditions. Second, we use wages, annual
income and education to identify target and comparison groups for our analysis. Third, we use different dependent
variables, specifically whether the benefit is actually received in addition to whether it is offered, and for health
insurance we also use measures of generosity.
The lack of more studies investigating the connection between fringe benefits and minimum wages cannot
be because fringe benefits are not an important component of minimum wage jobs. For example, data from the
National Longitudinal Survey of Youth (NLSY) for the years 1979 to 1982 indicate that among persons between
the ages of 16 and 24, approximately one-third of workers earning near the minimum wage were offered health
insurance by their employer and nearly forty five percent received vacation pay. Data from the Current Population
Survey (CPS) indicate that 44 percent of young (under age 30) high school dropouts observed during 1979-1986
and a quarter of the same population observed during 1987-2000 received employer provided health insurance (see
Table 7). Thus, there is sufficient scope of adjustment of fringe benefits and working conditions to significantly
dull the impact of a minimum wage increase on employment.
4
Hypotheses: effects of minimum wages on benefits
That minimum wages may adversely affect employment levels has long been hypothesized in the
literature, although some doubt was cast upon this theory during the 1990s.5 The effect of minimum wages
on benefits is less clear. A simple example illustrates the possible consequence of a rise in the minimum
wage for low-wage workers. Consider a firm with the following characteristics: it hires only low-skilled
workers from a competitive labor market; it faces a constant price for its output (i.e., no monopoly power);
and it has a production process characterized by diminishing marginal returns to labor. Before the minimum
wage hike, the firm hires workers until the last worker’s marginal revenue product (MRPi) is equal to the
employer’s marginal cost of hiring that worker; the employer’s marginal cost is equal to the wage (Wi) plus
fringe benefits plus other expenses such as marginal workplace safety costs, which we assume to be non-
trivial component of compensation. The imposition of a binding minimum wage (Wm) that is greater than
Wi will cause an imbalance between total compensation and the value of the worker’s productivity.
Employers have two non–mutually exclusive options to re-establish equilibrium. They could reduce
employment until marginal worker productivity is increased by a sufficient amount, or they could reduce the
non-wage part of compensation. Heterogeneity in employers’ costs of adjusting employment vs. fringe
benefits may lead some employers to choose one solution over the other, and so that in aggregate, an
increase in the minimum wage may cause both a change in employment and a change in fringe benefits.
However, several factors limit the ability of employers to adjust benefits. In contrast to the example above,
low-skilled (low-wage) workers are likely to work in firms that also employ high-skilled (high-wage) workers, and
the federal tax code requires employers to provide benefits on a non-discriminating basis in order to maintain the
tax-exempt status of employer contributions to some benefits (e.g., self-insured health insurance), and the deferred
tax treatment of others (almost all employer pensions).6 Thus, these employers are not freely able to adjust health
or pension benefits on an employee-by-employee basis, although there are some exemptions (e.g., on the basis of
5 See Stigler (1946) for the earliest exposition on the employment effects of the minimum wage. 6 According to Collins (1999), “..only self-insured health plans are subject to the non-discrimination rules..” (p.2). The gist of these restrictions is to prevent the within-firm distribution of non-wage benefits from being heavily weighed towards the high-wage workers. See Collins (1999) and Carrington, McCue and Pierce (2001) for more details on the provisions of the federal legislation.

5
age and full-time/part-time status) that allow employers to segment the workforce for purposes of providing
benefits (Carrington, McCue and Pierce, 2001).7
The discussion above assumed a one to one tradeoff between a dollar of health insurance and wages.
However, employers may decide to provide non-wage benefits for other reasons such as reducing turnover.
Employers also may not adjust fringe benefits to changes in minimum wages that they view as only binding in the
short run because of an anticipated rise in prices (i.e., inflation) that will soon cause the nominal wage to be no
longer binding. In this case, employers will not incur the fixed cost of changing fringe benefit decisions. For
example, the change in the federal minimum wage from 3.35 to 3.80 between 1989 and 1990 would have been fully
eroded by inflation in 1992 (had no further legislation occurred). In addition, commercial health insurers that
generally serve the small employer market usually require minimum participation clauses that create an incentive
for the firm to make health insurance affordable for low-wage workers, particularly if they represent a significant
portion of the firm’s employees. Other non-wage aspects of the job, such as workplace safety, may be public goods
that are shared by several types of workers and therefore prevent the employer from making adjustments just for
low-wage workers.8 Benefits such as vacation pay and sick day pay are more flexible in that they are not as likely
to be constrained by the technology of production or tax rules, and can be more readily altered in response to a
minimum wage increase. In sum, the extent to which fringe benefits would react to minimum wage hikes
depends on the minimum wage having a binding effect, fringe benefits comprising a non-trivial portion of
total compensation for low-wage workers, the employer’s ability to differentially adjust benefits for affected
workers, and the employer’s ability to adjust the level of employment.9
Empirical Methods
As discussed above, fringe benefits and working conditions depend on employee characteristics (i.e.,
employee productivity), firm characteristics (e.g., share of minimum wage workers, etc.) and the minimum
7 This suggests that employers may attempt to cut back these fringe benefits by shifting workers from full-time to part-time status if affected by binding minimum wages. We take this possibility into account in our empirical analysis by testing for whether hours worked were affected and find no evidence to support this possibility. 8 However, Hamermesh (1999) finds that the income elasticity of demand workplace safety and shift work are greater than one, indicating flexibility in the determination of these amenities. 9If employers are unable to differentially adjust fringe benefits for low-skilled workers, they are unlikely to instead lower fringe benefits for everyone at the firm (including high-skilled workers), since minimum wage workers are likely to be only a small fraction of the total workforce.

6
wage. Our empirical analysis investigates the hypothesis that binding minimum wages affect non-wage
attributes of the job (FB). We test our hypotheses using the following regression model:
(1)
)(,...,1)(51,...,1
)(,...,1
yearsTtstatesjpersonsNi
MWXFB itjjtijtijt
===
++++Γ+= ετγβα
In equation (1), FB is an indicator of whether or not worker “i” has one of several types of fringe benefits
(e.g., health insurance, paid vacation), MW is the real value of the minimum wage in state “j” in year “t”,
and X is a vector of personal (e.g., age, race, and sex), and in some cases, job (e.g., industry and occupation)
characteristics. Also included in X are controls for macro economic conditions in the state such as the
unemployment rate and the manufacturing wage rate. The regression model also includes controls for
unmeasured state-specific ( jγ ) and year-specific (τ t) effects. We estimate this model by ordinary least
squares.10
Equation (1) identifies the effect of minimum wages on fringe benefits from state-variation in
minimum wages and fringe benefits from year to year. Federal variation in minimum wages is subsumed by
the year effects. Thus, equation (1) assumes that unmeasured factors that vary by state-year are
uncorrelated with minimum wages and/or fringe benefits. To bolster the case for this identification strategy,
we estimate equation (1) for several groups of individuals who differ in their likelihood of being affected by
the minimum wage. We expect the minimum wage to have a larger effect on fringe benefits for the group
most likely affected by it. For example, in our CPS analysis, we divide the sample by education and age,
and estimate equation (1) separately for two groups: persons age 18 to 29 with fewer than 12 years of
education (i.e., high school dropouts); and persons age 20 to 29 with 12 to 15 years of education.11 Those
with fewer than 12 years of education earn relatively low wages and are therefore more likely to be affected
by minimum wages than individuals of the same age but with 12 to 15 years of education. Thus, if we find
any effect, we should find larger effects of the minimum wage among the young, low-educated sample. If
10 We have also estimated models using a logit and the results are consistent with the conclusion of this analysis. The statistical properties of a probit regression using panel data are not well understood. Furthermore, OLS is consistent and easy to interpret.
7
instead we find similarly sized effects across both groups, this would suggest that the coefficient on
minimum wages is capturing unmeasured state-year factors rather than true causal effects.
As an alternative to equation (1), we also estimate models that omit year fixed effects. This allows
us to use variation in federal minimum wages in addition to variation in state minimum wages to identify the
effect of minimum wages on fringe benefits. Recent analyses of the employment effects of minimum wages
(e.g., Burkhauser, Wittenburg and Couch 2000) show that the use of such variation is important and leads to
qualitatively different inferences than relying only on state-level variation. However, omitting year fixed
effects increases the possibility that estimated effects of the minimum wage will be spurious, reflecting the
correlation between unmeasured, time-varying factors and the minimum wage. In these specifications, the
use of state-level macro indicators and comparison groups is particularly important, as these are ways to
control for unmeasured, time-varying factors.
The use of comparison groups—persons unlikely to be affected by the minimum wage—to control
for unmeasured, time-varying determinants of fringe benefits can be incorporated into our analysis in a more
explicit way than that described above. An alternative to estimating equation (1) separately for groups of
individuals who differ in their likelihood of being affected by the minimum wage is to pool these samples as
illustrated in equation (2):
(2)
)(1982,...,1979)(51,...,1
)(,...,1
)*()*( 3210
yearststatesjpersonsNi
vXLowWageLowWageMWHighWageMWFB ijtijtiittjijt
===
+Γ+++++= βββγα
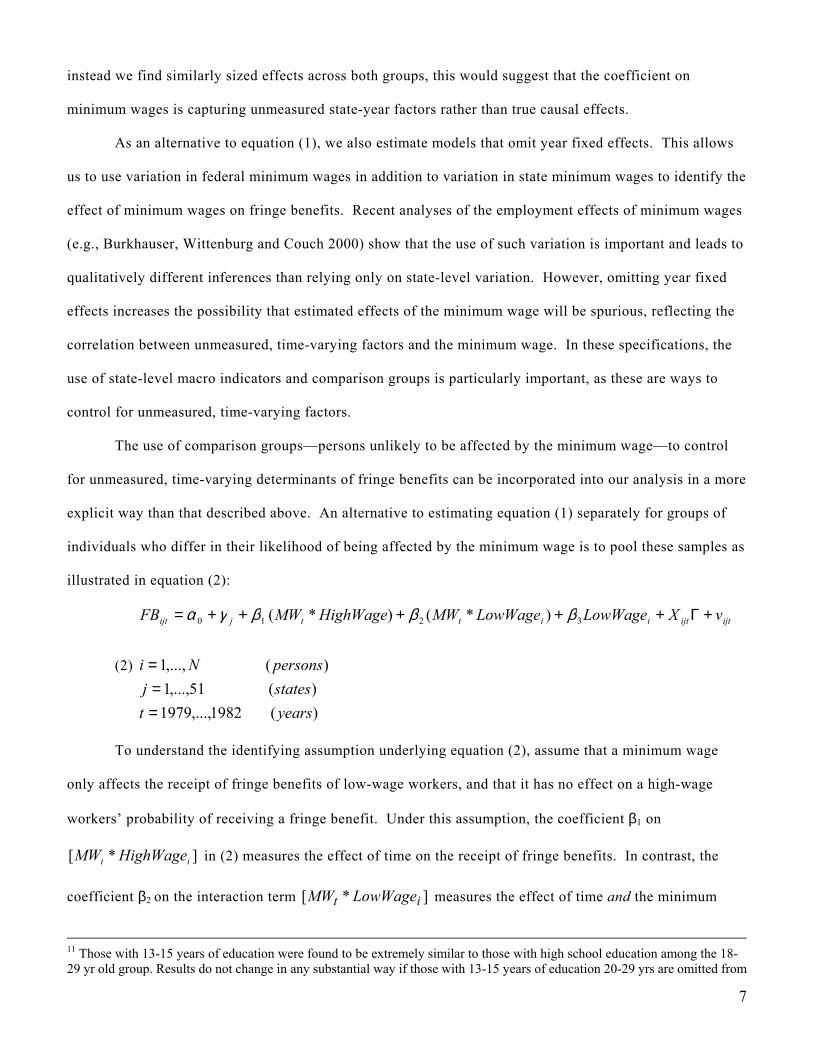
To understand the identifying assumption underlying equation (2), assume that a minimum wage
only affects the receipt of fringe benefits of low-wage workers, and that it has no effect on a high-wage
workers’ probability of receiving a fringe benefit. Under this assumption, the coefficient β1 on
]*[ it HighWageMW in (2) measures the effect of time on the receipt of fringe benefits. In contrast, the
coefficient β2 on the interaction term ]*[ it LowWageMW measures the effect of time and the minimum
11 Those with 13-15 years of education were found to be extremely similar to those with high school education among the 18-29 yr old group. Results do not change in any substantial way if those with 13-15 years of education 20-29 yrs are omitted from

8
wage on low-wage workers’ probability of receiving fringe benefits. Assuming that the effect of time on
fringe benefits receipts is equal for the two groups, the difference in coefficients measures the effect of the
minimum wage on the low-skilled group.
There are two points to note about equation (2). First, it is possible to obtain estimates similar to
those in equation (2) by estimating equation (1) separately for low- and high-wage workers, but omitting
year effects. The primary advantage of equation (2) over such a procedure is that sample sizes associated
with equation (2) are larger than they are in equation (1). This is an important advantage when the size of
the data set is limited, as for example, in the NLSY. Second, equation (2) is useful even in periods when
there is significant state-year variation in minimum wages. Omitting year effects in such cases allows us to
use the significant variation in federal minimum wages and identify the effect of minimum wages from both
state-year and year variation in minimum wages. Obviously, this specification relies heavily on the
adequacy of the “unaffected group” and the assumption that time effects are the same for high- and low-
wage workers.12
Meaningful state variation in minimum wages did not start until the end of the 1980s. Thus, we
examine the effect of minimum wages in two periods. The first period, 1979-1986, surrounds the 1980-81
changes in the federal minimum wage. Virtually all of the variation in minimum wages in this period is by
year, as only three states had state minimum wages that differed from the federal minimum.13 Thus, we are
only able to estimate models that omit year effects in such periods because it is impossible to identify
separate year and minimum wage effects. The second period, 1987-2000, encompasses major changes in the
federal minimum wage from 1989-1991 and from 1996 to 1998. In addition, many states changed their state
minimum wage during this time, allowing us to estimate models with and without year effects.
the analysis. 12 As noted, one potential adjustment mechanism to an increase in minimum wages is to shift people to part-time status where some benefits can be more easily altered. If our empirical investigation indicates that fringe benefits have decreased among workers, we can test whether or not this type of adjustment takes place by estimating models of full-time employment status. 13 In the period 1979 to 1982, Alaska, Connecticut and the District of Columbia had a state minimum wage above the federal minimum and yearly increases that differed slightly from the federal.

9
Data
We use two data sources: the National Longitudinal Survey of Youth (NLSY), and the Current Population
Survey (CPS). The next section discusses their relative strengths and the range of hypothesis testing that can be
performed with each.
NLSY
The NLSY, begun in 1979, is a national probability sample of 12,686 young adults born between the
years 1957 and 1964, and who therefore were between the ages of 14 and 22 in 1979. Respondents have
been interviewed on a yearly basis since 1979.14 We focus on two periods when there were significant
changes in the minimum wage: 1979-1982 when the federal minimum wage changed from $2.90 to $3.35 an
hour, and 1987-1992 when the federal minimum wage changed from $3.35 to $4.25 an hour. During these
two periods, many of the respondents in the NLSY held a minimum wage, or near-minimum wage, job. In
1979, approximately 36 percent of all working respondents in the NLSY earned the minimum wage or less,
and in 1987, approximately 15 percent of working respondents worked at or below the minimum wage.15
The sharp decrease in the number of minimum wage workers in 1987 reflects the aging of the NLSY cohort,
and the decline in the real value of the minimum wage between 1979 and 1987.
The NLSY also has information about fringe benefits and working conditions that are essential to
our objectives. In the 1979-82 surveys, the NLSY asked respondents whether or not the employer made
health insurance available and whether they were entitled to paid vacation. Also during this period, workers
were asked what shift (e.g., split or night) they usually worked. The 1987-1992 surveys collected more
extensive information about benefits including whether or not health and dental benefits were made
available, whether or not the employee was eligible for paid vacation and paid sick days, and finally
whether or not the employee was eligible for training or educational benefits including tuition
reimbursement. Information about working conditions is also available during this period including the type
of shift usually worked and whether the employee had an accident on the job (job safety).
14 For an example of study that looks at the effects of the minimum wage on employment using the NLSY, see Currie and Fallick (1996).

10
To obtain estimates of the effect of minimum wages on fringe benefits using the NLSY, we estimate
a modified version of equation (2). The possible categories of wage earners include:16
• workers with real (1982-84) wages below $4.00,
• workers with real wages between $4.01 and $5.00,
• workers with real wages between $5.01 and $8.00,
• workers with real wages between $8.01 and $10.00,
• and workers with real wages above $10.00.
These wage categories are appropriate for studying the impact of minimum wages. Between 1979
and 1982, the real value of the federal minimum wage varied between $3.47 and $4.00, and 32 percent of
workers earned $4.00 or less during this period. For the later period—1987 to 1992—the real value of state
and federal minimum wages varied between $2.70 and $3.85, and 14 percent of workers earned $4.00 or
less. The NLSY sample is limited to those who worked in the private sector at the time of interview, and
who were not self-employed. Table 8 contains NLSY descriptive statistics by these wage categories for the
two time periods studied.
As noted, identification in equation (2) is based on two assumptions: that minimum wages will have
a larger effect on fringe benefit receipt among low-wage workers than among high-wage workers, and that
in the absence of changes in the minimum wage, time variation in fringe benefit receipt would be the same
for low- and high-wage workers. The first assumption has significant face validity and is self-evident; a
minimum wage is more likely to be binding among low-wage workers and therefore more likely to affect
low-wage workers’ receipt of fringe benefits. The second assumption is less obvious, especially given
evidence of growing inequality in non-wage compensation (Pierce, 2001).17 One way to investigate its
validity is to examine the time trend in fringe benefits of the different worker categories during a period
when the (nominal) minimum wage was not changing. No time-trend differences between worker categories
would provide evidence in support of our identification strategy. The period between 1982 and 1986
15 In calculating these figures, workers who earned between 0 and $0.10 more than the minimum wage are defined as minimum wage workers. 16 Models using education to define ‘affected’ and ‘unaffected’ groups are also reported in the Appendix.

11
provides such an opportunity, as during this period there were no legislated changes in the federal minimum
wage, and no legislated changes in state minimum wages except for Maine. To measure differences in the
time trend in benefits, we regressed two measures of benefits—health insurance and paid vacation—on age
(four dummy variables), year (five dummy variables), wage category (four dummy variables), and wage-
category-by-year interactions. We then tested whether or not the wage-year interactions for each of the
wage categories above $4.00 were significantly different from the wage-year interactions associated with
the lowest wage group. We focus on the lowest wage group because this is the group most likely affected
by minimum wages.
Estimates indicated that the time variation in benefits of workers with wages between $4.01 and
$5.00 was equal to the time variation in benefits of workers with wages equal to or less than $4.00. For some
higher wage groups, however, estimates indicated statistically significant differences between these groups and the
lower wage groups; benefits declined less in these groups than they did for the lower wage groups. These results
suggest that workers who earn between $4.01 and $5.00 are a reasonable comparison group for workers who earn
$4.00 or less. We limit our analysis to these two groups, plus the next group up (wage between 5 and 8 dollars)
because of the small sample sizes available in the NLSY.
CPS
The second data set we use is the Current Population Survey (CPS), which is a cross-sectional survey
administered monthly to about 55,000 households. Every March, respondents are asked additional questions about
the provision of fringe benefits (employer-provided health insurance and pensions) at jobs held the previous year
through the Annual Demographics Survey (ADS). The fringe benefits questions were first asked in the 1980 wave,
and the latest information available is the 2001 ADS, thus the data span the period 1979-2000. During this period,
the nominal minimum wage changed from $2.90 to $5.15 in six steps, and eighteen states acted to raise their state
minimum wage above the federal level (See Table 1 for changes in the minimum wage between 1979 and 2000).
17 Differences in time trends between the two groups would bias us towards finding a larger difference between the ‘affected’ and the ‘unaffected’ group that may incorrectly be attributable to the minimum wage. Given our empirical findings, this is not a cause for concern in the present case.
12
Although monthly Outgoing Rotation Groups (ORG) of the CPS have been used in the minimum wage
literature, to the best of the authors’ knowledge, the ADS has not been previously analyzed in this context. The
ADS is particularly important for the analysis of minimum wages and fringe benefits for the following reasons:
• It contains questions about the receipt of health insurance and pensions, and not just whether or not an
employee was eligible for benefits as in other data sets (e.g., NLSY in this paper, and CPS Benefits
Supplement questions used in Royalty, 2000). Whether or not the worker actually receives these fringe
benefits is perhaps a more appropriate outcome to study because it reflects two types of employer actions:
decisions to offer benefits to low-wage workers as well as decisions to alter the terms of offers (i.e. changes in
employee contributions to health insurance coverage).
• The ADS also contains other measures of the generosity of health insurance: it asks whether the employer pays
all, some, or none of the premium, and it has information about whether the worker receives single or family
health insurance coverage.
• The ADS spans the past two decades and covers a period of substantial variation in federal and state minimum
wages.
The ADS has some limitations—for example, it does not record the hourly wage for workers--and thus we
cannot identify affected workers by their wage as in the NLSY analysis.18 In addition, the ADS has changed the
way that health insurance questions have been asked over time, although our use of ‘unaffected’ groups and/or year
fixed effects minimizes the severity of this problem.19 Despite these drawbacks, the ADS is perhaps the most
frequently utilized survey in terms of informing researchers and policy makers about the health insurance coverage
of non-elderly American during the last two decades.
We separate workers in the ADS into groups based on their likelihood of being affected by a
minimum wage. In some analyses, we use education and age, which we find to be good proxies for
exposure to minimum wages, to define ‘affected’ and ‘unaffected’ groups. Specifically, the ‘affected’ group
18 The basic CPS asks extra questions (including wages) of about a quarter of the respondents every month. This wage information pertains to the time of the survey, while the health insurance information asked of everyone through the Annual Demographic Supplement refers to the previous year.. We use the ORG wages to look at whether the minimum wage is binding on particular groups of workers, and in specifications presented in the Appendix, we use income instead of wages to separate CPS workers. 19 For example, in 1995 the ADS started asking a more straightforward set of health insurance related survey questions, which is thought to have had an across-the-board increase in the number of people estimated to have employer health insurance. (http://www.bls.census.gov/cps/ads/1995/susrnot3.htm)

13
is high school drop-outs aged 18 - 29 years (HSDO), and the corresponding ‘unaffected’ group is those with
between 12 and 15 years of education aged 20 -29 years (GEHS). We also define ‘affected’ and unaffected’
groups based on income: those with less than $8,000 (real 1982-84 terms) in earned income are in the
‘affected’ group, and the two ‘unaffected’ groups are those with $8-12,000, and $12-20,000 of income.
The sample of workers from the CPS excludes self-employed workers and public sector workers.
Descriptive statistics by skill group and time period are listed in table 7.
A Preliminary Look at the Data – Minimum Wages and Health Insurance
The history of the variation in federal and state minimum wage laws during our study period is summarized
in Table 1. An X indicates that a state set a minimum wage above the federal level in that year, while the last row
shows the average difference between the federal level and the states that are represented by the Xs. The next to
last row shows the federal level in May of that year.20 Although no significant state variation in the minimum wage
took place until 1987, the federal minimum wage rose (in nominal terms) from $2.90 to $3.35 between 1979 and
1981. As stated before, our first sample period, 1979-1982/6 focuses on this event. Between then and 1986, no
change in the federal minimum wage took place, and hardly any states changed their minimum wage. In contrast,
our post 1987 study period contains significant state activity in setting minimum wages as well as four federal
minimum wage hikes.
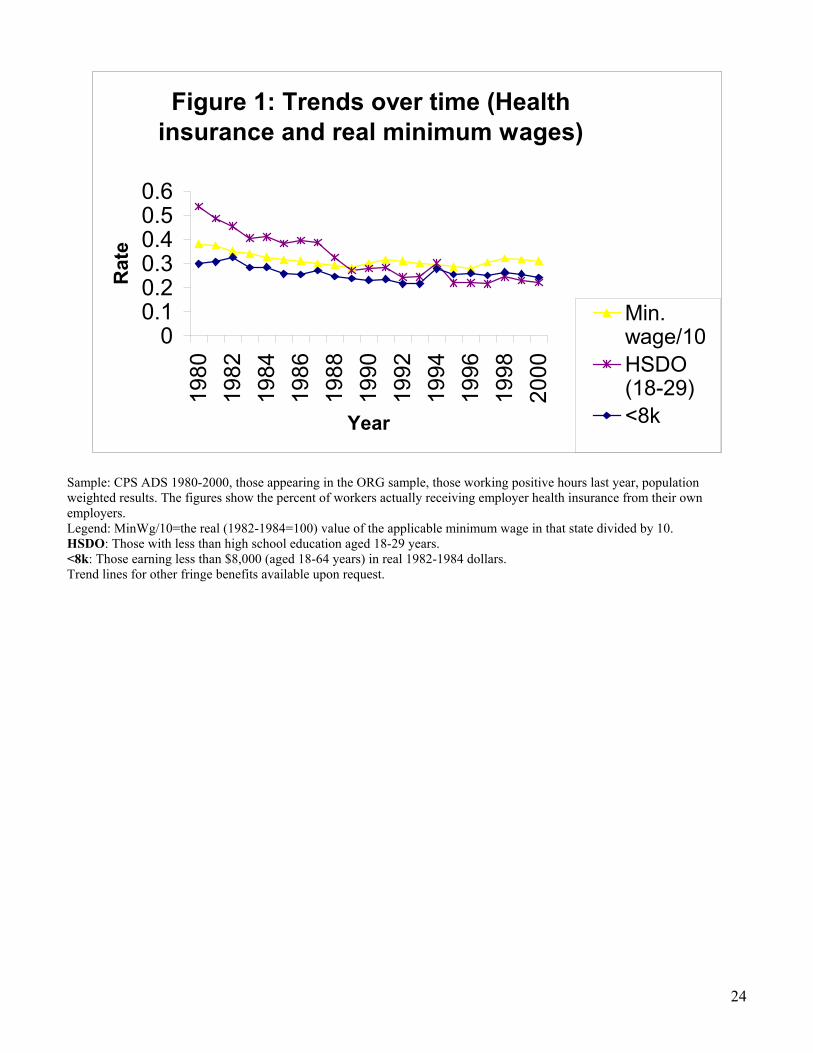
Figure 1 plots the real value of the minimum wage and the rate of employer provided health insurance for
the two ‘affected’ groups (calculated from the CPS) for the period 1980 to 2000. This figure shows that during the
period from 1980 to about 1987, the real value of the minimum wage as well as the health insurance rate for both
affected groups decreased, although the decline in health insurance coverage was steeper for the HSDO group than
the group with annual income less than $8,000. One should be cautious in interpreting this as evidence against our
hypothesis since we cannot be certain of what the time trend for benefits in the low wage sector would have been,
absent the minimum wage changes.21 From 1987 to 2000, the minimum wage remained relatively constant, but
20 We are grateful to David Neumark and Bill Wascher for sharing their minimum wage data with us. 21 Another possibility suggested by the monopsony model is that lower wages received by minimum wage workers as a result of lower minimum wages results in a lower demand for fringe benefits since they are normal goods. We do not find this to be a plausible story in this current context.

14
health insurance continued to decline until 1993 after which it also remained relatively stable.22 In sum, Figure 1
provides little aggregate evidence that minimum wages adversely affected health insurance coverage of the lowest-
skilled workers. However, aggregate data may mask important heterogeneity, thus we turn next to an analysis using
individual level data from NLSY and CPS.
Effects of Minimum Wages on Wages
The hypothesis motivating our analysis is that minimum wages that bind—i.e., that increase wages—may
affect fringe benefits. Therefore, it is important to establish that minimum wages are binding for members of our
sample. Lee (1999) provides an extensive analysis of the effect of minimum wages on the wage distribution for the
periods studied in this paper. His analysis reveals that during this period, higher minimum wages significantly
compressed the wage distribution below the median, and had little effect on the wage distribution above the
median, particularly in the early 1980’s. Lee’s (1999) results imply that minimum wages were binding for low-
wage workers during the periods we study, particularly the earlier period 1979-1986. Neumark, Schweizer and
Wascher (2000) provide further evidence to support this point using data from the CPS ORG samples from 1979-
1997. They estimate that wages respond to changes in minimum wages with an elasticity of 0.8 for those earning
just around the minimum wage. For those who are earning 1.5 times the minimum wage, the elasticity of wage with
respect to the minimum wage is lower; it is 0.4.
To further establish the fact that our ‘affected’ and ‘unaffected’ groups differ in their exposure to minimum
wages, present some original analyses. We calculated the fraction of each of our groups that is directly constrained
by the minimum wage (defined conservatively as earning less than 1.1 times the prevailing minimum wage) from
the CPS ORG sample, since hourly wages are not reported in the ADS. These results are shown as a table
(Table 2) and as a figure (Figure 2). Reflecting the erosion of the minimum wage in real terms, the series
start out showing a high (as much as 40% of the HSDO group and 50% of the low-income group) fraction of
our ‘affected’ groups clustered at the minimum wage, but these fractions become smaller over time. The
‘unaffected’ groups show stable trend lines over time, while the ‘affected’ groups’ lines vary dramatically with
22 These figures generally match the trend in health insurance for low-skilled workers in Currie and Yelowitz (1999) and Farber and Levy (2000). Unreported graphs for employer pension coverage (available upon request) shows trends similar to those for health insurance.

15
hikes in the minimum wage. In summary, these numbers show that the ‘affected’ groups are far more likely to be
constrained by the minimum wage than our ‘unaffected’ groups, and that the fraction constrained varies with the
degree to which minimum wages have been binding over time, as we would expect.
Effect of Minimum Wages on Fringe Benefits: NLSY Results
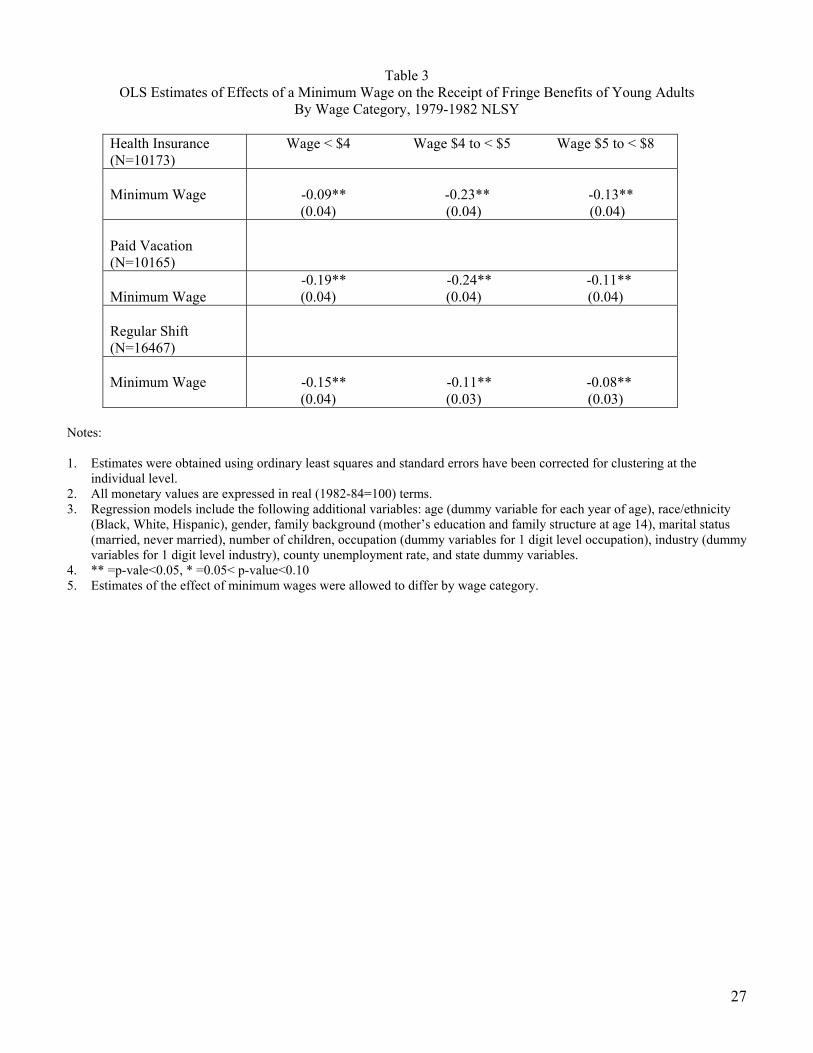
Table 3 presents estimates of equation (2) for the 1979 to 1982 period. In the 1979 to 1982 surveys, the
NLSY collected information on the following benefits and working conditions: availability of health insurance
benefits, eligibility for paid vacation, and work shift (equal to one if regular day). The sample used in these
analyses includes all non-self employed workers in the private sector. The important aspect of equation (2) is that
the effect of the minimum wage is allowed to vary by wage categories: <$4, $4 to $5, and $5 to $8. We expect
estimated effects of the minimum wage to be more negative (or less positive) for low-wage workers for whom the
minimum wage is most likely to be binding. As noted above, we chose to estimate equation (2) instead of
estimating equation (1) separately by wage category because of the relatively small sample size associated with the
NLSY.
All of the estimates in Table 3 are statistically significant. For example, among workers with wages of less
than $4 per hour, a $1 increase in the real minimum wage is associated with an 9 percentage-point reduction in
health insurance availability, a 19 percentage-point reduction in paid vacation, and a 15 percentage-point decrease
in the incidence of regular shift work. Similar estimates (often larger in magnitude) were found for workers in the
other two wage categories listed in Table 3. The similarity of the estimates across workers in different wage
categories suggests that these significant associations are not causal, but instead reflect general trends in fringe
benefits and working conditions during this period. Minimum wages are most binding for workers in the lowest
wage category and therefore we would expect the effect of minimum wages to be the most negative (or the least
positive) for this group. This is not what we find. All of the estimates in Table 3 are negative, but the magnitudes
of the estimates across wage categories do not vary as expected. There appears to have been a general decrease in
the availability and receipt of fringe benefits during this period that is unrelated to changes in the minimum wage;
there is no evidence in Table 3 to suggest that low-wage workers whose wages were affected by the minimum wage
experienced a larger decrease in fringe benefits than workers with higher wages. Likewise, the decline in regular
16
shift work appears to have occurred independently of the minimum wage. Estimates similar to those in Table 3, but
not presented here, were obtained from models that used a one-year lag of the minimum wage, for models that used
education (<12 years of education, 12 to 15 years of education, 16 or more years of education, reported in the
Appendix table A1) instead of wages to divide the sample by the likelihood of being affected by the minimum
wage, and for models that used the natural logarithm of the minimum wage instead of the level.
Table 4 presents estimates of the effect of minimum wages on fringe benefits and working conditions in the
1987 to 1992 period.23 In these years, the NLSY collected information about a wider range of benefits including
the availability of dental benefits, sick-day pay, and educational benefits. Estimates in Table 4 indicate that
minimum wages were not significantly related to fringe benefits and working conditions. Few of the estimates in
Table 4 are statistically significant, and more importantly, there is no evidence that minimum wages reduced the
fringe benefits of low-wage workers more than high-wage workers. These results are consistent with those in Table
3, and like those in Table 3, were similar when a one-year lag of the minimum wage was used instead of the
contemporaneous measure, when the natural logarithm of the minimum wage was used, and when education was
used to divide the sample instead of wages (Table A2 in the Appendix).
Effect of Minimum Wages on Fringe Benefits: CPS Results
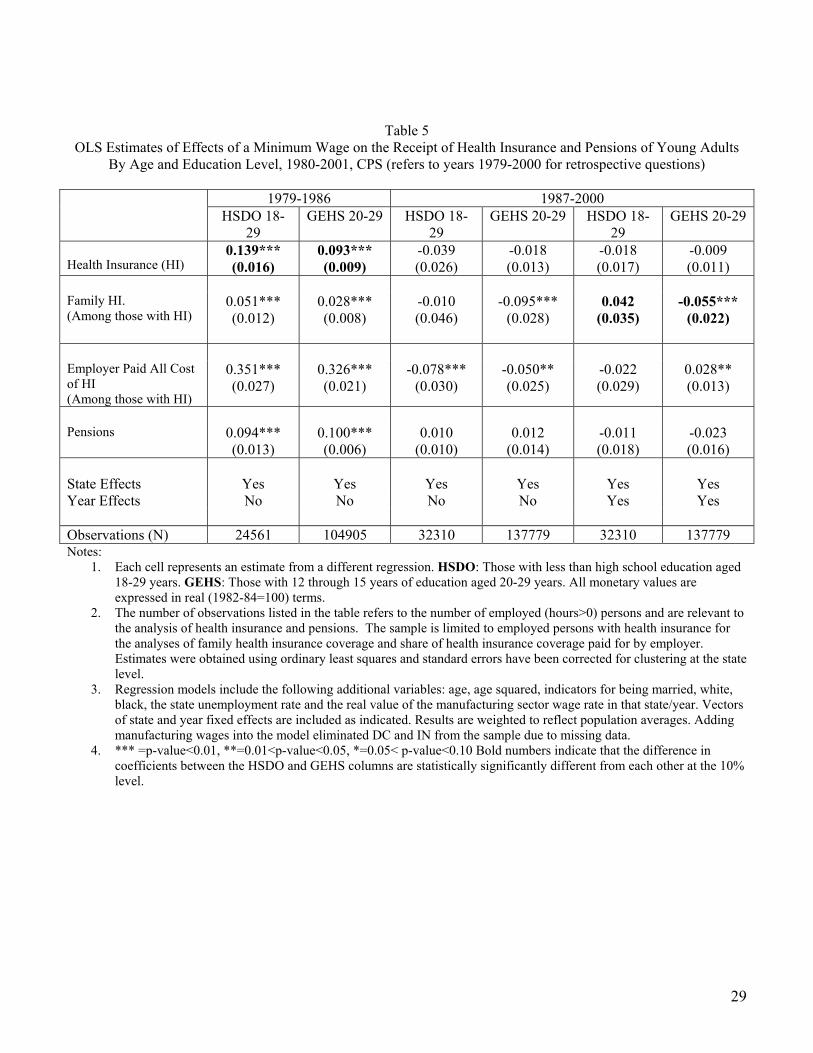
Similar tests of the impact of minimum wages on fringe benefits were conducted using the CPS sample.
Table 5 presents the OLS estimates of the effect of the minimum wage on the receipt of employer health insurance
and pensions for the two education and age groups that define our ‘affected’ and ‘unaffected’ groups. Health
insurance is measured in three ways: whether the employee has employer provided health insurance; whether the
employee has family coverage; and whether the employer paid the full cost of employee health insurance. Each
row of the table lists estimates from a separate regression. Standard errors are in parentheses. Bold numbers
indicate instances where the difference between the coefficients of the affected and the unaffected groups are
statistically significantly different at the 10% level. The sample is limited to those with health insurance in the
analyses of family coverage and the employer’s contribution. The fourth row contains results for the pension
regression where the dependent variable takes on a value of one if the worker received a pension from the employer
17
and zero if s/he did not. The first two columns present estimates for the period 1979 to 1986. Because of the lack of
state variation in the minimum wages, we are unable to use year fixed effects in these models. Therefore, we
estimate equation (1) for each of the two education/age demographic groups. Estimates of the effect of minimum
wages for the group for whom the minimum wage does not bind (GEHS) provide information as to the causal
nature of the estimates associated with groups for whom the minimum wage is binding.
During 1979-1986, increased minimum wages are associated with increased probability of receiving health
insurance and pensions for both demographic groups. There is also an increase in probability of the employer
offering family health insurance, which usually costs the employer more than twice what an individual policy costs,
and an increased probability of the employer paying for all of the health insurance costs. These results are
surprising in two ways. First, the effect is the opposite in sign to what theory predicts. Second, the magnitudes of
the effects are similar across the two groups—those ‘affected’ and those ‘unaffected’—in the case of pensions. The
only case where the difference in coefficients is statistically significant between the two groups, the effect of the
minimum wage on health insurance is positive and larger in magnitude for the ‘affected’ group than for the
‘unaffected’ group. Therefore, it is likely that these positive and statistically significant results are due to a general
decline in employer health insurance generosity that coincided with a decline in the real value of the minimum
wage. The absence of a differential effect for the ‘affected’ and ‘unaffected’ groups suggests that the minimum
wage had no causal effect on the fringe benefit receipt of low-wage workers.
Results in the next several columns relate to models for the 1987-2000 period. The first two columns
display results that do not include year fixed effects. In these models, the effect of minimum wages on health
insurance coverage and pensions are statistically insignificant and of the same sign for both demographic groups.
The effect of minimum wages on the probability that the employer pays the whole cost of health insurance is
negative as theorized, but the magnitude of the effect is not statistically significantly different between the two
groups. The minimum wage is associated with a decrease in the probability of receiving family coverage among the
‘unaffected’ group and a statistically insignificant effect among ‘affected’ group, but here too the difference in
coefficients is not statistically significantly different from each other. Thus, the estimates for this period, which
23 The 1987 to 1992 period is characterized by slightly more state-year variation in minimum wages, but not enough to identify reliably separate year and minimum wage effects given the sample size.

18
were obtained without controlling for year fixed effects suggest that the minimum wage did not reduce the
probability that low-wage workers received health insurance or pension benefits.
The last two columns of Table 5 present the estimates for the 1987 to 2000 period that control for year
effects. Most estimates are not statistically significant and all are small in magnitude. Estimates indicate that for
the more educated group (GEHS 20-29), a higher minimum wage was associated with a decrease in family health
insurance coverage and an increase in the employer contribution among those with health insurance. The
coefficients between the two groups are statistically significantly different from each other only in the case of
family health insurance. These results are not intuitive nor readily explained by theory.
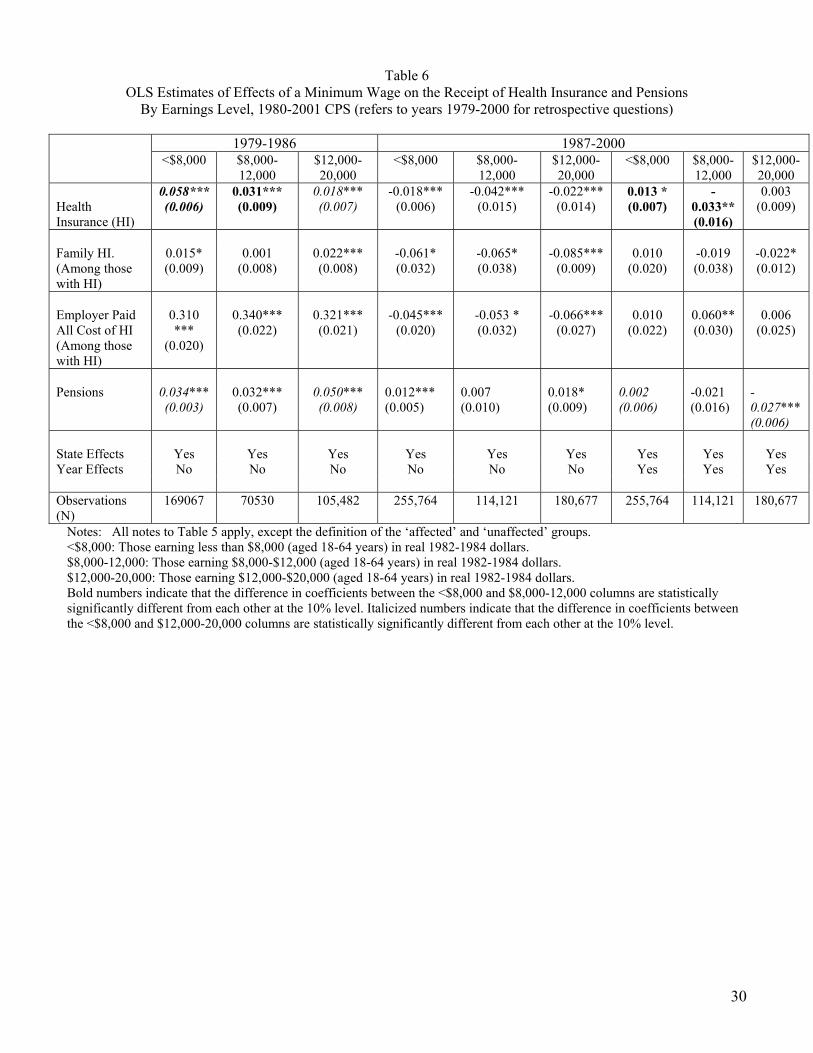
An alternative way to identify groups that are more and less subject to minimum wage legislation is by
income. Table 6 shows the effects of minimum wages on fringe benefits when we divide our sample into a group
earning less than $8,000/year (in real 1982-1984 terms), a group earning $8,000 to $12,000 and a group earning
between $12,000 and $20,000. Here again, the minimum wage is positively associated with fringe benefit receipt
during the 1979-1986 period. Moreover, the magnitudes of the estimates are similar across the three income groups
with the coefficients on health insurance declining with income. The only statistically significant difference in
coefficients is the first row, health insurance. This pattern is inconsistent with a causal effect.
For the 1987-2000 period, we estimate models with and without year fixed effects. Without year fixed
effects, the results indicate that the probability of health insurance receipt falls as the minimum wage rises. This is
true for all three income groups and for all measures of health insurance (any health insurance, family health
insurance and employer payment of the full premium). The difference in coefficients between the lowest income
group and the other two income groups is statistically insignificant in all cases. In contrast, the receipt of pensions
is positively related to minimum wages. Here too, the estimate for the lowest income group is statistically
insignificant from the estimate for the other two groups. Finally, in models that include year effects, there are fewer
coefficients that are statistically significant and the magnitudes of the estimates are relatively small. There is still
no indication that minimum wages have affected the fringe benefit coverage of low-earning workers in a systematic
way. The only statistically significant effect, and this is only marginally significant at the 10% level, is for the
lowest income group; in this case there is a positive effect of the minimum wage on health insurance. This effect is
statistically different from the effect of minimum wages on the health insurance of higher income groups, but the

19
sign is opposite from theoretical expectations. The only other effect that is statistically significantly different among
the income groups is for pensions- the effect of minimum wages on pensions on the lowest income group is
statistically insignificant while it is negative and statistically significant for the highest income group. In sum, the
estimates in Table 6 are consistent with those in Table 5 and suggest that the minimum wage is not associated in a
causal way with fringe benefit receipt of low-wage workers.
Conclusions and Discussion
Neoclassical labor market theories imply that employers will react to binding minimum wages by changing
the level of employment. A multitude of studies consider this aspect of minimum wages, yet fail to reach a
consensus as to its employment effects. Another way that employers may adjust to this exogenous shock is to
reduce the generosity of fringe benefit provisions. Given that about one out of every three employees near the
minimum wage has access to fringe benefits such as health insurance, and that fringe benefits account for up to 30
percent of total compensation, the potential exists for adjustments along these dimensions. Whether or not this
option is exercised depends on the costs of adjusting fringe benefits due to legal and institutional constraints.
The empirical evidence in this paper suggests that minimum wages have had no discernible effect on fringe
benefits (e.g., offers and receipt of health insurance, receipt of pensions, vacation pay, and quality of working
conditions). This conclusion is unchanged whether we use only state level variation or federal and state variation in
minimum wages. Taken in light of the fact that the results from both data sets used in this analysis suggest that
wages of the targeted individuals were affected, we conclude that we do not find strong evidence that binding
increases in the minimum wages caused an offsetting decline in the provision of fringe benefits or quality of
working conditions. This result, combined with earlier findings of small to no employment effects of minimum
wages, is not consistent with the theory of compensating wage differentials, as there was little discernable change in
benefits when wages were increased for low-wage workers.
Despite our efforts to investigate this topic by formulating multiple tests exploiting different forms of
variation in minimum wages and different outcomes, it may be possible that the adjustment mechanism is one that
we cannot observe with individual level data. Given the institutional features that set fringe benefit at aggregate
levels (such as the establishment or firm) perhaps the adjustment occurs only in firms dominated by low-wage

20
workers. The story of labor market adjustments to minimum wage changes is one of employer actions rather than
employee reactions, and as such a future analysis of these questions using employer level data would also be
particularly useful.
21
References
Abowd, J. M., F. Kramarz, and D. N. Margolis. 1999. “Minimum Wages and Employment in France and the United States.” NBER Working Paper #6996. Alpert, W. T. 1986. The Minimum Wage in the Restaurant Industry. New York: Praeger. Acemoglu, D. and J.S. Pischke, 1999. “Minimum Wages and On-the-job Training”. NBER Working Paper # 7184. Baker, M., D. Benjamin and S. Stanger. 1999. “The Highs and Lows of the Minimum Wage Effect: A Time-Series Cross-Section Study of Canadian Law.” Journal of Labor Economics, 17:318-50. Burkhauser, R., K. Couch and D. Wittenburg. 2000a. “Who Minimum Wage Increases Bite: An Analysis Using Monthly Data from the SIPP and CPS”. Southern Economic Journal. V.67, no. 1, p.16-40. ----2000b “A Reassessment of the New Economics of the Minimum Wage Literature with Monthly Data from the Current Population Survey” Journal of Labor Economics. Vol 18, no 4. Card, D. 1992a. “Using Regional Variation in Wages to Measure the Effects of the Federal Minimum Wage.” Industrial and Labor Relations Review, 46:22-37. Card, D. 1992b. “Do Minimum Wages Reduce Employment? A Case Study of California, 1987-1989.” Industrial and Labor Relations Review, 46:38-54. Card, D, and A, Krueger. 1994. “Minimum Wages and Employment: A Case Study of the Fast-Food Industry in New Jersey and Pennsylvania.” American Economic Review 84:772-93. Card, D, and A, Krueger. 1995. Myth and Measurement: The New Economics of the Minimum Wage, Princeton: Princeton University Press. Carrington, W., K. McCue and B. Pierce, 2001. “Non-Discrimination Rules and the Distribution of Fringe Benefits” Working paper. Collins M.J.1999 “A Primer on the Self insured Health Plan Non-discrimination Rules” Journal of Pension Planning and Compliance. Currie, J. and B. Fallick. 1996. “The Minimum Wage and the Employment of Youth.” The Journal of Human Resources, 31:404-28. Currie, J. and A. Yelowitz, 1999. “Health Insurance and Less Skilled Workers”. Working paper. Deere, D., K. Murphy and F. Welch. 1995 “Re-examining Methods of Estimating Minimum-Wage Effects.” American Economic Review, 85:232-37. Farber H. and H. Levy. 2000. “Recent Trends in Employer-Sponsored Health Insurance Coverage: Are Bad Jobs Getting Worse?” Journal of Health Economics v19, n1, pp. 93-119 Hamermesh, D. 1999. “Changing Inequality in Markets for Workplace Amenities” Quarterly Journal of Economics, 114 (4): 1085-1123 Hashimoto, M. 1982. “Minimum Wage Effects on Training on the Job.” American Economic Review 72:1070-87.
22
Holzer, H., L.Katz and A. Krueger. 1991. “Job Queues and Wages.” The Quarterly Journal of Economics, 106:739-68. Katz, L.e and A. Krueger. 1992. “The Effect of the Minimum wage on the Fast Food Industry.” Industrial and Labor Relations Review, 46:6-21. Lazear, E. and F. Miller. 1981. “Minimum Wages Versus Minimum Compensation.” In Report of the Minimum Wage Study Commission, vol. 5, Washington, DC: US Government Printing Office. Lee, D.. 1999. “Wage Inequality in the United States During the 1980s: Rising Dispersion or Falling Minimum Wage?” Quarterly Journal of Economics 64: 977-1023. Leighton, L. and J. Mincer. 1981. “The Effects of the Minimum Wage on Human Capital Formation.” In Simon Rottenberg, (Ed.) The Economics of Legal Minimum Wages.. Washington, DC: American Enterprise Institute for Public Policy Research. Machin, S. and A. Manning. 1994. “Minimum Wages, Wage Dispersion and Employment: Evidence from the UK Wage Councils.” Industrial and Labor Relations Review, 47:319-29. Manning, A. “How Do We Know That Real Wages are Too High?” The Quarterly Journal of Economics, 105:1111-26. Neumark, D. and W. Wascher, 2001. “Minimum Wage and Training Revisited”. Journal of Labor Economics, 19 (3): 563-595. Neumark, D. M. Schweitzer and W. Wascher. 2000. “ The Effects of the Minimum Wage Throughout the Wage Distribution” NBER Working Paper 7519. Neumark, D. and W. Wascher. 1992. “Employment Effects of Minimum and Subminimum Wages: Panel Data on State Minimum Wage Laws.” Industrial and Labor Relations Review, 46:55-81. Pierce, B. 2001 “Compensation Inequality.” Quarterly Journal of Economics, 116 (4) : 1493-1525. Royalty, A. 2000. “Do Minimum Wage Increases Lower the Probability that Low-Skilled Workers Will Receive Fringe Benefits?” Working paper, Indiana University-Purdue University Indianapolis and Stanford University. Sicilian, P. and A. Grossberg. 1993. “Do Legal Minimum Wages Create Rents? A Re-examination of the Evidence.” Southern Economic Review, 60:201-09. Stigler, G. 1946 “The Economics of Minimum Wage Legislation” American Economic Review, 36:358-65. Wessels, W. 1980. Minimum Wages, Fringe Benefits, and Working Conditions. Washington,DC: American Enterprise Institute for Public Policy Research.

23
Table 1. States with Minimum Wage Above Federal Level, 1979-2000
Year 79 80 81 82 83 84 85 86 87 88 89 90 91 92 93 94 95 96 97 98 99 00 Total AK X X X X X X X X X X X X X X X X X X X X X 5.65 22 CA X X X X X 5.75 6 CT X X X X X X X X X X X X X X X X X X X X X 6.15 22 DE X X X 5.65 4 DC X X X X X X X X X X X X X X X X X X X X X 6.15 22 HI X X X X X X X X X X X 5.25 12 ID 0 IA X X X X X X 6 ME X X X X X X 6 MD X 1 MA X X X X X X X 6.00 8 MN X X X 3 NH X X X 3 NJ X X X X X X 6 NY 0 OR X X X X X X X X X X 6.50 11 PA X 1 RI X X X X X X X X X X X 5.65 12 VT X X X X X X X X X 5.75 10 WA X X X X X X X 6.50 8 3 3 3 3 3 3 4 4 8 10 13 12 5 8 8 9 10 12 13 8 10 11 163 Federal level 2.9 3.1 3.35 3.35 3.35 3.35 3.35 3.35 3.35 3.35 3.35 3.8 4.25 4.25 4.25 4.25 4.25 4.25 4.75 5.15 5.15 5.15
Avg. Dif from federal .3 .2 .22 .26 .33 .33 .28 .31 .41 .4 .58 .31 .3 .4 .5 .56 .53 .54 .41 .41 .53 .76 Source: Data generously provided by William Wascher, cross-checked for select years against reports in the Monthly Labor Review. Last row shows the average difference between the federal level and the state level (for those states who set a minimum wage above the federal level).
24
Figure 1: Trends over time (Health insurance and real minimum wages)
00.10.20.30.40.50.6
1980
1982
1984
1986
1988
1990
1992
1994
1996
1998
2000
Year
Rat
e
Min.wage/10HSDO(18-29)<8k
Sample: CPS ADS 1980-2000, those appearing in the ORG sample, those working positive hours last year, population weighted results. The figures show the percent of workers actually receiving employer health insurance from their own employers. Legend: MinWg/10=the real (1982-1984=100) value of the applicable minimum wage in that state divided by 10. HSDO: Those with less than high school education aged 18-29 years. <8k: Those earning less than $8,000 (aged 18-64 years) in real 1982-1984 dollars. Trend lines for other fringe benefits available upon request.

25
Figure 2: Fraction of each category below (1.1*minumum wage)
0.0000.1000.2000.3000.4000.5000.600
1980
1983
1986
1989
1992
1995
1998
Year
Frac
tion
HSDO(18-29)GEHS(20-29)<8k
8k- 12k
12k-20k
Sample: CPS ORG sample, 1980-2000, those with positive reported hourly wages, population weighted results. The figures show the percent of workers earning below 1.1 times the minimum wage.

26
Table 2: Fraction with Health Insurances and Fraction Constrained by the Minimum Wage By Group and by Year, CPS Sample
Year
Health Insurance
among HSDO
% of HSDO
constrained
Health Insurance
among GEHS
% of GEHS
constrained
Health Insurance
among <8k
% of <8k
constrained
Health Insuran
ce among 8k-12k
% of 8k-12k constrai
ned
Health Insuran
ce among 12k-20k
% of 12k-20k
constrained
1980 0.340 0.360 0.650 0.147 0.299 0.487 0.671 0.202 0.811 0.048 1981 0.360 0.409 0.641 0.153 0.306 0.491 0.690 0.197 0.856 0.045 1982 0.303 0.342 0.623 0.124 0.325 0.404 0.693 0.102 0.861 0.032 1983 0.363 0.414 0.596 0.116 0.283 0.413 0.697 0.083 0.858 0.028 1984 0.332 0.370 0.582 0.105 0.284 0.360 0.663 0.077 0.845 0.026 1985 0.274 0.319 0.585 0.098 0.257 0.325 0.681 0.064 0.833 0.024 1986 0.224 0.248 0.572 0.090 0.254 0.291 0.641 0.066 0.829 0.015 1987 0.257 0.281 0.525 0.063 0.271 0.256 0.634 0.043 0.819 0.017 1988 0.189 0.216 0.527 0.055 0.246 0.207 0.589 0.050 0.773 0.015 1989 0.196 0.239 0.520 0.052 0.238 0.210 0.591 0.036 0.753 0.020 1990 0.205 0.304 0.510 0.070 0.230 0.280 0.566 0.066 0.759 0.021 1991 0.324 0.400 0.483 0.085 0.235 0.325 0.572 0.075 0.763 0.024 1992 0.244 0.315 0.460 0.079 0.216 0.294 0.568 0.060 0.750 0.026 1993 0.252 0.315 0.474 0.068 0.215 0.241 0.555 0.060 0.726 0.020 1994 0.201 0.272 0.469 0.063 0.278 0.224 0.607 0.045 0.776 0.017 1995 0.170 0.240 0.457 0.057 0.254 0.196 0.561 0.050 0.748 0.018 1996 0.182 0.235 0.460 0.041 0.259 0.151 0.572 0.036 0.742 0.017 1997 0.198 0.301 0.460 0.082 0.250 0.273 0.551 0.062 0.730 0.027 1998 0.244 0.310 0.454 0.081 0.263 0.275 0.570 0.080 0.728 0.031 1999 0.167 0.223 0.479 0.070 0.256 0.240 0.563 0.065 0.718 0.027
2000 0.217 0.296 0.485 0.057 0.242 0.226 0.531 0.047 0.716 0.024 Notes: The in the pairs of columns above, the first is the fraction of the group that has health insurance through the employer, and the second is the fraction of the group that earns wages below 1.1 times the minimum wage. The groups are: HSDO: Those with less than high school education aged 18-29 years. GEHS: Those with 12 through 15 years of education aged 20-29 years. <8k: Those earning less than $8,000 (aged 18-64 years) in real 1982-1984 dollars. 8k-12k: Those earning $8,000-$12,000 (aged 18-64 years) in real 1982-1984 dollars. 12k-20k: Those earning $12,000-$20,000 (aged 18-64 years) in real 1982-1984 dollars. The ORG sample is used. Year refers to the CPS year. Population weights are used.
27
Table 3 OLS Estimates of Effects of a Minimum Wage on the Receipt of Fringe Benefits of Young Adults
By Wage Category, 1979-1982 NLSY
Health Insurance (N=10173)
Wage < $4 Wage $4 to < $5 Wage $5 to < $8
Minimum Wage
-0.09** (0.04)
-0.23** (0.04)
-0.13** (0.04)
Paid Vacation (N=10165)
Minimum Wage
-0.19** (0.04)
-0.24** (0.04)
-0.11** (0.04)
Regular Shift (N=16467)
Minimum Wage
-0.15**
(0.04)
-0.11**
(0.03)
-0.08**
(0.03) Notes: 1. Estimates were obtained using ordinary least squares and standard errors have been corrected for clustering at the
individual level. 2. All monetary values are expressed in real (1982-84=100) terms. 3. Regression models include the following additional variables: age (dummy variable for each year of age), race/ethnicity
(Black, White, Hispanic), gender, family background (mother’s education and family structure at age 14), marital status (married, never married), number of children, occupation (dummy variables for 1 digit level occupation), industry (dummy variables for 1 digit level industry), county unemployment rate, and state dummy variables.
4. ** =p-vale<0.05, * =0.05< p-value<0.10 5. Estimates of the effect of minimum wages were allowed to differ by wage category.

28
Table 4
OLS Estimates of Effects of a Minimum Wage on the Receipt of Fringe Benefits of Young Adults By Wage Category, 1987-1992 NLSY
Health Insurance (N=21635)
Wage < $4 Wage $4 to < $5 Wage $5 to < $8
Minimum Wage 0.03
(0.05) -0.02 (0.04)
0.00 (0.02)
Dental Insurance (N=21506)
Minimum Wage
0.06
(0.04)
0.07
(0.04)
0.08**
(0.03) Paid Vacation (N=21512)
Minimum Wage
-0.01 (0.05)
0.03
(0.04)
0.01
(0.02) Sick Pay (N=20976)
Minimum Wage
-0.08* (0.05)
-0.02 (0.04)
0.02
(0.03) Education & Training (N=17116)
Minimum Wage
0.16**
(0.04)
0.10
(0.04)
0.08**
(0.03) Regular Shift (N=18395)
Minimum Wage
0.05
(0.03)
0.01
(0.03)
0.02
(0.02) Injury on the Job (N=15232)
Minimum Wage
0.04
(0.03)
0.00
(0.03)
0.04* (0.02)
Notes: See notes to Table 3.
29
Table 5 OLS Estimates of Effects of a Minimum Wage on the Receipt of Health Insurance and Pensions of Young Adults
By Age and Education Level, 1980-2001, CPS (refers to years 1979-2000 for retrospective questions) 1979-1986 1987-2000 HSDO 18-
29 GEHS 20-29 HSDO 18-
29 GEHS 20-29 HSDO 18-
29 GEHS 20-29
Health Insurance (HI)
0.139*** (0.016)
0.093*** (0.009)
-0.039 (0.026)
-0.018 (0.013)
-0.018 (0.017)
-0.009 (0.011)
Family HI. (Among those with HI)
0.051*** (0.012)
0.028*** (0.008)
-0.010 (0.046)
-0.095*** (0.028)
0.042 (0.035)
-0.055*** (0.022)
Employer Paid All Cost of HI (Among those with HI)
0.351*** (0.027)
0.326*** (0.021)
-0.078*** (0.030)
-0.050** (0.025)
-0.022 (0.029)
0.028** (0.013)
Pensions
0.094*** (0.013)
0.100*** (0.006)
0.010 (0.010)
0.012 (0.014)
-0.011 (0.018)
-0.023 (0.016)
State Effects Yes Yes Yes Yes Yes Yes Year Effects No No No No Yes Yes Observations (N) 24561 104905 32310 137779 32310 137779 Notes:
1. Each cell represents an estimate from a different regression. HSDO: Those with less than high school education aged 18-29 years. GEHS: Those with 12 through 15 years of education aged 20-29 years. All monetary values are expressed in real (1982-84=100) terms.
2. The number of observations listed in the table refers to the number of employed (hours>0) persons and are relevant to the analysis of health insurance and pensions. The sample is limited to employed persons with health insurance for the analyses of family health insurance coverage and share of health insurance coverage paid for by employer. Estimates were obtained using ordinary least squares and standard errors have been corrected for clustering at the state level.
3. Regression models include the following additional variables: age, age squared, indicators for being married, white, black, the state unemployment rate and the real value of the manufacturing sector wage rate in that state/year. Vectors of state and year fixed effects are included as indicated. Results are weighted to reflect population averages. Adding manufacturing wages into the model eliminated DC and IN from the sample due to missing data.
4. *** =p-value<0.01, **=0.01<p-value<0.05, *=0.05< p-value<0.10 Bold numbers indicate that the difference in coefficients between the HSDO and GEHS columns are statistically significantly different from each other at the 10% level.
30
Table 6 OLS Estimates of Effects of a Minimum Wage on the Receipt of Health Insurance and Pensions
By Earnings Level, 1980-2001 CPS (refers to years 1979-2000 for retrospective questions)
1979-1986 1987-2000 <$8,000 $8,000-
12,000 $12,000-20,000
<$8,000 $8,000-12,000
$12,000-20,000
<$8,000 $8,000-12,000
$12,000-20,000
Health Insurance (HI)
0.058*** (0.006)
0.031*** (0.009)
0.018*** (0.007)
-0.018*** (0.006)
-0.042*** (0.015)
-0.022*** (0.014)
0.013 * (0.007)
-0.033** (0.016)
0.003 (0.009)
Family HI. (Among those with HI)
0.015* (0.009)
0.001 (0.008)
0.022*** (0.008)
-0.061* (0.032)
-0.065* (0.038)
-0.085*** (0.009)
0.010 (0.020)
-0.019 (0.038)
-0.022* (0.012)
Employer Paid All Cost of HI (Among those with HI)
0.310 ***
(0.020)
0.340*** (0.022)
0.321*** (0.021)
-0.045*** (0.020)
-0.053 * (0.032)
-0.066*** (0.027)
0.010 (0.022)
0.060** (0.030)
0.006 (0.025)
Pensions
0.034*** (0.003)
0.032*** (0.007)
0.050*** (0.008)
0.012*** (0.005)
0.007 (0.010)
0.018* (0.009)
0.002 (0.006)
-0.021 (0.016)
-0.027*** (0.006)
State Effects Yes Yes Yes Yes Yes Yes Yes Yes Yes Year Effects No No No No No No Yes Yes Yes Observations (N)
169067 70530 105,482 255,764 114,121 180,677 255,764 114,121 180,677
Notes: All notes to Table 5 apply, except the definition of the ‘affected’ and ‘unaffected’ groups. <$8,000: Those earning less than $8,000 (aged 18-64 years) in real 1982-1984 dollars. $8,000-12,000: Those earning $8,000-$12,000 (aged 18-64 years) in real 1982-1984 dollars. $12,000-20,000: Those earning $12,000-$20,000 (aged 18-64 years) in real 1982-1984 dollars. Bold numbers indicate that the difference in coefficients between the <$8,000 and $8,000-12,000 columns are statistically significantly different from each other at the 10% level. Italicized numbers indicate that the difference in coefficients between the <$8,000 and $12,000-20,000 columns are statistically significantly different from each other at the 10% level.

31
Table 7 Sample Means (and standard deviations)
By Age and Education Level, 1979-2000, CPS Sample
Variable HSDO 18-29 GEHS 20-29 1979-1986 1987-2000 1979-1986 1987-2000 Received health ins from employer 0.439
(0.496) 0.259 (0.438)
0.614 (0.487)
0.486 (0.500)
Received pension from employer 0.186 (0.389)
0.114 (0.318)
0.330 (0.470)
0.273 (0.445)
Family health insurance coverage 0.216 (0.411)
0.135 (0.342)
0.263 (0.440)
0.256 (0.436)
Employer paid all of insurance 0.198 (0.398)
0.067 (0.251)
0.306 (0.461)
0.149 (0.356)
Employer paid all or part insurance 0.403 (0.490)
0.237 (0.426)
0.582 (0.493)
0.456 (0.498)
Pension plan was offered at firm 0.266 (0.442)
0.234 (0.424)
0.444 (0.497)
0.450 (0.498)
Age 23.107 (3.433)
23.351 (3.571)
24.137 (2.878)
24.357 (2.930)
Male 0.637 (0.481)
0.651 (0.477)
0.526 (0.499)
0.522 (0.500)
Married 0.484 (0.500)
0.387 (0.487)
0.480 (0.500)
0.395 (0.489)
White 0.640 (0.480)
0.492 (0.500)
0.818 (0.386)
0.740 (0.439)
Black 0.129 (0.335)
0.126 (0.332)
0.105 (0.307)
0.130 (0.337)
Hours last year 38.069 (10.590)
37.746 (10.388)
38.286 (10.053)
38.311 (10.415)
Percent Full time 0.803 (0.398)
0.789 (0.408)
0.818 (0.386)
0.797 (0.402)
Observation (N)
25304
32692 107621 138895
Notes: 1. Sample is restricted to respondents who worked for pay the previous year, and who worked in the private sector.
Results are weighted using population weights. 2. Survey questions related to health insurance and pensions provide information as to whether or not the workers was
covered by the employer’s policy, not whether the employer makes these benefits available 3. In 1995, information is not available on family health insurance or whether the full premium is paid by the employer.
Family coverage and whether employer paid health insurance premium are not restricted to only those with health insurance, as they are in the regression analysis.

32
Table 8
Sample Means by Wage Category and Time Period- NLSY Sample
Variable
Wage < $4.00 $4.00 ≤ Wage < $5.00 $5.00 ≤ Wage < $8.00
1979-82 1987-92 1979-82 1987-92 1979-82 1987-92 Health Insurance 0.320 0.466 0.554 0.673 0.729 0.816 Dental Insurance - 0.230 - 0.395 - 0.554 Paid Vacation 0.437 0.609 0.672 0.774 0.800 0.862 Sick Pay - 0.341 - 0.489 - 0.623 Education and Training Benefits
- 0.196 - 0.319 - 0.486
Regular Shift 0.733 0.826 0.811 0.872 0.866 0.875 Accident or Injury on the Job
- 0.084 - 0.092 - 0.085
Hourly Wage 3.42 3.26 4.44 4.49 6.11 6.35 Minimum Wage 3.74 2.94 3.75 2.95 3.69 2.96 Hours last week 31.60 39.45 35.80 40.93 39.27 41.57 Age 19.66 28.38 20.34 28.41 21.33 28.60 Male 0.437 0.414 0.487 0.485 0.614 0.450 Married 0.130 0.412 0.177 0.430 0.237 0.481 White 0.637 0.471 0.661 0.589 0.674 0.573 Black 0.214 0.166 0.171 0.324 0.167 0.249 N 3655 5257 3183 4837 3433 11794
Notes: 1. Sample is restricted to respondents who worked for pay at the time of the survey, who were not self-employed, and who
worked in the private sector. 2. Survey questions related to health insurance, dental insurance, and education benefits provide information as to whether or
not the employer makes these benefits available, and not if the employee had these benefits. Accident or injury refers to whether or not employee has an accident or injury on the job since the date of last interview.
3. The sample size listed in table refers to the maximum number of observations available for analysis. For some measures of fringe benefits, sample sizes are smaller due to missing information. In 1981, the NLSY did not collect information about fringe benefits. In 1987, information about the availability of education and training benefits was not collected. Information about job-related injuries was collected in 1988, 1989, 1990, and 1992.
4. Hourly wage and minimum wage are expressed in terms of real 1982-84 dollars.

33
Appendix
Table A1 OLS Estimates of Effects of a Minimum Wage on the Receipt of Fringe Benefits of Young Adults
By Education Category, 1979-1982 NLSY
Health Insurance (N=11421)
Education < 12 Education 12-15 Education ≥ 16
Minimum Wage
0.04 (0.04)
-0.20** (0.03)
-0.58** (0.13)
Paid Vacation (N=11413)
Minimum Wage
-0.08**
(0.04)
-0.18**
(0.03)
-0.53**
(0.14) Regular Shift (N=18336)
Minimum Wage
-0.14**
(0.03)
-0.11**
(0.03)
-0.14 (0.11)
Notes: (see notes 1-4 from Table 3).

34
Table A2 OLS Estimates of Effects of a Minimum Wage on the Receipt of Fringe Benefits of Young Adults
By Education Category, 1987-1992 NLSY
Health Insurance (N=32690)
Education < 12 Education 12-15 Education ≥ 16
Minimum Wage 0.03
(0.04) -0.002 (0.02)
-0.02 (0.03)
Dental Insurance (N=32526)
Minimum Wage
0.04
(0.05)
0.08**
(0.02)
0.03
(0.04) Paid Vacation (N=32516)
Minimum Wage
-0.01 (0.04)
0.02
(0.02)
-0.001 (0.02)
Sick Pay (N=31677)
Minimum Wage
-0.02 (0.04)
0.01
(0.02)
-0.08**
(0.03) Education & Training (N=26458)
Minimum Wage
0.08* (0.04)
0.07**
(0.02)
0.03
(0.04) Regular Shift (N=28102)
Minimum Wage
0.05* (0.03)
0.03
(0.02)
0.03
(0.03) Injury on the Job (N=23170)
Minimum Wage
-0.01 (0.03)
0.02
(0.01)
0.02
(0.02) Notes: (see notes 1-4 from Table 3).