navneet education...2017/06/28 · navneet education cmp rs. 170 target rs.220 rating buy...
TRANSCRIPT

Navneet Education
SOUMITRA CHATTERJEE
Vice President - Research
[email protected] +91 22 6176 6805
OMPRAKASH KAVADI
Analyst – Research
[email protected] +91 44 4344 0096
Navneet EducationCMP
Rs. 170
Target
Rs.220
Rating
BUY
Stock performance (%)
1m 3m 12m
NELI 1% 12% 83%
Sensex 0% 5% 17%
CNXIT -6% -7% -10%
Date 28th June 2017
SENSEX 30,958
Nifty 9,511
Bloomberg NELI IN
Shares o/s 234mn
Market Cap Rs.40bn
52-wk High-Low Rs.194-91
3m Avg. Daily Vol Rs.41mn
Index member BSE SMCAP
% Share holding
Promoters 61.8%
Institutions 21.2%
Public 17.0%
Initiating Coverage
Profitable syllabus
Financial summary
Year Revenues (Rs. mn) EBITDA (Rs. mn) PAT (Rs. mn) EPS (Rs.) P/E(x) RoE(%)
FY17 11,813 2,813 1,706 7.2 23.5 28.4%
FY18E 13,645 3,368 2,211 9.5 18.0 28.6%
FY19E 15,714 3,884 2,552 10.9 15.6 28.3%
FY20E 17,900 4,431 2,922 12.5 13.6 27.7%
Page 2
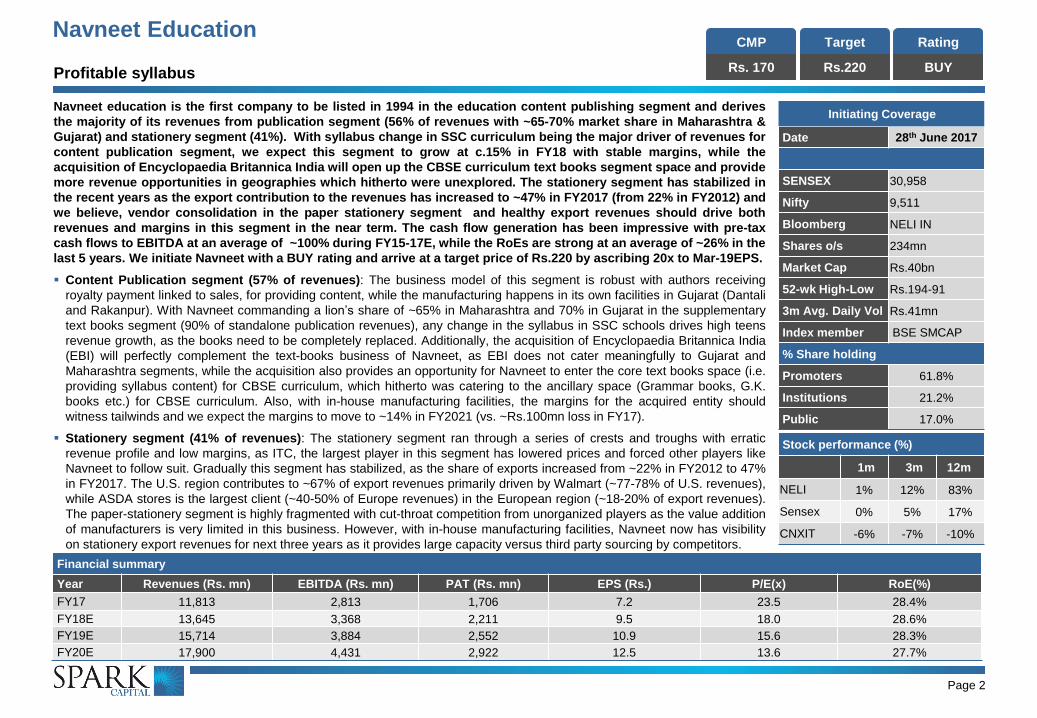
Navneet education is the first company to be listed in 1994 in the education content publishing segment and derives
the majority of its revenues from publication segment (56% of revenues with ~65-70% market share in Maharashtra &
Gujarat) and stationery segment (41%). With syllabus change in SSC curriculum being the major driver of revenues for
content publication segment, we expect this segment to grow at c.15% in FY18 with stable margins, while the
acquisition of Encyclopaedia Britannica India will open up the CBSE curriculum text books segment space and provide
more revenue opportunities in geographies which hitherto were unexplored. The stationery segment has stabilized in
the recent years as the export contribution to the revenues has increased to ~47% in FY2017 (from 22% in FY2012) and
we believe, vendor consolidation in the paper stationery segment and healthy export revenues should drive both
revenues and margins in this segment in the near term. The cash flow generation has been impressive with pre-tax
cash flows to EBITDA at an average of ~100% during FY15-17E, while the RoEs are strong at an average of ~26% in the
last 5 years. We initiate Navneet with a BUY rating and arrive at a target price of Rs.220 by ascribing 20x to Mar-19EPS.
Content Publication segment (57% of revenues): The business model of this segment is robust with authors receiving
royalty payment linked to sales, for providing content, while the manufacturing happens in its own facilities in Gujarat (Dantali
and Rakanpur). With Navneet commanding a lion’s share of ~65% in Maharashtra and 70% in Gujarat in the supplementary
text books segment (90% of standalone publication revenues), any change in the syllabus in SSC schools drives high teens
revenue growth, as the books need to be completely replaced. Additionally, the acquisition of Encyclopaedia Britannica India
(EBI) will perfectly complement the text-books business of Navneet, as EBI does not cater meaningfully to Gujarat and
Maharashtra segments, while the acquisition also provides an opportunity for Navneet to enter the core text books space (i.e.
providing syllabus content) for CBSE curriculum, which hitherto was catering to the ancillary space (Grammar books, G.K.
books etc.) for CBSE curriculum. Also, with in-house manufacturing facilities, the margins for the acquired entity should
witness tailwinds and we expect the margins to move to ~14% in FY2021 (vs. ~Rs.100mn loss in FY17).
Stationery segment (41% of revenues): The stationery segment ran through a series of crests and troughs with erratic
revenue profile and low margins, as ITC, the largest player in this segment has lowered prices and forced other players like
Navneet to follow suit. Gradually this segment has stabilized, as the share of exports increased from ~22% in FY2012 to 47%
in FY2017. The U.S. region contributes to ~67% of export revenues primarily driven by Walmart (~77-78% of U.S. revenues),
while ASDA stores is the largest client (~40-50% of Europe revenues) in the European region (~18-20% of export revenues).
The paper-stationery segment is highly fragmented with cut-throat competition from unorganized players as the value addition
of manufacturers is very limited in this business. However, with in-house manufacturing facilities, Navneet now has visibility
on stationery export revenues for next three years as it provides large capacity versus third party sourcing by competitors.

Navneet EducationCMP
Rs. 170
Target
Rs.220
Rating
BUY
PUBLISHING: Navneet provides supplementary books (work books, guides and 21 question sets) to students in Maharashtra and
Gujarat. It has also ventured into textbook publication for CBSE students across India and has recently acquired
Encyclopaedia Britannica India to cater to the CBSE text-books segment
STATIONERY: Provides paper and non-paper stationery across India through 85,000 retail outlets. Paper stationery accounts for 94%
of total stationery revenues, of which 45% are derived from exports.
E-LEARNING: This includes digital content for B2B and B2C segments. B2B products include digital content for state curriculum of
Maharashtra and Gujarat, while B2C products include Pendrives, CDs and Tablets loaded with State & CBSE curriculum
Company Background
Navneet is the leader in the text book publication business in India, with a 74%market share of the organized market. Three segments that
drive growth are:
Revenue mix trends for Navneet
Source: Company data, Spark Capital
EBIT mix trends for Navneet
Source: Company data, Spark Capital
Company at a glance
58.7% 58.6% 56.2% 56.7% 56.3% 57.5%
40.3% 40.5% 43.2% 43.1% 42.9% 41.8%
0%
20%
40%
60%
80%
100%
FY 2012 FY 2013 FY 2014 FY 2015 FY 2016 FY 2017
Publication Stationery Others
80.9% 76.8% 77.9% 78.9% 82.3% 80.3%
18.9% 22.8% 21.5% 20.9% 17.5% 19.1%
0%
20%
40%
60%
80%
100%
FY 2012 FY 2013 FY 2014 FY 2015 FY 2016 FY 2017
Publication Stationery Others

Navneet EducationCMP
Rs. 170
Target
Rs.220
Rating
BUYBusiness operations
Navneet provides educational syllabus based content in both print and digital medium, and also manufactures paper & non-paper stationery products. The
company commands a significant market share of c65% in the western India (65% in Maharashtra and 70% in Gujarat) in the supplementary text books
segment , focussed on the state syllabus . Navneet has also ventured into providing text books for CBSE and ICSE board students in states like A.P,
Karnataka, TN, Delhi NCR region and Kerala. Navneet has more than 225 authors and 2,500 titles under its brand.
Content Publishing
Stationery
e-Learning
Curriculum
Segment
Non-curriculum
Segment
Paper Stationery
Non-Paper Stationery
B2B
B2C
Supplementary
Books
Text Books
Workbooks
Digest/Guides
21 Most Likely
Questions
Export
Domestic
Outsourced and
sold pan India
Digital Content
57% of revenues
41% of revenues
2% of revenues
CBSE/ICSE books
Products like TOP
Class/TOP
Assessment
Pendrives, CDs,
Tablets
Acquired
Encyclopaedia
Britannica India in
Dec 2016 to cater to
the CBSE text-Books
market

Navneet EducationCMP
Rs. 170
Target
Rs.220
Rating
BUYCompany Financials
Revenue Break Down for Navneet – FY2017
Text books3%
CURRICULUM
Domestic51%
Exports49%
PAPER STATIONERY
Revenue break down for Curriculum segment
(47% of total revenues in FY2017)
Revenue breakdown of Paper Stationery
segment (40% of total revenues in FY2017)
Work book46%Digests/
Guides38%
21 Most Likely Questions
16%
Supplementary Books
97%
NON-CURRICULUM NON PAPER STATIONERY
E-LEARNING
OTHERS
BRITANNICA INDIA
46.9% 5.4% 3.6% 40.0%1.7%
1.9%
0.6%
Navneet EducationCMP
Rs. 170
Target
Rs.220
Rating
BUYThe in-house manufacturing setup is one of the key competitive advantage
Procurement of
Paper (Ex:TNPL)
Virar(Maharashtra)
MANUFACTURING
FACILITIES
WAREHOUSE
Content
Publishing
Manufacturing Paper
Stationery Products
Distributors(1,200+ Distributors)
Retailers(1,00,000+
Retail Outlets)
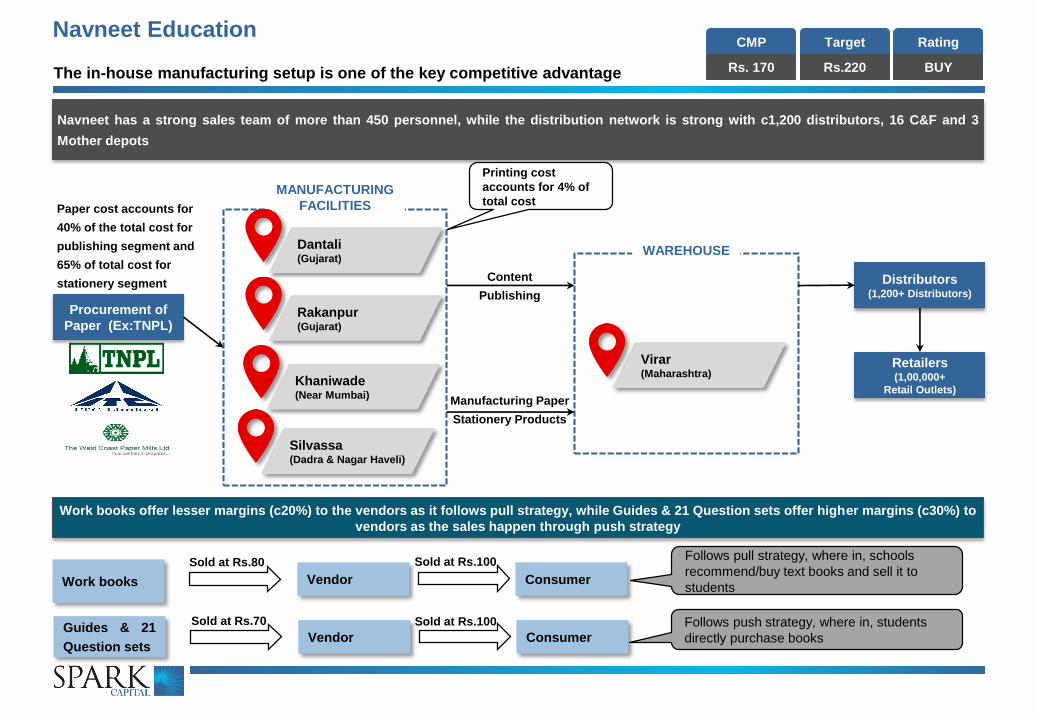
Navneet has a strong sales team of more than 450 personnel, while the distribution network is strong with c1,200 distributors, 16 C&F and 3
Mother depots
Khaniwade(Near Mumbai)
Rakanpur(Gujarat)
Silvassa(Dadra & Nagar Haveli)
Dantali(Gujarat)
Work books Vendor Consumer
Guides & 21
Question setsVendor Consumer
Sold at Rs.80
Sold at Rs.70
Sold at Rs.100
Sold at Rs.100
Work books offer lesser margins (c20%) to the vendors as it follows pull strategy, while Guides & 21 Question sets offer higher margins (c30%) to
vendors as the sales happen through push strategy
Follows push strategy, where in, students
directly purchase books
Follows pull strategy, where in, schools
recommend/buy text books and sell it to
students
Paper cost accounts for
40% of the total cost for
publishing segment and
65% of total cost for
stationery segment
Printing cost
accounts for 4% of
total cost

Navneet EducationCMP
Rs. 170
Target
Rs.220
Rating
BUYBusiness cycle
Oct-Dec Jan-Mar Apr-Jun Jul-Sep
Paper purchase contracts
Start of printing activity
Sales approx. 10-15%
Printing activity continues
Marketing activity starts for
next academic year
Sales approx. 15%
Printing activity continues
Major sale made approx. 50-
55%
Major debtors realized
Sales approx 15-20%
Huge manufacturing
expenditure
Inventory rises
Huge manufacturing
expenditure
Inventory at its peak
Short term borrowings from
banks
Highest revenue amongst all
quarters
Major profits realized
Thin balance sheet
Zero debt
Effect on P&L and Balance Sheet
Activities During the Quarter

Navneet EducationCMP
Rs. 170
Target
Rs.220
Rating
BUY
Working capital days trend for Navneet – Mar Year End
Source: Company data, Spark Capital
Working capital days trend for Navneet – Sep End
Source: Company data, Spark Capital
The working capital days are significantly lower for the first half period (Apr – Sep) compared to the full year numbers. This is primarily due to the fact that
the purchase of raw materials (paper) happens during Oct-Dec (Q3) quarter and the bulk of manufacturing happens during Q3 and Q4, while the sales
contribution is only c25-30% of total annual sales during Q3 and Q4. Inventory is at its peak during Q2, while this quarter also witnesses short term
borrowings from banks
Major debtors are realized during Jul-Sep (Q2) quarter, while the sales contribution during the first half of the year is c70-75%
As 1Q is the strongest quarter, working capital is high at the year end but looking at
the year end working capital figure can be misleading
292 286 300 294
246 250
0
50
100
150
200
250
300
350
FY12 FY13 FY14 FY15 FY16 FY17E
Debtor days Inventory days
Payable days Working Capital days
96
64
86 95
64 72
0
20
40
60
80
100
120
140
FY12 FY13 FY14 FY15 FY16 FY17
Debtor days Inventory days
Payable days Working Capital days

Navneet EducationCMP
Rs. 170
Target
Rs.220
Rating
BUYPublication segment (standalone) – 50.4% of total revenues during FY2017
Revenue and EBIT trends for publication segment*
Source: Company data, Spark Capital. *Standalone
Revenue break up for publication segment* - FY 2017
Source: Company data, Spark Capital. *Standalone
School Education
System
National Board
SSC 15,22,301
CBSE 18,840
ICSE 2,275
International Board
CIE (IGCSE) 316
IB 143
99% of total schools in India are
governed by state education boards
and Navneet is focussed in this
segment
The total market size of print content
industry in India is cINR 135 billion
and is growing at a rate of 12% per
annum
Navneet has a market share of 65% in
Maharashtra and 70% in Gujarat in
the supplementary text books
segment. Together, Maharashtra and
Gujarat have 1.6 lakh schools (64%
government and 36% private)
SCHOOL EDUCATION SYSTEM IN INDIA
32.7%33.0%
33.6%34.4%
33.9%
35.8%
31.0%
32.0%
33.0%
34.0%
35.0%
36.0%
37.0%
0
1,000
2,000
3,000
4,000
5,000
6,000
7,000
FY 2012 FY 2013 FY 2014 FY 2015 FY 2016 FY 2017
Rs in
mill
ion
Revenues EBIT EBIT margin (%)
Text books
3%
Non-Curriculum segment
7%
Work books42%
Digests/Guides34%
21 Most Likely Questions
14%
Supplementary books89%
24%
24%20%
17%
3%
6%
Classes I to IV Classes V to VII Classes VIII-IX
Class X Class XI Class XII
Revenue distribution of curriculum segment

Navneet EducationCMP
Rs. 170
Target
Rs.220
Rating
BUYThe target market for Navneet in the supplementary books segment stands at
1,60,048 (schools) which run on state board curriculum in Maharashtra and Gujarat
The distribution of state board schools across India for the academic year 2015-16
Source: Company data, Spark Capital
1,07,62452,424
-
50,000
1,00,000
1,50,000
2,00,000
2,50,000
3,00,000
Nu
mb
er
of
sch
oo
ls
Government schools Private Schools
Target Market
Total schools = 15,22,301
Total government schools = 11,48,738
Total private schools = 3,73,563
The total number of schools which run on state board curriculum in India stand at 15,22,301, out of which, 11,48,738 are
government schools and 3,73,563 are private schools. Navneet caters to only Maharashtra and Gujarat regions in the
supplementary books segment and hence the target market size is 1,60,048 schools
Current market
share is ~65-70%

Navneet EducationCMP
Rs. 170
Target
Rs.220
Rating
BUY
Navneet is ring-fencing its existing revenue stream (SSC Board) while also adding
new revenue streams (CBSE and ICSE) at the same time
Publication Segment
(Standalone)
Curriculum Segment
(93% of Revenues)
Non-curriculum
Segment
(7% of Revenues)
Domestic
(46%)
Exports
(54%)
Supplementary
(90% of Revenues)
Guides/Digest
(38%)
Workbooks
(46%)
21 Most Likely
Questions (16%)65% market share in
Maharashtra and 70%
market share in Gujarat
Std
I - X
Std
VI - X
Std
X - XII
Text Books
(3% of Revenues)
Caters to CBSE
curriculum in
Maharashtra, Gujarat,
A.P., Karnataka, Tamil
Nadu, Kerala & NCR
Caters to Children
and General Books
Text books
offered for grades
Kinder Garden
to VII
e-Learning
B2B & B2C
Top Class
Top Assessment
Top Scorer
B2B products for state curriculum in Maharashtra & Gujarat
Currently, B2B products are installed in 3,500 institutions covering 20,000 classrooms
Pendrives, Tablets, CDs for State and CBSE curriculum
Retail Consumption
Anganwadi
Tribal Development
Women & Child
Development
Govt Orders
Subsidiary
Focused towards State
Board Curriculum in
Maharashtra & Gujarat
2% of revenues in FY17
50.4% of revenues in FY17

Navneet EducationCMP
Rs. 170
Target
Rs.220
Rating
BUYUnderstanding the key drivers of various sub-segments with Publication segment
Supplementary Books Private schools Government Orders CBSE Textbooks
Segment started 1959 2012 2013
Target Market Private schools in Maharashtra and Gujarat Government schools in MaharashtraPAN India CBSE Schools / CBSE Pattern
Schools. Also venturing into ICSE schools
Curriculum Supplementary books for private schools Supplementary books for government schoolsTextbooks for CBSE affiliated and CBSE pattern
schools
Market size Total market size is for the publishing segment is cRs.135bn and is growing at a rate of 12% PA
Navneet's Market
share
65% market share in Maharashtra and 70%
market share in GujaratNot available 0.7%
Drivers of revenueChange in syllabus. Good visibility over the next
two years
Existing orders from Anganwadi, Women and
child welfare department and Tribal department
Growing in existing states and adding new
states
Revenues Rs.4,592mn (FY 16) Rs. 12mn (FY17), Nil (FY 16), Rs.12mn (FY 15)Rs.206mn (Rs.150m from Maharashtra and
Gujarat) during FY 16
Number of schools 56,940 (in Maharashtra and Gujarat) 1,03,108 (in Maharashtra and Gujarat) 18,840 (all over India)
Sales model
Push and Pull - workbooks are recommended
by school and bought by students but guides
and 21 question sets bought directly by students
and not recommended
Push - government places orders and Navneet
delivers to the government
The school recommends / buys text books in
most case and sells to students
Author credentials Doesn't go in books Doesn't go in booksNot disclosed in books till now but will start from
next academic year
Products Work books, guides and 21 question sets Workbooks and guides as of now Currently only selling textbooks to schools

Navneet EducationCMP
Rs. 170
Target
Rs.220
Rating
BUYGrowth drivers continued…
Any change in the state syllabus in the states of Maharashtra and Gujarat, where Navneet holds market share of c65%, will have a
significant impact on the revenues, as the old books need to be replaced with new books
Change in Syllabus
Increase in government spending towards Anganwadi, Tribal development, women and child development initiatives will result in increased
business opportunity
Government Spending/ Initiatives
CBSE pattern schools are those institutions where in, CBSE content is used to teach students from Grade I to Grade VIII and SSC content
for higher grades. Many of the english medium private SSC schools have started to adopt this practice and use private publisher’s text
books for the CBSE content.
There are c17,315 CBSE schools in India, representing huge potential for Navneet to tap revenues from this space
Navneet has already ventured into states like A.P, Karnataka, Kerala, NCR regions
CBSE Pattern Schools
Only 3,000 schools out of 39,000 private schools have been taped in Maharashtra and Gujarat, implying huge potential for further
expansion within these two states and in other states
The acceptability of digitally represented text book content is growing among teachers and students as it is easy to use, access and
circulate
E-Learning

Navneet EducationCMP
Rs. 170
Target
Rs.220
Rating
BUYChange in syllabus – Past, Present and Proposed
PAST ACADEMIC YEAR MAHARASHTRA GUJARAT
2015-2016
STANDARDS SUBJECTS STANDARDS SUBJECTS
V All Subjects (All Mediums) I All Subjects (English & Hindi Medium)
III All Subjects (English & Hindi Medium)
IV All Subjects (English & Hindi Medium)
V All Subjects (English & Hindi Medium)
PAST ACADEMIC YEAR MAHARASHTRA GUJARAT
2016-2017
STANDARDS SUBJECTS STANDARDS SUBJECTS
VI All Subjects (All Medium) IX All Subjects except Maths, Science, Sanskrit & Computer (All Medium)
IX Marathi & Hindi (Paper Pattern) XI All Commerce and All Arts Subjects (All Medium)
X Marathi & Hindi (Paper Pattern)
CURRENT ACADEMIC YEAR MAHARASHTRA GUJARAT
2017-2018
STANDARDS SUBJECTS STANDARDS SUBJECTS
VII All Subjects (All Medium) X All subjects Except Maths, Science, Sanskrit & Computer (All Medium)
IX All Subjects (All Medium) XII All Commerce and All Arts Subjects (All Medium)
ACADEMIC YEAR MAHARASHTRA GUJARAT
2018-2019
STANDARDS SUBJECTS STANDARDS SUBJECTS
VIII All Subjects (All Medium) IX Maths, Science, English (All medium) as per NCERT
X All Subjects (All Medium) XI Maths, Physics, Chemistry, Biology, English (All Medium) as per NCERT

Navneet EducationCMP
Rs. 170
Target
Rs.220
Rating
BUYAcquisition of Britannica India provides much needed diversification of revenues
Britannica India turnover (Rs in million)
Source: Company data, Spark Capital
Product catalogue of Britannica India
Source: Company data, Spark Capital
Products
Digital
Curriculum Books
Reference Books
Dictionaries & Thesaurus
Online
Software
Language Lab
Britannica Kids
Britannica Image Quest
Encyclopaedia
Biographies
Earth & Nature
Navneet announced the acquisition of Encyclopedia Britannica India
(EBI) on Oct 26, 2016 for a cash consideration of Rs.85-90cr and
completed the acquisition by Dec 31, 2016
EBI designs and develops educational products for the India-specific
curriculum catering to around 5m students across India and Indian
schools abroad. EBI started its publishing operations in India in 2009
Britannica India will be an independent company within Navneet.
Navneet will market Britannica’s existing titles like “Know for Sure” and
“The English Channnel”, while also developing new titles under
Britannica brand, editorial supervision and guidelines for 7 years
Navneet can venture into the core text books
segment of CBSE/ICSE curriculum
The EBITDA margins of Britannica India
business can be improved from current levels of
c10% to c20%
The digital capabilities of Britannica India can
complement the e-Learning business of
Navneet
Synergies/benefits
to Navneet
458
600
749715
0
100
200
300
400
500
600
700
800
FY 2014 FY 2015 FY2016 FY2017

Navneet EducationCMP
Rs. 170
Target
Rs.220
Rating
BUY
With Britannica’s products mostly focussed towards CBSE and ICSE curriculum, the acquisition of Britannica will help Navneet to strengthen itspresence in the CBSE and ICSE curriculum space. Currently, Navneet garners ~3% of revenues from the CBSE/ICSE segment
At present Navneet caters to the CBSE curriculum only in the ancillary space, for example Grammar books, General Knowledge books etc.With the acquisition of Britannica, Navneet will be able to get into the space of core text books for CBSE, for example text books onscience, maths etc
Britannica does not have in-house manufacturing facilities unlike Navneet. Britannica outsources the publishing work, resulting in EBITDAmargins of only c10%. With Navneet’s acquisition of Britannica India, the EBITDA margins for Britannica India business will be increasedto c20% from the current levels of c10%, as Navneet can use its in-house content manufacturing facilities for the Britannica Indiabusiness
Navneet will be able to use the brand of Britannica and have access to new markets
Navneet can use the digital technology capabilities of Britannica to compliment the e-learning business
Navneet benefits from acquisition of Britannica India in multiple ways
Total schools
accessed by sales
team, 14000, 70%
Clients as on date,
6000, 30%
Total schools
accessed by sales
team, 3000, 86%
Clients as on date, 500, 14%
The sales team hit rate is ~30% for Britannica and ~14% for Navneet, leaving huge scope for conversion
of sales team efforts to actual revenues
Britannica Navneet
Britannica India business
generates only 3% of
revenues from
Maharashtra and Gujarat
in the CBSE books
segment, which is highly
complementary to the
business of Navneet,
which derives sales
predominantly from
Maharashtra and Gujarat

Navneet EducationCMP
Rs. 170
Target
Rs.220
Rating
BUYStationery segment – A detailed overview
Stationery
Paper Stationery
Domestic
Non-paper Stationery
Exports(Middle East, Europe, Africa, USA and South America)
70% manufactured in-house
and the rest is outsourced
Products like notebooks, long
books, drawing books, writing
pads, index cards etc
Products like pencils, erasers,
sharpeners, crayons, geometry
sets, rulers, dough, color,
pastels etc
Outsourced completely and sold pan India42% of total revenues in
FY17
Revenue and EBIT margin trends for Stationery segment
Source: Company data, Spark Capital
Revenue break down for paper stationery segment (96% of total
stationery revenues in FY17)
Source: Company data, Spark Capital
96% of revenues in FY17
4% of revenues in FY17
10.3%
13.5%
11.7% 11.6%
8.9%
11.2%
0%
2%
4%
6%
8%
10%
12%
14%
16%
0
1,000
2,000
3,000
4,000
5,000
6,000
FY 2012 FY 2013 FY 2014 FY 2015 FY 2016 FY 2017
Rs in
mill
ion
Revenues EBIT EBIT margin (%)
Domestic, 51%Exports, 49%

Navneet EducationCMP
Rs. 170
Target
Rs.220
Rating
BUY
Increasing proportion of export revenues in stationery segment
Source: Company data, Spark Capital
Revenue visibility is at its peak driven by exports which is bolstered by in-house
manufacturing capabilities versus outsourced supply of competitors
Description Paper Stationery Non-Paper Stationery
Manufacturing Manufactured In-house Outsourced
marketFragmented market with 85% market
share by unorganized players
Well established market with c65% market
share by branded players
Market size Rs. 100bn Rs. 50bn
Organized player's market share 15% 60%
Navneet's market share in
organized market15% 1.50%
High margin export orders to drive the stationery segment revenues and margins going ahead
Naveneet has two manufacturing
plants for paper stationery at Silvassa
and Khaniwade (near Mumbai) which
has a capacity to produce 150 tons per
day. It also outsources manufacturing
from Vapi, Vasai, Kanpur and
Bangalore
Paper and Non-Paper stationery
markets are growing at a rate of 15%
pa
The stationery segment has been a ROE dilutive segment with erratic
growth profile and lower margins/ROCE. ITC, the largest player in this
segment, has driven down prices and this in turn has forced players like
Navneet to cut prices.
However, things have improved with exports picking up in stationery
segment. The exports contribution to the stationery revenues increased
from 22% in FY 2012 to 47% in FY 2017
22%35% 34% 40% 43% 47%
78%65% 66% 60% 57% 53%
0%
20%
40%
60%
80%
100%
FY2012 FY2013 FY2014 FY2015 FY2016 FY2017
Exports Domestic

Navneet EducationCMP
Rs. 170
Target
Rs.220
Rating
BUYFinancial performance
EBITDA margins recovered to 23.8% in FY17 post dipping in FY16
driven by negative growth in revenues
Source: Company data, Spark Capital
Healthy margin trends
Source: Company data, Spark Capital
Change in working capital trends (Rs.mn) – FY17 cash flows
impacted due to high negative working capital delta
Source: Company data, Spark Capital
Working capital days reduced by ~40 days during FY12-17
Source: Company data, Spark Capital
21.7%
23.6% 23.6%
24.2%
21.6%
23.8%
20%
21%
21%
22%
22%
23%
23%
24%
24%
25%
0
2000
4000
6000
8000
10000
12000
14000
FY 2012 FY 2013 FY 2014 FY 2015 FY 2016 FY 2017
Rs in
mill
ion
Revenues EBITDA % margin
292 286 300 294
246 250
0
50
100
150
200
250
300
350
FY12 FY13 FY14 FY15 FY16 FY17E
Debtor days Inventory days
Payable days Working Capital days
-412 -281
-33
-193
-549 -658
-889
-100
542
-777 -1,000
-800
-600
-400
-200
0
200
400
600
800
FY08 FY09 FY10 FY11 FY12 FY13 FY14 FY15 FY16 FY17E
20.1% 20.7% 21.7%23.6% 23.6% 24.2%
21.6%23.8%
17.7% 18.3% 18.9%20.7% 20.7% 21.1%
18.6%
21.4%
12.0% 11.8% 12.6% 13.2% 13.1% 13.3%10.9%
14.4%
0.0%
5.0%
10.0%
15.0%
20.0%
25.0%
30.0%
FY 2010 FY 2011 FY 2012 FY 2013 FY 2014 FY 2015 FY 2016 FY 2017
EBITDA EBIT PAT

Navneet EducationCMP
Rs. 170
Target
Rs.220
Rating
BUY
Cash at the end of FY17 improved to Rs.97m from Rs.55m in FY15
Source: Company data, Spark Capital
Return on Equity is strong at an average of ~26% during FY12-17
Source: Company data, Spark Capital
Pre-tax CFO witnessed healthy trends during FY14-16, but dipped in
FY17 due to high negative working capital delta
Source: Company data, Spark Capital
FCF as % of PAT at an average of ~97% during FY15-17E
Source: Company data, Spark Capital
52%
75%
98%86%
62% 66%58%
96%
131%
72%
0%
20%
40%
60%
80%
100%
120%
140%
0
500
1,000
1,500
2,000
2,500
3,000
FY08 FY09 FY10 FY11 FY12 FY13 FY14 FY15 FY16 FY17E
Rs. in
mill
ion
Pre Tax CFO EBITDA Pre Tax CFO as % of EBITDA
-30%
61%
80%
29%
-10%
34%
14%
111%
136%
44%
-40%
0%
40%
80%
120%
160%
-500
0
500
1,000
1,500
2,000
FY08 FY09 FY10 FY11 FY12 FY13 FY14 FY15 FY16 FY17E
Rs. in
mill
ion
FCF PAT FCF as % of PAT
25%23% 23%
22%23%
28%26% 26%
22%
28%
0%
5%
10%
15%
20%
25%
30%
0
1,000
2,000
3,000
4,000
5,000
6,000
7,000
8,000
FY08 FY09 FY10 FY11 FY12 FY13 FY14 FY15 FY16 FY17E
Rs. in
mill
ion
Equity PAT Average ROE
5
27 30
2
-63
-17
36
-14
4
39 53
80
110 112
50 35
71 55 59
97
-80
-60
-40
-20
-
20
40
60
80
100
120
140
FY08 FY09 FY10 FY11 FY12 FY13 FY14 FY15 FY16 FY17
Change in cash & cash equivalents Cash at end of period
The return on equity is strong at an average of ~26% during FY12-17

Navneet EducationCMP
Rs. 170
Target
Rs.220
Rating
BUYFinancial Summary
Abridged Financial Statements Key metrics
Rs. mn FY17 FY18E FY19E FY20E FY21E FY17 FY18E FY19E FY20E FY21E
Profit & Loss Cash flows
Revenue 11,813 13,645 15,714 17,900 20,186 Cash flow from operations 1,204 1,896 2,110 2,291 2,594
Cost of Material and Manuf expenses 6,132 7,107 8,195 9,346 10,579 Cash flow from investing -963 -280 -292 -300 -300
Employee costs 1,187 1,384 1,610 1,852 2,108 Cash flow from financing -203 -1,030 -1,192 -1,369 -1,550
Gross profit 4,495 5,154 5,909 6,702 7,498 Free cash flow 792 1,496 1,710 1,891 2,194
Admin & Other expenses 1,682 1,786 2,026 2,272 2,521 Change in Cash 39 586 626 622 744
Total expenses 9,001 10,277 11,830 13,470 15,209 Cash at yr-end 97 683 1,309 1,931 2,676
EBITDA 2,813 3,368 3,884 4,431 4,977 Growth
Depreciation and amortisation 284 309 336 362 388 Revenues 24.4% 15.5% 15.2% 13.9% 12.8%
EBIT 2,529 3,058 3,548 4,069 4,589 EBITDA 36.8% 19.7% 15.3% 14.1% 12.3%
Other income 152 120 108 100 100 PAT 65.0% 29.6% 15.5% 14.5% 13.0%
PBT 2,638 3,133 3,609 4,119 4,637 EPS 66.7% 30.9% 15.5% 14.5% 13.0%
Taxes 827 988 1,138 1,299 1,462 Margins
Associate income and minority interests -105 65 81 102 127 EBITDA 23.8% 24.7% 24.7% 24.8% 24.7%
PAT 1,706 2,211 2,552 2,922 3,302 EBIT 21.4% 22.4% 22.6% 22.7% 22.7%
EPS (Rs) 7.2 9.5 10.9 12.5 14.1 PAT 14.4% 16.2% 16.2% 16.3% 16.4%
Balance sheet Return
Shareholders' equity 6,938 8,084 9,408 10,924 12,636 ROE 28.4% 28.6% 28.3% 27.7% 27.0%
Deferred tax liabilities 24 24 24 24 24 ROCE 32.8% 33.4% 33.9% 34.0% 33.6%
Total liabilities and equity 8,704 9,930 11,337 12,940 14,745 Valuation
Fixed assets 1,864 1,955 2,019 2,057 2,070 Shares outstanding (mn) 234 234 234 234 234
Investments 447 447 447 447 447 Market cap (Rs. mn) 39,705 39,705 39,705 39,705 39,705
Long term loans and advances 54 54 54 54 54 EV (Rs.mn) 41,202 40,695 40,153 39,619 38,967
Sundry debtors 2,781 3,212 3,570 4,067 4,586 EV/Sales (x) 3.5 3.0 2.6 2.2 1.9
Cash and bank Balance 97 683 1,309 1,931 2,675 EV/EBITDA (x) 14.6 12.1 10.3 8.9 7.8
Current assets 7,243 8,885 10,465 12,259 14,288 P/E (x) 23.5 18.0 15.6 13.6 12.0
Current liabilities 1,399 1,489 1,643 1,782 1,928 P/B (x) 5.7 4.9 4.2 3.6 3.1
Provisions 130 546 629 718 810 EPS(E) / Current market price 0.0 0.1 0.1 0.1 0.1
Net current assets 5,845 7,397 8,822 10,476 12,360 DSO days 86 86 83 83 83
Total assets 8,704 9,930 11,337 12,940 14,745 Net working capital days 265 265 255 253 253

Navneet – Crystal ball Gazing chart
Navneet is
expected to
grow its
revenues and
PAT by 14% and
18%
respectively
during FY17-
21E . EBITDA
margins are
likely to
improve to
24.7% by FY21
from 23.8% in
FY17
Revenue growth
driven by change in
syllabus for
publishing segment
and increase in
export revenues for
stationery segment
Continued
revenue
growth of
c14%
Almost
stable
EBITDA
margins will
result in
Consistent
growth and
stable margins
would drive
Entry = Rs. 170@ 18x FY18E P/E
Cumulative Dividends of
Rs. 19
Exit multiple of 20x FY21E
EPS
TOTAL RETURN OF
1.8x
FY11 FY16 FY17 FY18E FY19E FY20E FY21E
Revenue 5,608 9,498 11,813 13,645 15,714 17,900 20,186 ▲
Ebitda 1,163 2,056 2,813 3,368 3,884 4,431 4,977 ▲
Margins 20.7% 21.6% 23.8% 24.7% 24.7% 24.8% 24.7% ▲
PAT 660 1,034 1,706 2,211 2,552 2,922 3,302 ▲
FY11 FY16 FY17 FY18E FY19E FY20E FY21E
RoE 21.5% 22.1% 28.4% 28.6% 28.3% 27.7% 27.0% ►◄
Leverage 0.2 0.2 0.2 0.1 0.0 0.0 -0.1 ▼
DSO 56 73 86 86 83 83 83 ▼
CFO (Rs in m) 601 1,942 1,204 1,896 2,110 2,291 2,594 ▲
Better cash flow from
operations and
strong Return on
Equity
Higher multiple
Page 22
FY11-17 CAGR %
Revenue EBITDA PAT Price
13.2 15.9 17.1 21
Trading History – % of times stock traded
PE range<10x 10x-12x 12x-14x 14x-16x >16x
14 12 31 26 10
P/E FY 21 EPS Price
20 14.1 283 ▲

Disclaimer
Page 23
Spark Disclaimer
Spark Capital Advisors (India) Private Limited (Spark Capital) and its affiliates are engaged in investment banking, investment advisory and institutional equities and
infrastructure advisory services. Spark Capital is registered with SEBI as a Stock Broker and Category 1 Merchant Banker.
We hereby declare that our activities were neither suspended nor we have defaulted with any stock exchange authority with whom we are registered in the last five years. We
have not been debarred from doing business by any Stock Exchange/SEBI or any other authorities, nor has our certificate of registration been cancelled by SEBI at any point of
time.
Spark Capital has a subsidiary Spark Investment Advisors (India) Private Limited which is engaged in the services of providing investment advisory services and is registered
with SEBI as Investment Advisor. Spark Capital has also an associate company Spark Infra Advisors (India) Private Limited which is engaged in providing infrastructure
advisory services.
This document does not constitute or form part of any offer or solicitation for the purchase or sale of any financial instrument or as an official confirmation of any transaction.
This document is provided for assistance only and is not intended to be and must not alone be taken as the basis for an investment decision. Nothing in this document should
be construed as investment or financial advice, and nothing in this document should be construed as an advice to buy or sell or solicitation to buy or sell the securities of
companies referred to in this document.
Each recipient of this document should make such investigations as it deems necessary to arrive at an independent evaluation of an investment in the securities of companies
referred to in this document (including the merits and risks involved), and should consult its own advisors to determine the merits and risks of such an investment. This
document is being supplied to you solely for your information and may not be reproduced, redistributed or passed on, directly or indirectly, to any other person or published,
copied, in whole or in part, for any purpose. This report is not directed or intended for distribution to or use by any person or entity who is a citizen or resident of or located in
any locality, state, country or other jurisdiction, where such distribution, publication, availability or use would be contrary to law, regulation or which would subject Spark Capital
and/or its affiliates to any registration or licensing requirement within such jurisdiction. The securities described herein may or may not be eligible for sale in all jurisdictions or to
a certain category of investors. Persons in whose possession this document may come are required to inform themselves of and to observe such applicable restrictions. This
material should not be construed as an offer to sell or the solicitation of an offer to buy any security in any jurisdiction where such an offer or solicitation would be illegal.
Spark Capital makes no representation or warranty, express or implied, as to the accuracy, completeness or fairness of the information and opinions contained in this
document. Spark Capital , its affiliates, and the employees of Spark Capital and its affiliates may, from time to time, effect or have effected an own account transaction in, or
deal as principal or agent in or for the securities mentioned in this document. They may perform or seek to perform investment banking or other services for, or solicit
investment banking or other business from, any company referred to in this report.
This report has been prepared on the basis of information, which is already available in publicly accessible media or developed through an independent analysis by Spark
Capital. While we would endeavour to update the information herein on a reasonable basis, Spark Capital and its affiliates are under no obligation to update the information.
Also, there may be regulatory, compliance or other reasons that prevent Spark Capital and its affiliates from doing so. Neither Spark Capital nor its affiliates or their respective
directors, employees, agents or representatives shall be responsible or liable in any manner, directly or indirectly, for views or opinions expressed in this report or the contents
or any errors or discrepancies herein or for any decisions or actions taken in reliance on the report or the inability to use or access our service in this report or for any loss or
damages whether direct or indirect, incidental, special or consequential including without limitation loss of revenue or profits that may arise from or in connection with the use of
or reliance on this report.
Absolute
Rating
Interpretation
BUY Stock expected to provide positive returns of >15% over a 1-year horizon REDUCEStock expected to provide returns of <5% – -10% over a 1-year
horizon
ADDStock expected to provide positive returns of >5% – <15% over a 1-year
horizonSELL Stock expected to fall >10% over a 1-year horizon

Disclaimer (Cont’d)
Page 24
Spark Capital and/or its affiliates and/or employees may have interests/positions, financial or otherwise in the securities mentioned in this report. To enhance transparency,
Spark Capital has incorporated a disclosure of interest statement in this document. This should however not be treated as endorsement of views expressed in this report:
Disclosure of interest statement Yes/No
Analyst financial interest in the company No
Group/directors ownership of the subject company covered No
Investment banking relationship with the company covered No
Spark Capital’s ownership/any other financial interest in the company covered No
Associates of Spark Capital’s ownership more than 1% in the company covered No
Any other material conflict of interest at the time of publishing the research report No
Receipt of compensation by Spark Capital or its Associate Companies from the subject company covered for in the last twelve months:
Managing/co-managing public offering of securities
Investment banking/merchant banking/brokerage services
products or services other than those above
in connection with research report
No
Whether Research Analyst has served as an officer, director or employee of the subject company covered No
Whether the Research Analyst or Research Entity has been engaged in market making activity of the Subject Company; No
Analyst Certification of Independence
The views expressed in this research report accurately reflect the analyst’s personal views about any and all of the subject securities or issuers; and no part of the research
analyst’s compensations was, is or will be, directly or indirectly, related to the specific recommendation or views expressed in the report.
Additional Disclaimer for US Institutional Investors
This research report prepared by Spark Capital Advisors (India) Private Limited is distributed in the United States to US Institutional Investors (as defined in Rule 15a-6 under
the Securities Exchange Act of 1934, as amended) only by Auerbach Grayson, LLC, a broker-dealer registered in the US (registered under Section 15 of Securities Exchange
Act of 1934, as amended). Auerbach Grayson accepts responsibility on the research reports and US Institutional Investors wishing to effect transaction in the securities
discussed in the research material may do so through Auerbach Grayson. All responsibility for the distribution of this report by Auerbach Grayson, LLC in the US shall be borne
by Auerbach Grayson, LLC. All resulting transactions by a US person or entity should be effected through a registered broker-dealer in the US. This report is not directed at you
if Spark Capital Advisors (India) Private Limited or Auerbach Grayson, LLC is prohibited or restricted by any legislation or regulation in any jurisdiction from making it available
to you. You should satisfy yourself before reading it that Auerbach Grayson, LLC and Spark Capital Advisors (India) Private Limited are permitted to provide research material
concerning investment to you under relevant legislation and regulations;