nature of the sample: marist poll of 1012 national...
TRANSCRIPT

How the Survey was Conducted
Nature of the Sample: Marist Poll of 1012 National Adults This survey of 1,012 adults was conducted February 5th through February 7th, 2018 by The Marist Poll. Adults 18 years of age and older residing in the contiguous United States were contacted on landline or mobile numbers and interviewed in English by telephone using live interviewers. Mobile telephone numbers were randomly selected based upon a list of telephone exchanges from throughout the nation from Survey Sampling International. The exchanges were selected to ensure that each region was represented in proportion to its population. Mobile phones are treated as individual devices. After validation of age, personal ownership, and non-business-use of the mobile phone, interviews are typically conducted with the person answering the phone. To increase coverage, this mobile sample was supplemented by respondents reached through random dialing of landline phone numbers from ASDE Survey Sampler, Inc. Within each landline household, a single respondent is selected through a random selection process to increase the representativeness of traditionally under-covered survey populations. Assistance was provided by Luce Research for data collection. The samples were then combined and balanced to reflect the 2016 American Community Survey 1-year estimates for age, gender, income, race, and region. Results are statistically significant within ±3.7 percentage points. There are 807 registered voters. The results for this subset are statistically significant within ±4.1 percentage points. The error margin was adjusted for sample weights and increases for cross-tabulations.

National Adults National Registered Voters
Col % Col %
100%
80% 100%Democrat n/a 33%Republican n/a 26%Independent n/a 40%Other n/a 1%Strong Democrats n/a 24%Not strong Democrats n/a 9%Democratic leaning independents n/a 17%Just Independents n/a 9%Republican leaning independents n/a 14%Not strong Republicans n/a 9%Strong Republicans n/a 17%Other n/a 1%Very liberal n/a 11%Liberal n/a 21%Moderate n/a 32%Conservative n/a 24%Very conservative n/a 12%Men 49% 46%Women 51% 54%Under 45 46% 39%45 or older 54% 61%18 to 29 22% 16%30 to 44 25% 23%45 to 59 26% 30%60 or older 28% 32%White 62% 66%African American 11% 12%Latino 14% 12%Other 12% 10%Northeast 18% 18%Midwest 21% 22%South 38% 37%West 23% 23%Less than $50,000 44% 41%$50,000 or more 56% 59%Not college graduate 57% 54%College graduate 43% 46%White - Not College Graduate 35% 34%White - College Graduate 27% 32%Non-White - Not College Graduate 22% 19%Non-White - College Graduate 16% 15%
20% 22%Landline 38% 43%Cell phone 62% 57%
Marist Poll National Adults. Interviews conducted February 5th through February 7th, 2018, n=1012 MOE +/- 3.7 percentage points. National Registered Voters: n=807 MOE +/- 4.1 percentage points. Totals may not add to 100% due to rounding.
Nature of the Sample
Education by Race
White Evangelical Christians
Interview Type
Age
Race
Region
Household Income
Education
Party Identification
Party Identification
Political Ideology
Gender
Age
National Adults
National Registered Voters

Approve Disapprove UnsureRow % Row % Row %
38% 54% 7%
39% 56% 5%Democrat 7% 91% 2%Republican 87% 10% 4%Independent 34% 58% 8%Strong Democrats 5% 94% 1%Soft Democrats 6% 88% 5%Just Independents 24% 58% 18%Soft Republicans 73% 19% 8%Strong Republicans 98% 2% 0%Very liberal-Liberal 6% 90% 4%Moderate 32% 64% 5%Conservative-Very conservative 76% 18% 6%
92% 5% 3%Northeast 35% 61% 4%Midwest 41% 50% 9%South 42% 50% 8%West 32% 61% 7%Less than $50,000 34% 56% 11%$50,000 or more 41% 55% 4%Not college graduate 41% 49% 9%College graduate 34% 62% 5%White 45% 49% 6%African American 14% 82% 4%Latino 32% 63% 6%White - Not College Graduate 51% 42% 7%White - College Graduate 36% 60% 4%18 to 29 31% 59% 10%30 to 44 33% 59% 8%45 to 59 45% 50% 5%60 or older 42% 51% 7%Under 45 32% 59% 9%45 or older 43% 51% 6%Men 44% 48% 9%Women 33% 61% 6%
69% 24% 7%Landline 43% 48% 9%Cell phone 36% 58% 6%
National Registered Voters
Party Identification^
Party Identification*
Political Ideology^
Trump Supporters
TRUDP105. Marist Poll National Tables February 2018
National AdultsDo you approve or disapprove of the job Donald Trump is doing as
president?
National Adults
Age
Age
Gender
White Evangelical Christians
Interview Type
Region
Household Income
Education
Race
Race and Education
Marist Poll National Adults. Interviews conducted February 5th through February 7th, 2018, n=1012 MOE +/- 3.7 percentage points.^National Registered Voters: n=807 MOE +/- 4.1 percentage points. Totals may not add to 100% due to rounding.*Soft Democrats include registered voters who identify as "not strong Democrats" or Democratic leaning independents. Soft Republicans include those registered voters who identify as "not strong Republicans" or Republican leaning independents.
1

Approve Disapprove UnsureRow % Row % Row %
38% 54% 7%37% 53% 10%37% 56% 7%39% 55% 6%39% 53% 7%37% 55% 8%37% 54% 9%39% 50% 12%35% 51% 14%35% 55% 9%37% 51% 12%39% 48% 13%37% 51% 12%39% 50% 11%
September 29, 2017
February 2017
October 2017
December 2017January 2018February 2018
TRUDP105TRND. Marist Poll National Trend
Marist Poll National Adults
November 21, 2017
September 15, 2017August 17, 2017August 16, 2017June 2017April 2017March 2017
November 14, 2017
National AdultsDo you approve or disapprove of the job Donald
Trump is doing as president?
2

Strongly approve Approve Disapprove Strongly disapprove UnsureRow % Row % Row % Row % Row %
24% 14% 11% 44% 7%
26% 13% 9% 46% 5%Democrat 3% 3% 9% 82% 2%Republican 64% 23% 5% 4% 4%Independent 20% 14% 13% 45% 8%Strong Democrats 3% 2% 8% 86% 1%Soft Democrats 2% 5% 13% 76% 5%Just Independents 11% 13% 16% 42% 18%Soft Republicans 43% 30% 11% 8% 8%Strong Republicans 79% 18% 1% 2% 0%Very liberal-Liberal 3% 3% 8% 82% 4%Moderate 18% 14% 18% 46% 5%Conservative-Very conservative 54% 22% 4% 14% 6%
69% 23% 4% 1% 3%Northeast 22% 13% 8% 53% 4%Midwest 25% 16% 11% 39% 9%South 27% 15% 10% 40% 8%West 21% 11% 14% 47% 7%Less than $50,000 21% 13% 11% 45% 11%$50,000 or more 27% 15% 11% 44% 4%Not college graduate 26% 16% 13% 37% 9%College graduate 22% 12% 8% 54% 5%White 32% 13% 9% 40% 6%African American 5% 9% 18% 63% 4%Latino 11% 20% 11% 52% 6%White - Not College Graduate 36% 15% 11% 31% 7%White - College Graduate 25% 11% 7% 54% 4%18 to 29 16% 15% 11% 47% 10%30 to 44 19% 13% 15% 44% 8%45 to 59 30% 15% 6% 45% 5%60 or older 29% 13% 11% 41% 7%Under 45 18% 14% 14% 45% 9%45 or older 30% 14% 8% 43% 6%Men 28% 16% 10% 37% 9%Women 21% 12% 11% 50% 6%
51% 17% 7% 17% 7%Landline 29% 14% 6% 42% 9%Cell phone 21% 14% 13% 45% 6%
National Adults
National Registered Voters
Party Identification^
Party Identification*
Political Ideology^
TRUDP105R. Marist Poll National Tables February 2018
National Adults
Do you approve or disapprove of the job Donald Trump is doing as president? [And, would you say you strongly approve/disapprove of the job he is doing or just approve/disapprove?]
Race and Education
Age
Age
Gender
White Evangelical Christians
Trump Supporters
Region
Household Income
Education
Race
Interview Type
Marist Poll National Adults. Interviews conducted February 5th through February 7th, 2018, n=1012 MOE +/- 3.7 percentage points.^National Registered Voters: n=807 MOE +/- 4.1 percentage points. Totals may not add to 100% due to rounding.*Soft Democrats include registered voters who identify as "not strong Democrats" or Democratic leaning independents. Soft Republicans include those registered voters who identify as "not strong Republicans" or Republican leaning independents.
3
Strongly Approve Approve Disapprove Strongly Disapprove UnsureRow % Row % Row % Row % Row %
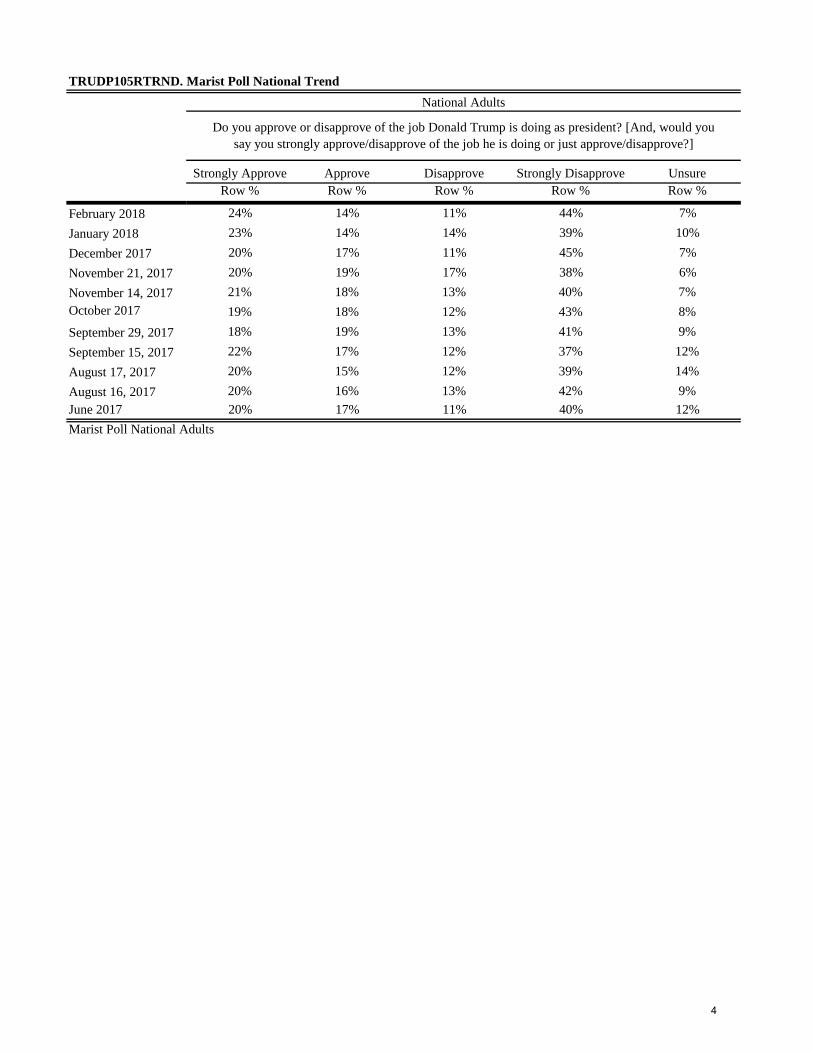
24% 14% 11% 44% 7%23% 14% 14% 39% 10%20% 17% 11% 45% 7%20% 19% 17% 38% 6%21% 18% 13% 40% 7%19% 18% 12% 43% 8%18% 19% 13% 41% 9%22% 17% 12% 37% 12%20% 15% 12% 39% 14%20% 16% 13% 42% 9%20% 17% 11% 40% 12%
TRUDP105RTRND. Marist Poll National Trend
Marist Poll National Adults
National Adults
Do you approve or disapprove of the job Donald Trump is doing as president? [And, would yousay you strongly approve/disapprove of the job he is doing or just approve/disapprove?]
June 2017August 16, 2017August 17, 2017
November 21, 2017
September 15, 2017September 29, 2017
October 2017November 14, 2017
December 2017January 2018February 2018
4

Favorable Unfavorable Unsure-Never HeardRow % Row % Row %
35% 57% 8%
36% 58% 5%Democrat 6% 91% 3%Republican 78% 18% 5%Independent 34% 59% 7%Strong Democrats 5% 92% 3%Soft Democrats 7% 90% 3%Just Independents 27% 58% 15%Soft Republicans 65% 27% 8%Strong Republicans 90% 8% 2%Very liberal-Liberal 5% 91% 4%Moderate 29% 67% 5%Conservative-Very conservative 71% 22% 7%
85% 10% 5%Northeast 35% 61% 4%Midwest 34% 55% 11%South 38% 54% 7%West 31% 60% 8%Less than $50,000 33% 57% 10%$50,000 or more 36% 58% 5%Not college graduate 38% 52% 10%College graduate 30% 65% 5%White 42% 52% 7%African American 11% 83% 6%Latino 33% 62% 5%White - Not College Graduate 46% 45% 9%White - College Graduate 34% 62% 3%18 to 29 30% 61% 8%30 to 44 30% 60% 10%45 to 59 38% 56% 5%60 or older 40% 52% 7%Under 45 30% 61% 9%45 or older 39% 54% 6%Men 42% 50% 8%Women 29% 64% 7%
63% 29% 7%Landline 41% 50% 9%Cell phone 31% 61% 7%
National Adults
National Registered Voters
Party Identification^
Party Identification*
Political Ideology^
TRUD020R. Marist Poll National Tables February 2018
National AdultsOverall, do you have a favorable or an unfavorable impression of
Donald Trump?
Race and Education
Age
Age
Gender
White Evangelical Christians
Trump Supporters
Region
Household Income
Education
Race
Interview Type
Marist Poll National Adults. Interviews conducted February 5th through February 7th, 2018, n=1012 MOE +/- 3.7 percentage points.^National Registered Voters: n=807 MOE +/- 4.1 percentage points. Totals may not add to 100% due to rounding.*Soft Democrats include registered voters who identify as "not strong Democrats" or Democratic leaning independents. Soft Republicans include those registered voters who identify as "not strong Republicans" or Republican leaning independents.
5
Favorable UnfavorableUnsure-Never
HeardRow % Row % Row %
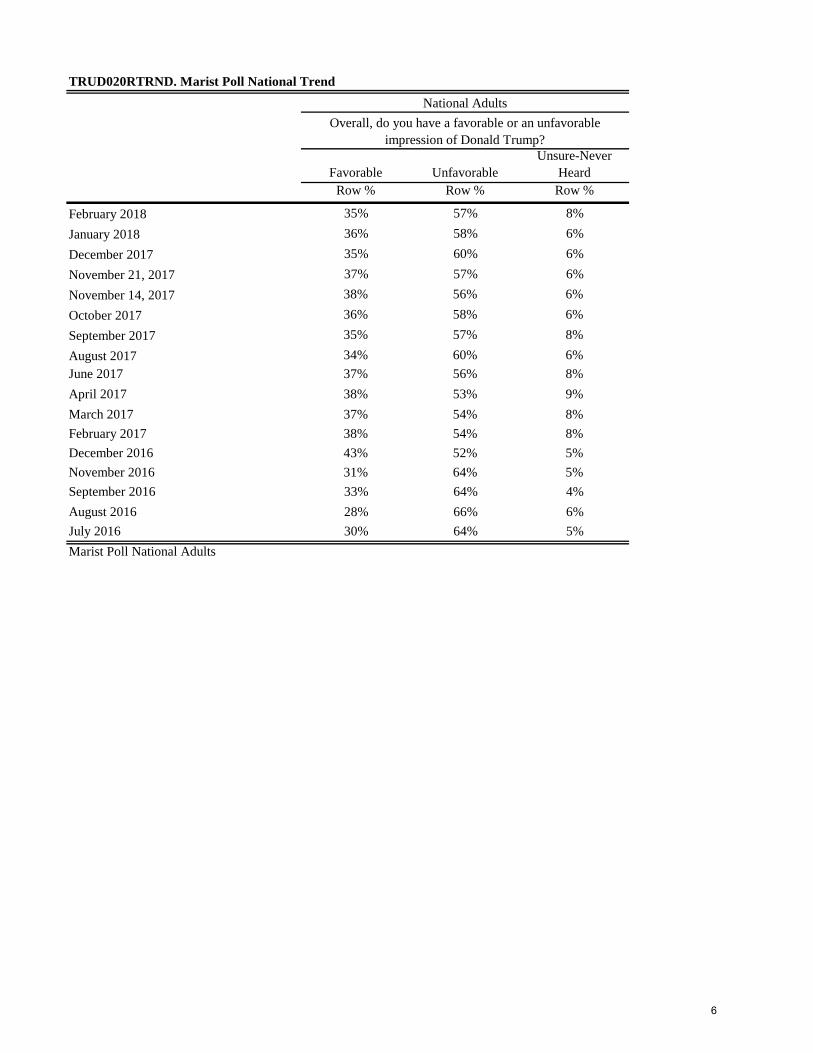
35% 57% 8%36% 58% 6%35% 60% 6%37% 57% 6%38% 56% 6%36% 58% 6%35% 57% 8%34% 60% 6%37% 56% 8%38% 53% 9%37% 54% 8%38% 54% 8%43% 52% 5%31% 64% 5%33% 64% 4%28% 66% 6%30% 64% 5%
June 2017August 2017
November 21, 2017November 14, 2017
December 2017
September 2017
TRUD020RTRND. Marist Poll National Trend
October 2017
January 2018
Marist Poll National AdultsJuly 2016
February 2018
National AdultsOverall, do you have a favorable or an unfavorable
impression of Donald Trump?
September 2016August 2016
November 2016December 2016February 2017March 2017April 2017
6

Democrat Republican Vol: Neither UndecidedRow % Row % Row % Row %
49% 38% 5% 8%Democrat 94% 4% 1% 2%Republican 3% 91% 2% 4%Independent 43% 32% 11% 14%Strong Democrats 95% 3% 1% 2%Soft Democrats 87% 2% 5% 6%Just Independents 29% 22% 19% 30%Soft Republicans 6% 78% 8% 8%Strong Republicans 1% 96% 1% 2%Very liberal-Liberal 86% 5% 6% 2%Moderate 50% 32% 6% 12%Conservative-Very conservative 14% 73% 4% 9%
4% 85% 3% 8%Northeast 55% 33% 4% 8%Midwest 42% 39% 9% 11%South 47% 40% 5% 8%West 55% 36% 4% 5%Less than $50,000 52% 31% 7% 10%$50,000 or more 46% 43% 4% 7%Not college graduate 44% 39% 6% 11%College graduate 55% 36% 4% 5%White 42% 44% 6% 9%African American 83% 12% 3% 2%Latino 60% 28% 6% 6%White - Not College Graduate 31% 49% 7% 13%White - College Graduate 54% 37% 4% 5%18 to 29 67% 22% 7% 4%30 to 44 46% 39% 4% 10%45 to 59 46% 41% 5% 7%60 or older 44% 40% 6% 10%Under 45 55% 32% 5% 8%45 or older 45% 41% 5% 8%Men 43% 43% 7% 7%Women 54% 33% 4% 9%
16% 68% 5% 11%Landline 44% 40% 4% 11%Cell phone 52% 36% 6% 6%
National Registered Voters
Party Identification
Party Identification*
Political Ideology
Trump Supporters
USCNGS01. Marist Poll National Tables February 2018
National Registered VotersIf November's election for Congress were held today, which party's candidate are you more
likely to vote for in your district:
Age
Age
Gender
White Evangelical Christians
Interview Type
Region
Household Income
Education
Race
Race and Education
Marist Poll National Registered Voters. Interviews conducted February 5th through February 7th, 2018, n=807 MOE +/- 4.1 percentage points.*Soft Democrats include registered voters who identify as "not strong Democrats" or Democratic leaning independents. Soft Republicans include those registered voters who identify as "not strong Republicans" or Republican leaning independents.
7

Democrat Republican Neither UndecidedRow % Row % Row % Row %
49% 38% 5% 8%46% 40% 6% 9%50% 37% 7% 7%43% 40% 6% 10%51% 36% 6% 8%47% 40% 5% 8%48% 38% 6% 8%45% 38% 7% 10%47% 38% 8% 7%38% 43% 6% 12%48% 42% 4% 6%46% 44% 4% 5%43% 43% 6% 8%
Marist Poll National Registered Voters
February 2018
USCNGS01TRND. Marist Poll National TrendNational Registered Voters
If November's (the 2018) election for Congress were held today, which party's candidate are you more likely to vote
for in your district:
December 2013
June 2017April 2017March 2017August 2014April 2014February 2014
November 21, 2017
August 2017November 14, 2017
December 2017January 2018
8

Right direction Wrong direction UnsureRow % Row % Row %
37% 57% 6%
37% 57% 6%Democrat 8% 89% 2%Republican 80% 14% 7%Independent 34% 59% 7%Strong Democrats 7% 91% 2%Soft Democrats 10% 87% 3%Just Independents 26% 59% 15%Soft Republicans 66% 24% 10%Strong Republicans 92% 6% 3%Very liberal-Liberal 8% 89% 3%Moderate 32% 61% 7%Conservative-Very conservative 69% 24% 7%
82% 10% 8%Northeast 32% 65% 3%Midwest 42% 52% 6%South 38% 54% 8%West 35% 60% 4%Less than $50,000 32% 60% 8%$50,000 or more 40% 55% 5%Not college graduate 39% 54% 7%College graduate 35% 61% 4%White 43% 51% 6%African American 15% 80% 5%Latino 26% 70% 4%White - Not College Graduate 47% 46% 7%White - College Graduate 36% 60% 4%18 to 29 37% 61% 2%30 to 44 32% 61% 7%45 to 59 42% 55% 4%60 or older 38% 52% 10%Under 45 34% 61% 5%45 or older 40% 53% 7%Men 46% 49% 5%Women 29% 64% 7%
62% 30% 8%Landline 41% 50% 9%Cell phone 35% 61% 4%
National Adults
National Registered Voters
Party Identification^
Party Identification*
Political Ideology^
USA1000. Marist Poll National Tables February 2018
National AdultsIn general, thinking about the way things are going in the country, do you feel things are going in the right direction or that things are going
in the wrong direction?
Race and Education
Age
Age
Gender
White Evangelical Christians
Trump Supporters
Region
Household Income
Education
Race
Interview Type
Marist Poll National Adults. Interviews conducted February 5th through February 7th, 2018, n=1012 MOE +/- 3.7 percentage points.^National Registered Voters: n=807 MOE +/- 4.1 percentage points. Totals may not add to 100% due to rounding.*Soft Democrats include registered voters who identify as "not strong Democrats" or Democratic leaning independents. Soft Republicans include those registered voters who identify as "not strong Republicans" or Republican leaning independents.
9

Right direction Wrong direction UnsureRow % Row % Row %
37% 57% 6%
35% 57% 9%
30% 64% 6%
33% 59% 8%
29% 66% 6%
30% 64% 6%
27% 65% 8%
33% 62% 5%
31% 61% 8%35% 57% 8%
34% 59% 7%
38% 55% 7%
31% 62% 6%
33% 59% 8%
34% 59% 6%
34% 59% 7%25% 68% 7%
27% 68% 5%
36% 59% 6%
34% 60% 6%
36% 59% 4%
31% 64% 6%
35% 61% 4%
28% 64% 8%
32% 64% 3%
33% 64% 3%
30% 63% 8%
30% 66% 4%
30% 60% 11%
38% 58% 4%
35% 60% 5%
40% 55% 5%
43% 53% 4%
25% 70% 4%
22% 73% 5%
21% 70% 10%
32% 59% 9%
31% 64% 5%
41% 47% 12%
34% 58% 8%
41% 53% 6%
38% 52% 10%
41% 56% 3%
37% 56% 7%
43% 53% 4%
38% 54% 8%
46% 46% 8%
47% 47% 6%
50% 42% 8%
50% 40% 10%
44% 44% 12%
49% 40% 11%
23% 67% 10%
26% 65% 9%
29% 63% 8%
31% 60% 9%
33% 58% 9%
34% 61% 5%
31% 62% 7%
38% 56% 6%
47% 48% 5%
42% 55% 3%
39% 53% 8%
38% 52% 10%
40% 48% 12%
37% 52% 11%
43% 51% 6%
43% 52% 5%
45% 48% 7%
55% 34% 11%
42% 48% 10%
45% 46% 9%
60% 32% 8%
60% 30% 10%
41% 44% 15%
56% 32% 12%
March 2017
April 2017
June 2017
November 21, 2017
August 2017
September 2017
October 2017
November 14, 2017
December 2017
January 2018
February 2018
November 2016
August 2016
December 2014
August 2014
February 2017
December 2016
September 2016
March 2013
April 2013
February 13, 2014
February 5, 2014
December 2013
July 2013
April 2014
October 2014
July 2016
November 2015
August 2015
March 2015
June 8, 2009
June 2011
September 2011
December 2012
March 2012
November 2011
December 2010
January 2011
April 2011
April 27, 2009
April 15, 2009
National Adults
In general, thinking about the way things are going in the country, do you feel things are going in the right direction or that things are going in the wrong direction?
March 31, 2010
October 14, 2009
August 12, 2009
February 8, 2010
December 8, 2009
April 2016
July 6, 2010
September 22, 2010
October 28, 2010
November 23, 2010
August 2011
October 21, 2004
November 2007
May 2007
February 2007
December 2006
October 2006
February 2006
October 2005
May 2005
February 2005
USA1000TRND. Marist Poll National Trend
Marist Poll National Adults
August 2004
July 2004
October 07, 2004
September 2004
January 2001
April 2004
March 2004
November 2003
April 2003
January 2003
October 2002
April 2002
January 2002
March 2001
10

Very likely/LikelyNot very likely/Not
likely at all UnsureRow % Row % Row %
41% 53% 6%
40% 55% 5%Democrat 60% 36% 4%Republican 17% 78% 5%Independent 40% 56% 4%Strong Democrats 60% 35% 5%Soft Democrats 57% 39% 4%Just Independents 42% 52% 7%Soft Republicans 21% 77% 3%Strong Republicans 15% 81% 4%Very liberal-Liberal 56% 40% 4%Moderate 41% 53% 6%Conservative-Very conservative 21% 75% 4%
15% 81% 3%Northeast 47% 51% 3%Midwest 37% 58% 6%South 39% 55% 6%West 45% 47% 8%Less than $50,000 40% 52% 7%$50,000 or more 43% 52% 5%Not college graduate 38% 53% 8%College graduate 45% 52% 3%White 37% 57% 6%African American 63% 32% 5%Latino 41% 54% 5%White - Not College Graduate 32% 59% 9%White - College Graduate 43% 55% 2%18 to 29 45% 48% 7%30 to 44 38% 58% 4%45 to 59 40% 56% 3%60 or older 42% 49% 9%Under 45 41% 53% 5%45 or older 41% 52% 6%Men 37% 58% 5%Women 45% 48% 7%
30% 61% 9%Landline 41% 49% 9%Cell phone 41% 55% 4%
National Adults
National Registered Voters
Party Identification^
Party Identification*
Political Ideology^
MTE18RIR. Marist Poll National Tables February 2018
National AdultsHow likely do you think there will be Russian interference in
November's mid-term elections: Very likely, likely, not very likely, or not likely at all?
Race and Education
Age
Age
Gender
White Evangelical Christians
Trump Supporters
Region
Household Income
Education
Race
Interview Type
Marist Poll National Adults. Interviews conducted February 5th through February 7th, 2018, n=1012 MOE +/- 3.7 percentage points.^National Registered Voters: n=807 MOE +/- 4.1 percentage points. Totals may not add to 100% due to rounding.*Soft Democrats include registered voters who identify as "not strong Democrats" or Democratic leaning independents. Soft Republicans include those registered voters who identify as "not strong Republicans" or Republican leaning independents.
11

Very likely Likely Not very likely Not likely at all UnsureRow % Row % Row % Row % Row %
17% 24% 23% 29% 6%
18% 22% 24% 31% 5%Democrat 27% 33% 22% 14% 4%Republican 6% 11% 25% 52% 5%Independent 19% 21% 26% 30% 4%Strong Democrats 29% 32% 21% 14% 5%Soft Democrats 29% 28% 26% 13% 4%Just Independents 15% 26% 24% 27% 7%Soft Republicans 9% 12% 26% 51% 3%Strong Republicans 4% 11% 25% 56% 4%Very liberal-Liberal 29% 27% 24% 16% 4%Moderate 19% 22% 23% 29% 6%Conservative-Very conservative 7% 14% 27% 47% 4%
4% 11% 25% 56% 3%Northeast 18% 29% 21% 30% 3%Midwest 15% 22% 28% 30% 6%South 17% 23% 24% 30% 6%West 21% 24% 20% 27% 8%Less than $50,000 16% 24% 25% 28% 7%$50,000 or more 19% 24% 24% 28% 5%Not college graduate 14% 24% 24% 29% 8%College graduate 22% 23% 24% 29% 3%White 15% 21% 25% 32% 6%African American 29% 33% 17% 15% 5%Latino 13% 28% 21% 32% 5%White - Not College Graduate 11% 21% 25% 34% 9%White - College Graduate 21% 22% 27% 28% 2%18 to 29 13% 32% 24% 24% 7%30 to 44 15% 23% 25% 33% 4%45 to 59 20% 21% 24% 32% 3%60 or older 20% 22% 21% 28% 9%Under 45 14% 27% 25% 29% 5%45 or older 20% 21% 22% 30% 6%Men 15% 22% 22% 35% 5%Women 20% 25% 24% 24% 7%
8% 22% 21% 41% 9%Landline 19% 22% 22% 28% 9%Cell phone 16% 25% 24% 31% 4%
National Adults
National Registered Voters
Party Identification^
Party Identification*
Political Ideology^
MTE18RI. Marist Poll National Tables February 2018
National AdultsHow likely do you think there will be Russian interference in November's mid-term elections: Very likely, likely, not
very likely, or not likely at all?
Race and Education
Age
Age
Gender
White Evangelical Christians
Trump Supporters
Region
Household Income
Education
Race
Interview Type
Marist Poll National Adults. Interviews conducted February 5th through February 7th, 2018, n=1012 MOE +/- 3.7 percentage points.^National Registered Voters: n=807 MOE +/- 4.1 percentage points. Totals may not add to 100% due to rounding.*Soft Democrats include registered voters who identify as "not strong Democrats" or Democratic leaning independents. Soft Republicans include those registered voters who identify as "not strong Republicans" or Republican leaning independents.
12

A great deal/A good amount A little/Nothing at all UnsureRow % Row % Row %
15% 73% 12%
14% 74% 12%Democrat 16% 76% 8%Republican 13% 70% 17%Independent 13% 77% 11%Strong Democrats 13% 78% 9%Soft Democrats 16% 77% 7%Just Independents 21% 68% 11%Soft Republicans 10% 77% 13%Strong Republicans 13% 68% 19%Very liberal-Liberal 12% 81% 7%Moderate 16% 72% 12%Conservative-Very conservative 12% 73% 15%
12% 72% 16%Northeast 13% 76% 11%Midwest 13% 73% 14%South 15% 74% 11%West 16% 70% 13%Less than $50,000 19% 68% 13%$50,000 or more 12% 78% 10%Not college graduate 19% 66% 15%College graduate 9% 83% 8%White 12% 75% 13%African American 23% 70% 7%Latino 17% 73% 10%White - Not College Graduate 16% 66% 18%White - College Graduate 7% 85% 8%18 to 29 17% 75% 7%30 to 44 20% 71% 9%45 to 59 10% 79% 11%60 or older 12% 69% 20%Under 45 19% 73% 8%45 or older 11% 74% 15%Men 16% 72% 12%Women 14% 74% 12%
13% 72% 16%Landline 11% 70% 20%Cell phone 17% 75% 8%
National Adults
National Registered Voters
Party Identification^
Party Identification*
Political Ideology^
SMRSEL1R. Marist Poll National Tables February 2018
National AdultsSince 2016, do you think social media sites such as Facebook or
Twitter have done a great deal, a good amount, a little or nothing at all to ensure that there is no Russian interference in this year's mid-
term elections?
Race and Education
Age
Age
Gender
White Evangelical Christians
Trump Supporters
Region
Household Income
Education
Race
Interview Type
Marist Poll National Adults. Interviews conducted February 5th through February 7th, 2018, n=1012 MOE +/- 3.7 percentage points.^National Registered Voters: n=807 MOE +/- 4.1 percentage points. Totals may not add to 100% due to rounding.*Soft Democrats include registered voters who identify as "not strong Democrats" or Democratic leaning independents. Soft Republicans include those registered voters who identify as "not strong Republicans" or Republican leaning independents.
13

A great deal A good amount A little Nothing at all UnsureRow % Row % Row % Row % Row %
5% 9% 33% 40% 12%
5% 9% 34% 41% 12%Democrat 4% 12% 43% 33% 8%Republican 5% 8% 25% 45% 17%Independent 5% 8% 33% 44% 11%Strong Democrats 3% 10% 46% 32% 9%Soft Democrats 7% 9% 40% 37% 7%Just Independents 7% 14% 22% 45% 11%Soft Republicans 2% 8% 28% 49% 13%Strong Republicans 7% 6% 24% 44% 19%Very liberal-Liberal 3% 9% 43% 38% 7%Moderate 4% 13% 34% 38% 12%Conservative-Very conservative 5% 7% 24% 48% 15%
6% 5% 27% 45% 16%Northeast 5% 8% 31% 45% 11%Midwest 4% 9% 35% 38% 14%South 6% 9% 33% 41% 11%West 5% 12% 32% 39% 13%Less than $50,000 5% 13% 32% 36% 13%$50,000 or more 5% 7% 35% 43% 10%Not college graduate 7% 12% 28% 38% 15%College graduate 2% 6% 39% 44% 8%White 4% 8% 34% 40% 13%African American 10% 13% 31% 39% 7%Latino 6% 12% 28% 45% 10%White - Not College Graduate 6% 10% 30% 36% 18%White - College Graduate 2% 5% 40% 45% 8%18 to 29 8% 10% 37% 38% 7%30 to 44 6% 14% 33% 38% 9%45 to 59 4% 6% 34% 45% 11%60 or older 4% 8% 29% 39% 20%Under 45 6% 12% 35% 38% 8%45 or older 4% 7% 32% 42% 15%Men 6% 9% 35% 37% 12%Women 4% 9% 30% 44% 12%
6% 7% 25% 46% 16%Landline 4% 7% 28% 42% 20%Cell phone 6% 11% 36% 40% 8%
National Adults
National Registered Voters
Party Identification^
Party Identification*
Political Ideology^
SMRSEL1. Marist Poll National Tables February 2018
National Adults
Since 2016, do you think social media sites such as Facebook or Twitter have done a great deal, a good amount, a little or nothing at all to ensure that there is no Russian interference in this year's mid-term elections?
Race and Education
Age
Age
Gender
White Evangelical Christians
Trump Supporters
Region
Household Income
Education
Race
Interview Type
Marist Poll National Adults. Interviews conducted February 5th through February 7th, 2018, n=1012 MOE +/- 3.7 percentage points.^National Registered Voters: n=807 MOE +/- 4.1 percentage points. Totals may not add to 100% due to rounding.*Soft Democrats include registered voters who identify as "not strong Democrats" or Democratic leaning independents. Soft Republicans include those registered voters who identify as "not strong Republicans" or Republican leaning independents.
14

A great deal/A good amount A little/Nothing at all UnsureRow % Row % Row %
18% 73% 9%
18% 74% 8%Democrat 13% 82% 6%Republican 27% 66% 7%Independent 16% 75% 9%Strong Democrats 12% 83% 5%Soft Democrats 14% 80% 6%Just Independents 16% 70% 13%Soft Republicans 20% 70% 9%Strong Republicans 30% 63% 6%Very liberal-Liberal 9% 87% 3%Moderate 17% 72% 11%Conservative-Very conservative 26% 65% 8%
27% 66% 7%Northeast 19% 78% 3%Midwest 19% 72% 9%South 19% 73% 9%West 14% 72% 14%Less than $50,000 19% 69% 11%$50,000 or more 17% 75% 8%Not college graduate 19% 70% 11%College graduate 14% 79% 7%White 18% 73% 10%African American 21% 75% 4%Latino 21% 77% 2%White - Not College Graduate 19% 68% 13%White - College Graduate 14% 80% 6%18 to 29 21% 70% 9%30 to 44 20% 69% 11%45 to 59 16% 76% 7%60 or older 13% 78% 9%Under 45 21% 69% 10%45 or older 15% 77% 8%Men 19% 73% 7%Women 16% 73% 11%
24% 64% 13%Landline 14% 76% 10%Cell phone 20% 72% 8%
National Adults
National Registered Voters
Party Identification^
Party Identification*
Political Ideology^
CNGRSEL1R. Marist Poll National Tables February 2018
National Adults
Since 2016, do you think Congress has done a great deal, a good amount, a little or nothing at all to ensure that there is no Russian
interference in this year's mid-term elections?
Race and Education
Age
Age
Gender
White Evangelical Christians
Trump Supporters
Region
Household Income
Education
Race
Interview Type
Marist Poll National Adults. Interviews conducted February 5th through February 7th, 2018, n=1012 MOE +/- 3.7 percentage points.^National Registered Voters: n=807 MOE +/- 4.1 percentage points. Totals may not add to 100% due to rounding.*Soft Democrats include registered voters who identify as "not strong Democrats" or Democratic leaning independents. Soft Republicans include those registered voters who identify as "not strong Republicans" or Republican leaning independents.
15

A great deal A good amount A little Nothing at all UnsureRow % Row % Row % Row % Row %
6% 12% 35% 38% 9%
6% 12% 34% 40% 8%Democrat 5% 8% 35% 47% 6%Republican 11% 16% 40% 26% 7%Independent 5% 11% 31% 44% 9%Strong Democrats 6% 6% 34% 49% 5%Soft Democrats 2% 12% 34% 46% 6%Just Independents 6% 10% 28% 42% 13%Soft Republicans 11% 10% 38% 32% 9%Strong Republicans 9% 21% 35% 28% 6%Very liberal-Liberal 2% 7% 37% 51% 3%Moderate 6% 11% 34% 39% 11%Conservative-Very conservative 10% 16% 33% 32% 8%
11% 15% 35% 31% 7%Northeast 6% 13% 28% 50% 3%Midwest 5% 14% 39% 33% 9%South 6% 13% 39% 33% 9%West 5% 9% 31% 41% 14%Less than $50,000 6% 13% 36% 33% 11%$50,000 or more 5% 12% 35% 40% 8%Not college graduate 6% 14% 35% 36% 11%College graduate 5% 9% 37% 42% 7%White 6% 12% 36% 37% 10%African American 8% 13% 29% 46% 4%Latino 5% 16% 37% 40% 2%White - Not College Graduate 6% 13% 34% 34% 13%White - College Graduate 5% 9% 39% 41% 6%18 to 29 5% 17% 42% 28% 9%30 to 44 6% 14% 37% 32% 11%45 to 59 6% 10% 32% 44% 7%60 or older 5% 8% 32% 45% 9%Under 45 5% 16% 39% 30% 10%45 or older 6% 9% 32% 45% 8%Men 7% 12% 36% 38% 7%Women 4% 12% 35% 38% 11%
10% 14% 35% 28% 13%Landline 6% 8% 32% 44% 10%Cell phone 5% 15% 37% 34% 8%
National Adults
National Registered Voters
Party Identification^
Party Identification*
Political Ideology^
CNGRSEL1. Marist Poll National Tables February 2018
National AdultsSince 2016, do you think Congress has done a great deal, a good amount, a little or nothing at all to ensure that there
is no Russian interference in this year's mid-term elections?
Race and Education
Age
Age
Gender
White Evangelical Christians
Trump Supporters
Region
Household Income
Education
Race
Interview Type
Marist Poll National Adults. Interviews conducted February 5th through February 7th, 2018, n=1012 MOE +/- 3.7 percentage points.^National Registered Voters: n=807 MOE +/- 4.1 percentage points. Totals may not add to 100% due to rounding.*Soft Democrats include registered voters who identify as "not strong Democrats" or Democratic leaning independents. Soft Republicans include those registered voters who identify as "not strong Republicans" or Republican leaning independents.
16

Has done something illegal
Has done something unethical, but not
illegalHas done nothing
wrong UnsureRow % Row % Row % Row %
29% 28% 36% 7%
29% 28% 36% 7%Democrat 56% 31% 7% 6%Republican 1% 17% 77% 5%Independent 25% 35% 33% 7%Strong Democrats 56% 32% 6% 7%Soft Democrats 46% 41% 7% 5%Just Independents 26% 31% 26% 16%Soft Republicans 5% 27% 65% 4%Strong Republicans 1% 6% 87% 5%Very liberal-Liberal 52% 34% 8% 6%Moderate 26% 40% 28% 7%Conservative-Very conservative 9% 14% 70% 7%
3% 9% 82% 6%Northeast 36% 28% 31% 5%Midwest 27% 28% 39% 6%South 26% 28% 38% 8%West 29% 28% 36% 7%Less than $50,000 33% 24% 34% 9%$50,000 or more 27% 32% 36% 5%Not college graduate 23% 29% 40% 9%College graduate 35% 28% 31% 5%White 23% 27% 42% 8%African American 47% 33% 13% 6%Latino 46% 19% 31% 5%White - Not College Graduate 16% 26% 48% 10%White - College Graduate 33% 28% 33% 5%18 to 29 36% 29% 30% 5%30 to 44 29% 33% 34% 5%45 to 59 26% 27% 40% 7%60 or older 26% 24% 40% 10%Under 45 32% 31% 32% 5%45 or older 26% 25% 40% 9%Men 28% 24% 43% 5%Women 29% 32% 30% 9%
10% 19% 63% 9%Landline 23% 28% 39% 10%Cell phone 32% 28% 35% 5%
National Adults
National Registered Voters
Party Identification^
Party Identification*
Political Ideology^
DTETILLA. Marist Poll National Tables February 2018
National AdultsIn his dealings with Russia and Russian President Vladimir Putin do you think Donald
Trump has done something illegal, something unethical, but not illegal, or has done nothing wrong?
Race and Education
Age
Age
Gender
White Evangelical Christians
Trump Supporters
Region
Household Income
Education
Race
Interview Type
Marist Poll National Adults. Interviews conducted February 5th through February 7th, 2018, n=1012 MOE +/- 3.7 percentage points.^National Registered Voters: n=807 MOE +/- 4.1 percentage points. Totals may not add to 100% due to rounding.*Soft Democrats include registered voters who identify as "not strong Democrats" or Democratic leaning independents. Soft Republicans include those registered voters who identify as "not strong Republicans" or Republican leaning independents.
17

Has done something illegal
Has done something
unethical, but not illegal
Has done nothing wrong Unsure
Row % Row % Row % Row %
29% 28% 36% 7%22% 33% 35% 10%25% 29% 36% 10%19% 30% 40% 12%
Marist Poll National AdultsFebruary 2017July 2017
February 2018
DTETILLATRND. Marist Poll National TrendNational Adults
In his dealings with Russia and Russian President Vladimir Putin do you think Donald Trump has done something illegal, something unethical, but
not illegal, or has done nothing wrong?
October 2017
18

Favorable Unfavorable Unsure-Never HeardRow % Row % Row %
33% 27% 39%
38% 27% 35%Democrat 53% 22% 25%Republican 25% 38% 37%Independent 35% 25% 40%Strong Democrats 59% 19% 22%Soft Democrats 46% 21% 33%Just Independents 35% 20% 45%Soft Republicans 18% 38% 43%Strong Republicans 28% 39% 33%Very liberal-Liberal 54% 16% 30%Moderate 44% 23% 34%Conservative-Very conservative 21% 40% 39%
23% 37% 40%Northeast 40% 27% 34%Midwest 31% 27% 41%South 32% 31% 37%West 33% 21% 46%Less than $50,000 25% 28% 47%$50,000 or more 40% 27% 33%Not college graduate 25% 26% 50%College graduate 47% 28% 26%White 37% 28% 35%African American 22% 31% 48%Latino 20% 35% 45%White - Not College Graduate 25% 29% 46%White - College Graduate 55% 25% 20%18 to 29 21% 32% 47%30 to 44 31% 24% 44%45 to 59 37% 32% 31%60 or older 42% 22% 37%Under 45 27% 28% 45%45 or older 39% 27% 34%Men 34% 29% 37%Women 33% 26% 41%
20% 37% 43%Landline 35% 23% 42%Cell phone 32% 30% 38%
National Adults
National Registered Voters
Party Identification^
Party Identification*
Political Ideology^
MUER020R. Marist Poll National Tables February 2018
National AdultsOverall, do you have a favorable or an unfavorable impression of
Robert Mueller?
Race and Education
Age
Age
Gender
White Evangelical Christians
Trump Supporters
Region
Household Income
Education
Race
Interview Type
Marist Poll National Adults. Interviews conducted February 5th through February 7th, 2018, n=1012 MOE +/- 3.7 percentage points.^National Registered Voters: n=807 MOE +/- 4.1 percentage points. Totals may not add to 100% due to rounding.*Soft Democrats include registered voters who identify as "not strong Democrats" or Democratic leaning independents. Soft Republicans include those registered voters who identify as "not strong Republicans" or Republican leaning independents.
19

Favorable Unfavorable Unsure-Never heardRow % Row % Row %
33% 27% 39%29% 29% 42%
MUER020RTRND. Marist Poll National Trend
Marist Poll National Adults
National Adults
Overall, do you have a favorable or an unfavorable impressionof Robert Mueller?
February 2018January 2018
20

Fair Not fair UnsureRow % Row % Row %
53% 28% 20%
55% 29% 16%Democrat 77% 14% 9%Republican 35% 46% 19%Independent 51% 31% 18%Strong Democrats 80% 12% 8%Soft Democrats 68% 22% 10%Just Independents 41% 24% 35%Soft Republicans 37% 43% 20%Strong Republicans 34% 48% 18%Very liberal-Liberal 73% 17% 10%Moderate 63% 23% 14%Conservative-Very conservative 34% 47% 20%
33% 48% 19%Northeast 66% 21% 13%Midwest 46% 33% 20%South 52% 30% 19%West 50% 25% 25%Less than $50,000 46% 29% 25%$50,000 or more 58% 27% 15%Not college graduate 47% 29% 24%College graduate 62% 26% 12%White 53% 29% 18%African American 52% 27% 21%Latino 58% 23% 19%White - Not College Graduate 47% 30% 23%White - College Graduate 63% 28% 9%18 to 29 53% 25% 22%30 to 44 54% 20% 26%45 to 59 50% 37% 14%60 or older 54% 28% 18%Under 45 54% 22% 24%45 or older 52% 33% 16%Men 53% 30% 17%Women 52% 25% 22%
39% 39% 22%Landline 53% 28% 19%Cell phone 52% 27% 20%
National Adults
National Registered Voters
Party Identification^
Party Identification*
Political Ideology^
RMINVFR. Marist Poll National Tables February 2018
National AdultsFrom what you have read or heard about Robert Mueller, the Special Counsel in the Russia investigation, do you think the investigation is
fair or not fair?
Race and Education
Age
Age
Gender
White Evangelical Christians
Trump Supporters
Region
Household Income
Education
Race
Interview Type
Marist Poll National Adults. Interviews conducted February 5th through February 7th, 2018, n=1012 MOE +/- 3.7 percentage points.^National Registered Voters: n=807 MOE +/- 4.1 percentage points. Totals may not add to 100% due to rounding.*Soft Democrats include registered voters who identify as "not strong Democrats" or Democratic leaning independents. Soft Republicans include those registered voters who identify as "not strong Republicans" or Republican leaning independents.
21

Fair Not fair UnsureRow % Row % Row %
53% 28% 20%48% 28% 23%
RMINVFRTRND. Marist Poll National Trend
Marist Poll National Adults
National AdultsFrom what you have read or heard about Robert Mueller, theSpecial Counsel in the Russia investigation, do you think the
investigation is fair or not fair?
February 2018January 2018
22

Should be fired
Should be allowed to finish the
investigation UnsureRow % Row % Row %
16% 70% 14%
15% 73% 12%Democrat 5% 90% 6%Republican 27% 55% 18%Independent 16% 71% 13%Strong Democrats 4% 90% 6%Soft Democrats 11% 82% 7%Just Independents 13% 65% 22%Soft Republicans 20% 63% 17%Strong Republicans 30% 53% 16%Very liberal-Liberal 10% 83% 7%Moderate 9% 80% 10%Conservative-Very conservative 24% 61% 16%
25% 59% 16%Northeast 19% 71% 10%Midwest 15% 74% 11%South 14% 70% 16%West 17% 66% 16%Less than $50,000 15% 67% 18%$50,000 or more 16% 73% 11%Not college graduate 15% 67% 17%College graduate 16% 75% 9%White 16% 72% 12%African American 10% 78% 13%Latino 23% 60% 17%White - Not College Graduate 18% 67% 15%White - College Graduate 14% 79% 7%18 to 29 17% 68% 15%30 to 44 15% 64% 21%45 to 59 20% 71% 9%60 or older 12% 76% 12%Under 45 16% 66% 18%45 or older 16% 74% 10%Men 17% 68% 14%Women 14% 72% 14%
25% 60% 15%Landline 15% 71% 14%Cell phone 16% 70% 14%
National Adults
National Registered Voters
Party Identification^
Party Identification*
Political Ideology^
RMFIRED. Marist Poll National Tables February 2018
National AdultsDo you think Special Counsel Robert Mueller:
Race and Education
Age
Age
Gender
White Evangelical Christians
Trump Supporters
Region
Household Income
Education
Race
Interview Type
Marist Poll National Adults. Interviews conducted February 5th through February 7th, 2018, n=1012 MOE +/- 3.7 percentage points.^National Registered Voters: n=807 MOE +/- 4.1 percentage points. Totals may not add to 100% due to rounding.*Soft Democrats include registered voters who identify as "not strong Democrats" or Democratic leaning independents. Soft Republicans include those registered voters who identify as "not strong Republicans" or Republican leaning independents.
23

Should be firedShould be allowed to
finish the investigation UnsureRow % Row % Row %
16% 70% 14%14% 68% 18%
RMFIREDTRND. Marist Poll National Trend
Marist Poll National Adults
National AdultsDo you think Special Counsel Robert Mueller:
February 2018January 2018
24

Favorable Unfavorable Unsure-Never HeardRow % Row % Row %
65% 28% 7%
68% 26% 6%Democrat 82% 11% 7%Republican 55% 38% 6%Independent 66% 29% 5%Strong Democrats 83% 10% 7%Soft Democrats 80% 17% 4%Just Independents 56% 32% 12%Soft Republicans 58% 38% 4%Strong Republicans 52% 41% 7%Very liberal-Liberal 75% 19% 6%Moderate 75% 20% 5%Conservative-Very conservative 59% 35% 6%
54% 39% 7%Northeast 71% 26% 2%Midwest 69% 23% 8%South 62% 30% 8%West 62% 29% 8%Less than $50,000 62% 30% 8%$50,000 or more 68% 26% 6%Not college graduate 61% 32% 8%College graduate 73% 22% 6%White 67% 25% 8%African American 61% 35% 4%Latino 64% 33% 3%White - Not College Graduate 63% 28% 9%White - College Graduate 74% 19% 7%18 to 29 54% 40% 6%30 to 44 68% 26% 6%45 to 59 68% 25% 7%60 or older 69% 22% 9%Under 45 62% 33% 6%45 or older 69% 23% 8%Men 65% 30% 5%Women 66% 25% 9%
58% 33% 9%Landline 65% 25% 10%Cell phone 65% 30% 5%
National Adults
National Registered Voters
Party Identification^
Party Identification*
Political Ideology^
FBI020R. Marist Poll National Tables February 2018
National AdultsOverall, do you have a favorable or an unfavorable impression of the
FBI?
Race and Education
Age
Age
Gender
White Evangelical Christians
Trump Supporters
Region
Household Income
Education
Race
Interview Type
Marist Poll National Adults. Interviews conducted February 5th through February 7th, 2018, n=1012 MOE +/- 3.7 percentage points.^National Registered Voters: n=807 MOE +/- 4.1 percentage points. Totals may not add to 100% due to rounding.*Soft Democrats include registered voters who identify as "not strong Democrats" or Democratic leaning independents. Soft Republicans include those registered voters who identify as "not strong Republicans" or Republican leaning independents.
25

Just trying to do their job
Biased against the Trump administration Unsure
Row % Row % Row %
71% 23% 6%
70% 24% 6%Democrat 87% 10% 3%Republican 43% 49% 9%Independent 74% 20% 7%Strong Democrats 89% 8% 3%Soft Democrats 89% 8% 3%Just Independents 74% 20% 6%Soft Republicans 54% 36% 10%Strong Republicans 32% 58% 10%Very liberal-Liberal 88% 8% 3%Moderate 78% 17% 5%Conservative-Very conservative 46% 43% 10%
39% 51% 10%Northeast 76% 18% 6%Midwest 67% 23% 10%South 69% 26% 5%West 72% 23% 5%Less than $50,000 72% 20% 8%$50,000 or more 69% 26% 4%Not college graduate 68% 24% 9%College graduate 75% 22% 3%White 67% 25% 8%African American 83% 15% 2%Latino 76% 20% 3%White - Not College Graduate 61% 28% 11%White - College Graduate 75% 21% 4%18 to 29 76% 20% 4%30 to 44 74% 20% 6%45 to 59 69% 27% 4%60 or older 66% 24% 10%Under 45 75% 20% 5%45 or older 67% 25% 7%Men 68% 26% 6%Women 73% 20% 6%
51% 38% 11%Landline 67% 23% 10%Cell phone 73% 23% 4%
National Adults
National Registered Voters
Party Identification^
Party Identification*
Political Ideology^
FBIDT010. Marist Poll National Tables February 2018
National AdultsDo you think the FBI is:
Race and Education
Age
Age
Gender
White Evangelical Christians
Trump Supporters
Region
Household Income
Education
Race
Interview Type
Marist Poll National Adults. Interviews conducted February 5th through February 7th, 2018, n=1012 MOE +/- 3.7 percentage points.^National Registered Voters: n=807 MOE +/- 4.1 percentage points. Totals may not add to 100% due to rounding.*Soft Democrats include registered voters who identify as "not strong Democrats" or Democratic leaning independents. Soft Republicans include those registered voters who identify as "not strong Republicans" or Republican leaning independents.
26

President Trump The FBI Vol: Both Vol: Neither UnsureRow % Row % Row % Row % Row %
24% 66% 1% 4% 6%
25% 66% 1% 4% 5%Democrat 3% 94% 1% 0% 1%Republican 59% 28% 1% 3% 8%Independent 20% 68% 0% 6% 6%Strong Democrats 2% 95% 2% 0% 1%Soft Democrats 3% 94% 0% 2% 1%Just Independents 18% 67% 0% 9% 5%Soft Republicans 41% 41% 0% 6% 11%Strong Republicans 72% 15% 2% 3% 8%Very liberal-Liberal 5% 92% 0% 3% 1%Moderate 15% 74% 0% 4% 7%Conservative-Very conservative 51% 35% 2% 4% 8%
61% 23% 2% 5% 10%Northeast 18% 74% 0% 4% 4%Midwest 25% 63% 0% 5% 6%South 25% 64% 2% 3% 7%West 24% 66% 1% 4% 5%Less than $50,000 23% 66% 2% 4% 5%$50,000 or more 24% 67% 0% 4% 5%Not college graduate 26% 62% 1% 4% 6%College graduate 19% 73% 0% 3% 5%White 29% 60% 1% 4% 6%African American 9% 89% 0% 1% 1%Latino 10% 80% 0% 3% 7%White - Not College Graduate 35% 52% 2% 5% 6%White - College Graduate 20% 71% 1% 3% 5%18 to 29 14% 75% 2% 4% 5%30 to 44 22% 67% 0% 5% 6%45 to 59 26% 65% 1% 3% 5%60 or older 29% 60% 1% 4% 7%Under 45 19% 71% 1% 4% 5%45 or older 28% 62% 1% 3% 6%Men 26% 60% 1% 6% 7%Women 21% 72% 1% 2% 4%
48% 39% 2% 4% 7%Landline 27% 59% 1% 4% 9%Cell phone 22% 70% 1% 4% 4%
National Adults
National Registered Voters
Party Identification^
Party Identification*
Political Ideology^
BELMOR1. Marist Poll National Tables February 2018
National AdultsIf President Trump and the FBI disagree, who are you more likely to believe:
Race and Education
Age
Age
Gender
White Evangelical Christians
Trump Supporters
Region
Household Income
Education
Race
Interview Type
Marist Poll National Adults. Interviews conducted February 5th through February 7th, 2018, n=1012 MOE +/- 3.7 percentage points.^National Registered Voters: n=807 MOE +/- 4.1 percentage points. Totals may not add to 100% due to rounding.*Soft Democrats include registered voters who identify as "not strong Democrats" or Democratic leaning independents. Soft Republicans include those registered voters who identify as "not strong Republicans" or Republican leaning independents.
27

President TrumpSpecial Counsel Robert Mueller Vol: Both Vol: Neither Unsure
Row % Row % Row % Row % Row %
30% 55% 1% 4% 11%
29% 57% 0% 4% 9%Democrat 4% 91% 1% 0% 5%Republican 67% 15% 0% 3% 14%Independent 27% 58% 0% 6% 9%Strong Democrats 3% 91% 1% 0% 4%Soft Democrats 4% 91% 0% 2% 3%Just Independents 31% 53% 2% 9% 4%Soft Republicans 52% 22% 0% 6% 20%Strong Republicans 77% 9% 0% 3% 11%Very liberal-Liberal 6% 89% 0% 2% 4%Moderate 22% 61% 0% 5% 11%Conservative-Very conservative 58% 25% 1% 3% 13%
70% 11% 1% 5% 14%Northeast 23% 63% 0% 5% 10%Midwest 31% 52% 0% 5% 12%South 34% 53% 1% 3% 10%West 26% 56% 1% 4% 12%Less than $50,000 28% 54% 1% 3% 14%$50,000 or more 31% 58% 0% 4% 7%Not college graduate 34% 48% 1% 4% 12%College graduate 23% 65% 0% 3% 8%White 35% 50% 1% 4% 10%African American 12% 81% 0% 0% 8%Latino 17% 62% 0% 5% 15%White - Not College Graduate 43% 40% 1% 5% 12%White - College Graduate 26% 64% 0% 2% 7%18 to 29 23% 58% 2% 4% 13%30 to 44 28% 57% 0% 4% 11%45 to 59 33% 57% 1% 3% 6%60 or older 32% 51% 0% 4% 13%Under 45 26% 57% 1% 4% 12%45 or older 32% 54% 0% 4% 10%Men 35% 51% 1% 5% 9%Women 25% 59% 1% 3% 12%
57% 25% 1% 4% 13%Landline 31% 49% 1% 4% 15%Cell phone 29% 59% 1% 4% 8%
National Adults
National Registered Voters
Party Identification^
Party Identification*
Political Ideology^
BELMOR2. Marist Poll National Tables February 2018
National Adults
If President Trump and Special Counsel Robert Mueller disagree, who are you more likely to believe:
Interview Type
Marist Poll National Adults. Interviews conducted February 5th through February 7th, 2018, n=1012 MOE +/- 3.7 percentage points.^National Registered Voters: n=807 MOE +/- 4.1 percentage points. Totals may not add to 100% due to rounding.*Soft Democrats include registered voters who identify as "not strong Democrats" or Democratic leaning independents. Soft Republicans include those registered voters who identify as "not strong Republicans" or Republican leaning independents.
Race and Education
Age
Age
Gender
White Evangelical Christians
Trump Supporters
Region
Household Income
Education
Race
28