nature methods a genetically encoded fluorescent reporter ... · supplementary figure 5 | spectral...
TRANSCRIPT

nature | methods
A genetically encoded fluorescent reporter of ATP:ADP ratio Jim Berg, Yin Pun Hung & Gary Yellen Supplementary figures and text:
Supplementary Figure 1 pH and chloride sensitivity of the QV5 construct
Supplementary Figure 2 Magnesium sensitivity of the QV5 construct
Supplementary Figure 3 Sensitivity of the QV5 construct to other purine nucleotides
Supplementary Figure 4 Construction of a tandem trimer version of the sensor
Supplementary Figure 5 Spectral properties of Perceval
Supplementary Figure 6 Response properties of Perceval
Supplementary Figure 7 pH calibration using nigericin
Supplementary Figure 8 pH correction of 2-DG and pH-control experiments
Supplementary Figure 9 Comparable response of sensor in HEK293 and COS7 cells
Supplementary Figure 10 Perceval DNA and protein sequences
Supplementary Results Detailed explanation of the ratio-sensing behavior of the sensor; pH and
chloride sensitivity of the ATP sensor; correcting for changes in intracellular
pH; and sensitivity of the GlnK1 – cpmVenus construct to Mg2+ ions.
Supplementary Methods
Nature Methods: doi: 10.1038/nmeth.1288

0
5
10
15
20
25
6.2 6.6 7 7.4 7.8
ATP ATP (No Cl-)ADP ADP (NoCl-)
0
5
10
15
20
25
30
6.2 6.6 7 7.4 7.8
ATP
R = KR
ADP
0 nucleotide
a b
c d
490
nm /
405
nm
Rat
io
490
nm /
405
nm
Rat
io
6.2 6.6 7 7.4 7.8
435
nm F
l (Ar
bitr
ary
units
)
pHpH
pH
Supplementary Figure 1 | pH and chloride sensitivity of the QV5 construct. (a,b) pH titrations of purified QV5 construct when maximally
activated (blue), half maximal (red), ADP (gray), and nucleotide free (green)
solutions. The 490 / 405 ratio signal (a) exhibits a pH sensitivity that is
somewhat parallel between the four signals, indicating that pH is not affecting
the ATP response, but is clearly affecting the underlying fluorescence of the
sensor. The 435 nm signal (b) is isosbestic with respect to ATP:ADP ratio
across pH values. (c) The dose-response to ATP is relatively unaffected by
changes in pH. (d) Across a range of pH values, the presence (100 mM KCl)
or absence (0 KCl) of chloride does not lead to a substantial change in the
QV5 construct ratio.
0 0.1 1 100.0
0.2
0.4
0.6
0.8
1.0
Nor
mal
ized
F 490/ F
405
R ([ATP]/[ADP])
pH 7.6pH 7.3pH 7.0
Nature Methods: doi: 10.1038/nmeth.1288
0.8
1
1.2
1.4
1.6
1.8
2
2.2
10 100 1000 10000
Nor
mal
ized
Rat
io R
espo
nse
[MgCl2] (µM)
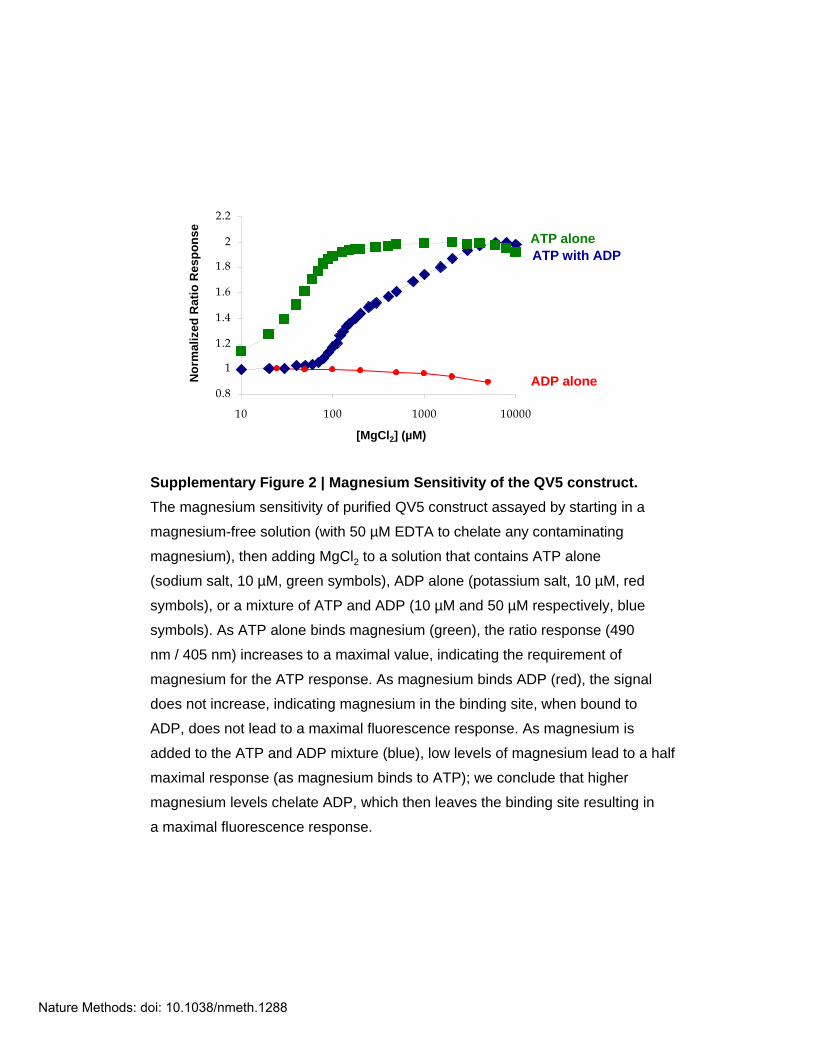
Supplementary Figure 2 | Magnesium Sensitivity of the QV5 construct. The magnesium sensitivity of purified QV5 construct assayed by starting in a
magnesium-free solution (with 50 µM EDTA to chelate any contaminating
magnesium), then adding MgCl2 to a solution that contains ATP alone
(sodium salt, 10 µM, green symbols), ADP alone (potassium salt, 10 µM, red
symbols), or a mixture of ATP and ADP (10 µM and 50 µM respectively, blue
symbols). As ATP alone binds magnesium (green), the ratio response (490
nm / 405 nm) increases to a maximal value, indicating the requirement of
magnesium for the ATP response. As magnesium binds ADP (red), the signal
does not increase, indicating magnesium in the binding site, when bound to
ADP, does not lead to a maximal fluorescence response. As magnesium is
added to the ATP and ADP mixture (blue), low levels of magnesium lead to a half
maximal response (as magnesium binds to ATP); we conclude that higher
magnesium levels chelate ADP, which then leaves the binding site resulting in
a maximal fluorescence response.
ADP alone
ATP aloneATP with ADP
Nature Methods: doi: 10.1038/nmeth.1288
02468
1012141618
0.01 0.1 1 10 100
ATP
ADP
GTP
NAD+
AMP
0.8
1
1.2
1.4
1.6
1.8
2
0 0.5 1 1.5 2
Control
GTP
NAD+
AMP
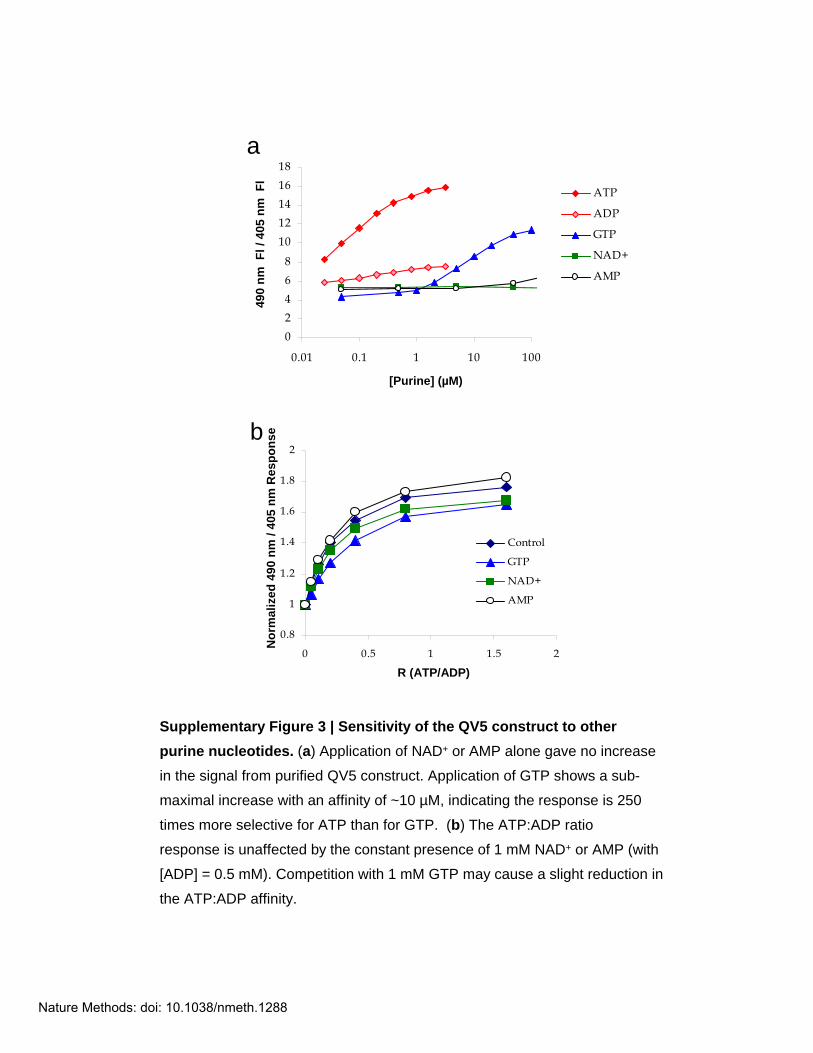
Supplementary Figure 3 | Sensitivity of the QV5 construct to other purine nucleotides. (a) Application of NAD+ or AMP alone gave no increase
in the signal from purified QV5 construct. Application of GTP shows a sub-
maximal increase with an affinity of ~10 µM, indicating the response is 250
times more selective for ATP than for GTP. (b) The ATP:ADP ratio
response is unaffected by the constant presence of 1 mM NAD+ or AMP (with
[ADP] = 0.5 mM). Competition with 1 mM GTP may cause a slight reduction in
the ATP:ADP affinity.
490
nm F
l / 4
05 n
m F
l
[Purine] (µM)
Nor
mal
ized
490
nm
/ 40
5 nm
Res
pons
e
R (ATP/ADP)
a
b
Nature Methods: doi: 10.1038/nmeth.1288
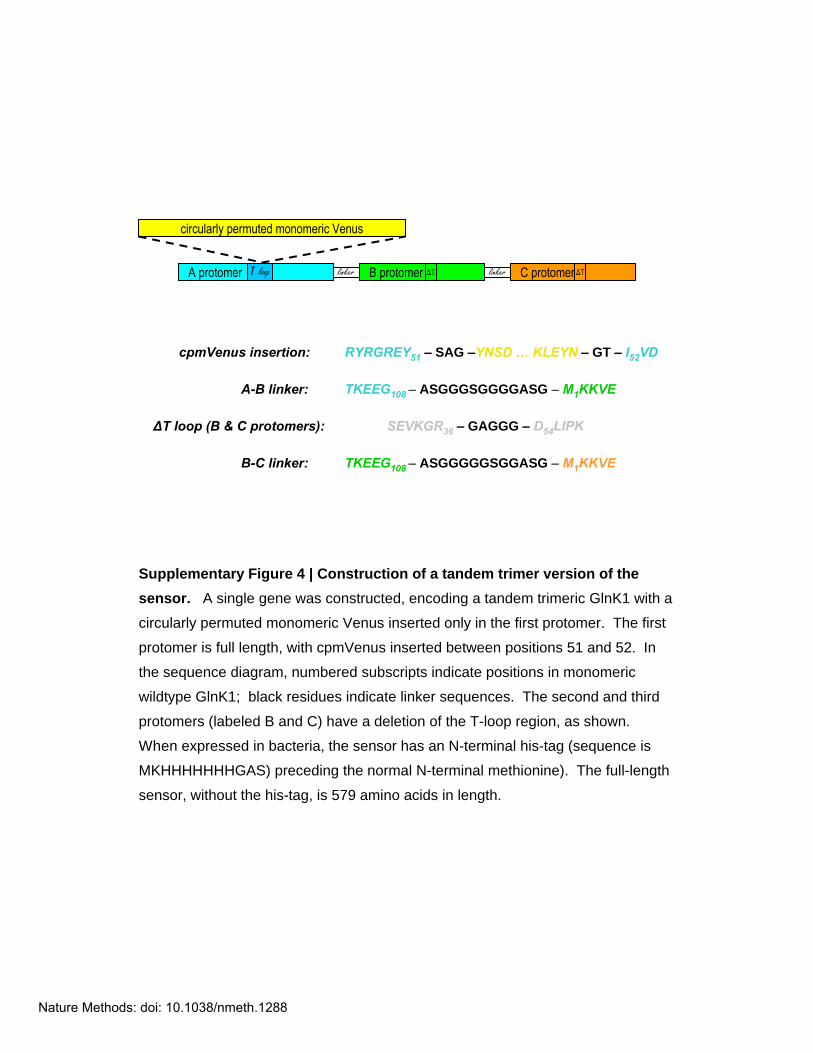
Supplementary Figure 4 | Construction of a tandem trimer version of the sensor. A single gene was constructed, encoding a tandem trimeric GlnK1 with a
circularly permuted monomeric Venus inserted only in the first protomer. The first
protomer is full length, with cpmVenus inserted between positions 51 and 52. In
the sequence diagram, numbered subscripts indicate positions in monomeric
wildtype GlnK1; black residues indicate linker sequences. The second and third
protomers (labeled B and C) have a deletion of the T-loop region, as shown.
When expressed in bacteria, the sensor has an N-terminal his-tag (sequence is
MKHHHHHHHGAS) preceding the normal N-terminal methionine). The full-length
sensor, without the his-tag, is 579 amino acids in length.
linkerA protomer C protomerB protomerT loop linker
circularly permuted monomeric Venus
ΔT ΔT
cpmVenus insertion: RYRGREY51 – SAG –YNSD … KLEYN – GT – I52VD
A-B linker: TKEEG108 – ASGGGSGGGGASG – M1KKVE
ΔT loop (B & C protomers): SEVKGR36 – GAGGG – D54LIPK
B-C linker: TKEEG108 – ASGGGGGSGGASG – M1KKVE
Nature Methods: doi: 10.1038/nmeth.1288
6.0 6.5 7.0 7.5 8.00
2
4
6
8
F 490 /
F43
5
pH
380 400 420 440 460 480 500
Excitation wavelength (nm)480 500 520 540 560 580
Emission wavelength (nm)
0.8
1
1.2
1.4
1.6
1.8
10 100 1000 10000
Nor
mal
ized
Rat
io R
espo
nse
[MgCl2] (µM)
a b
c d
Control
+ ATP
+ ADP
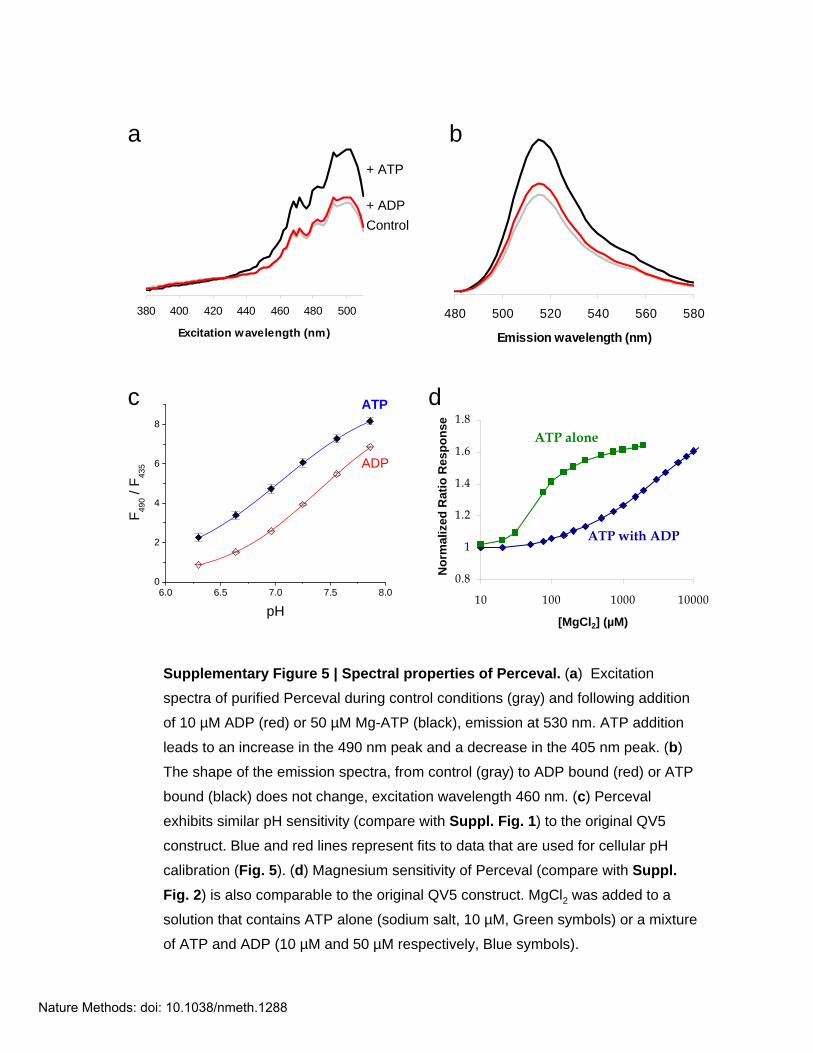
Supplementary Figure 5 | Spectral properties of Perceval. (a) Excitation
spectra of purified Perceval during control conditions (gray) and following addition
of 10 µM ADP (red) or 50 µM Mg-ATP (black), emission at 530 nm. ATP addition
leads to an increase in the 490 nm peak and a decrease in the 405 nm peak. (b)
The shape of the emission spectra, from control (gray) to ADP bound (red) or ATP
bound (black) does not change, excitation wavelength 460 nm. (c) Perceval
exhibits similar pH sensitivity (compare with Suppl. Fig. 1) to the original QV5
construct. Blue and red lines represent fits to data that are used for cellular pH
calibration (Fig. 5). (d) Magnesium sensitivity of Perceval (compare with Suppl. Fig. 2) is also comparable to the original QV5 construct. MgCl2 was added to a
solution that contains ATP alone (sodium salt, 10 µM, Green symbols) or a mixture
of ATP and ADP (10 µM and 50 µM respectively, Blue symbols).
ATP alone
ATP with ADP
ATP
ADP
Nature Methods: doi: 10.1038/nmeth.1288

Supplementary Figure 6 | Response properties of Perceval. As seen for QV5
in Figure 2 of the main paper, Perceval responds to the ATP:ADP ratio over a
wide range of absolute concentration (shown here for [ADP] = 5 µM and 500 µM).
The presence of 500 µM AMP has no effect on the response.
0.0 0.4 0.8 1.2 1.60.0
0.5
1.0
1.5
2.0
R ([ATP] / [ADP])
[ADP] = 5 µM[ADP] = 500 µM[ADP] = 500 µM (+ 500 µM AMP)
Nor
mal
ized
F49
0/ F
405
Nature Methods: doi: 10.1038/nmeth.1288

0 20 40 60 100 120 140 160
6.8
6.9
7.0
7.1
7.2
7.3
7.4
7.5
7.6
pH
time (min)
6.5 7.0 7.5 8.0
4
6
8
10
12
14
SN
AR
F-5F
ratio
pH0 20 40 60 100 120 140 160
4
6
8
10
12
14
SN
AR
F-5F
ratio
time (min)
Supplementary Figure 7 | pH calibration using nigericin (a) Raw
SNARF-5F signal for the experiment described in Fig. 5a. Application of 5 mM
2-DG leads to a decrease in SNARF-5F signal (indicating an intracellular
acidification). Following a 30 minute incubation in a high potassium solution
containing the ionophore nigericin (pH 7.5), the SNARF-5F signal is calibrated
by washing in high K solutions of varying pH (in the constant presence of
nigericin). (b) The standard SNARF-5F values are plotted against pH, and
the data are fit with a sigmoid function which is used to calibrate the
experimental SNARF-5F values to pH values in panel (c).
5 mM 2-DGa b
c5 mM 2-DG
High K / nigericin
pH 7.5
6.9
7.8
7.2
6.6
Nature Methods: doi: 10.1038/nmeth.1288

Supplementary Figure 8 | pH correction of 2DG and pH-control experiments As in Figure 5, experiments were performed either with wash-
in of 5 mM 2-DG (dark green, blue and purple) or with exchange of
extracellular solution to lower pH (light green, blue and purple). As in Figure 5c, the normalized Perceval signals from each experiment are plotted against
calibrated pH values determined from concurrent SNARF-5F measurements.
6.0 6.5 7.0 7.5 8.0
0.0
0.2
0.4
0.6
0.8
1.0
0
1
Nor
mal
ized
Per
ceva
l rat
io s
igna
l
pH
Nature Methods: doi: 10.1038/nmeth.1288
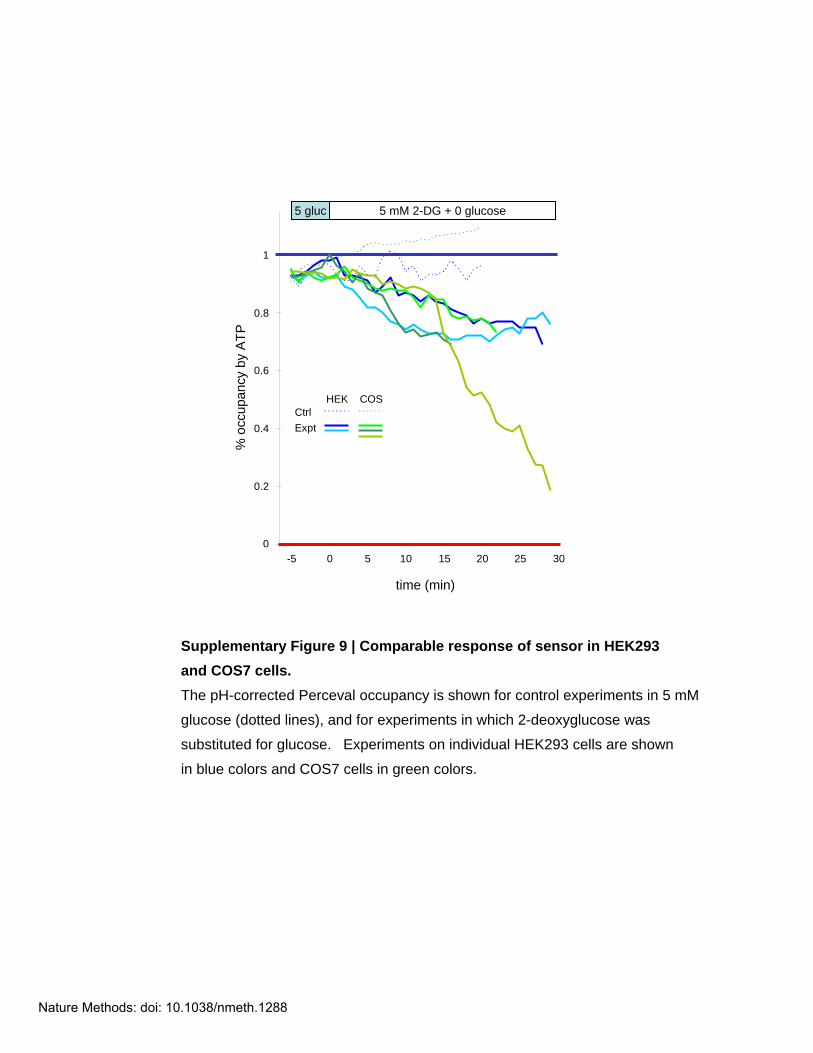
Supplementary Figure 9 | Comparable response of sensor in HEK293and COS7 cells. The pH-corrected Perceval occupancy is shown for control experiments in 5 mM
glucose (dotted lines), and for experiments in which 2-deoxyglucose was
substituted for glucose. Experiments on individual HEK293 cells are shown
in blue colors and COS7 cells in green colors.
0.2
0.4
0.6
0.8
1
-5 0 5 10 15 20 25 30
CtrlExpt
HEK COS
5 gluc 5 mM 2-DG + 0 glucose
0
% o
ccup
ancy
by
ATP
time (min)
Nature Methods: doi: 10.1038/nmeth.1288

1 ATGAAAAAGG TGGAATCCAT CATCAGGCCC GAAAAGCTGG AGATCGTTAA GAAGGCTCTC
+1 M K K V E S I I R P E K L E I V K K A L
61 TCGGACGCTG GATATGTGGG TATGACAGTC TCTGAGGTCA AGGGCACGGG CGTCCAGGGC
+1 S D A G Y V G M T V S E V K G T G V Q G
121 GGCATCGTCG AGAGGTACCG AGGAAGGGAG TACTCTGCAG GCTACAACAG CGACAACGTC
+1 G I V E R Y R G R E Y S A G Y N S D N V
181 TATATCACCG CCGACAAGCA GAAGAACGGC ATCAAGGCCA ACTTCAAGAT CCGCCACAAC
+1 Y I T A D K Q K N G I K A N F K I R H N
241 ATCGAGGACG GCGGCGTGCA GCTCGCCGAC CACTACCAGC AGAACACCCC CATCGGCGAC
+1 I E D G G V Q L A D H Y Q Q N T P I G D
301 GGCCCCGTGC TGCTGCCCGA CAACCACTAC CTGAGCTTCC AGTCCAAGCT GAGCAAAGAC
+1 G P V L L P D N H Y L S F Q S K L S K D
361 CCCAACGAGA AGCGCGATCA CATGGTCCTG CTGGAGTTCG TGACCGCCGC CGGGATCACT
+1 P N E K R D H M V L L E F V T A A G I T
421 CTCGGCATGG ACGAGCTGTA CAAGGGCGGT TCCGGAGGCA TGGTGAGCAA GGGCGAGGAG
+1 L G M D E L Y K G G S G G M V S K G E E
481 CTGTTCACCG GGGTGGTGCC CATCCTGGTC GAGCTGGACG GCGACGTAAA CGGCCACAAG
+1 L F T G V V P I L V E L D G D V N G H K
541 TTCAGCGTGT CCGGCGAGGG CGAGGGCGAT GCCACCTACG GCAAGCTGAC CCTGAAGCTG
+1 F S V S G E G E G D A T Y G K L T L K L
601 ATCTGCACCA CCGGCAAGCT GCCCGTGCCC TGGCCCACCC TCGTGACCAC CCTGGGCTAC
+1 I C T T G K L P V P W P T L V T T L G Y
661 GGCCTGCAGT GCTTCGCCCG CTACCCCGAC CACATGAAGC AGCACGACTT CTTCAAGTCC
+1 G L Q C F A R Y P D H M K Q H D F F K S
721 GCCATGCCCG AAGGCTACGT CCAGGAGCGC ACCATCTTCT TCAAGGACGA CGGCAACTAC
+1 A M P E G Y V Q E R T I F F K D D G N Y
781 AAGACCCGCG CCGAGGTGAA GTTCGAGGGC GACACCCTGG TGAACCGCAT CGAGCTGAAG
+1 K T R A E V K F E G D T L V N R I E L K
841 GGCATCGACT TCAAGGAGGA CGGCAACATC CTGGGGCACA AGCTGGAGTA CAACGGCACC
+1 G I D F K E D G N I L G H K L E Y N G T
901 ATAGTAGATC TGATCCCTAA GGTAAAAATT GAGCTCGTGG TGAAGGAGGA GGACGTCGAT
+1 I V D L I P K V K I E L V V K E E D V D
961 AACGTGATAG ACATTATTTG CGAAAATGCC CGCACAGGTA ACCCCGGCGA CGGTAAGATA
+1 N V I D I I C E N A R T G N P G D G K I
1021 TTTGTGATCC CAGTGGAGCG AGTGGTCAGG GTGCGAACCA AAGAGGAGGG AGCATCTGGT
+1 F V I P V E R V V R V R T K E E G A S G
1081 GGTGGATCCG GTGGAGGAGG TGCGTCTGGT ATGAAAAAGG TGGAAGCTAT CATCAGACCC
+1 G G S G G G G A S G M K K V E A I I R P
1141 GAAAAGCTGG AGATCGTTAA AAAGGCTCTT TCCGACGCCG GATATGTGGG TATGACAGTC
+1 E K L E I V K K A L S D A G Y V G M T V
1201 TCTGAGGTCA AAGGCCGCGG TGCAGGTGGA GGGGATCTGA TCCCTAAGGT AAAAATTGAG
+1 S E V K G R G A G G G D L I P K V K I E
1261 CTCGTGGTGA AGGAGGAGGA CGTCGATAAC GTGATAGACA TTATTTGCGA AAATGCCCGC
+1 L V V K E E D V D N V I D I I C E N A R
1321 ACAGGTAACC CCGGCGACGG TAAGATATTT GTGATCCCAG TGGAGCGAGT GGTCAGGGTG
+1 T G N P G D G K I F V I P V E R V V R V
1381 CGAACCAAAG AGGAGGGAGC ATCTGGTGGA GGTGGCGGTT CCGGAGGTGC ATCTGGTATG
+1 R T K E E G A S G G G G G S G G A S G M
1441 AAAAAGGTGG AAGCTATCAT CAGACCCGAA AAGCTGGAGA TCGTTAAAAA GGCTCTTTCC
+1 K K V E A I I R P E K L E I V K K A L S
1501 GACGCCGGAT ATGTGGGTAT GACAGTCTCT GAGGTCAAAG GCCGCGGTGC AGGTGGAGGG
+1 D A G Y V G M T V S E V K G R G A G G G
1561 GATCTGATCC CTAAGGTAAA AATTGAGCTC GTGGTGAAGG AGGAGGACGT CGATAACGTG
+1 D L I P K V K I E L V V K E E D V D N V
1621 ATAGACATTA TTTGCGAAAA TGCCCGCACA GGTAACCCCG GCGACGGTAA GATATTTGTG
+1 I D I I C E N A R T G N P G D G K I F V
1681 ATCCCAGTGG AGCGAGTGGT CAGGGTGCGA ACCAAAGAGG AGGGAAAGGA AGCATTG
+1 I P V E R V V R V R T K E E G K E A L
Nature Methods: doi: 10.1038/nmeth.1288
SUPPLEMENTARY RESULTS
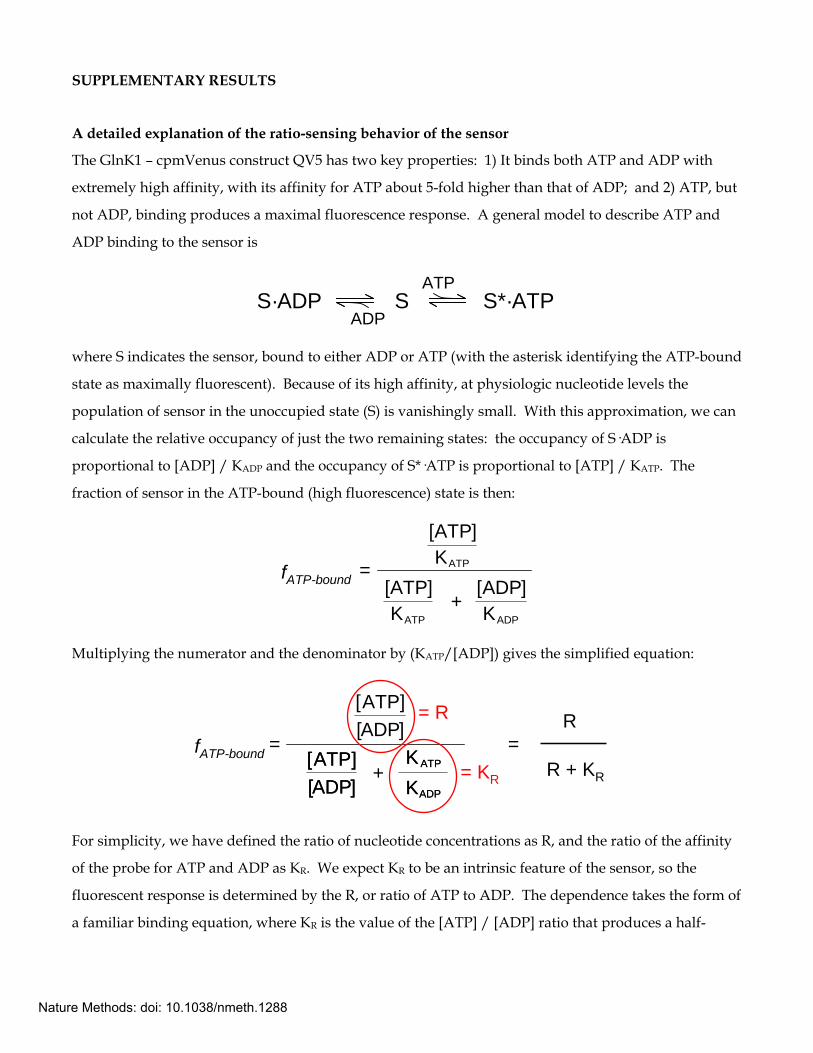
A detailed explanation of the ratio-sensing behavior of the sensor
The GlnK1 – cpmVenus construct QV5 has two key properties: 1) It binds both ATP and ADP with
extremely high affinity, with its affinity for ATP about 5-fold higher than that of ADP; and 2) ATP, but
not ADP, binding produces a maximal fluorescence response. A general model to describe ATP and
ADP binding to the sensor is
ADPS*·ATPSS·ADP
ATP
where S indicates the sensor, bound to either ADP or ATP (with the asterisk identifying the ATP-bound
state as maximally fluorescent). Because of its high affinity, at physiologic nucleotide levels the
population of sensor in the unoccupied state (S) is vanishingly small. With this approximation, we can
calculate the relative occupancy of just the two remaining states: the occupancy of S·ADP is
proportional to [ADP] / KADP and the occupancy of S*·ATP is proportional to [ATP] / KATP. The
fraction of sensor in the ATP-bound (high fluorescence) state is then:
=fATP-bound
ATPK]ATP[
ADPK]ADP[
ATPK]ATP[
+
Multiplying the numerator and the denominator by (KATP/[ADP]) gives the simplified equation:
fATP-bound =
ADPKADPKATPKATPK
]ADP[ ]ADP[]ATP[ ]ATP[
+
]ADP[]ATP[
R
R + KR
== R
= KR
For simplicity, we have defined the ratio of nucleotide concentrations as R, and the ratio of the affinity
of the probe for ATP and ADP as KR. We expect KR to be an intrinsic feature of the sensor, so the
fluorescent response is determined by the R, or ratio of ATP to ADP. The dependence takes the form of
a familiar binding equation, where KR is the value of the [ATP] / [ADP] ratio that produces a half-
Nature Methods: doi: 10.1038/nmeth.1288

maximal fluorescence response. The QV5 construct is five-fold more sensitive to ATP than ADP, so we
predict KR ≈ 0.2. This corresponds well to the actual behavior (Figure 2 in the main paper).
pH and chloride sensitivity of the ATP sensor
We found that, as for the other probes based on circularly permuted fluorescent proteins1, 2, the
fluorescence intensity of the QV5 construct was sensitive to changes in pH. Cuvette experiments on
purified QV5 construct showed that when excited at 490 nm, the fluorescence intensity for each form of
the sensor (nucleotide free, ADP-bound, half maximal ATP, and full ATP) had greatest intensity at
alkaline pH, and then diminished as the solution was acidified (Supplementary Figure 1). This
translates to a 490 nm / 405 nm ratio signal that also is highest at alkaline pH values. The fluorescence
with 435 nm excitation also diminished with acidification, but at all pH’s measured this signal was
invariant with ATP and ADP occupancy (although there was some change in fluorescence when the
binding site was vacant, in the absence of any nucleotide).
The fact that alkaline pH leads to increased fluorescence is seen for most GFP-based fluorescent
proteins, as protonation of the fluorescent protein’s chromophore leads to a quenching of the
fluorescence3, 4. With the QV5 construct, although the absolute intensity of the fluorescence is altered
by pH, the response to ATP is relatively insensitive to changes in pH. This is evident from the fact that
the curves for the different states of the sensor (Supplementary Fig. 1b,c) are approximately parallel in
the range of cellular pH, indicating that the response to ATP does not change significantly across
varying pH values. This does not indicate that pH should be of no concern (the fluorescence and ratio
are still very much pH sensitive); it does mean, however, that changes in ATP:ADP can still be
measured, even at different pH levels. Additionally, if the changes in pH are identified, then the sensor
signal can be corrected for such changes.
We next assayed for any effect that changes in chloride might have on the responsiveness of the QV5
construct, as other FP’s can exhibit chloride sensitivity5. We found that although a change in chloride
concentration from 0 to 100 mM quenched the overall fluorescence signal of the QV5 construct by
about 20% (Supplementary Fig. 1d), the ratio and responsiveness to ATP remained unchanged.
Correcting for changes in intracellular pH
Glycolytic inhibition can lead to a change in intracellular pH as well as energy charge (see the pH
change in Fig. 5a of the main paper). By measuring the pH simultaneously with the Perceval signal
Nature Methods: doi: 10.1038/nmeth.1288
(using the pH indicator SNARF-5F), we were able to use the known pH dependence from the cuvette
measurements to isolate the ATP:ADP signal from any pH-induced changes in fluorescence.
To correct the Perceval signal for pH, the Perceval signal was plotted against pH (Fig. 5 and
Supplementary Fig. 8). The pH sensitivity curves of the ATP-bound and ADP-bound sensor from the
cuvette experiments were scaled using a single factor and we made the assumption that the sensor is
near the fully ATP bound state at the beginning (fully-fed portion) of an experiment (in this case we
assumed ATP:ADP = ~4, which corresponds to an occupancy of ~0.93). For each point in time, the
Perceval signal can then be adjusted to where it falls between the maximum [ATP-bound] curve (set to
a value of 1) and the minimum [ADP-bound] curve (set to 0).
To validate this method of pH correction, we also performed a pure pH challenge to HEK cells
expressing Perceval and loaded with SNARF-5F. By lowering the extracellular pH, we were able to
induce an intracellular acidification similar in magnitude to the pH change seen during metabolic
inhibition. When the Perceval signal was pH-corrected, it remained around the maximally activated
state (1.0) for the duration of the challenge.
Sensitivity of the GlnK1 – cpmVenus construct to Mg2+ ions
One of the primary differences in the crystal structure of the GlnK1 protein bound to ADP compared to
that bound to ATP is the fact that the ATP is complexed with a Mg2+ ion whereas the ADP is not6. We
therefore determined the effect of [Mg2+] on the properties of the GlnK1 – cpmVenus QV5 construct
(Supplementary Figure 2).
ATP We first determined whether magnesium is required for the full agonist effect of ATP. Addition of
sodium ATP and chelation of any contaminating magnesium by addition of EDTA leads to the same
submaximal fluorescence response seen with ADP (Supplementary Fig. 2, green squares). This leads us
to conclude that free ATP likely acts as an incomplete agonist, in a similar manner to ADP. Subsequent
addition of magnesium to the ATP solution led to a maximal response, so we conclude that the full
fluorescence response is due to Mg-ATP binding. These results are compatible with the conclusion of
Yildiz et al.6 that the Mg2+ ion bound together with ATP is essential for stabilizing the closed state of
the T-loop.
Nature Methods: doi: 10.1038/nmeth.1288
ADP The affinity of ADP for Mg2+ is much weaker than that of ATP, and it seemed possible that the
sensor might be simply a Mg2+ sensor whose affinity depended on which nucleotide was bound. To
investigate the possibility that a maximal fluorescence effect could be produced by Mg2+ in the binding
site – regardless of whether ATP or ADP is bound -- we added potassium ADP to the sensor in the
absence of any free Mg2+. This gave a response identical to the Mg-ADP response seen in control
experiments. To investigate the effect of Mg2+ on the ADP-bound sensor, we then added MgCl2 to the
solution (Supplementary Fig. 2, red circles). If Mg2+ bound to the ADP-bound sensor could produce a
maximal response, then we would expect a curve with a response similar to what we saw with the
Mg2+ addition to ATP (but with higher Mg2+ concentrations required due to the lower Mg2+ affinity of
ADP). We observed the opposite result: upon MgCl2 addition, there was a slight decrease in the
fluorescent signal. We conclude that Mg2+ plus ADP does not produce the same maximal response as
Mg-ATP.
Finally, we investigated whether Mg-ADP competes with free ADP, free ATP and Mg-ATP for GlnK1
binding. To do this, we took advantage of the different relative affinities of ATP and ADP for Mg2+. By
adding MgCl2 to a mixture of ATP and ADP, we were able to predict significantly different outcomes
for whether Mg-ADP is competing for the site or not. In each case, as we add MgCl2 we should see a fast
increase in fluorescence as Mg2+ binds to the high affinity ATP and produces a response proportional to
the ATP:ADP ratio. If Mg-ADP binds in the pocket and acts identically to free ADP, then we should
see no further effect on the fluorescence as Mg2+ binds to ADP (at higher concentrations of MgCl2 due
to its lower affinity). If, however, Mg-ADP does not bind to the site, as we increase the [Mg2+], we
should see an increase in the signal as the free [ADP] is lowered by the Mg2+. This second scenario is
what the data show (Supplementary Fig. 2, blue diamonds): as Mg2+ was added to the solution, the
response appeared more and more like ATP alone rather than as a mixture of ATP and ADP.
In summary, it appears that only Mg-ATP is capable of producing the conformational change that leads
to the maximal fluorescence change in our sensor. The non-Mg2+-bound ATP and ADP species
compete with Mg-ATP and produce only a small change in fluorescence, while Mg-ADP does not
change fluorescence or compete for binding sites.
Nature Methods: doi: 10.1038/nmeth.1288
SUPPLEMENTARY METHODS
Random library construction. A pair of long oligonucleotides with complementary 3’ ends was used to
synthesize the N-terminal (pre-KpnI site) or C-terminal (post-BglII site) coding sequence of GlnK1.
Selected sites in each oligonucleotide were synthesized using a doped mixture of nucleotides,
corresponding to 97% of the wild-type nucleotide and 1% each of the other nucleotides.
For each section of the coding sequence, the two oligonucleotides (each one constituting
a pool of mutant sequences) were combined, annealed, and subjected to a single primer
extension reaction with Taq polymerase. The full-length product was cut with appropriate restriction
enzymes and ligated into a previously prepared sensor construct. Each individual transformant colony
was streaked onto a sector of a selective bacterial plate and allowed to grow before screening. Two
libraries were prepared, one with mutations in the N-terminal half and the other with mutations in the
C-terminal half. Each library pool had approximately 30 base sites with potential mutations, so that the
average nominal mutation rate was approximately one mutation per colony.
Materials. Oligonucleotides were purchased from Integrated DNA Technologies (Coralville, IA), and
custom gene synthesis was performed by Genscript (Piscataway, NJ; web:www.genscript.com).
Protein expression and purification. Cuvette experiments: To eliminate coassembly with native GlnK and
GlnB subunits, his7-tagged proteins were expressed in the ΔglnB, ΔglnK strain UNF3435 (ref. 8)
generously provided by Mike Merrick, John Innes Centre, Norwich, UK. Bacteria were grown in
aerated liquid culture for 24 hours at 37°C, and then transferred to room temperature for an additional
24 hours. Bacteria were then centrifuged and lysed with the CelLytic B reagent (Sigma). Proteins were
purified using a Ni-NTA Spin Kit (QIAGEN, Valencia, CA) according to manufacturer’s instructions.
96 well plate experiments: Individual colonies of bacteria were picked and streaked onto sectors of agar
plates. Following 24 hours at 37°C, plates were transferred to 4°C, and incubated for 4 to 7 days to
allow protein expression. Bacteria were then transferred from the sector of the agar plate to a well in a
96 well plate and resuspended in 2xYT media. The bacteria were then transferred to a 96 well iLAP
plate (H9412 from Sigma, St. Louis, MO) for lysis and Ni2+ chelate binding and were incubated at 4°C
overnight. The wells were then washed according to manufacturer’s instructions and the proteins were
eluted with the standard MOPS buffer (see recipe below), with the addition of 20 mM imidazole and
0.1% bovine serum albumin (BSA), pH 7.3 for 1 hour at room temperature. The proteins were then
transferred to a 96 well plate (Corning Costar, Lowell, MA) that had been blocked with the BSA
solution overnight.
Nature Methods: doi: 10.1038/nmeth.1288

Fluorometry. Cuvette Experiments: Aliquots of purified sensor protein were added to a cuvette
containing 100 mM MOPS, 50 mM KCl, 5 mM NaCl, and 0.5 mM MgCl2, pH 7.3 with KOH, unless
otherwise noted. All nucleotides were added with Mg2+ concentration calculated to remain at 0.5 mM
free Mg2+ (buffer calculations were based on the stability constants from ref. 9 and confirmed in several
cases by fluorescence measurements with mag-fura-2). Fluorescence was measured using a Fluorolog-
3, HORIBA Jobin Yvon (Edison, NJ). For all excitation experiments, slit widths were set at 2 nm for
excitation wavelength and 10 nm for emission wavelength. For excitation spectra, the excitation range
was 380 nm to 510 nm, with readings taken every 2 nm. Emission wavelength was 530 nm (slit width 5
nm) with an integration time of 1 s. For all other excitation data, measurements were taken at 405, 435,
and 495 nm, with emission read at 520 nm. For each point, 3 scans, each with a 0.3 s integration time,
were averaged. For kinetic determination, the excitation wavelength was 500 nm, emission at 525 nm,
integration time 0.3 s, samples taken with a 1 s interval.
Cellular imaging. Human embryonic kidney 293 cells (HEK293) and COS-7 (American Type Culture
Collection, Manassas, VA) were transiently transfected with a Perceval expression plasmid using
electroporation. For experiments using SNARF-5F, 10 µM of the acetomethoxy ester form of the dye
(Invitrogen, Carlsbad, CA) was loaded into the cells for 30 minutes prior to imaging in a dye-free
solution. During imaging, the solution supply was constantly bubbled with 95% air and 5% CO2
(calculated to give a pH of 7.3) and delivered through a flow-through heater (Warner Instruments,
Hamden, CT) at a temperature of 31–33°C. Unless otherwise specified, the extracellular solution was
composed of (in mM): 129.5 NaCl, 25 NaHCO3, 10 D-glucose, 2.5 KCl, 1.25 NaH2PO4, 2 CaCl2, and 1
MgCl2. In experiments with 2-deoxyglucose, 5 mM 2-deoxyglucose was substituted for 10 mM
glucose.
Imaging was performed with a pco (Kelheim, Germany) Sensicam QE CCD camera mounted on an
Olympus Optical (Tokyo, Japan) BX51 upright microscope equipped with a 60x, 0.9 numerical aperture
(NA) objective. A rapid wavelength switching monochromator (Polychrome IV; T.I.L.L. Photonics,
Gräfelfing, Germany) with a 12.5 nm slit width was used for fluorescence excitation in conjunction with
a 515 nm dichroic mirror (515DCXR) and a 535/25 nm band pass filter (D535/25) for collecting
Perceval fluorescence emission. The SNARF-5F signal was obtained by exciting at 540 nm and
alternating between a cube containing a Q565LP dichroic mirror + D585/20 nm band pass filter and
Q595LP dichroic mirror + HQ645/75 nm band pass filter. The ratio of these two emission wavelengths
Nature Methods: doi: 10.1038/nmeth.1288
reports the intracellular pH. All filters were purchased from Chroma Technology (Rockingham, VT).
Backgrounds were subtracted from each image by taking the average of a cell-free region of the image
and subtracting that value from each image prior to analysis.
pH control and calibration
For experiments where extracellular pH was modified, NaHCO3 was lowered to 10 mM [pH 6.9] or 5
mM [pH 6.6] (sodium balanced with NaCl). For experiments in which SNARF-5F was used to
determine intracellular pH, the SNARF-5F signal was calibrated by using the high K+/nigericin
method7; for an example of this calibration method, see Supplementary Figure 7. Calibration solution
contained 5 µg/ml nigericin in a high [K+] bathing solution: (in mM) 130 KCl, 10 NaCl, 2 CaCl2, 1
MgCl2, 10 MOPS, pH 7.8 with KOH. Additional pH solutions (pH 7.5, 7.2, 6.9 and 6.6) were made by
adding MOPS in the acid form to the pH 7.8 solution.
REFERENCES
1. Nagai, T., Sawano, A., Park, E. S., & Miyawaki, A. Circularly permuted green fluorescent proteins
engineered to sense Ca2+. Proc Natl Acad Sci U S A 98, 3197–3202 (2001).
2. Belousov, V. V., Fradkov, A. F., Lukyanov, K. A., Staroverov, D. B., Shakhbazov, K. S., Terskikh,
A. V., & Lukyanov, S. Genetically encoded fluorescent indicator for intracellular hydrogen
peroxide. Nat Methods 3, 281–286 (2006).
3. Brejc, K., Sixma, T. K., Kitts, P. A., Kain, S. R., Tsien, R. Y., Ormö, M., & Remington, S. J. Structural
basis for dual excitation and photoisomerization of the Aequorea victoria green fluorescent protein.
Proc Natl Acad Sci U S A 94, 2306–2311 (1997).
4. Kneen, M., Farinas, J., Li, Y., & Verkman, A. S. Green fluorescent protein as a noninvasive
intracellular pH indicator. Biophys J 74, 1591–1599 (1998).
5. Nagai, T., Ibata, K., Park, E. S., Kubota, M., Mikoshiba, K., & Miyawaki, A. A variant of yellow
fluorescent protein with fast and efficient maturation for cell-biological applications. Nat Biotechnol
20, 87–90 (2002).
6. Yildiz, O., Kalthoff, C., Raunser, S., & Kühlbrandt, W. Structure of GlnK1 with bound effectors
indicates regulatory mechanism for ammonia uptake. EMBO J 26, 589–599 (2007).
7. Thomas, J. A., Buchsbaum, R. N., Zimniak, A., & Racker, E. Intracellular pH measurements in
Ehrlich ascites tumor cells utilizing spectroscopic probes generated in situ. Biochemistry 18, 2210–
2218 (1979).
Nature Methods: doi: 10.1038/nmeth.1288

8. Arcondeguy, T., van Heeswijk, W.C, & Merrick, M. Studies on the roles of GlnK and GlnB in
regulating Klebsiella pneumoniae NifL-dependent nitrogen control. FEMS Microbiology Lett. 180, 263-
270 (1999).
9. Martell, A.E., & Smith, R.M. NIST Standard Reference Database 46 Version 8.0; NIST critically
selected stability constants of metal complexes. National Institute of Standards and Technology
(2004).
Nature Methods: doi: 10.1038/nmeth.1288