natural resources, the environment and agriculture chapter 10
TRANSCRIPT

Natural Resources,the Environmentand Agriculture
Chapter 10

Topics of Discussion
Agriculture and the environmentValuation of non-market goodsEconomics of soil conservationGovernment policies for agriculture,
natural resources, and the environment
2
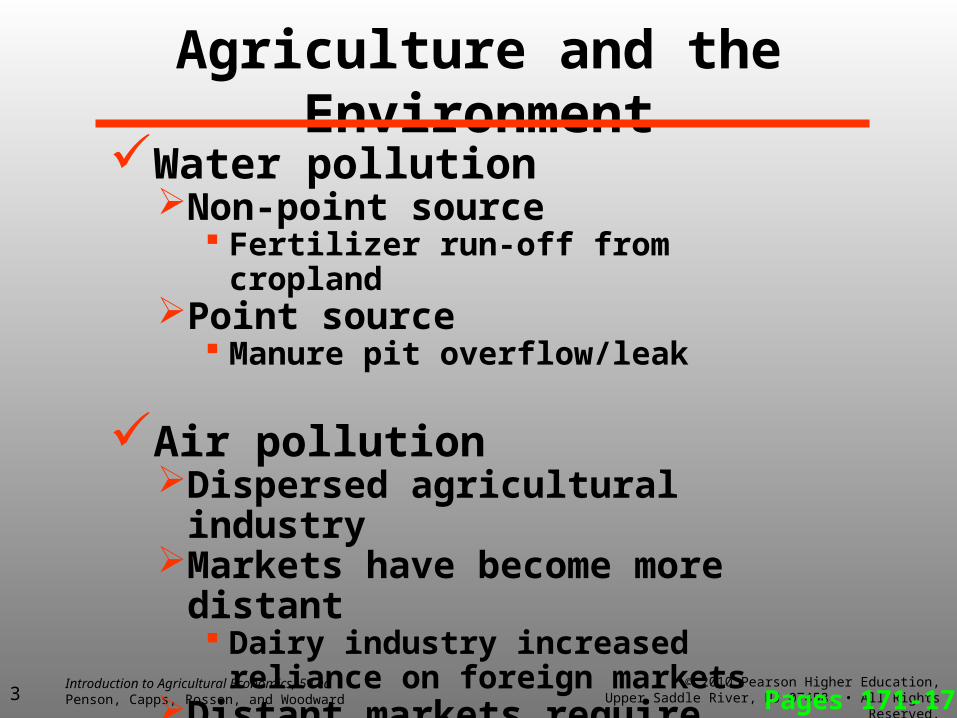
Agriculture and the Environment
Water pollutionNon-point source
Fertilizer run-off from croplandPoint source
Manure pit overflow/leak
Air pollutionDispersed agricultural industry Markets have become more distant
Dairy industry increased reliance on foreign markets
Distant markets require extension transportation system to obtain goods
Pages 171-1763
4
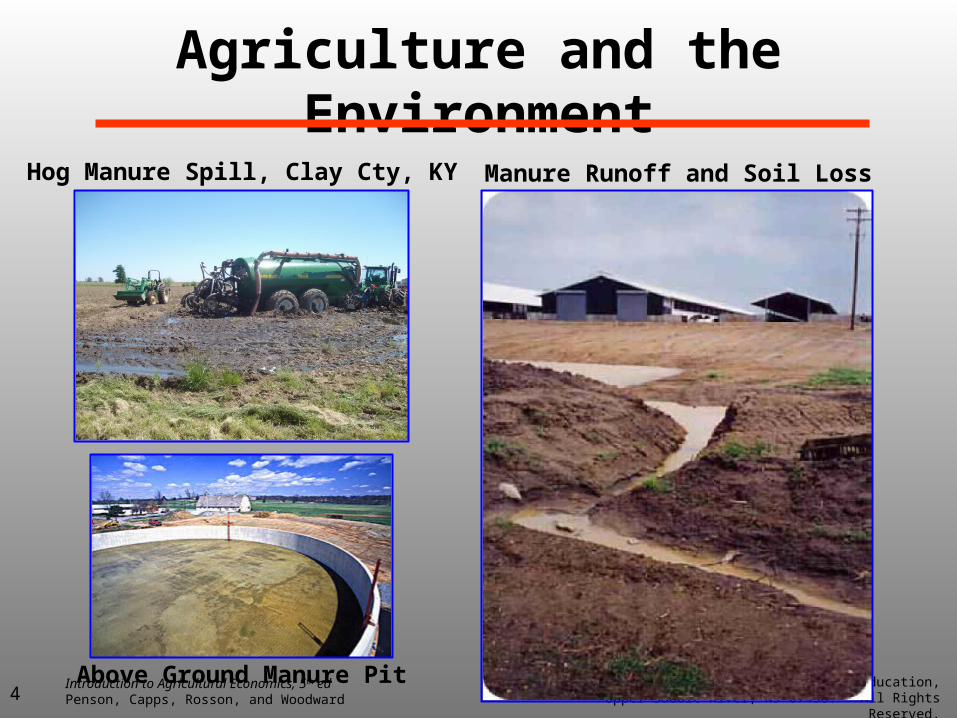
Agriculture and the Environment
Above Ground Manure Pit
Manure Runoff and Soil LossHog Manure Spill, Clay Cty, KY
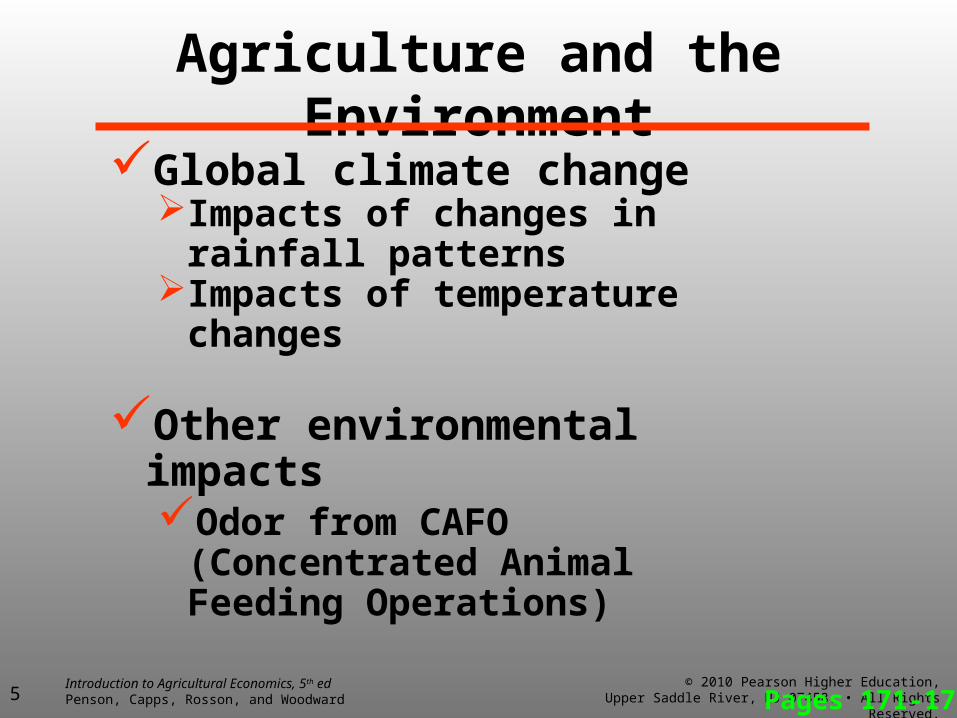
Agriculture and the Environment
Global climate changeImpacts of changes in rainfall
patternsImpacts of temperature changes
Other environmental impactsOdor from CAFO (Concentrated
Animal Feeding Operations)
Pages 171-1765
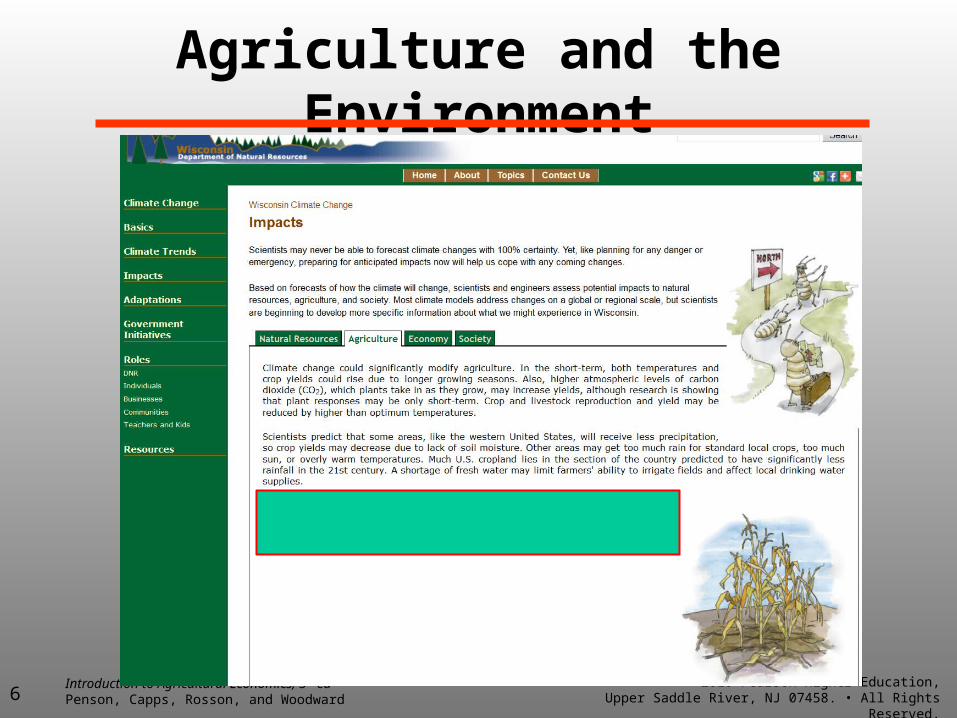
Agriculture and the Environment
6

Agriculture and the Environment
7

Economics of the EnvironmentFrom Ch. 8 we saw that if an economy is
fully efficient then Private actions of consumers and producers
will maximize total surplus Referred to as being Pareto Efficient
Can the same be said for environmental impacts of economic activity? Is the efficient level of environmental
impacts being generated?
Pages 1778

Economics of the Environment
Does the environment have value? Example of the impacts of water pollution Users of a particular water resource would
be willing to pay (WTP) something to reduce (abate) the level of pollution
→ Implicit demand for environmental improvements Demand curve for pollution abatement? Similar to market commodities
Page 1779
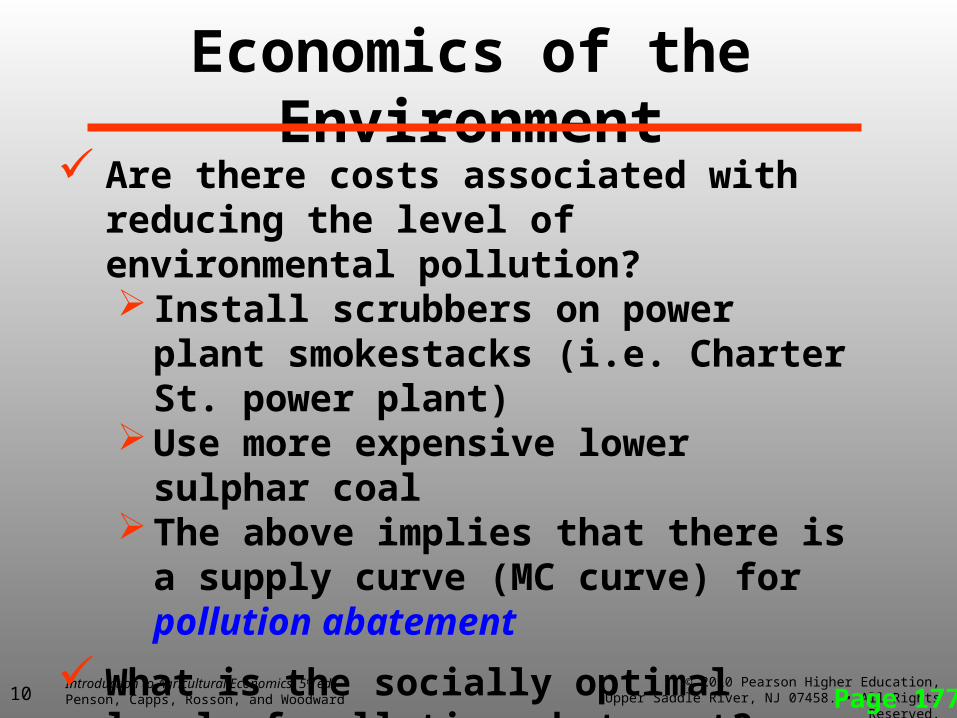
Economics of the Environment Are there costs associated with reducing the
level of environmental pollution? Install scrubbers on power plant
smokestacks (i.e. Charter St. power plant) Use more expensive lower sulphar coal The above implies that there is a supply
curve (MC curve) for pollution abatement
What is the socially optimal level of pollution abatement? Should pollution be reduced to 0?
Page 17710
Page 177
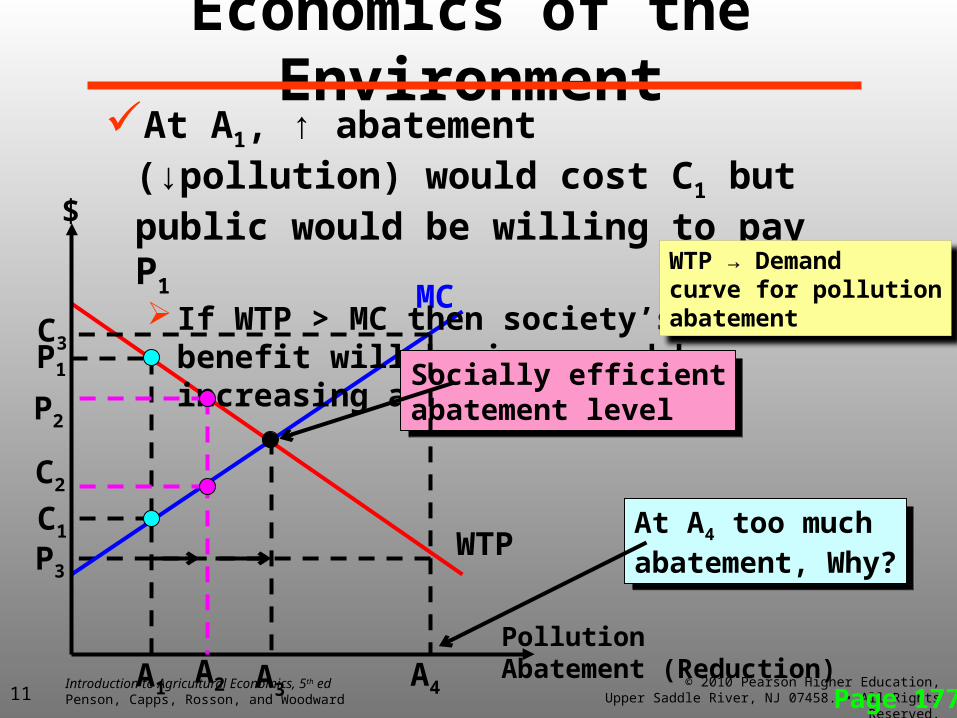
WTP
MC
PollutionAbatement (Reduction)
$
P1
C1
A1 A3
At A1, ↑ abatement (↓pollution) would cost C1 but public would be willing to pay P1
If WTP > MC then society’s net benefit will be increased by increasing abatement
Economics of the Environment
Socially efficientabatement level
Socially efficientabatement level
A2
C2
P2
C3
P3
A4
At A4 too much abatement, Why?
At A4 too much abatement, Why?
11
WTP → Demandcurve for pollutionabatement
Page 177
Unlike typical market goods such as food, clothes, etc. We cannot use market information to determine
value of pollution abatement WTP is obtained using a variety of procedures
generally referred to as non-market valuation techniques
Will a market develop for environmental improvement and socially optimal outcome? Usually not because the characteristics of
efficient property rights are not satisfied for environmental goods
Economics of the Environment
12

Efficient Property RightsEfficient property rights are characteristics
that ensure a socially optimal provision of goods and services will be providedProperty rights: Privileges and limitations that
are associated with the ownership of a resourceEnforceability: Can enforce individual property
rightsTransferability: One is able to transfer property
rights from one individual to anotherExclusivity: All associated benefits and costs are
received by only one individual at a timePages 178-17913

Efficient Property RightsEnforceability: security of individual rights
If not present then there is nothing to stop someone from taking the good from its owner
No one would produce the good as not assured will get paid
No one would purchase because they could take without paying or it could be taken without permission
Pages 178-17914
Efficient Property RightsTransferability: Property can be
transferred from one individual to anotherExample is laws prohibiting the sale of certain
goods Sale of goods made of ivory from endangered
speciesNo markets will arise because sale is not
allowedEfficient transfer from one individual to
another cannot occur
Pages 178-17915

Efficient Property RightsExclusivity: All associated benefits and
costs are received by only one individual at a timeOne example of this not existing when
some costs are not borne by the producer of the good but by the public at large
Pages 178-17916
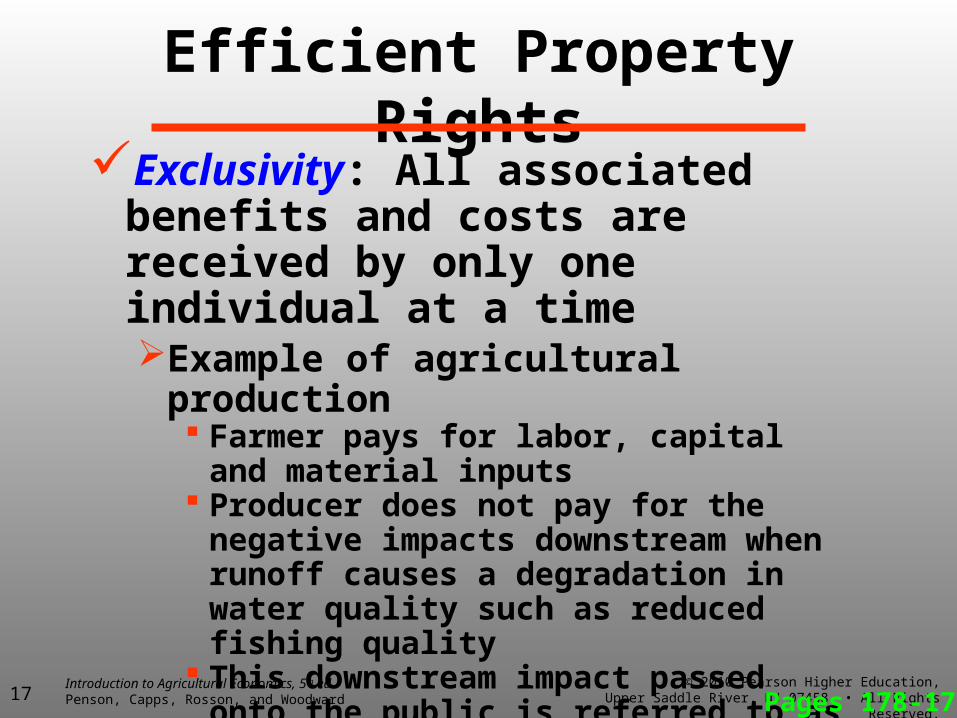
Efficient Property RightsExclusivity: All associated benefits and
costs are received by only one individual at a timeExample of agricultural production
Farmer pays for labor, capital and material inputs
Producer does not pay for the negative impacts downstream when runoff causes a degradation in water quality such as reduced fishing quality
This downstream impact passed onto the public is referred to as an externality as the producer of the impact does not pay for its cost
Pages 178-17917
Concept of ExternalityExternality
There exists positive as well as negative externalities
Example of positive externality: Honey producer’s impact on neighbors' apple crop
Example of negative externality: Playing loud music in your apartment to the point that it wakes your neighbors
Pages 178-17918

Page 179
Concept of Externality
Q
$
D
C
B
A6
15
Pm
Qm
Below represents aggregate market demand and supply for good, Q
Sm=MCm
Dm
Total willingness to pay = A + B + C + D
Producer surplus = BConsumer surplus = C
+ DTotal (societal) surplus
is B + C + D
19

Page 179
Concept of ExternalitySuppose the production of Q causes
pollution Assume pollution imposes costs on others
due to degradation of water resources Neither producers nor consumers of this
good takes these costs into account i.e. are external to the market
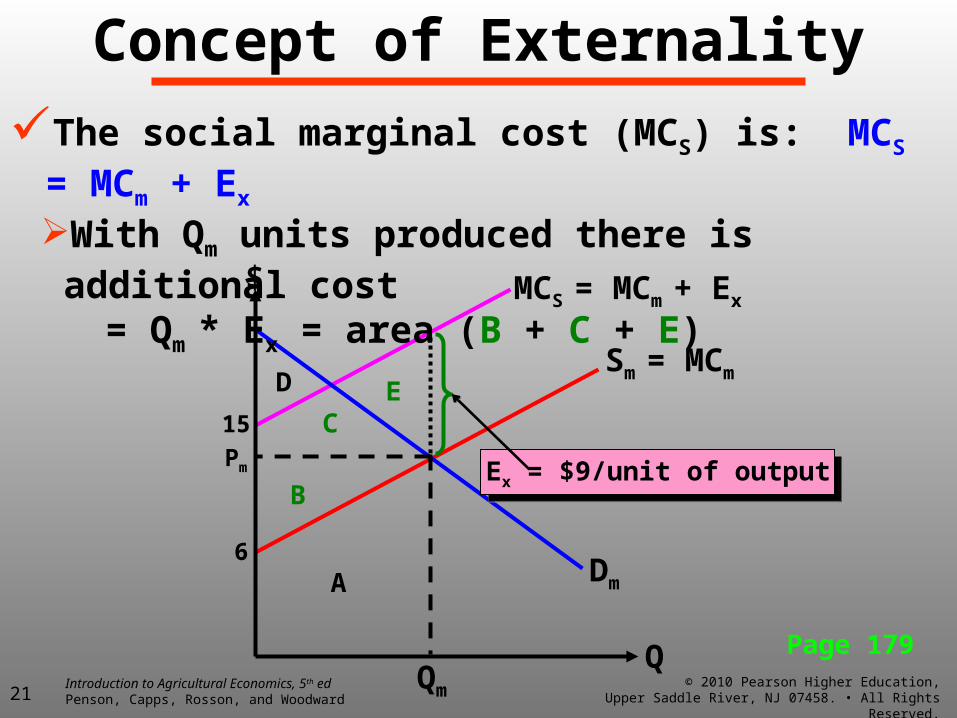
For simplicity lets assume these external costs (Ex) are constant at $9/unit of Q
The social marginal cost (MCS) per unit of production is: MCS = MCm + Ex
20
Page 179
Concept of Externality
Q
$
C
B
6
15
Pm
Qm
Ex = $9/unit of outputEx = $9/unit of output
Sm = MCm
MCS = MCm + Ex
Dm
The social marginal cost (MCS) is: MCS = MCm + Ex
With Qm units produced there is additional cost
= Qm * Ex = area (B + C + E)
E
21
D
A

Page 179
Concept of Externality
Q
$
D E
C
B
A6
15
Pm
Qm
Sm = MCm
MCS = MCm+Ex
Dm
From the market equilibrium the social net benefits (SNB) = CS + PS – External CostsSNB = (B + C + D) – (B + C + E) = D – E
CS + PS External Costs
Ex = $9/unit of outputEx = $9/unit of output

Page 179
Concept of Externality
Q
$
DE
6
15
Qm
Sm = MCm
MCS = MCm+ Ex
Dm
How can we increase the SNB = (CS + PS – Externality)?What happens if we increase production to Qm*?What happens if we decrease production to Qm**?
F
G
Qm*→ SNB* = D – E –F – G → SNB* < SNBQm** → SNB** = D → SNB** > SNBAt Qm and Qm* production is inefficiently high relative to socially optimal, Qm**
Qm*→ SNB* = D – E –F – G → SNB* < SNBQm** → SNB** = D → SNB** > SNBAt Qm and Qm* production is inefficiently high relative to socially optimal, Qm**
Qm*Qm**
From above:SNB = D - E
From above:SNB = D - E
Page 179
Concept of Externality
Q
$
Qm
Sm=MCm
MCS=MCm+Ex
Dm
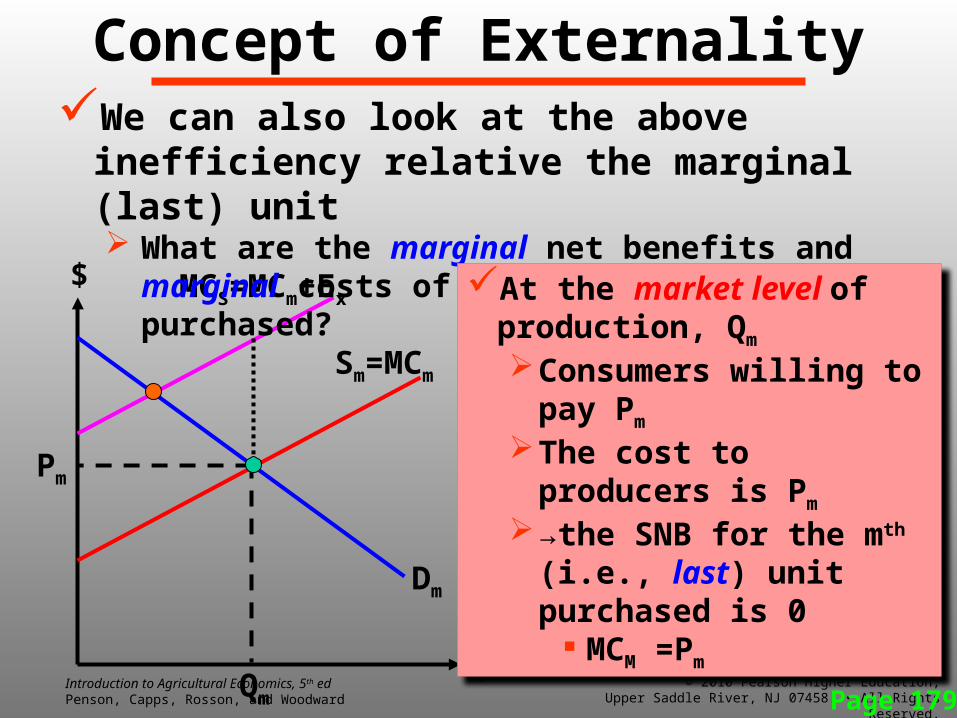
We can also look at the above inefficiency relative the marginal (last) unit What are the marginal net benefits and marginal costs
of the last unit of Q purchased?At the market level of
production, Qm
Consumers willing to pay Pm
The cost to producers is Pm
→the SNB for the mth (i.e., last) unit purchased is 0
MCM =Pm
Pm

Page 179
Concept of Externality
Q
$
Qm
Sm=MCm
MCS=MCm+Ex
Dm
We can also look at the above inefficiency relative the marginal (last) unit What are the marginal net benefits and marginal costs
of the last unit of Q purchased?
There are additional social costs (area E)
→the marginal SNB for the last unit purchased is (WTP – MCm – Ex ) where we assumed Ex=$9 per unit of Q
Pm
E
Page 179
Concept of Externality
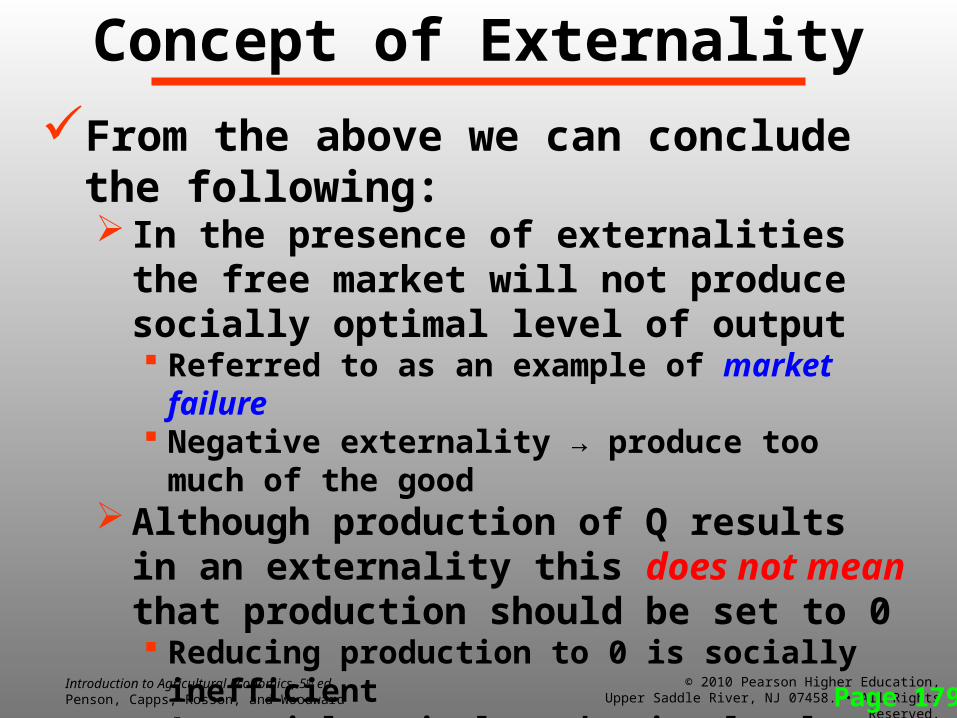
From the above we can conclude the following: In the presence of externalities the free market
will not produce socially optimal level of output Referred to as an example of market failure Negative externality → produce too much of the good
Although production of Q results in an externality this does not mean that production should be set to 0 Reducing production to 0 is socially inefficient At social optimal production level, SNB may be
positive even after subtracting external costs, Ex
Environmental Policies
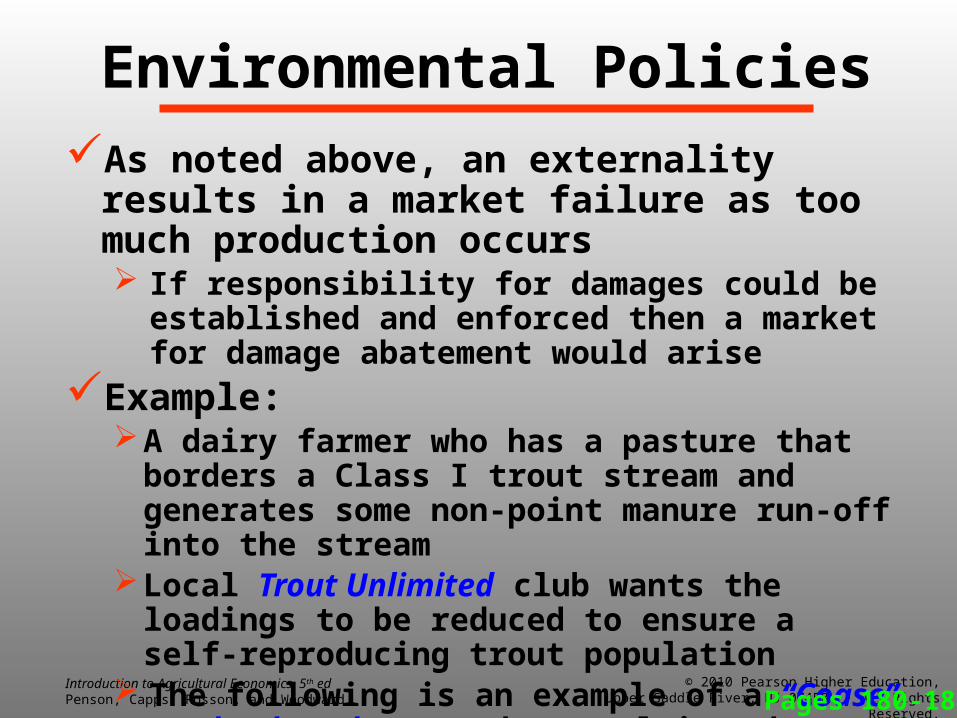
As noted above, an externality results in a market failure as too much production occurs If responsibility for damages could be established and
enforced then a market for damage abatement would arise
Example:A dairy farmer who has a pasture that borders a Class
I trout stream and generates some non-point manure run-off into the stream
Local Trout Unlimited club wants the loadings to be reduced to ensure a self-reproducing trout population
The following is an example of a “Coase” market-based approach to solving the negative externality problem
Pages 180-183

Environmental Policies
Pages 180-183
TU: “We are 140,000 conservation minded anglers united behind a simple philosophy: take care of the fish, and the fishing will take care of itself.”

Environmental Policies
The Coase Theorem Attributed to British economist Ronald Coase Describes the economic efficiency of an
economic outcome in presence of externalities → When trade in an externality is possible,
bargaining (without transaction costs) will lead to efficient outcome
In practice, obstacles to bargaining or poorly defined property rights can prevent Coasian bargaining
Pages 180-18329

Environmental PoliciesDairy farmer/Trout Unlimited example
Pages 180-183
Q
$
Qm
Sm=MCm
MCS=MCm+Ex
Qm*
Qm* is socially optimal pollution for farm
Area C is the externality (cost) of producing Qm
Trout Unlimited offers a bribe of C + D to produce Qm*
PS w/o payment = A + B + D w/payment = A+B+C+D
Social Net benefits Qm = A – CQ* = A
A
B
D
C

Environmental Policies
Coase’s approach has not been widely adopted due to the free-rider problem Suppose Trout Unlimited decides to pay upstream
polluters not to pollute Although only Trout Unlimited members pay into
the fund, all fishermen whether a member of not benefits from cleaner water
→A strong incentive not to pay the cost of association membership while enjoying the benefits (i.e. to be a free-rider)
Pages 180-183
Environmental PoliciesGiven the difficulty of obtaining an
economic efficient level of environmental resources there are a number of types of public policies used to move toward this targetCommand-and-Control policiesTaxes and subsidiesTransferable rights
Pages 180-183

Environmental PoliciesCommand and Control: Environmental
policy consisting of regulations on technology or restrictions on practicesAll economic agents treated equally
All firms required to abate to the same level All must install same equipment
Problem is that it does not recognize the diversity in the economy and differential impacts of regulation
Example: In WI, not allowed to spread liquid manure on fields in winter due to frozen soil
Example: In Dane County cannot use phosphorous in fertilizer
Pages 180-18333

Introduction to Agricultural Economics, 5th edPenson, Capps, Rosson, and Woodward
© 2010 Pearson Higher Education,Upper Saddle River, NJ 07458. • All Rights Reserved.
Environmental Policies
Example: Two farmers and a requirement to reduce non-point pollutionProducer John uses older technology →
reducing pollution could be costlyProducer Sue uses newer technology →
reducing pollution achieved relatively cheaplyIf they are neighbors, same level of total
environmental improvement achieved at a lower total societal cost if: Producer Sue w/lower abatement cost reduces more Producer John w/higher abatement cost reduces less
by the additional abatement of Producer Sue
Pages 180-18334

Environmental Policies
Pages 180-183
Figures A & B represent the abatement MC for Firms 1 and 2MC ↑ with abatement level
Fig. C combines these two figuresD2 < D1 where each firm has 5 abatement units
$ $ $
A1 A2 A1
A2
MC1
MC2
MC2
MC1
5 10 5 10 5 10000
0510
$
35
D2
D1
A B C
Environmental Policies
Pages 180-183
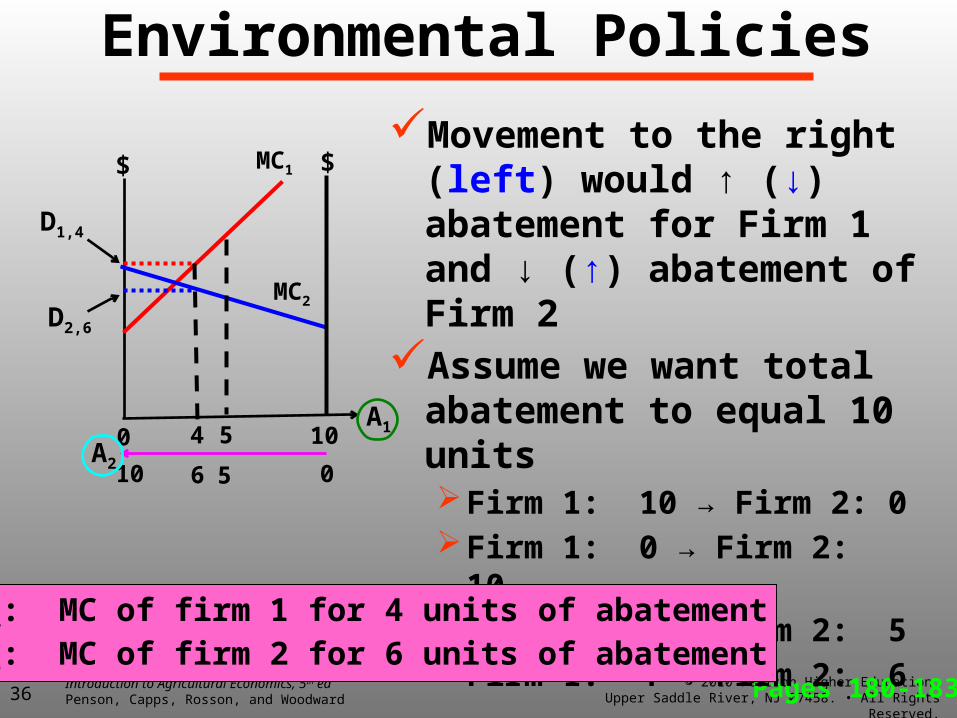
Movement to the right (left) would ↑ (↓) abatement for Firm 1 and ↓ (↑) abatement of Firm 2
Assume we want total abatement to equal 10 unitsFirm 1: 10 → Firm 2: 0Firm 1: 0 → Firm 2: 10Firm 1: 5 → Firm 2: 5Firm 1: 4 → Firm 2: 6
36
D1,4: MC of firm 1 for 4 units of abatementD2,6: MC of firm 2 for 6 units of abatement
$
A1
A2
MC2
MC1
4 100
0610
$
5
5
D1,4
D2,6

If A1 = A2 = 5 units the total abatement cost (TAC) is:TAC = A + B + C
Firm 1’s last unit of abatement cost much higher than the last unit of Firm 2’s abatement Difference = MC1*- MC2*→ that TAC could be reduced if
Firm 2 abates more, Firm 1 less TAC is minimized when MC1 = MC2 A1=3, A2=7 TAC reduced by area F
The gov’t could make such an allocation but would have to know the MC curves
B
Environmental Policies
Pages 180-183
$
A1
A2
MC2
MC1
5 100
0510
A C
Firm 1 Firm 2MC1*
MC2*
3
7
F
Introduction to Agricultural Economics, 5th edPenson, Capps, Rosson, and Woodward
© 2010 Pearson Higher Education,Upper Saddle River, NJ 07458. • All Rights Reserved.
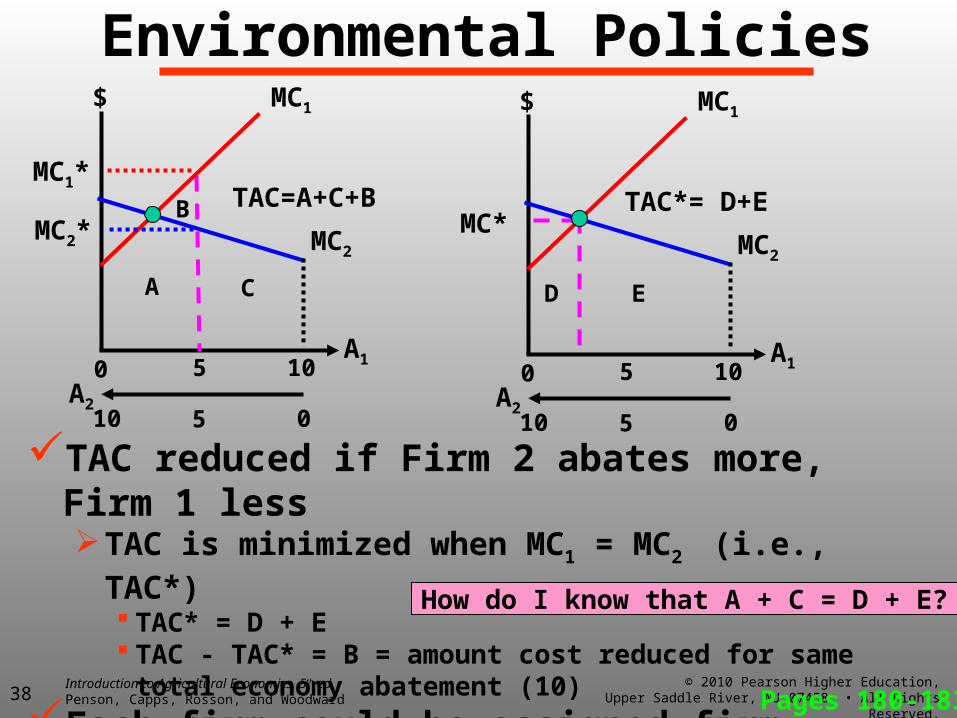
TAC reduced if Firm 2 abates more, Firm 1 lessTAC is minimized when MC1 = MC2 (i.e., TAC*)
TAC* = D + E TAC - TAC* = B = amount cost reduced for same total economy
abatement (10)
Each firm could be assigned firm-specific targetsWould have to know the MC curves of each firm
Environmental Policies
Pages 180-183
$
A1
A2
MC2
MC1
5 100
0510
A
B
C
MC1*
MC2*
38
$
A1
A2
MC2
MC1
5 100
0510
MC*TAC=A+C+B
D E
TAC*= D+E
How do I know that A + C = D + E?
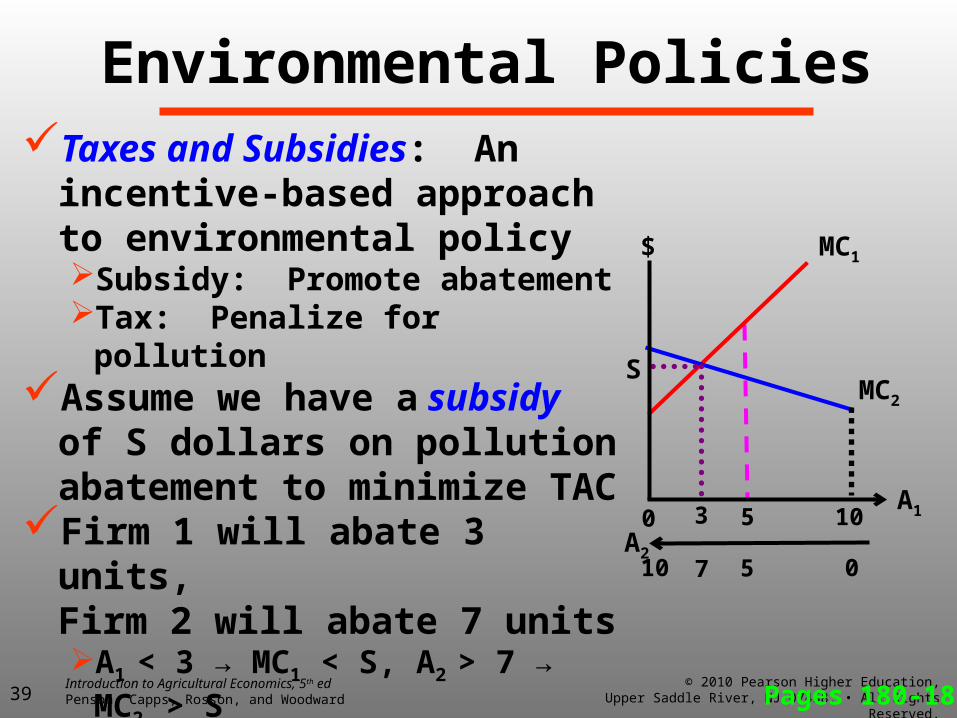
Environmental PoliciesTaxes and Subsidies: An incentive-
based approach to environmental policySubsidy: Promote abatementTax: Penalize for pollution
Assume we have a subsidy of S dollars on pollution abatement to minimize TAC
Firm 1 will abate 3 units,Firm 2 will abate 7 unitsA1 < 3 → MC1 < S, A2 > 7 → MC2 > SA1 > 3 → MC1 > S, A2 < 7 → MC2 < SA1 = 3 & A2 = 7 → MC1 = MC2 = S
Pages 180-183
$
A1
A2
MC2
MC1
5 100
0510
3
S
7
39

Environmental PoliciesA tax on pollution would work just like a
subsidy on pollution abatementA tax of $T per unit of pollution
→ each unit of abatement saves the firm $TThe firm will continue to abate as long as
the tax savings are ≥ MC of abatingOne could also tax the output whose
production generates the pollution $T*/unit of outputShifts up the firm’s (industry’s) marginal
cost curve Pages 180-18340
Introduction to Agricultural Economics, 5th edPenson, Capps, Rosson, and Woodward
© 2010 Pearson Higher Education,Upper Saddle River, NJ 07458. • All Rights Reserved.
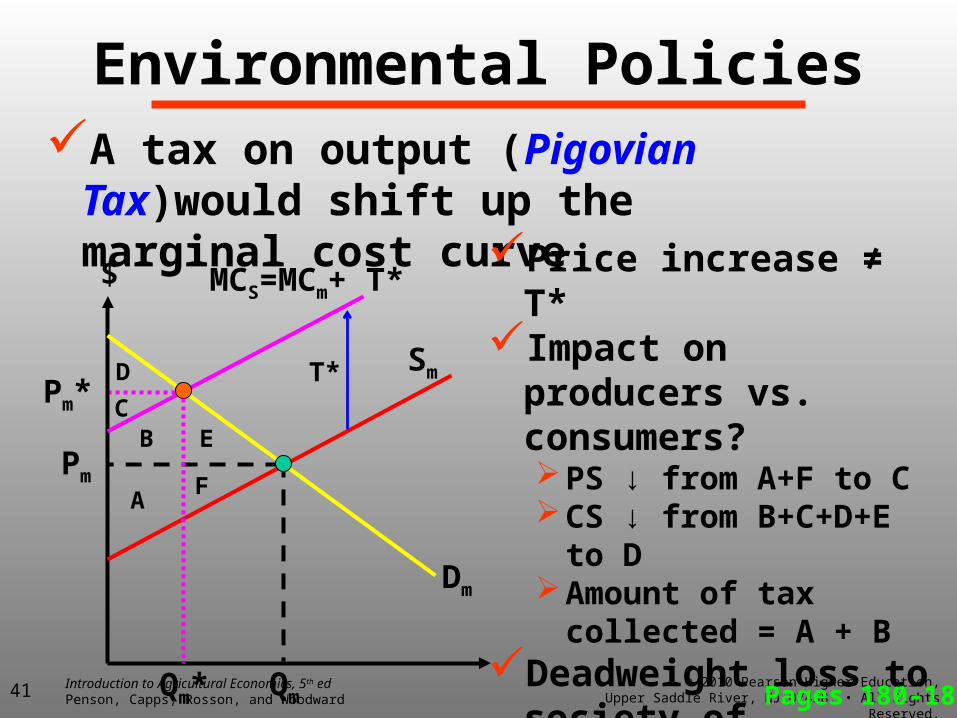
Environmental PoliciesA tax on output (Pigovian Tax)would
shift up the marginal cost curve
Pages 180-18341
$
Qm
Sm
MCS=MCm+ T*
Dm
T*
Qm*
Pm*
Pm
A
BC
D
E
F
Price increase ≠ T*Impact on producers vs.
consumers?PS ↓ from A+F to CCS ↓ from B+C+D+E to DAmount of tax collected = A
+ BDeadweight loss to society
of Pogovian tax = E+FTax collected = A + B
Introduction to Agricultural Economics, 5th edPenson, Capps, Rosson, and Woodward
© 2010 Pearson Higher Education,Upper Saddle River, NJ 07458. • All Rights Reserved.
Environmental PoliciesDifficulty with Pigovian tax is setting
tax rate to counterbalance negative externality effects$T* = $Ex?Tax revenue used to pay damages of the
externalityLobbying of gov’t by polluters
↓ of tax rate ↓ mitigating effect of the taxSub-optimal solution from society’s
perspective
Pages 180-18342

Environmental Policies
Advantage of tax/subsidy: Whatever abatement level is achieved it will be done at the lowest total cost across all agents (for society as a whole)
Disadvantage of tax/subsidy: Unless firm specific MC curves known, will not know with certainty the abatement level achievedT too low, too little abatementT too high, too much abatement
Pages 180-18343
Environmental Policies
Transferable Rights: When applied to pollution known as transferable discharge permits (TDP)
Under a TDP program rights to pollute can be bought and sold by pollutersMoves the permits to those polluters with
relatively high abatement costsAs long as aggregate pollution level stays below
the target, the gov’t does not worry who is polluting
Pages 180-183
Environmental Policies
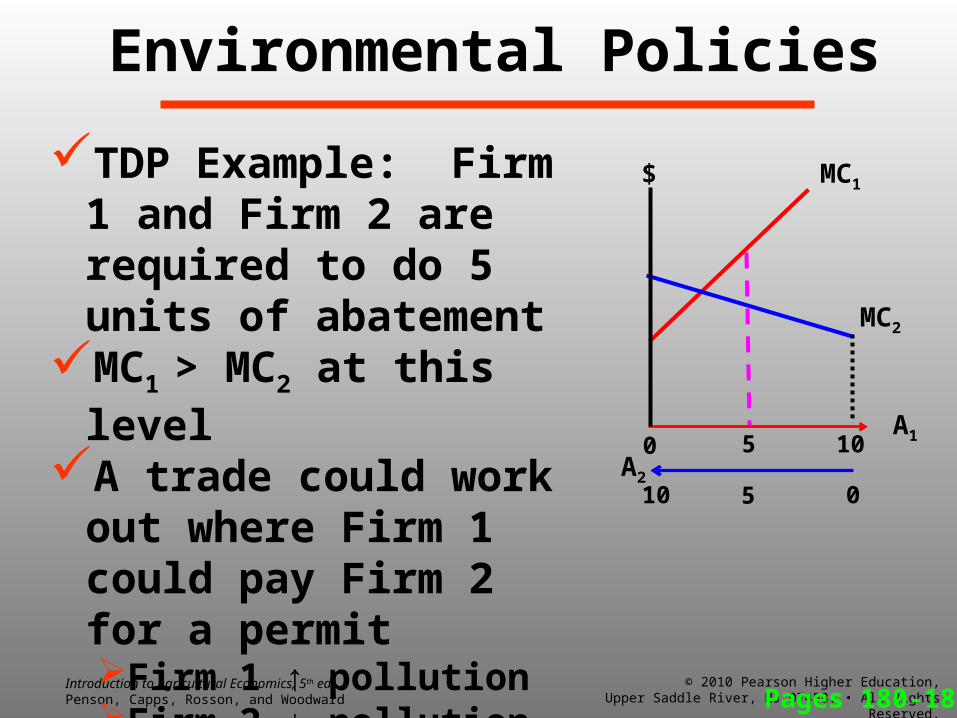
TDP Example: Firm 1 and Firm 2 are required to do 5 units of abatement
MC1 > MC2 at this levelA trade could work out
where Firm 1 could pay Firm 2 for a permitFirm 1 ↑ pollutionFirm 2 ↓ pollution
Permits could continue until MC1 = MC2 Pages 180-183
$
A1
A2
MC2
MC1
5 100
0510

Environmental Policies
Advantage of a Transferable Rights program:Are cost effective given the least cost of TCP
could be achievedGov’t can control level of pollution and leave
the allocation up to the marketplace
Pages 180-183

Natural Resources and Agriculture
Distinction between environmental issues and natural resource issues: The extent to which externalities exist Environmental issues: Important
externalities present Natural Resource issues: Costs and Benefits
of natural resource use falls mainly on the user
Lets look at the example of soil quantity and quality
Pages 183-187

Economics of Soil UseFarmer undertakes efforts to prevent soil
erosion so as to protect its quality Soil quality a fundamental issue in agriculture An asset with potentially long productive
lifetime
Major source of decline in soil quality is soil erosion resulting from rain or wind Erosion can wash away productive soil Can also degrade features of the soil that are
essential for crop productivity Soil nutrients
Pages 183-187
Economics of Soil UseSoil quality is a complex function of
physical (i.e., depth), chemical (i.e., acidity) and biological (i.e., microbial activity) What is the value of this resource? How much should be spent on preserving it?
A farmer values soil because it has the potential to generate a positive income stream over time Important question: What is the value of this
future income worth?
Pages 183-187
Discounting and Present Value
Example of 5 years of $100/year net income from an acre of land each year → total net income of $500 Not accurate that this $500 of future income is
worth $500 today, need to wait to receive it Would you prefer to wait for 3 years for $100
or receive $75 today? General principle: The further in the future
income is generated, the less it is worth today
Pages 183-187
To compare $ values over time economists use discounting to convert all $ to present values Present value: Amount of money an individual
could be given today that would make him/her indifferent to a greater amount of income in the future
What is the opportunity cost today of that future income?
Pages 183-187
Discounting and Present Value

Suppose you purchase a certificate of deposit today for $6 with an interest rate of 5% annually In 5 years that $6 would have grown due to
compound interest to $8.04 $8.04 = $6 x (1.05)5
You would be indifferent between $8.04 5-years from now and $6 today
The present value (PV) of $8.04 5-years from now given the 5% interest rate is $6.00
Pages 183-187
Discounting and Present Value
Initial deposit Number of years
Interest rate
What is the present value of $10 5-years from now with a 6% interest rate?
From the above we know that:$10=$X x (1.06)5
→ $X = $10 ÷ [(1.06)5] = $7.47 →$7.47 is the PV of $10 5-years from now and
given a 6% interest rate Present value should always be < future value with a
positive interest rate →Opportunity cost of $10 5 years from now is
$7.47 given the above interest rate Pages 183-187
Discounting and Present Value
Returning to our farm example:You have an acre of land that generates a
stream of income over time The PV of this stream would be the amount
of money the farmer would have to be paid now that would be equivalent to this stream of future income
The total PV of the stream would equal the sum of the PV’s of the individual elements of this future stream
Pages 183-187
Discounting and Present Value

Lets represent some unknown interest rate by the symbol ρ
If we have a level of income in year t represented by Yt, the PV of the stream of income (V) is:
Pages 183-187
Discounting and Present Value
31 2
1 2 3
YY YV
1 ρ 1 ρ 1 ρ
PV of yr 1income PV of yr 2
income
PV of yr 3income

Given the above assume: The farmer receives the same level of income
each year (Y*) This income is generated for a very large
number of years There is a mathematical result that the PV of
this sum over a large number of years (V*) will be approximately equal to:
V* is referred to as the capitalized value of the constant income stream, $Y* given interest rate ρ
Pages 183-187
Discounting and Present Value
** Y
Vρ
Going back to our soil example Y* earned each year from an acre of land Capitalized value of this stream of income
needs to be shared with all inputs used to generate this income Fertilizer, seed, tractor time, management, etc.
How can we determine the marginal value of the soil? What is the value of the last unit of soil added to the
generation of the above income? Page 186 in the text shows how to undertake such
an evaluation
Pages 183-187
Economics of Soil Use

Going back to our soil example Suppose the yearly profits is $10/year/acre and
ρ = 5% Capitalized Value = $10/(5/100)=$200 What is the marginal value of his soil given
other inputs used?
The next year, there was a change in tillage practices that resulted in unanticipated and significant erosion events → loss of $1/acre in return
Pages 183-187
Economics of Soil Use

The capitilized value of the now $9/acre return is 9/(5/100)=$180 →The value of soil conservation efforts is $20
($200 - $180) How does this value compare to conservation
effort costs?
Pages 183-187
Economics of Soil Use
A characteristic of surface water (i.e., lakes, rivers) are that they are typically renewed over time via rainfall and runoff
Important question for economists: How are these water resources to be allocated among competing uses? i.e., agricultural irrigation, residential use,
industrial use, recreation, etc.
Pages 187-189
Water as an Asset

“The State Water Board’s mission is to preserve, enhance and restore the quality of California’s water resources, and ensure their proper allocation and efficient use for the benefit of present and future generations.”…Mission Statement, CA State Water Resources Control Board,
CA Environmental Protection Agency
Pages 187-189
Water as an Asset

Water as an AssetWe have two farmers who are competing
for the use of a river’s water for irrigation Assume that a total of 100 acre-feet are allowed
to be extracted Applying irrigation water
increases crop yield The marginal revenue of water
and marginal cost of pumping aresuch that both farmers would like to use 80 acre feet of water But there is only 100 acre-feet
Pages 187-189

Water as an AssetOne farmer is upstream of the other
Will use 80 acre-feet of water → Only 20 acre-feet for downstream farmer
Pages 187-189
Irrigation Marginal Revenue and Marginal Cost
Irrigation Marginal Revenue and Marginal Cost
Both farmers havethe same revenueand cost curves
Both farmers havethe same revenueand cost curves
Upstream farmer
Downstream farmer
8020
MC
MR
MR = Implied value of one more unit of water
MC = Cost of producingone more unit of water
100
$
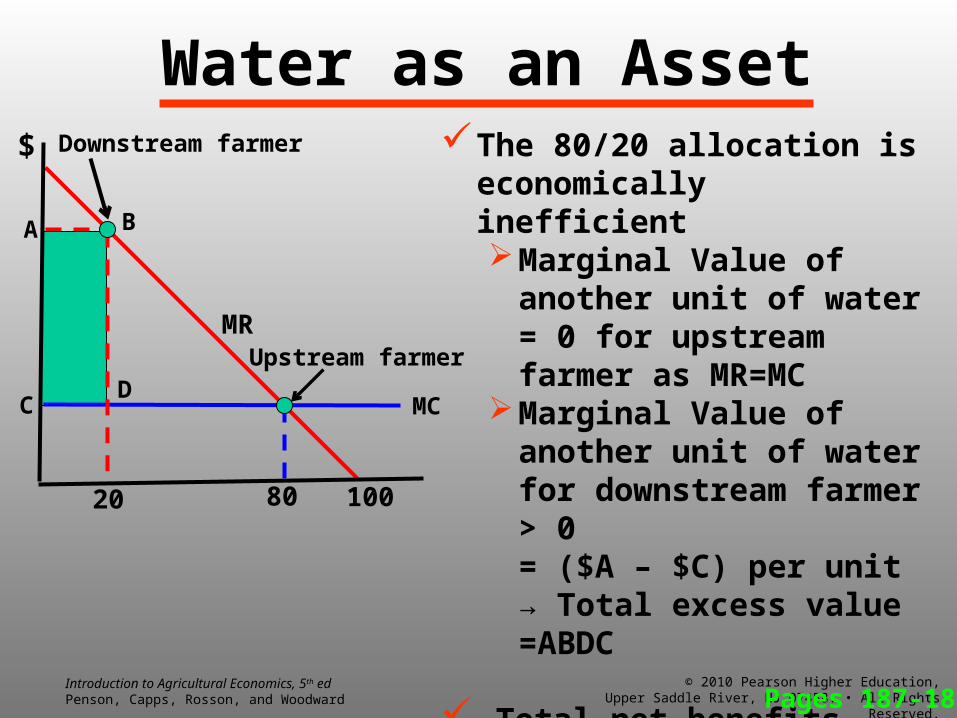
Water as an AssetThe 80/20 allocation is
economically inefficient Marginal Value of another
unit of water = 0 for upstream farmer as MR=MC
Marginal Value of another unit of water for downstream farmer > 0 = ($A – $C) per unit→ Total excess value =ABDC
→Total net benefits could be ↑ by allocating water from upstream to downstream farmer
Pages 187-189
Downstream farmer
8020
MC
MR
100
Upstream farmer
A
C
$
B
D

Water as an AssetIf the water rights are transferable
Downstream farmer would be willing to pay more for an additional unit of water than upstream farmer values the marginal unit of water
→ A deal could be made such that both are better off
Ideally, the farmers would bargain back and forth until each had 50 acre-ft of waterThis result is due to the assumed cost and
revenue structures being the same across farmers
Pages 187-189
Water as an AssetGiven the assumption of equal cost and
revenue structures for both farmersTotal net benefits would be maximized where
the net benefits of an additional water unit would be the same for both farmers
→A system in which upstream users have preference over downstream users can result in an inefficient water allocation
Pages 187-189

SummaryEconomists play a role in designing policies
that affect the environment and natural resources
Incentives matter when designing policies to achieve desired objectives
For agricultural production, water and soil are assets that have value and net benefits associated with their use

Chapter 11 is used to discuss forms of governmental intervention, including price and income supports that impact agricultural markets…