natural resources and the “quality” of economic development
TRANSCRIPT

1
Natural resources and the “quality” of economic development
Vittorio Daniele
University Magna Graecia of Catanzaro
The final, revised version of this paper has been published in:
The Journal of Development Studies, 2011, vol. 47, issue 4, pages 545-573
Abstract
Are natural resources a “blessing” or a “curse” for human development? This paper attempts to answer the question by distinguishing between a “dependence” on natural resources and an “abundance” of the same. Dependence is measured in terms of exports of metals and fuel, while resource abundance is calculated on the basis of the subsoil assets per sq. km. and per capita. Results show the existence of a negative correlation between metals and ore exports and human development, while subsoil assets measures are, rather, positively related. These effects are particularly significant in countries with a comparatively lower institutional quality. The cases of Botswana, the Democratic Republic of Congo and Equatorial Guinea, briefly examined, suggest, however, that the effects of natural resources on human and economic development can be very different, and strictly related to specific national political and institutional characteristics.

2
1. Introduction
Are natural resource a blessing or a curse for human development? Even if
conventional wisdom would suggest considering an abundance of resources as a blessing, a
large strand of empirical research supports the opposite. Since the 1990s, in fact, when
Sachs and Warner (1995; 1999) demonstrated the existence of a negative relationship
between resource dependence and economic growth over the period 1970-90, the “curse of
natural resources” hypothesis has gained increasing popularity. This hypothesis, already
put forward by Gelb (1988) and Auty (1995) through the examination of different case-
studies, has been confirmed by a vast, although non-conclusive, subsequent literature,
using different methodologies, econometric specifications and measures of resources
(Leite and Weidmann, 1999; Gylfason, 2001; Sala-i-Martin and Subramanian, 2003).
Recently, the notion of a curse has been extended. Studies offer evidence, in fact, to
indicate how countries dependent on natural resources tend to perform comparatively
worse in several indicators of human welfare, such as life expectancy, education, child
mortality or in the human development levels (Ross, 2001; Bulte et al., 2005).
The literature has identified different channels through which natural resources can
hurt growth. First, windfall gains generate volatility in government revenues that, if not
correctly managed, can lead to inflation and boom and bust in public spending (van der
Ploeg and Poelhekke, 2009). Second, a boom in natural resource exports can lead to real
exchange rate appreciation, decreasing the competitiveness of the manufacturing sector:
the so-called Dutch disease (Sachs and Warner, 1999; Auty, 2001). Third, resource rents
reduce incentives for economic reforms and diversification, favouring consumption more
than investment, and leading to a misallocation of production factors (Gylfason, 2001,
2002; Torvik, 2002)). In addition, as highlighted by a number of studies, natural resources
can produce detrimental effects on institutions and politics (Rosser, 2006; Kolstad and
Wiig, 2009). The bulk argument of this literature is that conspicuous resource rents tend to
increase voracious and rent-seeking behaviour, corruption (Leite and Weidmann, 1999;
Dalgaard and Olsson, 2008) or, more generally, to cause a deterioration in the quality of
institutions and governance (Sala-i-Martin and Subramanian; 2003; Isham et al., 2005).
The literature also contains studies that indicate how natural resource
abundance/dependence tends to be associated with low levels of democracy and with the
insurgence of authoritarian governments (Karl, 1997; Ross 2001; Wantchekon, 2002).

3
Negatively affecting the quality of institutional systems, natural resource wealth can
hamper long -term growth.
The detrimental effects on institutions particularly regards those resources
concentrated in some circumscribed areas — point-source resources — and characterised
by ready appropriation and easy tradability, such as alluvial diamonds and some minerals,
that generate easy, exploitable rents (Boschini et al. 2007; Olsson, 2007). The competition
for the appropriation of rents can, in fact, exacerbate existing tensions between ethnic
groups, or factions with political power, leading to armed conflicts (Le Billon, 2001; Ross,
2004; Olsson 2007). To explain how natural resources can lead to violence and conflicts,
scholars have usually referred to greed and grievance as motives. The former is based on
the idea that conflict stems from the greedy among elites or groups that want to take power
in order to access resource rents (Collier and Hoeffler 1998, 2002, 2004). This is the case
of “blood diamonds” in Sierra Leone, Liberia and in the Democratic Republic of Congo,
where civil war resulted in part from the involvement of neighbouring states interested in
exploiting raw materials (Humphreys, 2005; Maconachie and Binns, 2007). The grievance
motive claims, instead, that part of a population might feel deprived by rents generated by
resource exploitation and, consequently, take up arms. In this case, inequality between
individuals or groups tends to be crucial for the onset of conflicts. Grievance is typically
associated with violent secessionist movements, as happened in the oil-rich regions of
Cabinda in Angola, in the Niger Delta and in copper rich Katanga in the 1960s (Basedau,
2005).
Notwithstanding its popularity, several studies have suggested how the resource
curse findings could be very fragile (Lederman e Maloney, 2008). For example, some
economic explanations — such as the Dutch disease — tend to be too deterministic,
neglecting the role of national policies (Auty, 2001: 9; Davis and Tilton, 2005), while,
from an empirical point of view, terms of trade result as a non-significant variable in cross-
country regressions on growth (Sala-i-Martin and Subramanian, 2003; Iimi, 2006).
A number of studies suggest how the effects of natural resources are
heterogeneous and strictly related to national institutional contexts (Papyrakis and Gerlagh,
2004; Costantini and Monni, 2008). In countries with diffuse corruption, weak rule of law
or “grabbing institutions”, a natural resource boom tends to depress growth, while in the
opposite situation it produces positive effects (Stijns, 2005; Mehlum et al., 2006). From a
political economy perspective, Robinson et al. (2006) demonstrate how, in nations where
institutions limit the possibility of politicians to use windfall gains for clientelism purposes

4
and to corrupt elections, a resource boom tends to increase national income; when these
institutions are absent, perverse incentives prevail and natural resources become a curse.
The influence of natural resources on conflicts has been critically re-examined by
Fearon (2005) and Fearon and Laitin (2006) who, by using the same approach as Collier
and Hoeffler (2002), found that the relationship between primary commodities exports (in
particular oil) and civil war is neither strong nor robust. Their main results suggest that oil
predicts wars not because it provides a source of finance for rebel groups but, more likely,
high oil exports indicate a poor and fragile state, in which its military and institutional
structures are not capable of effectively repressing the outbreak of armed insurrection as
has happened, for example, in various sub-Saharan nations. The link between oil and civil
war has been also analysed by Di John (2007), who shows how the correlation between
civil war and the presence of oil is not robust. In oil rich nations where violent conflicts
occur, oil is not necessarily the cause, but other factors, such as weak government, recent
conflict, poor economic performances or war in a neighbouring state, tend to play an
important role. The overall picture that emerges from studies is that natural resources do
not have a direct effect on growth, rather an indirect effect, dependent on the quality of
national institutions, that represent the channel for the resource curse.
The notion of resource curse has also been criticized from a methodological and
econometric perspective. These criticisms particularly concern the trade-based proxies
(such as the share of primary product export) traditionally used to measure natural resource
abundance. For example, Manzano and Rigobon (2001) argue that the cross sectional
results of Sachs and Warner (1997) suffer from an omitted variable bias, suggesting that
the curse arises from the fact that resource-intensive countries accumulated foreign debt
during the 1970s, when commodity prices were high, leading to a debt overhang when, in
the 1980s, prices fell, analogously with other price bubbles. Thus, the disappointing
growth performance of resource rich countries is related to macroeconomic policies rather
than to natural resources. Leaderman and Maloney (2007), using the net natural resource
export per worker in a panel system estimator, found a strong positive relationship between
this variable and growth, concluding that there is no evidence of a resource curse.
With particular reference to mineral production, Davis (1995) demonstrated how
mineral dependent economies, that is those with a high share of minerals in export and
GDP, performed well in 1970s and 1980s, while Stijns (2005) did not find a correlation
between fuel and mineral reserves and growth during the period 1970-1989. In their
analysis on the robustness of the variables used to explain growth, Doppelhofer et al.

5
(2000) included the fraction of mining in GDP among the most robust determinants of
growth but with a positive sign. There is mixed evidence (Davis, 2009) with respect to
human development standards, too. For example, Sachs (2007: 174), in contradiction with
his previous findings, suggested how oil-rich countries tend to have higher per capita
income and consumption levels, higher life expectancy, lower child mortality rates, higher
electricity use per capita and more paved roads than oil-poor countries.
Recently, Brunnschweiler and Bulte (2008a; 2008b) have shown how resource
abundance (measured by the stock of natural capital and mineral resource assets) is
significantly associated with both growth and institutional quality. From this perspective,
the resource curse appears to be due to econometric and measurement fallacies, while
resource wealth may represent an important factor for economic development.
This paper examines the relationship between natural resources and some
indicators of human development. Taking into consideration the results of the literature on
resource curse, a clear distinction is made between natural resource dependence and
abundance. Dependence is measured by the share of ores and fuel on total merchandise
exports, the abundance of resources is, instead, measured in terms of stock, through data
on subsoil assets per capita and per square kilometre. The main findings indicate that
human development indicators are negatively influenced by metal exports, but positively
by an abundance of resources. In particular, these results are statistically significant for
countries with a comparatively lower institutional quality. To illustrate how natural
resources can have heterogeneous effects, the case studies of Botswana, Equatorial Guinea
and Republic Democratic of Congo, are briefly examined. The econometric and narrative
evidence jointly suggest how the effect of natural resources, as with other productive
factors, depends on the institutional ability to manage them.
2. The empirical analysis
3.1. Data and methodology
The aim of this section is to analyse the influence of natural resources on human
development, controlling for institutional and governance quality. Following Bulte et al.
(2005), two equations are estimated. In the eq. (1), a measure of the current human
development levels (HD) is regressed on the GDP per capita, an index of institutional
quality (IQ), a proxy for natural resources (NR) and a set of controls:
1 1 2 1 3 1 4 1 .t t t t tHD NR GDPpc IQ X (1)

6
Since it is supposed that natural resources influence the levels of development
through the institutional channel, a measure of current institutional quality is regressed on
NR and a set of controls in the eq. (2):
1 1 2 1 3 1 .t t t tIQ NR GDPpc X (2)
In both equations, all the regressors are lagged to minimize the problems of
endogeneity. In the estimates, the development levels are measured by the Human
development index (HDI) and, in order to check the robustness of the results, by the
illiteracy and child mortality rates. Institutional quality (IQ) is measured by an index
obtained as an average of the indicators of governance contained in the dataset of
Kaufmann et al. (2008). This index has been normalized to obtain values comprised
between 0 and 1, with higher values indicating more efficient institutions. In an alternative
specification, the Index of Economic Freedom is used to check the results.
Natural resources measures. The distinction between different indicators of
natural resource wealth has a fundamental importance for the results of empirical analysis.
Different types of resources tend, in fact, to influence diversely the countries’ paths of
development (Àlvarez and Fuentes, 2006) having different impacts — positive, negative or
irrelevant — on economic growth (Lay and Mahmoud, 2004). Following the suggestions
of Brunschweiler and Bulte (2008b), and diversely from other studies, a clear distinction is
made between dependence on natural resources and an abundance of the same. Resource
dependence is measured by the share of exports of metals and ores (Metals) and fuel (Fuel)
on the total exports of each country (World Bank, 2008). Since the share of primary
commodities among exports tends to vary over time, leading to possible distorted
estimates, in our analysis, averages for the period 1980-2004 are considered. Differently to
point-in-time values, this measure permits, furthermore, evaluation of the long-term effects
of natural resources on current development indicators. Data on fuels are comprised in
section 3 (mineral fuels) of the Standard International Trade Classification (SITC). Data on
metals and ores embrace sections 27, 28 and 68. These last exclude coal, precious stones
and gold (not gold ores and concentrates), some first-stage products of mining, some
construction materials and iron and steel. These limitations, with respect to a broader
definition of mineral exports, are remarkable for some developing countries, producers of
precious metals and gemstones, such as Botswana or Ghana (Crowson, 2009).
Nevertheless, these data have been frequently used in econometric analyses (Pessoa, 2008;
Béland and Tiagi, 2009) that show how metals and ores exports are negatively and strongly
related to the rate of growth, according to the resource curse hypothesis. The distinction

7
between metals and fuel allows us to take into account the effects that each of these
resources has on institutional systems. In fact, some point-source resources, such as some
minerals, are those that show a higher correlation with institutional failures like corruption,
rent-seeking and conflicts, in particular in countries with weak institutions (Collier, 2007;
Boschini et al., 2007; Olsson, 2007).
Resource abundance is measured in terms of stocks, using data on subsoil assets
estimated by the World Bank (2006) for the year 20001. Subsoil assets have been estimated
in economic terms, calculating the net present value of benefits over a time span of 20
years. Dollar values were assigned to the stocks of the main energy resources (oil, gas, and
coal) and to the stocks of 10 metals and minerals (bauxite, copper, gold, iron ore, lead,
nickel, phosphate rock, silver, tin, and zinc) for all the countries with available production
figures. According to these estimates, the three wealthiest in capital for subsoil assets per
capita were oil-producing countries: Kuwait, United Arab Emirates and Saudi Arabia; the
first two are classified as high-income countries, the latter as among those with an upper-
middle income. The first two OECD States were Norway and Canada, in 9th and 13th
positions respectively. To offer comparable international measures of subsoil wealth, in
subsequent analysis data are calculated both in per capita (Subsoil pc) and per square
kilometres (Subsoil km), in logs.
Control variables. Control variables have been selected following a criterion of
parsimony, on the basis of the statistics of Schwarz and Akaike. The regressors included
are: the log of GDP per capita in 1980; the log of price level of investment (Prinv); an
index of ethnic fractionalisation (Ethnic Fraction); two geographical dummies, for
landlocked (Landlocked) and tropical countries (Tropic). These control variables are
among those more commonly used in cross-country studies on growth. Sensitivity analysis
shows, in fact, how the GDP per capita, the price level of investment and the dummy for
tropics are among the most robust determinants of growth (Ciccone and Jarocinski, 2008).
In particular, the per capita GDP in 1980, controlling for the initial cross-country
development differences, allows us to evaluate the effects of resource
dependence/abundance on current human welfare in the long-run. Ethnic fractionalization
is negatively and significantly correlated to the level of development (Alesina et al., 2003);
in addition there are theoretical and empirical results that prove how the effect of natural
resources tends to be related to the degree of fractionalization of countries: in those highly
fractionalized, natural resources tend to lower income, while in more homogenous
countries they tend to increase it (Hodler, 2006). The absence of coastal areas — an

8
obstruction to international trade — and/or being in the tropics are, furthermore, variables
that are strongly and negatively correlated with the development levels (Warner, 2002).
Table A.1 reports the variables and their sources.
Natural resources data are reported in Table 1, for countries grouped for income
levels. The share of metals and ores exports is higher in middle income and low income
countries, while fuel exports represent about one quarter of total exports in low and upper-
middle income countries, with a considerably lower incidence in high-income countries.
Data on subsoil assets show a different picture: it is possible to observe how the lower
values are registered in low-income countries, while the richer have, on average,
considerably higher values 2.
Table. 1. Natural resources measures for countries groups Countries groups Metals Fuel Subsoil assets p. c. Subsoil per km
Low income 4.2 25.8 100.0 100.0 Lower middle income 3.5 16.5 212.0 215.4 Upper middle income 6.6 24.1 526.3 133.0 Middle income 4.9 19.0 369.2 208.4 High income: nonOECD 2.5 19.8 485.8 198.8 High income: OECD 3.0 5.0 459.3 177.0 Share of metals and ores and fuel on total merchandise exports (%); Subsoil assets with respect to the index Low Income countries = 100. Source: Calculations on World Bank, World Development Indicators (2008), and World Bank (2006).
To have an idea of how the diverse measures used in the empirical analysis can
influence the results, it is possible to compare Fig 1, that shows the partial correlation
between HDI and exports of minerals and ores in our sample of countries, with Fig. 2 that
considers subsoil wealth estimates. In the first case a very weak negative correlation exists,
in the second a positive correlation.
Fig. 1. Metal exports and HDI
R2 = 0.06
0
0.2
0.4
0.6
0.8
1
1.2
0 20 40 60 80
Metals export
HD
I200
7

9
Fig. 2. Subsoil assets per capita and HDI
R2 = 0.17
0
0.2
0.4
0.6
0.8
1
1.2
-5 0 5 10 15
log Subsoil p.c.
HD
I200
7
Table 2 reports the correlation matrix among the main variables used in the
regressions. As expected, there is a strong correlation between the human development
index and the lagged values of per capita GDP and the institutional quality proxy. The
variables measuring natural resources have different coefficients. Subsoil assets are
positively and strongly correlated with human development levels, per capita GDP and
institutional quality. Fuel exports are positively but weakly correlated with income, but
negatively and strongly with IQ, and this is consistent with the thesis according to which
fuel-dependent countries tend to perform comparatively worse in institutional performance
terms. Finally, it is important to note that metal and ore exports are negatively and
significantly correlated with HDI, per capita GDP and IQ. This indicates that economic
dependence on mining activities is related — and is, to some extent, endogenous — to the
level of development.
Table. 2. Correlation matrix
HDI2007 GDPpc1980 IQ1996 Metals Fuel Subsoil Km Subsoil pc
HDI 1,00
GDPpc1980 0,89 1,00
IQ1996 0,66 0,80 1,00
Metals -0,25 -0,14 -0,17 1,00
Fuel 0,08 0,18 -0,20 -0,15 1,00
Subsoil km 0,49 0,47 0,20 -0,21 0,52 1,00
Subsoil pc 0,42 0,46 0,17 -0,04 0,60 0,91 1,00

10
Despite the fact that the correlation among regressors is quite high, the calculation
of variance inflation factor (VIF) gives values ranging from 1 to 3, that is lower than
critical level, indicating the absence of multicollinearity.
3.2. Estimates results
Table 3 illustrates the estimation for natural resource dependence proxies. Results
show how HDI is negatively correlated with mineral exports in all specifications. Fuel
exports are, instead, weakly and negatively linked to the dependent variable only in the
baseline specification (4) with per capita GDP as control, while the sign is positive, but
substantially insignificant, when other variables are included. Overall, the estimations are
robust with a high explanatory power. The control variables have the expected signs:
unsurprisingly, initial GDP per capita and the institutional quality proxy are positively and
strongly correlated with current HDI, while investment and fractionalization measure
negatively. The introduction of geographical dummies further increases the robustness of
the model, with the dummy for landlocked countries highly significant in all specifications.
Table 3. Resource dependence and HDI
(1) (2) (3) (4) (5) (6)
Const -0.028 0.25** 0.34** -0.073* 0.28** 0.36**
(-0.70) (3.2) (4.3) (-1.8) (3.3) (4.2)
Metals -0.0020** -0.0015** -0.0014**
(-3.8) (-3.3) (-3.1)
Fuel -0.00040* 0.00056* 0.00044
(-1.7) (1.7) (1.4)
GDPpc1980 0.10** 0.085** 0.077** 0.11** 0.076** 0.069**
(22) (12) (11) (22) (8.1) (7.2)
IQ1996 0.099** 0.11** 0.16** 0.17**
(2.0) (2.4) (2.5) (2.4)
PRINV -0.037** -0.040** -0.038** -0.042**
(-2.9) (-3.1) (-2.7) (-2.8)
Ethnic Fraction -0.098** -0.087** -0.13** -0.11**
(-3.2) (-3.1) (-4.0) (-3.8)
Landlocked -0.066** -0.067**
(-3.2) (-3.3)
Tropical -0.020 -0.019
(-1.5) (-1.5)
N 136 127 127 136 127 127
R2 Adj. 0.81 0.86 0.87 0.79 0.85 0.86
lnL 1.5e+002 1.6e+002 1.7e+002 1.5e+002 1.6e+002 1.6e+002
Dependent variable: HDI year 2006. OLS estimates. Heteroskedasticity-robust standard errors. Standard error in brackets; * Significant at the 10 per cent level ** significant at the 5 per cent level.
Table 4 reports the results for estimations that include subsoil assets measures.
Both subsoil per capita and per km2 are positively linked to HDI: the per capita variable is

11
highly significant when the model controls for other determinants of HDI, while natural
capital per km2 is very robust in all specifications. The other regressors maintain their
significance and the signs of coefficients.
Table 4. Resource abundance and HDI (1) (2) (3) (4) (5) (6)
Const -0.062 0.37** 0.45** -0.042 0.43** 0.50**
(-1.2) (3.7) (4.9) (-0.83) (4.2) (5.3)
Subsoil km 0.0073** 0.0087** 0.0067**
(2.4) (3.2) (2.7)
Subsoil pc 0.0036 0.0076** 0.0063**
(1.3) (2.9) (2.5)
GDPpc1980 0.096** 0.069** 0.069** 0.10** 0.072** 0.070**
(15) (7.2) (7.7) (16) (7.7) (8.0)
IQ1996 0.16** 0.13** 0.15** 0.12**
(3.1) (2.8) (2.9) (2.7)
PRINV -0.067** -0.072** -0.071** -0.075**
(-3.4) (-4.2) (-3.5) (-4.4)
Ethnic Fraction -0.098** -0.080** -0.11** -0.090**
(-2.9) (-2.4) (-3.2) (-2.7)
Tropical -0.031* -0.035**
(-1.8) (-2.1)
Landlocked -0.064** -0.068**
(-2.8) (-2.8)
n 99 93 93 101 95 95
R2 Adj. 0.78 0.87 0.88 0.78 0.87 0.88
lnL 1.1e+002 1.2e+002 1.3e+002 1.1e+002 1.2e+002 1.3e+002
Dependent variable: HDI year 2006. OLS estimates. Heteroskedasticity-robust standard errors. T-stat in brackets; * significant at the 10 per cent level ** significant at the 5 per cent level.
The results of estimates for our sample are consistent with the literature. These
findings are, however, barely explicative for understanding the role of natural resources in
economic development for two main reasons. The first is that dependence on metal exports
(and production) tends to be higher in the poorest countries so, to some extent, it can be
considered endogenous to the development level; the second reason is that this variable,
capturing the degree of dependence of a nation on a given commodity, is not related to the
role of the resources in themselves but, instead, may serve primarily as a proxy for
development failure (Wright and Czeleusta, 2006). In this respect, it is possible to argue
that the dependence on a primary commodity is no different from any other form of
macroeconomic dependence, such as on foreign aid which, as Djankov et al. (2008) have
suggested, tends to produce analogous detrimental effects on political institutions.
For these reasons, we have split our sample into two groups on the basis of their
score in the indicators of institutional/governance index. The first group includes countries
with IQ higher than the average, the second those with lower scores. It is important to note

12
that our proxy for institutional quality is strongly correlated with the level of development,
consequently the samples reflect income level country groups. The results of estimates are
illustrated in Table 5.
Table 5. Natural resources and HDI - split sample High Institutional Quality Low Institutional Quality
(1) (2) (3) (4) (1) (2) (3) (4)
Const 0.48** 0.47** 0.52** 0.51** 0.084 0.13 0.21 0.31*
(5.7) (5.6) (4.4) (4.7) (0.67) (0.92) (1.5) (1.9)
GDPpc1980 0.063** 0.066** 0.061** 0.066** 0.099** 0.084** 0.076** 0.075**
(10) (10) (5.4) (6.0) (8.3) (5.8) (4.8) (4.3)
IQ1996 0.089** 0.074 0.15** 0.11* 0.19* 0.29** 0.31** 0.30**
(2.0) (1.6) (2.5) (1.8) (2.0) (2.6) (2.7) (2.6)
PRINV -0.045** -0.044** -0.067 -0.065* -0.030* -0.029* -0.060** -0.062**
(-2.4) (-2.4) (-1.7) (-1.9) (-2.0) (-1.7) (-2.6) (-2.5)
Ethnic Fraction -0.095** -0.091** -0.089** -0.093** -0.090* -0.14** -0.097* -0.12**
(-3.4) (-3.0) (-2.4) (-2.5) (-1.8) (-2.7) (-1.8) (-2.2)
Metals -3.7e-06 -0.0017**
(-0.006) (-4.1)
Fuel -0.00020 0.00091*
(-0.96) (2.0)
Subsoil km 0.0034 0.012**
(1.4) (2.7)
Subsoil pc 0.0025 0.0098**
(1.2) (2.0)
N 64 64 44 46 63 63 49 49
R2 Adj. 0.83 0.83 0.82 0.80 0.69 0.67 0.74 0.72
lnL 120 120 80 83 69 66 58 57
Dependent variable: HDI year 2006. OLS estimates. Heteroskedasticity-robust standard errors. T-stat in brackets; * significant at the 10 per cent level ** significant at the 5 per cent level.
In countries with higher IQ values, natural resources proxies appear substantially
insignificant, and this makes sense if one considers that in nations with better institutions
(and higher income) economic outcomes are largely based on other types of capital,
produced and intangible, than the natural one. In the second group, instead, a dependence
on metals is strongly and negatively linked to HDI, while fuel and subsoil assets influence
it positively. This is consistent with the hypothesis according to which the effect of natural
resources on development is related to country-specific characteristics: controlling for
income levels, institutional differences and other aspects, an abundance of resources can
represent a source of revenues.
Since the Human development index includes the current GDP per capita levels, its
correlation with the lagged values of this variable tends to be very high. For this reason,
the impact of natural resources is analysed using two other dependent variables, related to
the quality of human development and available for a relatively large sample of nations:

13
illiteracy and child mortality rates. Given the high dispersion in the values of these
variables, logs are considered to avoid heteroskedasticity problems.
Tab. 6. Natural resources, illiteracy and child mortality Illiteracy Child mortality
(1) (2) (3) (4) (1) (2) (3) (4)
const 4.6** 4.8** 4.1** 3.8** 5.7** 5.8** 4.7** 4.8**
(6.8) (6.1) (4.8) (4.2) (8.9) (8.9) (5.3) (5.6)
GDPpc1980 -0.40** -0.43** -0.27** -0.29** -0.42** -0.41** -0.42** -0.47**
(-6.1) (-5.6) (-2.6) (-2.8) (-7.8) (-7.3) (-5.5) (-6.1)
IQ1996 -0.85* -0.77 -2.0** -1.9** -1.9** -2.0** -1.6** -1.4**
(-1.7) (-1.5) (-3.0) (-2.8) (-4.8) (-4.9) (-3.3) (-2.8)
Prinv 0.22** 0.22* 0.36** 0.40** 0.30** 0.30** 0.50** 0.51**
(2.1) (1.8) (2.5) (2.6) (2.8) (2.7) (2.6) (2.7)
Ethnic Fraction 0.65** 0.73** 0.50 0.58 0.87** 0.98** 1.2** 1.2**
(2.2) (2.5) (1.3) (1.5) (3.9) (4.5) (4.9) (4.9)
Metals 0.0067** 0.0070**
(2.1) (2.8)
Fuel 0.0020 -5.0e-05
(0.66) (-0.022)
Subsoil km -0.044* -0.012
(-1.7) (-0.58)
Subsoil pc -0.026 0.0092
(-0.95) (0.51)
n 97 97 70 71 127 127 93 95
R2 Adj. 0.57 0.56 0.58 0.56 0.83 0.83 0.84 0.83
lnL -91 -92 -65 -67 -97 -99 -70 -71
Dependent variable are Illiteracy rates and Child mortality in 2006. OLS estimates. Heteroskedasticity-robust standard errors. Standard errors in brackets; * significant at the 10 per cent level ** significant at the 5 per cent level.
Table 6 reports the results of estimates. In both cases it is possible to observe how
metals dependence is associated with higher illiteracy and child mortality. The other
measures of resources are statistically insignificant, with the exception of subsoil per km,
that is associated with lower illiteracy rates.
Finally, the influence of natural resources on institutional quality is examined. In
this case, IQ is measured in the year 2006 while, to avoid the problem of endogeneity
between GDP per capita and institutions, the model includes exogenous variables for
controls (Brunnschweiler e Bulte, 2008b). These are the absolute latitude (Latitude), the
fraction of people speaking English (EngFrac) and the fraction speaking one of the major
European languages (Eurfrac), used as instruments in influential studies on economic
growth determinants (Hall and Jones, 1999). The results are reported in Table 7. It is
possible to observe how fuel export dependence is strongly and negatively linked to
institutional quality, while the correlation to resource abundance is positive. Analogous

14
results are obtained when the index of economic freedom is used in the place of IQ in order
to check the robustness of the previous specification (Table 8).
Tab. 7. Natural resources and institutional quality (1) (2) (3) (4) (5) (6)
const 0.45** 0.47** 0.43** 0.41** 0.37** 0.42**
(19) (20) (8.3) (13) (6.8) (12)
latitude 0.0034** 0.0035** 0.0038** 0.0036** 0.0032** 0.0031**
(4.7) (5.0) (4.1) (4.1) (3.6) (3.9)
EngFrac 0.14** 0.15** 0.19* 0.18* 0.15 0.12
(2.2) (2.3) (1.8) (2.0) (1.5) (1.4)
EurFrac 0.15** 0.14** 0.15** 0.16** 0.11** 0.10*
(3.2) (3.2) (3.1) (3.2) (2.1) (2.0)
Metals -0.00045 -0.00059 -0.0015
(-0.46) (-0.51) (-1.5)
Fuel -0.0015** -0.0029** -0.0038**
(-2.7) (-4.1) (-5.2)
Subsoil km 5.5e-05 0.015**
(0.009) (2.4)
Subsoil pc 0.0015 0.023**
(0.32) (3.6)
n 148 147 105 111 104 109
R2 Adj. 0.29 0.32 0.30 0.30 0.39 0.44
lnL 44 47 31 34 40 47
Dependent variable: IQ in the year 2006. OLS estimates. Heteroskedasticity-robust standard errors. Standard errors in brackets; * significant at the 10 per cent level ** significant at the 5 per cent level. Tab. 8. Natural resources and the index economic freedom (1) (2) (3) (4) (5) (6)
const 57** 58** 56** 56** 55** 56**
(41) (44) (24) (36) (20) (30)
latitude 0.11** 0.12** 0.13** 0.14** 0.12** 0.13**
(3.2) (3.5) (3.2) (3.3) (2.6) (3.0)
EngFrac 12** 12** 12** 11** 11** 9.5**
(2.7) (2.8) (2.4) (2.5) (2.2) (2.2)
EurFrac 4.6 4.1 7.1** 7.0** 5.8** 5.5**
(1.5) (1.4) (3.0) (3.0) (2.2) (2.1)
Metals -0.036 -0.029 -0.021
(-0.59) (-0.57) (-0.43)
Fuel -0.055** -0.083** -0.10**
(-2.1) (-2.1) (-2.4)
Subsoil km -0.068 0.38
(-0.27) (1.1)
Subsoil pc -0.012 0.54
(-0.051) (1.6)
n 131 131 102 108 101 106
R2 Adj. 0.20 0.22 0.30 0.30 0.33 0.33
lnL -4.8e+002 -4.8e+002 -3.6e+002 -3.8e+002 -3.5e+002 -3.7e+002
Dependent variable: Index of Economic Freedom in the year 2008. OLS estimates. Heteroskedasticity-robust standard errors. Standard errors in brackets; * Significant at the 10 per cent level ** significant at the 5 per cent level.

15
The main findings of the empirical analysis can be summarised as follows.
Dependence on export of metals and ores is associated with lower human
development, higher illiteracy and child mortality. Furthermore, it is negatively,
although not significantly, related to institutional quality measurements. The share
of fuel exports is, in general, not significant when other variables are included in
the regressions, but it is strongly and negatively correlated to institutional quality.
This result, consistent with Sachs (2007), suggests how oil rents are compatible
with relatively high levels of development, in particular with high per capita GDP,
but with poor institutional performance.
The influence of natural resources on HDI results as significant in the group of
countries with comparatively lower institutional quality. In this sub-sample,
dependence on metals negatively influences HDI, while the value of subsoil assets
influences it positively. This suggests that institutional quality plays an important
role in the management of resource revenues and, furthermore, that metal exports
can be considered as a variable endogenous to the level of development of
countries, in the obvious, but often neglected, sense that the share of natural
resources on export (and output) is larger in poor economies that have, on average,
less effective institutions and governance.
The results of cross-country analysis are consistent with the general idea that
natural resources can have heterogeneous effects, strictly related to national institution
settings (Mehlum et al. 2006) and to the type of measure and resource considered (Lay and
Mahmoud, 2004; Àlvarez and Fuentes, 2006). The next section briefly illustrates the cases
of Botswana, Equatorial Guinea and the Democratic Republic of Congo, suggesting how in
different contexts, an abundance of natural resources produces different effects on
economic growth and human development.
4. A tale of three countries
A tale of three African countries — Botswana, Equatorial Guinea and the
Democratic Republic of Congo (DRC) — can offer a paradigmatic example of how natural
resources may influence, in very different ways, economic growth and the standard of life
of a population.
The Republic of Botswana is a landlocked and scarcely populated country, with
about two million inhabitants, situated in Southern Africa. In 1966, when it obtained
independence from Great Britain, Botswana was the second poorest country in the world.

16
To have an idea of its condition, one can just think that, in those years, a country of the
size of France and Belgium had scarcely 13 km of tarmac roads, no urban infrastructure
and no capital city (Sebudubudu and Lotshwao, 2009). With practically no secondary
schools, only 22 citizens in Botswana had a university degree. The main part of the
population was engaged in subsistence cattle farming, while the average income was 60
dollars per year (Rakner, 1996). Given the backward conditions, and the hostile
environment, at the time of independence practically no one could have predicted the
fundamental changes which would occur in the subsequent decades.
The prospective for growth in the country improved dramatically in 1967, when
the Dee Beers Company discovered a kimberlitic pipe in the Orapa site. The importance of
Botswana for the international diamond market became clear when, in the 1970s, Dee
Beers discovered other diamond mines at the sites of Letlhakane and Jwaneng. With the
creation of the “Debswana Diamond Company”, the national government had the
possibility of benefitting fully from the revenues from diamond extraction: Botswana
became, de facto, an economy based on resources rents (Dunning, 2008)3. Since the 1970s,
the role of mining in the economy has increased dramatically: nowadays, mining
contributes 40 per cent of GDP and 85 per cent of total exports, while 65 per cent of
national exports derive from diamonds (Table 9). Botswana’s economic growth has been
impressive. In 1989, the world’s previously second poorest country was already classified
as a low-middle income country, and in less than 10 years it reached the group of high-
middle countries. In 2007, the GDP per capita was 13,405 $ (Ppp), that is 6,7 times the
average of sub-Saharan Africa.
Tab. 9. Share of mining in Botswana 1995-2008 Years % GDP % Export
Minerals Minerals* Diamonds
1995 34.9 76 -
2005 40.7 85.8 75
2006 41.7 89.3 73.5
2007 39.2 85.6 63.2
2008 36.6 84.8 65.1
*Copper nickel, diamonds and gold. Source: Central Statistic Office of Botswana, Stats Brief - National Account Statistics, March 2009 and, for export, Botswana External Trade Digest, March, 2009.
Studies have emphasised how Botswana’s growth has been managed by sound
macroeconomic policies aimed at avoiding the problems associated with export boom; in
particular, the object has been to avoid external debt, stabilizing growth and favouring

17
economic diversification (Sarraf and Jiwanji, 2001; Iimi, 2006). These policies have been
implemented in an institutional and governance system that has a standard higher than that
of other African countries and also performs well in international comparison. These
institutional performances can be explained by referring to the peculiar political and social
history of the country (Acemoglu et al., 2003; Robinson and Parsons, 2006; Dunning,
2008).
In the pre-colonial era, the Tswana population had a government system
constituted of small local states with a political structure that, other than permitting control
by local elites, included other ethnic groups. This system was able to face up to, first the
Boer expansion, and later that of the “British South Africa Company”, managing to
maintain a certain degree of autonomy and avoiding the disastrous consequences that
colonialism caused to the social and political structures of other African states. Both during
the colonial period, then subsequently, the political elites, with conspicuous economic
interests in traditional activities, cattle ranching in particular, had a strong incentive to
create and enforce institutions to protect property rights. As noted by Robinson (2009), the
formation of state institutions in Botswana was built on the historical legacy of a
“defensive modernisation”, but also on the self-interest of elites interested in expanding
economic opportunities. This institutional system was reinforced in the post-colonial
period, in particular under the government of Seretse Khama, who took advantage of being
the hereditary chief of the largest Tswana tribe. The leadership of Khama, the formation of
a broad and stable political coalition during the first decades of independence and the
creation of institutions — such as the Ministry of Finance and Development Planning —
that link government revenue to specific development projects, encouraged the adoption of
pro-growth policies, fundamental for managing the diamond exploitation and revenues
(Poteete, 2009; Sebudubudu and Lotshwao, 2009).
Natural resources rents had different effects in Equatorial Guinea, a tiny country of
about 633,000 inhabitants, situated in the Gulf of Guinea. In the eleven years subsequent to
its independence from Spain (1968), the country suffered the disastrous dictatorship of
Francisco Macìas Nguema who installed an oppressive, post-colonial regime. During
Macìas’s regime the fragile economy of the country, based on the primary sector
(especially cocoa of the highest quality), from which more than 50 per cent of GDP and 97
per cent of exports originated, collapsed. The GDP per capita fell about 40 per cent, the
larger part of population lived at a level of subsistence, the public sector ceased to provide
the primary services, like schools or healthcare, while public finances were in complete

18
disarray (Toto Same, 2008). Thousands of people were killed by the regime, while about
100,000 people, approximately one third of population at the time, left the country, among
them the technical and managerial European elite and the foreign workforce, in particular
Nigerian, working in the cocoa and coffee plantations. Within a few years of the
dictatorship, economic mismanagement and corruption became diffuse, the private and
public sector devastated, and infrastructure fell into ruin4.
In 1979 the dictatorship of Macìas Nguema was overthrown by a coup d’état, led
by his nephew Teodoro Obiang Nguema Mbasogo, which ended the reign of terror but
continued the police state and maintained the previous dictatorial apparatus (Mcsherry,
2006). When Mbasogo took power, the country was the poorest in Central Africa and one
of the most heavily indebted in the world (HRW, 2009). Nevertheless, in the subsequent
decade, the government tried to rebuild the political and economic institutions, elaborating
a reconstruction programme and, subsequently, a medium-term adjustment programme, in
order to receive foreign aid and create the conditions for raising agricultural production
and exports.
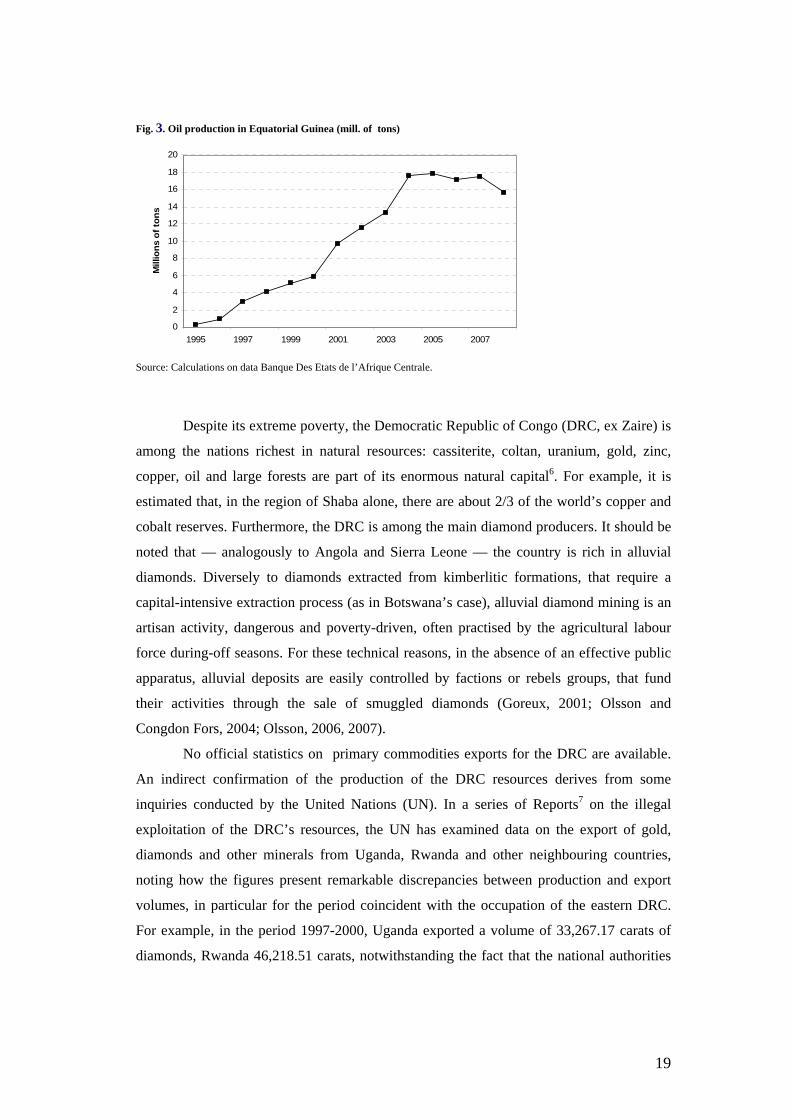
Prospects for the country’s growth changed in 1992, when the oil company
“Walter International” built the first platform for the extraction of oil, followed by “Mobil
Oil” a few years later. Oil production grew quickly, rising from 6,200 barrels a day to
about 350,000 in 2007, with a production of 16 millions of tons (Fig. 3). In 2007, the oil
revenue reached a value of $ 4.8 billion, while its production contributed nearly 90 per cent
of GDP and national exports, with the residual share deriving from few other products:
methanol, timber, cocoa and coffee5. This high dependence on oil has tremendously
boosted economic growth: in 2007, the GDP per capita of Equatorial Guinea reached
30,577 $ (PPPs), that is 15 times the average for sub-Saharan Africa. Nevertheless, efforts
to promote growth in the 1980s fell foul of a conspicuous increase in oil rents, which was
channelled through patronage networks without improving the welfare of the largest part
of population.
19
Fig. 3. Oil production in Equatorial Guinea (mill. of tons)
0
2
4
6
8
10
12
14
16
18
20
1995 1997 1999 2001 2003 2005 2007
Mill
ion
s o
f to
ns
Source: Calculations on data Banque Des Etats de l’Afrique Centrale.
Despite its extreme poverty, the Democratic Republic of Congo (DRC, ex Zaire) is
among the nations richest in natural resources: cassiterite, coltan, uranium, gold, zinc,
copper, oil and large forests are part of its enormous natural capital6. For example, it is
estimated that, in the region of Shaba alone, there are about 2/3 of the world’s copper and
cobalt reserves. Furthermore, the DRC is among the main diamond producers. It should be
noted that — analogously to Angola and Sierra Leone — the country is rich in alluvial
diamonds. Diversely to diamonds extracted from kimberlitic formations, that require a
capital-intensive extraction process (as in Botswana’s case), alluvial diamond mining is an
artisan activity, dangerous and poverty-driven, often practised by the agricultural labour
force during-off seasons. For these technical reasons, in the absence of an effective public
apparatus, alluvial deposits are easily controlled by factions or rebels groups, that fund
their activities through the sale of smuggled diamonds (Goreux, 2001; Olsson and
Congdon Fors, 2004; Olsson, 2006, 2007).
No official statistics on primary commodities exports for the DRC are available.
An indirect confirmation of the production of the DRC resources derives from some
inquiries conducted by the United Nations (UN). In a series of Reports7 on the illegal
exploitation of the DRC’s resources, the UN has examined data on the export of gold,
diamonds and other minerals from Uganda, Rwanda and other neighbouring countries,
noting how the figures present remarkable discrepancies between production and export
volumes, in particular for the period coincident with the occupation of the eastern DRC.
For example, in the period 1997-2000, Uganda exported a volume of 33,267.17 carats of
diamonds, Rwanda 46,218.51 carats, notwithstanding the fact that the national authorities

20
declared that these countries were not diamond producers. The cited UN report indicates
that the gap between production and export would originate from the illegal exploitation of
the natural resources of the DRC, where there is a considerable production of alluvial
diamonds which, according to some estimates (Basedau, 2009: 45), would represent over
50 per cent of national export.
The recent history of this nation illustrates how, in a context of fragile institutions,
a wealth of resources fuels conflicts and hurts development. During the 1990s, the former
Zaire was involved in a large conflict fostered by Uganda, Rwanda and numerous groups
of rebels. This conflict — which was part of chain of conflicts that from the Eighties
involved the regions of the Great Lakes — started in 1996, with the armed revolt of
Banyamulenge, a movement expression of the Tutsi ethnic group, oppressed by Mobutu
(in that period president of Zaire), and sustained by Rwanda. The armed troops, led by
Laurent-Desiré Kabila, after having occupied the capital Kinshasa, overthrew president
Mobutu, putting an end to his regime.
Entering power, and changing the name of the Country to Congo, Kabila started to
foment new battles in the border regions, fostering the never healed conflicts between the
Hutu and the Tutsi. In 1998, the Ugandan and Rwandan leaders Museveni and Kagani
again occupied part of the country with the aim of overthrowing Kabila’s regime. This
dragged Angola, Namibia, Chad, Rwanda, Burundi, Sudan and Zimbabwe, plus 25 armed
groups of rebels, into the conflict. A new, wider conflict, known as the “Great African
War” started, and involved the region for four years (Carbone, 2005¸ Lalji, 2007). This
conflict was fuelled, both in duration and intensity, by the desire of the parts involved to
control the conspicuous natural resources — copper, cobalt, diamonds, gold, uranium —
present in the RDP and, particularly, in the Kasai and Kivu regions, while the traffic of
these resources (and in particular that of diamonds) constituted the main source of
financing for the conflicts during the period 1998-2003 (Montague, 2002; Ross, 2004,
2006; Le Billon, 2008).
With the Peace Agreement of 2002 (Pretoria Agreement), and with the ascent to
power of Joseph Kabila, who succeeded his father, the conflict came formally to an end.
Yet a large part of the DRC’s territory remains outside state-control. Estimates indicate
that, following the end of the conflict, about 18,000 armed rebels remained in the Kivu
region, one of the richest in precious minerals and coltan (Lalji, 2007). Nowadays, as
attested by the United Nations8, through corruption, smuggling and violence, the DRC
suffers a systematic exploitation of its resources, from which the population does not

21
receive any benefit. According to recent inquiries, the mining trade in the region of Kivu is
entirely under the control of armed groups, both rebels and the regular Congolese army.
The use of forced labour, extortion and the application of unlawful taxes on mineral
production and the civil population are documented. In addition, the larger part of the
production of cassiterite, coltan and gold from the Kivu area is illegally exported (Global
witness, 2009). In the DRC, in a fragile institutional context, abundant lootable resources
have been used to fuel conflicts and corruption: this has hampered economic development,
reinforcing the mechanism of a sort of resource-based poverty trap. In the DRC, in 2007,
the GDP per capita was 305 $ (Ppp), that is 15 per cent that of sub-Saharan Africa.
The different growth patterns of the three countries illustrated in Fig. 4 show the
real per capita GDP in the period 1970-20069. The differences are striking: in Botswana, in
the considered period, the rate of growth was, on average, 6,5 per cent per year; Equatorial
Guinea, since 1985, grew at the rate of 9,5 per cent; in the DRC, the per capita GDP
decreased, in real terms, at a rate of 3,5 per cent per annum.
Fig. 4. GDP per capita in Botswana, the DRC and Equatorial Guinea 1970-2006
0
1000
2000
3000
4000
5000
6000
7000
8000
9000
1970
1972
1974
1976
1978
1980
1982
1984
1986
1988
1990
1992
1994
1996
1998
2000
2002
2004
2006
Pil
p.c.
(U
S $
)
Botswana Congo Dem. Rep. Equatorial Guinea
GDP per capita ($ int. 2000). Source: World Bank, World Development Indicators, 2008.
The structural changes that accompanied the process of economic growth in these
countries can be examined in Fig. 5, which illustrates the shares of industrial value added
of GDP. It is possible to observe how in Botswana and in Equatorial Guinea, the industrial
sector contributes largely to output. The trend of industrial production appears very
impressive in the case of Equatorial Guinea, reflecting its strong dependence on oil. In the
case of the DRC, the share of the secondary sector remained roughly the same, reflecting
stagnant (or declining) economic growth.

22
Fig. 5. Industry value added as a share of GDP (%), 1975-2007
0
10
20
30
40
50
60
70
80
90
100
1975 1978 1981 1984 1987 1990 1993 1996 1999 2002 2005
ind
ust
ry s
har
e
Equatorial Guinea Congo, Dem. Rep. Botswana
Source: World Bank, World Development Indicators, 2008.
The international indicators relative to institutional and governance systems show
the striking differences existing between the three countries (Table 10). Notwithstanding
its impressive growth, Equatorial Guinea is among the countries with the highest levels of
corruption, ineffective governance and regulation, and weakest rule of law. As attested by
numerous inquiries and reports, government corruption, mismanagement, nepotism, and a
lack of civil and human rights are the conditions under which the population has lived and
worked in Equatorial Guinea since the discovery of oil in the mid- 1990s (HRW, 2009).
Tab. 10. Comparative governance indicators
Voice Political stability a
Government effectiveness
Regulation Rule of law Control of corruption
Botswana 62 81 73 67 69 80 DRC 9 2 1 5 2 5 Eq. Guinea 3 40 4 7 7 2 USA 86 68 93 93 92 92 Data refer to 2008. USA for comparison. The ranking refers to a list of 211 countries; a higher ranking indicates better governance outcomes. (a) Political stability and absence of violence/terrorism. Source: World Bank, Governance Matters 2008.
A similar situation can be found in the DRC. According to the Failed States Index
elaborated by the Fund for Peace (2009), the DRC occupies 5th position in the international
rankings and is among the States with a high risk of failure, while Equatorial Guinea is in
47th position and Botswana ranks 116th.
The different effects that natural resources have had in the three countries concern
not only the growth rates but, primarily, human welfare (Table 11). The worst situation can
be found in the DRC, which is among those countries with lower life expectancy, highest

23
child mortality rate and malnutrition levels, and with the lowest human development index
in the world. The situation is different in the other two nations. In Equatorial Guinea,
notwithstanding the sustained growth of per capita income, the main indicators of human
development have not significantly improved with respect to the situation in the 1990’s:
child mortality rose, the fertility rate is still high and similar to that of countries with lower
per capita GDP, while the life expectancy at birth is 50 years. Equatorial Guinea is the
nation with the largest gap between its per capita GDP and its Human Development Index,
and this indicates the scarce effect of economic growth on people’s standard of living. The
case of this nation is consistent with the idea that oil production is compatible with a
relative high per capita GDP but with poor institutional quality and modest progress in
human welfare. In Botswana, lower mortality and malnutrition rates and higher school
enrolment figures demonstrate how development has improved the population’s standard
of living. But not all is rosy in this country: the spread of HIV, that affects about one
quarter of the population, significantly reduced the health related indicators, such as life
expectancy, representing a national tragedy with enormous human and economic costs.
Tab. 11. Selected human development indicators Botswana Equatorial Guinea DRC
1990 2007 1990 2007 1990 2007
Fertility rate 4.6 2.9 5.9 5.4 6.7 6.3
Primary completion rate 88.9 89.9 .. 67 46 51
Life expectancy at birth 63 51 47 52 46 46
Child malnutrition prevalence .. 10.7 .. 15.7 .. 33.6
Mortality rate, under-5 (per 1,000) 57 39.7 170 206 200.4 161.4
Prevalence of HIV 4.7 23.9 1 3.4 .. 3.2
HDI (rank) .. 126 .. 115 .. 177
GDP per capita, PPP 6,9922.5 12,659.7 1,970,8 28,875.8 608.9 287,9
Data refer to 2007 or last year available. Fertility rate, total (births per woman); Malnutrition prevalence weight for age (% of children under 5); Primary completion rate, total (% of relevant age group); Prevalence of HIV, total (% of population ages 15-49); GDP per capita, PPP (constant 2005 international $). For the HDI the ranking in a list of 179 countries is shown. Source: World Bank, World Development Indicators, 2009; United Nations, UNDP, 2009.
These case studies reinforce the idea that the effects produced by natural resources
can be totally different, depending on national characteristics, above all institutional
quality and policy outcomes (Lay and Mahmoud, 2004). Where, as in Botswana, effective
institutions limit the power of elites, and sound policies are implemented, resources rents
can promote development and the curse hypothesis does not fit. Where, as in Equatorial
Guinea or in the DRC, institutions are weak or unable to limit powerful elites, negative
incentives prevail and rents serve for other purposes. On the basis of this evidence, the
question is whether the curse is really represented by natural resource wealth or, instead,
by institutional and governance failures.

24
4. Conclusive remarks
This paper has examined the relationship between natural resources and human
development. In respect to other works, a distinction is made between dependence on
resources and an abundance of the same. Resource dependence is measured through the
share of minerals, ores and fuel in total exports; resource abundance is calculated in terms
of stock, using data on subsoil assets per capita and per square kilometre. The empirical
analysis — conducted using an ample sample of countries — shows how a higher
dependence on mineral and ore exports tends to be associated with lower human
development and institutional quality. The link between fuel exports and human
development indicators does not appear robust, but a strong negative correlation is found
in regressions that estimate the effect on institutional quality measures. On the contrary,
subsoil assets tend to be positively correlated with human development. It is important to
note, however, how the notion of dependence tends to be related to development failures
and not to the role of the resources themselves (Wright and Czelusta, 2006).
Even if these effects are found in the entire sample of countries, the analysis shows
that statistical significance is related to institutional quality. Natural resources tend, in fact,
to be significantly correlated to human welfare in countries with a comparatively lower
institutional quality, as suggested by recent studies (Mehlum et al. 2006), but they do not
play a significant role in countries with comparatively better institutions, where other
production factors (produced, human and intangible) determine the economic outcomes
(World Bank, 2006).
The cases of three resource-rich African countries confirm that institutions matter.
In Botswana, huge diamonds rents have sustained growth and a relative improvement in
human development standards. In Equatorial Guinea, oil rents have boosted impressive
economic growth with negligible effects on human welfare. In the DRC, on the contrary,
abundant natural resources have fuelled conflicts and corruption, leading to negative
effects on economic development. Natural resources can be a blessing for countries, but
the blessing can turn into a curse when rents serve to fund conflicts, to corrupt institutions
or are simply wasted. So, the effects that resources produce on people’s welfare do not
appear to depend on the resources themselves, as much as on the social and institutional
ability to manage them. In this respect, the concept of resource curse appears misleading,
as it tends to hide the real pathology affecting some nations: poor governance of natural
resources.

25
Appendix. Tab. A 1. Description of variables used in regressions Variables Description Source HDI Human development Index, year 2006 UNDP, Human Development
Report, 2008 Illiteracy Illiteracy rate (log) Idem. Child mortality Child mortality rate (log) Idem. GDP pc1980 GDP per capita in the year 1980 –
international $ World Bank, WDI, 2008
Metals Share of metals and ore exports on total merchandise exports – 1980-2004 average
World Bank, WDI, 2008
Fuel Share of fuel export on total merchandise exports –1980-2004 average
Idem.
Subsoil p.c. Subsoil assets per capita (log) World Bank (2006) Subsoil km Subsoil assets per square kilometre Idem. IQ Institutional quality index calculated as an
average of the governance indicators (included in the Kaufmann, Kraay e Mastruzzi (2008) dataset) normalised by values between 0 and 1.
Calculations from World Bank data, Aggregate Governance Indicators, 1996-2007.
PRINV Price levels of investment as an average for the period 1970-80
PWT 6.2.
Ethnic Fraction Index of Ethno-linguistic fractionalization given by the probability that two randomly selected people in a country will not belong to the same ethnic group.
Alesina et. Al. (2003)
Landlocked Dummy for landlocked countries. Tropical Dummy for tropical countries EconFre Index of economic freedom Fraser Institute, 2009 EngFrac Fraction of population speaking English Hall and Jones (1999) EurFrac Fraction of population speaking one of the
major languages of Western Europe: English, French, German, Portuguese or Spanish
Idem
Latitude Absolute latitude (degrees)

26
1 The World Bank (2006) furnishes estimates for natural capital, produced capital and intangible capital, that include raw labour, human capital, social capital, and other factors such as the quality of institutions. 2 On the contrary, if the share of natural capital on total capital estimates is considered, the picture is reversed: in this case, in fact, the incidence is comparatively higher in low-income countries and notably lower in those with higher income: in this group, in fact, other forms of capital (produced and, particularly, intangible) have a large share. The reason is quite obvious: the richest countries are rich because of their different production structure and because the human capital and institutional quality support economic activities. 3 The Debswana Diamond Company, established in 1978, is owned 50 per cent by the Government of Botswana and 50 per cent by the De Beers Company. It operates at the Orapa, Letlhakane, Jwaneng e Damtshaa sites, from where 30 per cent of world revenue values from diamond sales come. In 2007 the revenues from diamonds reached a record 34,9 million carats. Cfr. Debswana Diamond Company Annual Review 2007. 4 Similar to other African Dictators, Macìas exerted his power with cruelty and megalomania. To have an idea of this last aspect, consider that during Macìas’s regime, the government stated: “There is no other God than Macìas”; while in all church services the phrase “God created Equatorial Guinea thanks to Macìas – Without Macìas Equatorial Guinea would not exist”. Considering these statements, it is not surprising that in 1975 Macìas proclaimed himself the “Unique Miracle” (HRW, 2009: 7). 5 Banque Des Etats de l’Afrique Centrale. 6 Cassiterite is a mineral that represents the main source of tin; it is found, prevalently, in alluvial deposits. Coltan is a short term for Columbite-Tantalio, a mineral of strategic importance, used in the microprocessor industry and in advanced technologies. For a description of the mineral wealth of the DRC see Euromin Project (http://euromin.w3sites.net/Nouveau_site/gisements/congo/GISCONe.htm). 7 See reports from the U.N. Panel of Experts on the Illegal Exploitation of Natural Resources and Other Forms of Wealth of the Democratic Republic of Congo, April 12, 2001 (S/2001/357), May 22, 2002 (S/2002/565), October 16, 2002 (S/2002/1146), October 23, 2003 (S/2003/1027) plus other addendums. http://www.un.org/News/dh/latest/drcongo.htm#_msocom_1 (retrieved February 24th 2010. See also HRW (2005). 8 United Nations, “Security Council condemns continuing exploitation of natural resources in Democratic Republic of Congo” , Press Release SC 79/25. http://www.un.org/News/Press/docs/2003/sc7925.doc.htm. 9 The rates of growth have been calculated using World Bank (2008) data. For Equatorial Guinea, calculations on Maddison’s data (2008) give an average yearly rate of growth of 7 per cent for the period 1970-2006. Even if the data are from the World Bank series, one should remember that GDP figures for developing countries should be considered prudently because of the lack of official national statistics.
References
Acemoglu, D. Johnson S. and Robinson J. (2003) An African success story: Botswana, in: D. Rodrik, (ed) In Search of Prosperity: Analytical Narrative on Economic Growth, (Princeton: Princeton University Press), pp. 80 – 122.
Alesina, A., Devleeschauwer, A., Easterly, W., Kurlat, S. and Wacziarg, R., (2003) Fractionalization. Journal of Economic Growth, 8(2), pp. 155–194.
Àlvarez R. and Fuentes, R. (2006) Paths of Development, Specialization, and Natural Resources Abundance. Working paper, No. 383, Central Bank of Chile.
Auty, R. M. (1995), Patterns of development: resources, policy and economic growth (London: Edward Arnold).
Auty, R. M. (2001), ed., Resource Abundance and Economic Development, (Oxford-New York: Oxford University Press).
Baland, J. M. and Francois, P. (2000) Rent seeking and Resource booms. Journal of Development Economics, 61(2), pp. 527-542.

27
Basedau, M. (2005) Context Matters – Rethinking the Resource Curse in Sub-
Saharan Africa. Working paper, No. 1, Global and Area Studies, German Overseas Institute.
Beland, L. P. and Raaj, T. (2009) Economic Freedom and the Resource Curse: An Empirical Analysis. Studies in mining policy, Fraser Institute.
Boschini, A. D., Pettersson, J. and Roine, J. (2007) Resource curse or not: a question of appropriability. Scandinavian Journal of Economics, 109(3), pp. 593-617.
Brunnschweiler, C. N. and Bulte, E. H. (2008a) Linking natural resources to slow growth and more conflict. Science, 320, pp. 616-617.
Brunnschweiler, C. N. and Bulte, E. H. (2008b) The resource curse revisited and revised: A tale of paradoxes and red herrings. Journal of Environmental Economics and Management, 55 (3), pp. 248-264.
Bulte, E. H., Damania, R. and Deacon, R. T. (2005) Resource intensity, institutions, and development. World Development 33(7), pp. 1029-1044.
Carbone, G. (2005) L’Africa. Gli Stati, la Politica, i Conflitti, (Bologna: il Mulino).
Ciccone, A. and Jarocinski, M. (2008) Determinants of Economic Growth. Will Data Tell? Working paper, No. 852, European Central Bank.
Collier, P. (2007) The Bottom Billion. Why the Poorest Countries are Failing and what can be done about It (New York-Oxford: Oxford University Press).
Collier, P. and Hoeffler, A. (1998) On economic causes of civil war. Oxford Economic Papers, 50(4), pp. 563-573.
Collier, P. and Hoeffler, A. (2002) On the incidence of civil war in Africa. Journal of Conflict Resolution, 46(1), pp. 13-28.
Collier, P., and Hoeffler, A. (2004) Greed and grievance in civil war. Oxford Economic Papers, 56(4), pp. 563 - 595.
Costantini, V. and Monni, S. (2008) Environment, Human Development and Economic Growth. Ecological Economics 64(4), pp.867-880.
Crowson, P. (2009) The resource curse: a modern myth?, in: J.P. Richards (ed) Mining, Society and a Sustainable World, (Berlin-Heidelberg: Springer Verlag), pp. 3-36.
Dalgaard, C. J. and Olsson, O. (2008) Windfall gains, political economy and economic development. Journal of African Economies, 17(1), pp. 72-109.
Davis, G. A. (1995) Learning to love the Dutch disease: evidence from the mineral economies. World Development 21(10), pp. 1765-1779.
Davis, G. A. (2009) Extractive economies, growth and the poor, in: J.P. Richards (ed) Mining, Society and a Sustainable World, (Berlin-Heidelberg: Springer Verlag), pp. 37-60.
Davis, G.A. and Tilton J.E. (2005) The resource curse. Natural Resources Forum, 29(3), pp. 233–242.

28
Di John, J. (2007) Oil abundance and violent political conflict: A critical
assessment. Journal of Development Studies, 43 (6), pp. 961-986.
Djankov, S., Montalvo, J. G. and Reynal-Querol, M. (2008) The curse of aid. Journal of Economic Growth, 13 (3), pp. 1835-1865.
Doppelhofer, G., Miller, R. I. and Sala-i-Martin, X. (2000) Determinants of Long-Term Growth: A Bayesian Averaging of Classical Estimates (Bace) Approach. Working paper No. 266, OECD Economics Department, OECD.
Dunning, T. (2008) Crude Democracy. Natural Resource Wealth and Political Regimes (Cambridge University Press: New York).
Fearon, J. D. (2005), Primary Commodity Exports and Civil War. Journal of Conflict Resolution, 49 (4), pp. 483-507.
Fearon, J. D. and Laitin, D. (2006) Ethnicity, insurgency and civil war. American Political Science Review, 97(1), pp. 75-90.
Gelb, A.H. (1988) Oil windfalls: Blessing or curse? (Oxford University Press: Oxford-New York).
Global Witness (2009) Faced with a gun, what can you do? War and militarisation of mining in Eastern Congo. A Report from Global Witness, London.
Goreux, L. (2001) Conflict diamonds. Africa region Working paper series, No. 13, World Bank.
Gwartney, J and Lawson R. (2003) Economic freedom of the world: Annual report 2003. Fraser Institute, Vancouver.
Gylfason, T. (2001) Natural resources, education, and economic development. European Economic Review, 45(4-6), pp. 847–859.
Gylfason, T. (2002) Mother earth: Ally or adversary? World Economics, 3(1), pp. 7-24.
Gylfason, T., Herbertsson, T. T. and Zoega, G. (1999) A mixed blessing: natural resources and economic growth. Macroeconomic Dynamics, 3 (2), pp. 204-225.
Hall, R. E. and Jones, C. I. (1999) Why do some countries produce so much more output per worker than others? Quarterly Journal of Economics, 114(1) pp. 83-116.
Hodler, R. (2006) The curse of natural resources in fractionalized countries. European Economic Review, 50 (6), pp. 1367-1386.
HRW – Human Rights Watch (2005), The curse of gold. Democratic Republic of Congo, Human Rights Watch, New York (http://www.hrw.org).
HRW – Human Rights Watch (2009), Well oiled: Oil and human rights in Equatorial Guinea, Human Rights Watch, New York (http://www.hrw.org).
Humphreys, M. (2005) Natural resources, conflict and conflict resolution: Uncovering the mechanisms. Journal of Conflict Resolution, 49 (4), pp. 508-537.
Iimi, A. (2006) Did Botswana escape from the resource curse? IMF Working papers, No. 06/138, International Monetary Fund.

29
Isham, J., Pritchett, L., Woolcock, M. and Busby G. (2005) The varieties of
resource experience: natural resource export structures and the political economy of economic growth. World Bank Economic Review, 19 (2), pp. 141-174.
Karl, T. L. (1997) The Paradox of Plenty: Oil Booms and Petro-States (Berkeley: University of California Press).
Kaufmann D., Kraay A. and Mastruzzi M. (2008) Governance Matters VII: Governance Indicators for 1996-2007. Policy research working paper, No. 4654, World Bank.
Kolstad, I. and Wiig, A. (2009) Political economy models of the resource curse: Implications for policy and research. Occasional paper, No. 40, South African Institute of International Affairs (SIIA), Johannesburg.
Lalji, N. (2007) The resource curse revised: conflict and coltan in the Congo. Harvard International Review, 29(3), pp. 34-38.
Lane, P. R. and Tornell, A. (1999) The voracity effect. American Economic Review, 89(1), pp. 22-46.
Lay, J. Mahmoud, T. O. (2004) Bananas, oil and development: examining the resource curse and its transmission channels by resource type, Kiel working papers, No. 1218, Kiel Institute for the World Economy.
Le Billon, P. (2001) The political ecology of war: natural resources and armed conflicts. Political Geography, 20(5), pp. 561–584.
Le Billon, P. (2008) Diamond wars? Conflict diamonds and geographies of resource wars. Annals of the Association of American Geographers, 98(2), pp. 345-372.
Lederman D. and Maloney W. F. (2007) Trade Structure and Growth, in: D. Lederman, W. F. Maloney (eds.), Natural Resources: Neither Curse Nor Destiny, Stanford University Press and The World Bank, Washington.
Leite, C. A. and Weidmann, J. (1999) Does mother nature corrupt? Natural resources, corruption, and economic growth, IMF Working papers, No. 99/85, International Monetary Fund.
Maconachie, R. and Binns, T. (2007) Beyond the resource curse? Diamond mining, development and post-conflict reconstruction in Sierra Leone. Resources Policy, 32 (3), pp. 104-115.
Manzano O. and Rigobon R. (2001), Resource Curse or Debt Overhang? NBER Working paper, No. w8390, National Bureau of Economic Research.
Mcsherry, B. (2006) The political economy of oil in Equatorial Guinea. African Studies Quarterly, 8 (3), pp. 23-45.
Mehlum, H., Moene, K. and Torvik, R. (2006) Cursed by resources or institutions? The World Economy, 29(8), pp. 1117-1131.
Montague, D. (2002) Stolen goods: coltan and conflict in the Democratic Republic of Congo. SAIS Review, 22(1), pp. 103-118.
Olsson, O. (2006) Diamonds are a rebel’s best friend. The World Economy, 29(8), pp. 1133-1150.

30
Olsson, O. and Congdon Fors, H. (2004) Congo: the prize of predation.
Journal of Peace Research, 41(3), pp. 321-336.
Olsson, O. (2007) Conflict diamonds. Journal of Development Economics, 82(2), pp. 267-286.
Papyrakis, E. and Gerlagh, R. (2004) The resource curse hypothesis and its transmission channels. Journal of Comparative Economics, 32(1), pp. 181–193.
Pessoa, A. (2008) Natural resources and institutions: the “natural resources curse” revisited, MPRA paper, No. 8640, http://mpra.ub.uni-muenchen.de/8640.
Poteete, A. (2009) Is development path dependent or political? A reinterpretation of mineral-dependent development in Botswana. Journal of Development Studies, 45(4), pp. 544-571.
Rakner, L. (1996) Botswana – 30 years of economic growth, democracy and aid: is there a connection? CMI Report 1996:8, Michelsen Institute, Bergen: Norway.
Robinson, J. A. (2009) Botswana as a role model for country success. Research paper, No. 2009/40, United Nations University UNU-Wider.
Robinson, J. A. and Parsons, Q. N. (2006) State Formation and Governance in Botswana. Journal of African Economies, 15(1), pp. 100-140.
Robinson, J. A., Torvik, R. and Verdier, T. (2006) Political foundations of the resource curse. Journal of Development Economics, 79(2), pp. 447-468.
Ross, M. L. (2001) Does oil hinder democracy? World Politics, 53(3), pp. 325-361.
Ross, M. L. (2004) How do natural resources influence civil war? Evidence from thirteen cases. International Organization, 58(1), pp. 35-67.
Ross, M. L. (2006) A closer look at oil, diamonds and civil war. Annual Review of Political Science, 9, pp. 265–300.
Rosser, A. (2006) The political economy of the resource curse: a literature survey, Working paper, No. 268, Institute of Development Studies.
Sachs, J. D. (2007) How to handle the macroeconomics of oil wealth, in: M. Humphreys, J. D. Sachs and J. E. Stiglitz (eds) Escaping the Resource Curse, (New York: Columbia University Press), pp. 173–193.
Sachs, J.D. and Warner, A.M. (1995) Natural resource abundance and economic growth, NBER Working paper, No. w5398, National Bureau of Economic Research.
Sachs, J.D. and Warner, A.M. (1999) The big push, natural resource booms and growth. Journal of Development Economics, 59(1), pp. 43–76.
Sachs, J.D. and Warner, A.M. (2001) The curse of natural resources. European Economic Review 45(4-6), pp. 827–838.
Sala-i-Martin, X. and Subramanian, A. (2003) Addressing the natural resource curse: an illustration from Nigeria. NBER Working paper, No. 9804, National Bureau of Economic Research.

31
Sarraf, M. and Jiwanji, M. (2001) Beating the resource curse: the case of
Botswana. Environment Department paper, n. 83, World Bank.
Sebudubudu, D. and Lotshwao, K. (2009) Managing resources and the democratic order: the case of Botswana. Occasional paper, No. 31, South African Institute of International Affairs (SAIIA).
Stijns, J. P. C. (2005) Natural resource abundance and growth revisited. Resource Policy, 30(2), pp. 107-130.
Torvik, R. (2002) Natural Resources, rent seeking and welfare. Journal of Development Economics, 67(2), pp. 455–470.
Toto Same, A. (2008) Mineral-rich countries and Dutch disease: understanding the macroeconomic implications of windfalls and the development prospects. The case of Equatorial Guinea. Policy research working paper, No. 4595, World Bank.
UNDP (2008), Human Development Report 2007/2008: Fighting climate change: Human solidarity in a divided world, United Nations Development Programme (New York: UNDP).
Van der Ploeg, F. and Poelhekke, S. (2009) The volatility curse: revisiting the paradox of plenty, DNB Working paper, No. 206, Research Department, Netherlands Central Bank.
Wantchekon, L. (2002) Why do resource dependent countries have authoritarian governments? Journal of African Finance and Economic Development, 5(2), pp. 57–77.
Warner, A. (2002) Institutions, geography, regions and the mobility bias. Working paper, No. 91, Center for International Development (CID), Harvard University.
World Bank (2006), Where Is the Wealth of Nations? Measuring Capital for the 21st Century, The World Bank, Washington, DC.
Wright, G. and Czelusta, J. (2006) Resource-based growth: past and present, in: D. Lederman and W. F. Maloney (eds) Natural Resources: Neither Curse nor Destiny (Stanford: Stanford University Press and the World Bank), pp. 183-211.