natural image bases to represent neuroimaging dataproceedings.mlr.press/v28/gupta13b.pdf · natural...
TRANSCRIPT
Natural Image Bases to Represent Neuroimaging Data
Ashish Gupta [email protected]
Murat Seckin Ayhan [email protected]
Anthony S. Maida [email protected]
University of Lousiana at Lafayette,104 University Circle,Lafayette, LA 70504 USA
Abstract
Visual inspection of neuroimagery is suscepti-ble to human eye limitations. Computerizedmethods have been shown to be equally ormore e↵ective than human clinicians in di-agnosing dementia from neuroimages. Nev-ertheless, much of the work involves the useof domain expertise to extract hand–craftedfeatures. The key technique in this paper isthe use of cross–domain features to representMRI data. We used a sparse autoencoder tolearn a set of bases from natural images andthen applied convolution to extract featuresfrom the Alzheimer’s Disease NeuroimagingInitiative (ADNI) dataset. Using this newrepresentation, we classify MRI instancesinto three categories: Alzheimer’s Disease(AD), Mild Cognitive Impairment (MCI) andHealthy Control (HC). Our approach, in spiteof being very simple, achieved high classifica-tion performance, which is competitive withor better than other approaches.
1. Introduction
Alzheimer’s disease (AD) is a major cause of demen-tia. It is progressive and fatal. A clinical diagnosislargely depends on the experience of clinicians and itcan be inaccurate even among experienced clinicians(Matsuda, 2007; Kloppel et al., 2008). Conclusive di-agnosis requires an autopsy.
Neuroimaging provides a variety of biomarkers thatrespond to biological and structural changes due toonset and progression of the disease. However, a visual
Proceedings of the 30
thInternational Conference on Ma-
chine Learning, Atlanta, Georgia, USA, 2013. JMLR:W&CP volume 28. Copyright 2013 by the author(s).
inspection is susceptible to human eye limitations andother factors including subjectivity and experience ofthe clinician (Imabayashi et al., 2004; Matsuda, 2007;Kloppel et al., 2008).
Three-Dimensional Stereotactic Surface Projection(3D-SSP) can be used to perform both statistical anal-ysis and standardization of brain imagery (Matsuda,2007; Minoshima et al., 1995). 3D-SSP analysis is su-perior to visual inspection in discriminating AD fromHC (Imabayashi et al., 2004). However, in additionto a unique pipeline for data processing, other deci-sions have to be made. For instance, z-score analy-sis after pixel normalization requires a choice of refer-ence region, which has an immediate impact on results.While Minoshima et al. used the thalamus as a ref-erence region, Imabayashi et al. referred to globalactivity for routine clinical diagnosis of early AD.
Kloppel et al. provided a direct comparison of diag-nostic accuracy between radiologists and a comput-erized method that utilizes a support vector machine(SVM). They studied diagnostic classification in twodi↵erent settings: i) AD versus HC and ii) AD versusfronto-temporal lobar degeneration. In each task, thecomputerized method either made a tie with or out-performed radiologists. Kloppel et al. and Imabayashiet al. suggest a general adoption of computerizedmethods for visual image interpretation for dementiadiagnosis.
Using spatial independent component analysis(sICA), Yang et al. decomposed MRI data into a setof bases and corresponding coe�cients. Each basecaptures local information and a linear combinationof the bases represents a brain. The coe�cients areused as features for discriminating i) AD from HCand ii) MCI from HC using an SVM. In essence, theirresults1 are based on the separation of dementia and
1For the ADNI dataset.

Natural Image Bases to Represent Neuroimaging Data
healthy brain scans. They did not demonstrate thee�cacy of their approach for the discrimination ofAD from MCI.
Representation learning is concerned with obtain-ing meaningful and potentially high-level abstractionsfrom sensory input. It is useful for higher-level cogni-tive tasks, such as computer vision and object recog-nition. Recently, breakthrough results have been re-ported in these domains (Hinton et al., 2006; Bengio &Lecun, 2007; Krizhevsky et al., 2012). In our work, welearn such meaningful and low dimensional representa-tions of high dimensional MRI imagery. Reduction inregional cerebral blood flow (rCBF) and loss of graymatter are strong indicators of AD (Matsuda, 2007;Imabayashi et al., 2004). Our approach exploits the in-tuition that the discriminating power of neuroimagingbiomarker should improve as the disease progresses.We model the putative biomarkers by capturing struc-tural brain deformations that progress along with theseverity of AD. Thus, our approach strives to maxi-mize information about the putative biomarker whichare correlated with dementia, instead of capturing thedetails about the brain that may not be as pertinentin diagnosing AD.
Our approach for modeling lesions is motivated by self-taught learning (STL) (Raina et al., 2007). They madea cogent argument that basic structural patterns areshared among data in similar spaces. Once we learn torecognize such patterns, they could be used for the taskof interest on any data in some other but similar space.In this respect, we hypothesize that natural images canbe leveraged in order to learn such basic patterns andto recognize them in MRI data, even though the imagedomains are di↵erent. In this setting, natural imagesare unlabeled, whereas MRI data are labeled accordingto their dementia levels. As in STL, the unlabeleddata do not share the class labels or follow from thegenerative distribution of the labeled data. Moreover,the datasets are not completely irrelevant to each otheras the unlabeled data will help the classification ofMRI data.
2. Preliminaries
2.1. Sparse Autoencoders (SAE)
An autoencoder (Bourlard & Kamp, 1988) uses an un-supervised learning algorithm that exploits inputs asif they were targets. The algorithm consists of twomodules: i) an encoder and ii) a decoder. Encodingmaps the data from the input space to a representa-tion space and decoding maps it back into the inputspace, thus reconstructing the data. The algorithm
minimizes reconstruction error by back-propagation.Values of parameters W minimizing the error give riseto feature detectors (bases).
Representations learned using autoencoders are verysimilar those learned by PCA and ICA. However,the advantages of sparse-overcomplete representation,which can be achieved using autoencoders, have beenadvocated in recent work (Olshausen, 2001; Teh et al.,2003). The sparsity in the representation is enforcedby sparsifying the logistic (Ranzato et al., 2006) usingan additional penalty term. The penalty term encour-ages units to maintain low average activations. For-mally, the cost function is defined as:
J(W, b) =1
2m
X
x2DL(x, x) + �
kX
j=1
KL(⇢||⇢j) + �||W ||2
h = fenc(x) = �(W1
x+ b1
)
x = fdec(h) = �(W2
h+ b2
)
where, D is data matrix, h is the hidden representationof the data, x is reconstructed data, L(·, ·) is squaredloss error, �(·) is sigmoid function, ⇢ is sparsity param-eter, ⇢ is average activation, and KL(·||·) is Kullback-Leibler divergence, {W, b} = {W1,W2; b1, b2} are theparameters to learn and k is the number of bases. Thehyper–parameters (�,�, k, ⇢) are determined by gridsearch on validation data. The autoencoder is appliedto a set of natural images and MRI patches to createa set of bases
2.2. Convolutional Network
The idea behind convolutional networks is neurobio-logically motivated and dates back to the pioneeringwork of (Hubel &Wiesel, 1962) on locally sensitive andorientation-selective neural feature detectors in the vi-sual cortex of the cat. It is specifically designed to rec-ognize patterns and is invariant to translation, scaling,skewing, and other forms of distortions. The networkincludes the following forms of structural constraints(Lecun & Bengio, 1995): i) Feature extraction: Neu-rons take input from a local receptive field in the previ-ous layer. The position of the feature relative to otherfeatures is preserved. ii) Feature mapping: helps inreducing the number of free parameters and obtainingshift invariance. iii) Subsampling layer: performs localaveraging and subsampling thus reducing the resolu-tion of the feature maps. It reduces the sensitivity ofthe feature map to various distortions.

Natural Image Bases to Represent Neuroimaging Data
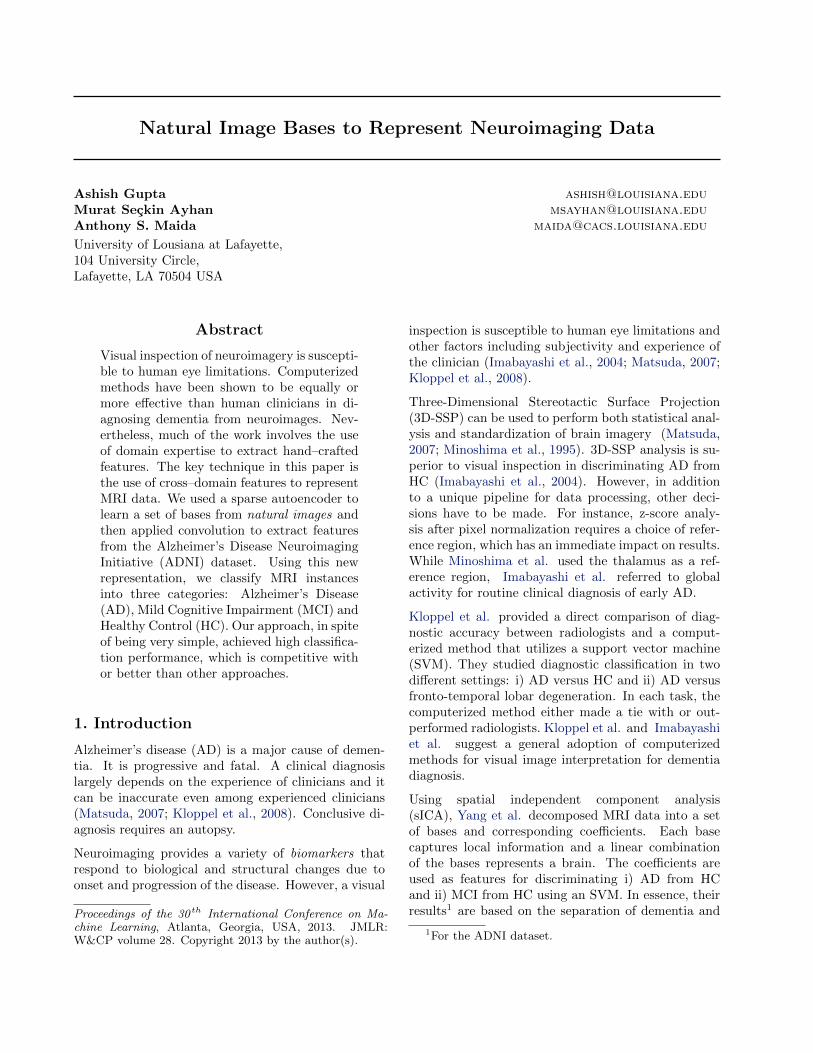
(a) Raw MRI scan. (b) Processed MRI scan.
Figure 1. Visualization of MRI scan of an AD patient using 3D Slicer.
3. Dataset and Preprocessing
3.1. Natural Images
We used a set of ZCA whitened natural images2. Thecollection contains 10 di↵erent images of size 512 ⇥512, from each of which we sampled 1000 patches ofsize 8 ⇥ 8. Pixel values of the patches were scaled to[0.1� 0.9].
3.2. MRI Data
Data used in the preparation of this article were ob-tained from the Alzheimer’s Disease Neuroimaging Ini-tiative (ADNI) database (adni.loni.ucla.edu).
The primary goal of ADNI has been to test whetherserial magnetic resonance imaging (MRI), positronemission tomography (PET), other biological markers,and clinical and neuropsychological assessment can becombined to measure the progression of MCI and earlyAD. Determination of sensitive and specific markersof very early AD progression is intended to aid re-searchers and clinicians to develop new treatments andmonitor their e↵ectiveness, as well as lessen the timeand cost of clinical trials.
Table 1 describes the demographics of the patients inour collection, which is broken into three groups: AD,MCI and HC. For a balanced dataset, we sampled 755scans from each group. Figure 1(a) shows the MRIscan of an AD patient. The dimensions of the rawMRI data are 170⇥ 256⇥ 256.
2http://redwood.berkeley.edu/bruno/sparsenet/
Table 1. Demographics of the ADNI dataset.
Class# of Sex Age # of
Subjects M F mean sd MRI scans
AD 200 103 97 76.05 7.66 755MCI 411 267 114 75.50 7.38 2282HC 232 113 119 76.18 4.97 1278
3.3. Stereotactic Normalization
Statistical Parametric Mapping3 was used to normal-ize the image data into an International Consortiumfor Brain Mapping template. Our configuration alsoincludes a positron density template with no weightingimage, and a 7th-order B-spline for interpolation. Theremaining parameters were set to their default. Afternormalization, dimensionality reduces to 79⇥ 95⇥ 68.Figure 1(b) shows a scan after normalization. In addi-tion, we perform min-max normalization to scale thedata to the range of [0.1� 0.9].
Note that we do not extract anatomical structures suchas gray matter or white matter. As a result, no struc-tural knowledge is injected into learning. Instead, weexpect the learner to figure out whatever is informa-tive.
3The SPM toolbox can be downloaded from http://
www.fil.ion.ucl.ac.uk/spm/

Natural Image Bases to Represent Neuroimaging Data
(a) (b) (c) (d)
Figure 2. Bases learned by Autoencoder. (a) The bases learned from Natural Images. Our result is consistent with (Ran-zato et al., 2006). (b) Bases learned from MRI scans. (c)-(d) Bases from natural image and MRI scans respectively thatwere chosen based on the performance on validation set.
4. Learning of Bases
Following the stereotactic normalization, MRI anal-ysis enables an unbiased assessment of gray matterloss (Matsuda, 2007). The goal of visual inspection isto assess the severity of lesions; however, it is virtu-ally impossible to detect a slight decrease in regionalcerebral blood flow or glucose metabolism in the caseof early AD (Imabayashi et al., 2004).
Lesions are the objects of interest. These are thecauses of structural deformation. Exploiting statisti-cal regularities in images, a sparse autoencoder yields aset of feature detectors. Using these detectors, we aimto identify markers, so to speak, present in the scans.These markers are used to represent lesions along thesurface and ventricles of the brain.
All complex visual features share some primary fea-tures. These features are viewed as parts of objectsand constellation models where model for parts canbe reused in di↵erent instances. We learn bases fromtwo distinct sets of data i) MRI imagery and ii) naturalimages. Since we rescale MRI and natural image pixelvalues to the same range, we ensure proper activationwhen using natural image bases.
5. Experiments
Our experiments involve three steps: i) learning a ba-sis set, ii) extraction of features from MRI data andiii) classification of MRI data. The steps of the algo-rithm are given in Algorithm 1. The diagnostic clas-sifier is a neural network. In order to learn varioushyper-parameters for the autoencoder and the neuralnetwork, we split the MRI data into three subsets:i) 15% for validation ii) 10% for testing and iii) therest for training.
Algorithm 1
Input 1: patches PInput 2:MRI Scans {Train TrD, Val VD, TestTD}(�,�, k, ⇢) SAE–validate (P, TrD,VD){basis set:B} SAE (P,�,�, k, ⇢)gridSize gs = [3, 3]features f = ;D = TrD [ VD [ TDfor s 1 to # of scans dofor b 1 to # of basis doconvScan CONVOLVE(D(s), B(b))f(s, b) MAX–POOL(convScan, gs)
end forend formodel TRAIN–NETWORK(fTrD, fVD)
We divided the parameter search into two phases. Inthe first phase, we search for the best parameters(⇢,�,�, k, see section 2.1) for the autoencoder. Twoautoencoders were trained, one on MRI data and theother on natural images. The performances of two setsof bases learned were evaluated on the validation setusing a classifier. To make the search faster we usedsoft-max as the classifier in this phase. Figure 3 showsthe performance of the soft–max on various hyper–paramenter settings. For number of bases, k, we haveused these values: [24, 48, 72, 100, 150, 200, 300, 400].In our experiments, weight decay constant �, was setto 0.001. Any larger value led to extremely poor per-formace. Once the parameters for the autoencoderwere determined (⇢ = 0.01,� = 3,� = 0.001, k = 100)and features (described below) were extracted, param-eters for the neural network were learned.

Natural Image Bases to Represent Neuroimaging Data
Figure 3. Performance of softmax on validation set. � sig-nifies importance of sparsity penalty term. We have used� (weight decay constant) = 0.001 for all the experiments.
Bases
We sampled 8 ⇥ 8 patches from natural images (Sec-tion 3.1). More specifically, 1000 patches from eachnatural image give rise to 10000 patches in total. Wesampled ten times as many from MRI scans. Usingsparse autoencoder (Section 2.1), we learn the sparse-overcomplete representation with 100 bases in bothcases (based on cross–validation). Figure 2 shows allthe bases. These bases are eventually used to representlesions in MRI data. Our results (figure 2a) are consis-tent with the (Ranzato et al., 2006; Olshausen, 2001;Teh et al., 2003) which have shown remarkable perfor-mance in other object recognition tasks. However, inour case, the basis sets that perform well are di↵erent.They are shown in figure 2c-d. They were generatedusing the parameters learned in our first phase of val-idation.
Convolutional Feature Extraction
For each basis, we apply 2D valid convolution4 on eachslice of each scan. Convolution with a 8 ⇥ 8 baseyields 72 ⇥ 88 ⇥ 68 dimensional feature maps (Fig-ure 5(b)). Then, feature activations are obtained viasigmoid function (Figure 5(c)). For a complete list offeature activations for the median slice, see figure 9in supplement. By a collection of feature activationsfor 100 bases per slice, we could obtain a new repre-sentation of the actual MRI data. However, this rep-resentation would be further blown up since we have
4The valid 2D convolution of p ⇥ q on m ⇥ n matrixresults with an m-p+1 ⇥ n-q+1 matrix.
Figure 4. Comparision of L2 pooling and L1 pooling overlarger number of variables.
100 bases. To overcome this issue, we applied pool-ing by dividing each slice into 3 ⇥ 3 grid resultingin 100(bases) ⇥ 3 ⇥ 3 ⇥ 68(slices) = 61, 200 featureactivations for each scan. We tried di↵erent poolingstrategies: L2 pooling and L1 pooling. Mean pool-ing was not used because it smooths everything outand does not capture lesion feature. Theoretical anal-ysis (Boureau et al., 2010) suggests that L1 pooling(max–pooling) works best when the features are sparsewhich agrees with our experiments (figure 4).
Figure 5(c) shows higher activations (shown in red) ofthe basis around the area of the brain filled with cer-berospinal fluid (CSF). Due to shrinkage in an ADbrain, CSF accounts for higher volume. Thus, thefeature extraction process captures this information,which relates to the severity of lesions. Di↵erent basesstrive to capture this information from di↵erent partsof the brain (for details see figure 9 in supplement).
Classification
We deal with i) binary classification and ii) three-wayclassification problems. Binary classification tasks al-low for a comparison of our results with others. Inthree-way classification, we consider all three groups,AD, MCI and HC, at once.
The 61,200 max–pooled feature activations are fed to aneural network that uses back-propagation with scaledconjugated gradient. We used a single hidden layerwith logistic units. The size of the hidden layer wasdetermined based on validation accuracy and it rangesfrom 800 to 1600 units depending on the classificationtask.

Natural Image Bases to Represent Neuroimaging Data
(a) (b)
(c)
Figure 5. The e↵ect of a basis on the median (34th) slice.(a) Original median slice. (b) Result of convolution withthe 55th base. (c) Feature activations using sigmoid func-tion.
Our performance metrics are sensitivity, specificityand classification accuracy. Sensitivity indicates ourability to recognize positive results, whereas specificitydoes it for negative results. For instance, given an ADpatient, sensitivity is the probability that our classi-fier will assign the correct diagnosis. Specificity is theprobability that our classifier will tell that the patientis healthy, given that he/she is, in fact, healthy.
Table 2 shows the comparison of our method for the bi-nary classification task with one of the recent studies.We performed our experiment with basis sets learnedfrom two di↵erent sources viz. natural images andMRI data. Our method shows significant improve-
Figure 6. ROC plots of binary classifiers.
Table 2. Binary classification results on test set(%).
Sensitivity Specificity Accuracy
Nat.Img.
bases
AD/HC 95.24 94.26 94.74MCI/HC 92.23 81.45 86.35AD/MCI 84.07 92.11 88.10
MRI
bases
AD/HC 92.67 94.92 93.80MCI/HC 85.85 80.99 83.30AD/MCI 84.55 88.46 86.30
Yan
g
etal. AD/HC 81.90 79.50 80.70
MCI/HC 73.20 68.60 71.10AD/MCI - - -
Table 3. Three-way classification results on test set(%).
Sensitivity Specificity Accuracy
Nat.Img.
bases
AD/others 95.90 91.8085.00MCI/others 74.20 92.70
HC/others 87.70 91.30
MRI
bases
AD/others 81.36 89.9578.20MCI/others 67.89 87.67
HC/others 84.96 85.86
Table 4. Test confusion matrix for three-way classification.
OutputClass
HC57 13 0 81.4%
25.1% 5.7% 0.0% 18.6%
MCI7 66 3 86.8%
3.1% 29.1% 1.3% 13.2%
AD1 10 70 86.4%
0.4% 4.4% 30.8% 13.6%
87.7% 74.2% 95.9% 85.0%12.3% 25.8% 4.1% 15.0%
HC MCI ADTarget Class
ments across all the measures compared to Yang et al.Figure 6 presents the ROC curves for the binary clas-sifiers using natural image bases.
Someone likely to develop AD progresses from beinghealthy to the point where they have mild dementia totheir final stage of severe dementia. Moreover, withinthe MCI class, depending upon how severe the demen-tia is, subjects can be in early or late phases of MCI.Thus, discriminating AD from MCI seems imperativefor early detection of AD. To demonstrate the e�-

Natural Image Bases to Represent Neuroimaging Data
cacy of our method for early detection, we performed athree-way classification task. Table 3 shows the perfor-mance of our method on this task. It also shows thatnatural image bases outperformed the bases learnedfrom MRI scans. Table 4 shows the confusion matrixfor 3-way classification with natural image bases.
6. Discussion
Utilizing either MRI or natural images, our approachimproves over the sICA-based method (Yang et al.,2011). To compare MRI bases with natural imagebases, over half of the MRI image surface area ofa coronal section is white matter, which, because ofits uniformity, conveys no meaningful features, exceptat the boundaries. However, the informative indica-tors for the progression of AD are unspecified putativebiomarker features. Using a small database of natu-ral images gives a much more comprehensive basis setthat has the ability to capture lesion features.
To further analyse the reason for better performance,we replaced SAE in our pipeline (Algorithm 1) withICA5. Using ICA bases learned from natural imagesand fMRI scan patches we obtained the accuracy of67.98% and 69.29% respectively. Compared to ICAbases, the SAE bases performed (table 3) significantlybetter. Figure 7 shows the convolved and sigmoid ac-tivation of the median slice (figure 5(a)) using ICAbases. Due to the small weights of ICA bases, theactivation falls in the linear range so there is no ef-fect of applying the sigmoid nonlinearity. This is incontrast to figure 5(c), where more details about thelesions are revealed after applying sigmoid activationand thus, allowing the pooling layer to capture muchricher features. The pooling strategy seems to haveimpact on the performance (figure 4) as well. In itsentirety, the superior performance can be attributedto representational power of SAE, the invariance prop-erty of convolution and the pooling strategy.
However, there is more room for improvement. Thevarious design choices were made for simplicity andcomputational e�ciency. They lead to the followingunexplored avenues:
• features are expected to be highly correlated.
• we have not exploited the 3D spatial informationpresent in MRI imagery.
• we used only one convolutional layer with a coarse3⇥ 3 grid for max pooling.
5http://research.ics.aalto.fi/ica/fastica/
(a) (b)
Figure 7. The e↵ect of a ICA basis on the median (34th)slice (figure 5(a)). (a) Result of convolution. (b) Featureactivations using sigmoid function.
Feature correlation is the price we pay for the simplic-ity we adopted by considering each MRI slice individ-ually (see figure 8 in the supplement for details). It isworth exploring the potential of various dimensionalityreduction methods. Alternatively, methods to exploitthe 3D spatial information that innately manifests inMRI data can be used. Adding a few more convolu-tional layers with finer subsampling might improve theclassification performance but at the cost of increasingthe computational requirements.
7. Conclusion
Visual inspection can be ine↵ective in identifying slightstructural and metabolic changes in human brain.By focusing on an expressive bassis set for putativebiomarkers, we achieve remarkably high diagnostic ac-curacy. Our data processing steps do not incorporateprior domain-knowledge, such as extraction of graymatter. Furthermore, we do not have to make priorchoices, as opposed to 3D-SSP studies, in order to an-alyze statistical characteristics of data.
We have experimentally demonstrated that our ap-proach for computerized-diagnosis of AD is i) signifi-cantly better than the method we compared with, andii) shows promises for building a model for early de-tection of AD.
The HC and MCI classes can be very subtle in theirdi↵erences. In spite of that, our approach, as simpleas it is, was able to uncover such subtlety with veryhigh sensitivity. This is encouraging for a future in-vestigation of early MCI and late MCI cases.
Acknowledgments
Data collection and sharing for this project was fundedby the Alzheimer’s Disease Neuroimaging Initiative(ADNI) (National Institutes of Health Grant U01

Natural Image Bases to Represent Neuroimaging Data
AG024904). ADNI is funded by the National Instituteon Aging, the National Institute of Biomedical Imag-ing and Bioengineering, and through generous contri-butions from the following: Alzheimer’s Association;Alzheimer’s Drug Discovery Foundation; BioClinica,Inc.; Biogen Idec Inc.; Bristol-Myers Squibb Company;Eisai Inc.; Elan Pharmaceuticals, Inc.; Eli Lilly andCompany; F. Ho↵mann-La Roche Ltd and its a�li-ated company Genentech, Inc.; GE Healthcare; Inno-genetics, N.V.; IXICO Ltd.; Janssen Alzheimer Im-munotherapy Research & Development, LLC.; John-son & Johnson Pharmaceutical Research & Develop-ment LLC.; Medpace, Inc.; Merck & Co., Inc.; MesoScale Diagnostics, LLC.; NeuroRx Research; Novar-tis Pharmaceuticals Corporation; Pfizer Inc.; PiramalImaging; Servier; Synarc Inc.; and Takeda Pharma-ceutical Company. The Canadian Institutes of HealthResearch is providing funds to support ADNI clini-cal sites in Canada. Private sector contributions arefacilitated by the Foundation for the National Insti-tutes of Health (www.fnih.org). The grantee organi-zation is the Northern California Institute for Researchand Education, and the study is coordinated by theAlzheimer’s Disease Cooperative Study at the Univer-sity of California, San Diego. ADNI data are dissem-inated by the Laboratory for Neuro Imaging at theUniversity of California, Los Angeles. This researchwas also supported by NIH grants P30 AG010129 andK01 AG030514.
We would also like to thank anonymous reviewers fortheir helpful feedback. We are also grateful to LINClab for allowing us to use their computing resources.
References
Bengio, Y. and Lecun, Y. Scaling learning algorithmstowards AI. MIT Press, 2007.
Boureau, Y., Ponce, J., and LeCun, Y. A theoreticalanalysis of feature pooling in vision algorithms. InICML, 2010.
Bourlard, H. and Kamp, Y. Auto-association by multi-layer perceptrons and singular value decomposition.Biological Cybernetics, 59(4):291–294, 1988.
Hinton, G. E., Osindero, S., and Teh, Y. A fast learn-ing algorithm for deep belief nets. Neural Comput.,18(7):1527–1554, July 2006. ISSN 0899-7667.
Hubel, D. H. and Wiesel, T. N. Receptive fields, binoc-ular interaction and functional architecture in thecat’s visual cortex. The Journal of Physiology, 160:106–154, 1962.
Imabayashi, E., Matsuda, H., Asada, T., Ohnishi, T.,Sakamoto, S., Nakano, S., and Inoue, T. Superior-ity of 3-dimensional stereotactic surface projectionanalysis over visual inspection in discrimination ofpatients with very early Alzheimer’s Disease fromcontrols using brain perfusion SPECT. Journal ofNuclear Medicine, 45(9):1450–1457, 2004.
Kloppel, S., Stonnington, C. M., and Barnes, J. et. al.Accuracy of dementia diagnosis - a direct com-parison between radiologists and a computerizedmethod. Brain: A Journal of Neurology, 131(11):2969–2974, 2008.
Krizhevsky, A., Sutskever, I., and Hinton, G. Ima-genet classification with deep convolutional neuralnetworks. In NIPS’ 25, pp. 1106–1114. 2012.
Lecun, Y. and Bengio, Y. Convolutional Networks forImages, Speech and Time Series, pp. 255–258. TheMIT Press, 1995.
Matsuda, H. Role of neuroimaging in Alzheimer’sDisease, with emphasis on brain perfusion SPECT.Journal of Nuclear Medicine, 48(8):1289–1300,2007.
Minoshima, S., Frey, K. A., Koeppe, R. A., Foster,N. L., and Kuhl, D. E. A diagnostic approachin Alzheimer’s Disease using three-dimensionalstereotactic surface projections of Fluorine-18-FDGPET. Journal of Nuclear Medicine, 36(7):1238–1248, 1995.
Olshausen, B. A. Sparse codes and spikes. In Proba-bilistic Models Of The Brain: Perceptron Aand Neu-ral Function, pp. 257–272. MIT Press, 2001.
Raina, R., Battle, A., Lee, H., Packer, B., and Ng,A. Y. Self-taught learning: Transfer learning fromunlabeled data. In ICML, pp. 759–766, 2007.
Ranzato, M., Poultney, C, Chopra, S., and Lecun, Y.E�cient learning of sparse representations with anenergy-based model. In NIPS, 2006.
Teh, Y. W., M., Welling, S., Osindero, Hinton, G. E.,Lee, T., F., Cardoso. J., Oja, E., and Amari, S.Energy-based models for sparse overcomplete repre-sentations. JMLR, 4:2003, 2003.
Yang, W., Lui, R. L. M., Gao, J. H., Chan, T. F.,Yau, S., Sperling, R. A., and Huang, X. In-dependent component analysis-based classificationof Alzheimer’s Disease MRI Data. Journal ofAlzheimer’s Disease, 24(4):775–783, 2011.