natural gas…at a crossroads?. 2 commodities (before peak)
TRANSCRIPT

Natural Gas…At A Crossroads?

2
Commodities (before peak)
CRUDE OIL NATURAL GAS COAL
WHEAT US DOLLAR GOLD
$20
$40
$60
$80
$100
$120
$140
$160
Jan-
06
Apr
-06
Jul-06
Oct
-06
Jan-
07
Apr
-07
Jul-07
Oct
-07
Jan-
08
Apr
-08
Jul-08
$2
$4
$6
$8
$10
$12
$14
$16
Jan-
06
Apr
-06
Jul-06
Oct
-06
Jan-
07
Apr
-07
Jul-07
Oct
-07
Jan-
08
Apr
-08
Jul-08
$20
$40
$60
$80
$100
$120
$140
$160
Jan-
06
Apr
-06
Jul-06
Oct
-06
Jan-
07
Apr
-07
Jul-07
Oct
-07
Jan-
08
Apr
-08
Jul-08
$200
$400
$600
$800
$1,000
$1,200
$1,400
Jan-
06
Apr
-06
Jul-06
Oct
-06
Jan-
07
Apr
-07
Jul-07
Oct
-07
Jan-
08
Apr
-08
Jul-08
$70
$75
$80
$85
$90
$95
Jan-
06
Apr
-06
Jul-06
Oct
-06
Jan-
07
Apr
-07
Jul-07
Oct
-07
Jan-
08
Apr
-08
Jul-08
$500
$600
$700
$800
$900
$1,000
$1,100
Jan-
06
Apr
-06
Jul-06
Oct
-06
Jan-
07
Apr
-07
Jul-07
Oct
-07
Jan-
08
Apr
-08
Jul-08

3
Commodities (to current)
CRUDE OIL NATURAL GAS COAL
WHEAT US DOLLAR GOLD
$20
$40
$60
$80
$100
$120
$140
$160
Jan-
06
Jun-
06
Nov
-06
Apr
-07
Sep-
07
Feb-
08
Jul-08
Dec
-08
May
-09
Oct
-09
Mar
-10
$2
$4
$6
$8
$10
$12
$14
$16
Jan-
06
Jun-
06
Nov
-06
Apr
-07
Sep-
07
Feb-
08
Jul-08
Dec
-08
May
-09
Oct
-09
Mar
-10
$20
$40
$60
$80
$100
$120
$140
$160
Jan-
06
Jun-
06
Nov
-06
Apr
-07
Sep-
07
Feb-
08
Jul-08
Dec
-08
May
-09
Oct
-09
Mar
-10
$200
$400
$600
$800
$1,000
$1,200
$1,400
Jan-
06
Jun-
06
Nov
-06
Apr
-07
Sep-
07
Feb-
08
Jul-08
Dec
-08
May
-09
Oct
-09
Mar
-10
$70
$75
$80
$85
$90
$95
Jan-
06
Jun-
06
Nov
-06
Apr
-07
Sep-
07
Feb-
08
Jul-08
Dec
-08
May
-09
Oct
-09
Mar
-10
$500
$600
$700
$800
$900
$1,000
$1,100
$1,200
$1,300
Jan-
06
Jun-
06
Nov
-06
Apr
-07
Sep-
07
Feb-
08
Jul-08
Dec
-08
May
-09
Oct
-09
Mar
-10

4
Futures – Are They Accurate?
"That's mathematics, son. You can argue with me, but
you can't argue with figures.“ Foghorn
Leghorn
-60%
-30%
0%
30%
60%
90%
120%
Jan-99
Jan-01
Jan-03
Jan-05
Jan-07
Jan-09
NYM
EX S
trip
, Pr
edic
ted -Act
ual, %
Strip Too High
(Strip Too Low)

Commodity Price Forecasts
Qualitatively Quantitatively
Oil Gas Oil Gas
$90/bbl $6.50/mcf
Cardinal Rule Of Price ForecastingNever Provide Both Price And Year
At The Same Time!
5

6
Natural Gas
Ample gas supply in almost any demand scenario – long term
□ Shale gas
1 bcf/day net demand growth assumed
Shale, Shale and more Shale
Fewer rigs required (~1,500)
Lower equilibrium natural gas price
□ $6.20/mcf in 2010
□ $6.50/mcf in 2011+
Implications for all energy subsectors/stocks

7
16
18
20
22
24
26
28
30
2000 2001 2002 2003 2004 2005 2006 2007 2008 2009 2010
Ann
ual Nat
ural
Gas
Dem
and (Tc
f/Ye
ar)
Natural Gas Demand
HUGEHUGEGAPGAP
NPC Study…Way Off Target
8
Shalemania – Shale is a Game Changer
Long Term – ample gas supply
□ Need fewer rigs in fewer places
□ Shales will grow
□ Everywhere else declines
Near Term – “damn the torpedoes”
□ Lot’s of drilling to hold acreage
□ Uh Oh! Cliff ahead.
Crude oil
□ The Rod Tidwell of energy “You’re loving me now!”
□ Lots of desire to “get oily”…but harder to accomplish

9
Why Shale? Meet GOM Shelf Production
0
2
4
6
8
10
12
14
16
1992 1994 1996 1998 2000 2002 2004 2006 2008 2010 2012
Gas
Pro
ducti
on, b
cf/d
ay
GOM Total
GOM Shelf
Deepwater
“I can hardly remember how I built my bankroll, but I can't stop thinking about the way I lost it." Mike….Rounders
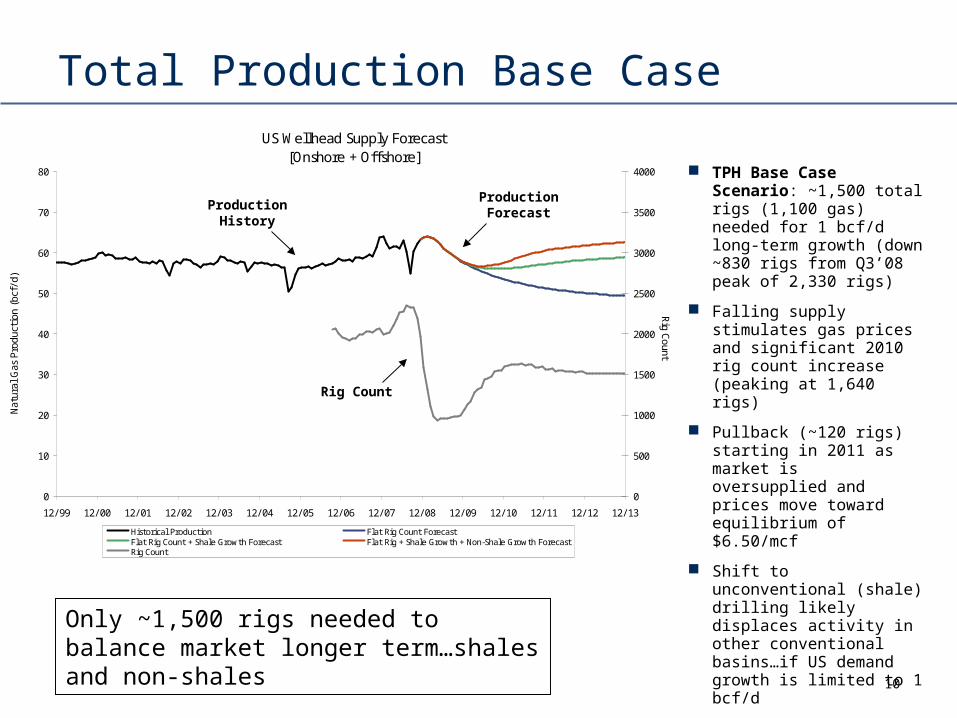
US Wellhead Supply Forecast[Onshore + Offshore]
0
10
20
30
40
50
60
70
80
12/ 99 12/ 00 12/ 01 12/ 02 12/ 03 12/ 04 12/ 05 12/ 06 12/ 07 12/ 08 12/ 09 12/ 10 12/ 11 12/ 12 12/ 13
Nat
ural
Gas
Pro
duct
ion
(bcf
/d)
0
500
1000
1500
2000
2500
3000
3500
4000
Rig Count
Historical Production Flat Rig Count ForecastFlat Rig Count + Shale Growth Forecast Flat Rig + Shale Growth + Non-Shale Growth ForecastRig Count
Total Production Base Case
Rig Count
Production Forecast
Production History
10
Only ~1,500 rigs needed to balance market longer term…shales and non-shales
TPH Base Case Scenario: ~1,500 total rigs (1,100 gas) needed for 1 bcf/d long-term growth (down ~830 rigs from Q3’08 peak of 2,330 rigs)
Falling supply stimulates gas prices and significant 2010 rig count increase (peaking at 1,640 rigs)
Pullback (~120 rigs) starting in 2011 as market is oversupplied and prices move toward equilibrium of $6.50/mcf
Shift to unconventional (shale) drilling likely displaces activity in other conventional basins…if US demand growth is limited to 1 bcf/d

US Wellhead Supply Forecast[Shale Production]
0
5
10
15
20
25
12/ 99 12/ 00 12/ 01 12/ 02 12/ 03 12/ 04 12/ 05 12/ 06 12/ 07 12/ 08 12/ 09 12/ 10 12/ 11 12/ 12 12/ 13
Nat
ural
Gas
Pro
duct
ion
(bcf
/d)
0
500
1,000
1,500
2,000
2,500
Rig Count
Historical Production Forecasted Production Rig Count
Production History
Shales –The Growth Engine
Rig Count
Production Forecast
11
Shale gas 12/08
□ Production = 8 bcf/d (12% of US)
□ Rig Count = 357 rigs (18% of US)
Shale gas 12/13
□ Production = 22 bcf/d (35% of US)
□ Rig Count = 614 rigs (41% of US)
Demonstrates dependence on shale gas to maintain/grow US supply as conventional production declines
Betting on the turn…early in producing life of most shales. Long-term production profile is a big unknown
Source: Rig Count = Rig Data Onshore/Baker Hughes Offshore, Production History = HPDI and EIA,
Forecast = TPH Estimates
Note: Wellhead production is wet gas. Rig count is total rig count gas/oil and onshore/offshore.
Annual Average RatesRate Δ Rate Δ Rate Rig Δ Rig Δ Rigbcf/d bcf/d %/yr Count Count # Count %
2007A 4.5 2862008A 6.5 2.0 45% 344 58 20%2009E 8.7 2.2 34% 277 -67 -19%2010E 10.5 1.8 21% 422 144 52%2011E 14.4 3.9 37% 582 160 38%2012E 18.0 3.6 25% 625 43 7%2013E 20.6 2.5 14% 614 -11 -2%
Shale Basin 12/08a 7/09e 12/13e
Haynesville 0.2 1.0 6.3
Barnett 5.0 4.7 5.5
Marcellus 0.0 0.2 4.4
Fayetteville 1.3 1.5 2.8
Woodford 0.9 0.9 1.5
Eagle Ford 0.0 0.0 0.7
Antrim 0.4 0.4 0.3
Total 7.8 8.7 21.5
Daily Gas Volumes, bcf/d

US Wellhead Supply Forecast[Non-Shale Production]
0.0
10.0
20.0
30.0
40.0
50.0
60.0
70.0
12/ 99 12/ 00 12/ 01 12/ 02 12/ 03 12/ 04 12/ 05 12/ 06 12/ 07 12/ 08 12/ 09 12/ 10 12/ 11 12/ 12 12/ 13
Nat
ural
Gas
Pro
duct
ion
(bcf
/d)
0
500
1,000
1,500
2,000
2,500
3,000
3,500
Rig Count
Historical Production Forecasted Production Rig Count
Production History
Non-Shale Production
Rig Count
Production Forecast
12
Non-Shale gas 12/08
□ 56 bcf/d (88% of US)
□ 1,600 rigs (82% of US)
Non-Shale gas 12/13
□ 41bcf/d (66% of US)
□ 900 rigs (59% of US)
Highly Technical – Revenge of the Nerds
Horizontal Drilling – Orientation / optimum Length
Completion – Hydraulic Fracture…can’t boilerplate
□ Number of stages
□ Slickwater vs. Gelled Fracs
□ Proppant type
Geology – Faulting, heterogeneity, seismic
Don’t forget the reservoir engineer!
□ Decline curve and recovery
□ Well spacing/drainage area (ultimate recovery)
□ Reservoir modeling is difficult Natural fracture spacing orientation Isotherm, gas-in-place, free gas porosity
13

14
44
46
48
50
52
54
56
58
60
Tota
l Ons
hore
Gas
(bcf
/d)
Total Onshore Gas (TPH vs. EIA 914 Data)
914 Data Model
Production Declining…but Less Than Expected

Damn the Torpedoes…Full Steam Ahead
15
1,543
414
1,957
643
179
822 914
450
1,364
0
500
1,000
1,500
2,000
2,500
Gas-Directed Oil-Directed Total
# ri
gs w
orki
ng
Peak Trough Current

Not Just Public Co’s Ignoring the Torpedoes
16
1,345
1,029
2,374
548 353
901 901
610
1,511
0
500
1,000
1,500
2,000
2,500
Public E&P Private E&P Total
# ri
gs w
orki
ng
Peak Trough Current

Natural Gas Demand
Forecasting 1 bcf/d annual demand growth long-term from depressed 2009 levels
Driver of growth is electricity sector with 0.7 bcf/d of annual demand increase.
□ 2% annual GDP growth
□ A 10% renewable standard is achieved by 2020
Industrial demand grows 0.3 bcf/d (~1.5%) annually from depressed 2009 levels
□ Reversing long-term trend of declining industrial demand
17

GDP and % Renewables – Key Variables
18
Annual Gas Demand Growth, bcf/day% Renewable by 2020
0.7 2% 5% 10% 15%0% 0.0 -0.1 -0.3 -0.61% 0.5 0.4 0.1 -0.12% 1.1 0.9 0.7 0.43% 1.7 1.5 1.2 1.04% 2.4 2.2 1.9 1.6G
DP
Gro
wth
%

Electricity is Gas Demand Driver
19
0
500,000
1,000,000
1,500,000
2,000,000
2,500,000
2000 2002 2004 2006 2008 2010 2012 2014 2016 2018 2020
Ann
ual G
ener
ation
-th
ousa
nd m
egaw
att-h
rsCoal Petroleum Natural Gas
Nuclear Hydro Electric Alternative (Wind)
Natural Gas and Alternative(Wind) fuel power generation growth in the next decade.

Industrial Demand Growth
(1,000)
1,000
3,000
5,000
7,000
9,000
11,000
13,000
15,000
2001
2003
2005
2007
2009
e
2011
f
2013
f
2015
f
2017
f
2019
f
US
GD
P
0
5
10
15
20
25
Ind
ust
rial
Dem
and
, b
cf/d
ay
US GDP Industrial Demand
Industrial natural gas demand not correlated with GDP (2001-2008). High gas prices caused reduced demand even in a growing
We assume industrial gas will be correlated with GDP in next decade as a more plentiful supply of natural gas allows for industrial demand expansion.
Ample gas supply and lower long-term gas prices, combined with GDP growth spurs industrial demand recovery
0.3 bcf/d (~1.5%) annual growth is from depressed 2009 levels
If overall US natural gas demand is flat at current levels, we would expect equilibrium gas prices to average $5.50/mcf (vs. our base case of $6.50/mcf)
20

Existing Gas Flows…Go East Young Man?
Rockies
Supply
Gulf Coast Supply
Haynesville
Eagle Ford
Marcellus
Appalachia Supply
Source: Tudor, Pickering, Holt & Co.
21
According to the map we've only gone 4 inches. Harry Dumb and Dumber

Cumulative Percent Gas Rig Count By Economic Threshold [2013]
0%
25%
50%
75%
100%
$4.50 $5.00 $5.50 $6.00 $6.50 $7.00 $7.50 $8.00 $8.50 $9.00 $9.50 $10.00
Threshold Natural Gas Price ($/mcf)
Cum
ulat
ive
Perc
ent
Rig
Cou
nt
10% IRR 20% IRR
10% IRR
Marginal Cost - 2013 Cumulative Rig Count
20% IRR
22
Long-Term 2011+ Price Forecast
Marginal cost curve shifts to the left as a higher percentage of the overall US drilling portfolio includes shale wells
Our long-term gas price is $6.50/mcf
"Ah! It's a profit deal! Navin Johnson The Jerk
(Most Economic Basins) (Least Economic Basins)

23
Gas Supply Wild CardsShale Performance
Officer and a Gentleman
□ “I got nowhere else to go”
Gas Macro Variables
□ LNG
□ Renewables
□ Canada Shales/Imports
□ Demand
High-Grading/Well efficiency
Frac Regulations
Infrastructure Build-Out
Midstream/MLP Sector Implications
24
Near term: Likely greater gathering and intrastate pipeline declines. Biggest impacts in 2H’09 and 1H’10
Opportunities for investment in shale play takeaway capacity and processing
Narrowing of basis differentials across the board
Lower gas prices and higher oil prices positive for domestic NGL business and processing utilization
Longer term: some long-haul pipelines may be re-contracted at discounts or capacity utilization drops
Power Sector Implications
25
Stabilizing impact on power markets
Enhances natural gas as obvious choice for next generation of supply
Reduces attractiveness of renewable generation
Provides a practical solution to reduced carbon

Final Thoughts
Natural Gas – a $6.5/mcf commodity
E&P’s acting like prices are already there...ugh
Shales are a game changer
□ But non-shales will set the marginal price of gas
26

27
Conclusion
Formula for success:
“Rise early, work hard, strike oil.”
J. Paul Getty
Note: Getty said “Oil”…not more shale gas!