national urgent care chart survey - practice · pdf filenational urgent care chart survey ......
TRANSCRIPT

National Urgent Care Chart Survey
July 2008Pre-Publication Results – please do not cite, quote or distribute this research

Scope of the Survey
This survey was designed to identify:• Some demographics of patients presenting to urgent
care centers• What their presenting complaints were• What diagnoses were most common• What prescriptions were actually written• What OTCs were recommended• What procedures and tests were performed*
*The procedures and tests portion of this study was performed through a separate sample. See that slide for additional details.
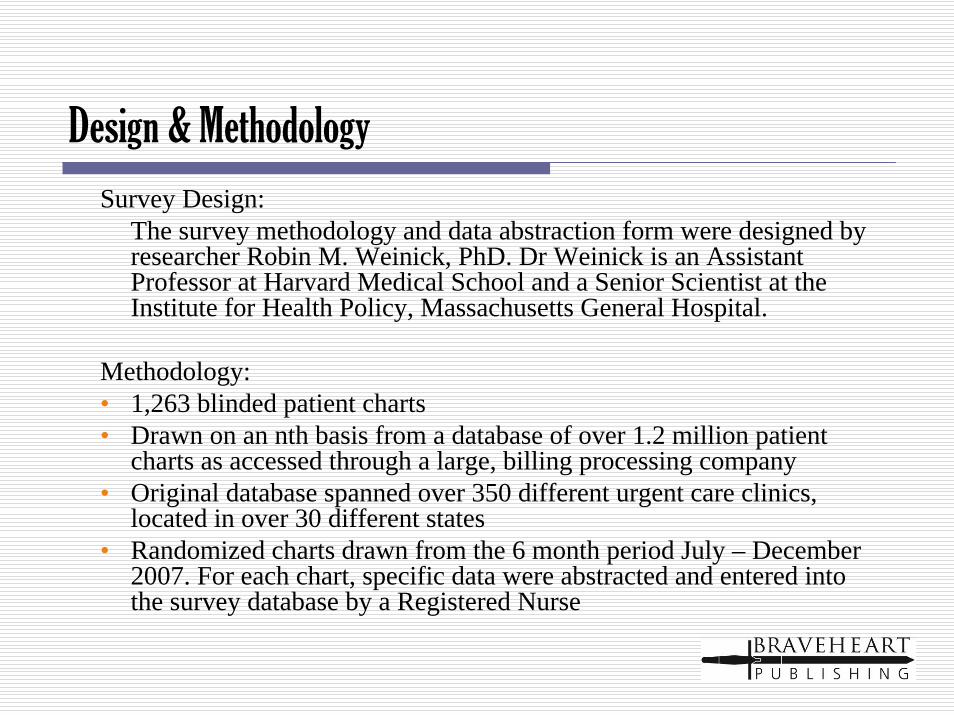
Design & MethodologySurvey Design:
The survey methodology and data abstraction form were designed by researcher Robin M. Weinick, PhD. Dr Weinick is an Assistant Professor at Harvard Medical School and a Senior Scientist at the Institute for Health Policy, Massachusetts General Hospital.
Methodology: • 1,263 blinded patient charts• Drawn on an nth basis from a database of over 1.2 million patient
charts as accessed through a large, billing processing company• Original database spanned over 350 different urgent care clinics,
located in over 30 different states• Randomized charts drawn from the 6 month period July – December
2007. For each chart, specific data were abstracted and entered into the survey database by a Registered Nurse

National Urgent Care Chart Survey
Male45%
Female55%
July 2008 NUCCS
Patient Gender

National Urgent Care Chart Survey
August16%
December8%
September20%
November20%
July16%
October20%
July 2008 NUCCS
Visits By Month

National Urgent Care Chart Survey
14-2213%
23-3525%
60+12%
Infant to 1313%
36-5937%
July 2008 NUCCS
Patient Age Breakout

Chief Complaints by % of Visits
2.3%
2.5%
2.7%
6.1%
6.6%
7.4%
8.0%
9.4%
17.2%
18.6%
19.2%
0% 5% 10% 15% 20%
Pulmonary
OTO-ENT
Psych/Neuro
Musculoskeletal Pain -Traumatic
Other
Gastro
Dermatological
Musculoskeletal Pain - Non-traumatic
Wound Care
Urological
Ophthalmic
Patient complaints that the clinician noted in the chart

Top Diagnosis Categories by % of Visits
3.0%
3.2%
3.2%
3.6%
4.0%
4.4%
5.7%
5.7%
6.3%
6.6%
6.8%
8.4%
9.2%
12.1%
13.5%
0% 5% 10% 15%
Other
Infection, Wound
Sinusitis
Infection, Upper Respiratory
Bronchitis
Infection, Ear
Pharyngitis
Fracture
Wound
Muscle Sprain
Conjunctivitis
Cough
Abdominal Pain
UTI
Pain, Joint
Based upon diagnosis codes which were written in the chart

Top Diagnosis Categories by % of Visits (continued)
1.1%
1.2%
1.2%
1.3%
1.4%
1.5%
1.7%
2.0%
2.1%
2.4%
2.4%
2.5%
2.5%
2.9%
2.9%
0% 5%
Eye Injury
Open Wound
Dermatitis
Herpes
Allergic Rhinitis
Strep Throat
Insect Bite
Hypertension
Fatigue
Dizziness
Headache
Ear Problem
Anxiety
Asthma
Rash
Based upon diagnosis codes which were written in the chart

Top Prescriptions Written (% of Visits)
1.7%
2.5%
2.5%
2.7%
2.9%
3.2%
4.5%
5.8%
7.4%
8.8%
9.7%
19.5%
19.9%
46.2%
0% 10% 20% 30% 40% 50%
Antibiotic
Allergy, Flu
Analgesic, Non-narcotic
Corticosteroids
Cough Rx
Neuro/Psych
Analgesic, Narcotic
Asthma
Opthalmic
Cardiovascular
Dermatological
Otic Rx
Gyn
Gastro
Based upon documentation noted in the chart

Top Prescriptions (Projected Total Volume, 2008)
1.7
2.5
2.5
2.7
2.9
3.2
4.5
5.8
7.4
8.8
9.7
19.5
19.9
46.2
0 10 20 30 40 50
Millions
Antibiotic
Allergy, Flu
Analgesic, Non-narcotic
Corticosteroids
Cough Rx
Neuro/Psych
Analgesic, Narcotic
Asthma
Opthalmic
Cardiovascular
Dermatological
Otic Rx
Gyn
Gastro
Projections based on 100 Million patient visits to 8,335 urgent care clinics annually

Top Prescriptions from Urgent Care, 1 - 20Rank Rx Drug % of Visits Scripts Projected
1 Zithromax Z-Pak 6.5% 6,492,4782 Amoxicillin 4.4% 4,354,7113 Bactrim DS 4.1% 4,117,1814 Prednisone Oral 4.0% 4,038,0055 Augmentin 3.9% 3,879,6526 Nasonex 2.9% 2,929,5337 Amoxil 2.9% 2,929,5338 Keflex 2.8% 2,771,1809 Levaquin 2.3% 2,296,12010 Medrol DosePak 2.2% 2,216,94411 Cipro 2.2% 2,216,94412 Biaxin 2.1% 2,137,76713 Omnicef 2.1% 2,137,76714 Rocephin 2.0% 1,979,41415 Zyrtec 1.8% 1,821,06116 Vicodin 1.8% 1,821,06117 Naprosyn 1.8% 1,821,06118 Flexeril 1.7% 1,662,70819 Ibuprofen 1.5% 1,504,35520 Tramadol 1.5% 1,504,355
Projections based on 100 Million patient visits to 8,335 urgent care clinics annually

Top Prescriptions from Urgent Care, 21 - 40Rank Rx Drug % of Visits Scripts Projected
21 Doxycycline 1.5% 1,504,35522 Albuterol Aerosol 1.5% 1,504,35523 Entex-PSE 1.5% 1,504,35524 Darvocet-N 100 1.4% 1,425,17825 Decadron Inj 1.3% 1,266,82526 Phenergan Tabs 1.2% 1,187,64827 Ultram 1.1% 1,108,47228 Pyridium 1.1% 1,108,47229 Motrin 1.0% 1,029,29530 Flonase 1.0% 950,11931 Avelox 1.0% 950,11932 Cephalexin 1.0% 950,11933 Toradol IM 0.9% 870,94234 Tylenol #3 0.9% 870,94235 Bactroban 0.9% 870,94236 Macrobid 0.9% 870,94237 Tessalon Perles 0.9% 870,94238 Methocarbamol 0.8% 791,76639 Entex LA 0.8% 791,76640 Hydrocodone 0.8% 791,766
Projections based on 100 Million patient visits to 8,335 urgent care clinics annually

OTC Recommendations (% of Visits)
0.6%
0.6%
0.6%
0.9%
1.0%
1.1%
1.4%
1.5%
1.8%
2.4%
3.6%
4.2%
4.4%
4.7%
7.5%
10.9%
19.4%
0% 5% 10% 15% 20%
NSAID
Acetaminophen
Splints, Braces & ACE
Fluids
Allergy/Antihistamines
Heat/Ice Packs
Wound Care Products
Cough
Derm Products
Nasal Spray
Gargle/Spray for throat
Cold/Flu
Ear Product
Antibiotic Ointment
Eye Care
Gastro
Other
Based upon OTC recommendations noted in the chart

OTC Recommendations (Projected Total Volume, 2008)
0.61
0.70
0.700.96
1.13
1.22
1.57
1.65
2.00
2.61
3.92
4.62
4.79
5.14
8.27
12.02
21.34
0 5 10 15 20 25
Million
NSAID
Acetaminophen
Splints, Braces & ACE
Fluids
Allergy/Antihistamines
Heat/Ice Packs
Wound Care Products
Cough
Derm Products
Nasal Spray
Gargle/Spray for throat
Cold/Flu
Ear Product
Antibiotic Ointment
Eye Care
Gastro
Other
Projections based on 100 Million patient visits to 8,335 urgent care clinics annually

OTC Recommendations (Projected Total Volume, 2008)
Rank OTC Name PercentageProjected
Recommendations1 Ibuprofen 11.5% 11,480,6022 Tylenol 10.9% 10,926,3663 Fluids 4.7% 4,671,4174 Motrin 4.6% 4,592,2415 Heat/ice packs 4.2% 4,196,3586 Wound care 3.1% 3,087,8867 Advil 2.3% 2,296,1208 Splint 2.2% 2,216,9449 Benedryl 1.8% 1,821,06110 Sudafed 1.7% 1,662,70811 Ace muscle/body support 1.3% 1,346,00212 Mucinex 1.3% 1,346,00213 Nasal spray/drops/inhale 1.1% 1,108,47214 Sling 1.1% 1,108,47215 Robitussin 0.9% 870,94216 Neosporin 0.9% 870,94217 Aleve 0.8% 791,76618 Gargle 0.7% 712,58919 Claritin 0.6% 633,41320 Back support 0.6% 554,23621 Debrox 0.6% 554,236
Projections based on 100 Million patient visits to 8,335 urgent care clinics annually

OTC Recommendations (Projected Total Volume, 2008)
Rank OTC Name PercentageProjected
Recommendations21 Debrox 0.6% 554,23622 Chloraseptic 0.6% 554,23623 OTC ear wax softeners 0.5% 475,05924 Knee immobilizer 0.5% 475,05925 Ortho shoe 0.5% 475,05926 Buddy tape 0.5% 475,05927 Brace 0.5% 475,05928 Crutches 0.4% 395,88329 Biofreeze 0.4% 395,88330 Eye/lens care solutions 0.3% 316,70631 Cortaid 0.3% 316,70632 Calamine 0.3% 316,70633 Saline 0.3% 316,70634 warm moist compresses 0.3% 316,70635 Naproxen 0.2% 237,53036 Sudafed PE 0.2% 237,53037 Mucinex D 0.2% 237,53038 Hydrocortisone 0.2% 237,53039 Afrin 0.2% 237,53040 loratadine 0.2% 237,530
Projections based on 100 Million patient visits to 8,335 urgent care clinics annually

Procedures Performed at Urgent Care Facilities
• Urgent care facility procedures were gathered in a separate survey, from the same billing processing company– 494,000 patient visits– Nationwide– 7/1/2007 to 6/30/2008

Top Urgent Care Procedures (% of Total Visits)
Category Category Percent Projected to UniverseInjection 22.9% 22,894,908Lab test 17.0% 17,002,274X-Ray 13.5% 13,535,212Blood Analysis 9.4% 9,416,829Urinalysis 8.3% 8,275,408Inhalation Treatment 6.3% 6,254,964Vaccination 5.6% 5,588,477Oximetry 4.3% 4,302,248Special Supplies 4.2% 4,189,851Injury treatments 3.0% 3,037,834Brace/Support 2.9% 2,856,254Wound Repair 1.5% 1,506,867IV Therapy 1.4% 1,445,371ECG 1.4% 1,414,623
Projections based on 100 Million patient visits to 8,335 urgent care clinics annually

Top Procedures by % of Visits
1.5%
2.9%
3.0%
4.2%
4.3%
5.6%
6.3%
8.3%
9.4%
13.5%
17.0%
22.9%
0% 5% 10% 15% 20% 25%
Injection
Lab test
X-Ray
Blood Analysis
Urinalysis
Inhalation Treatment
Vaccination
Oximetry
Special Supplies
Injury treatments
Brace/Support
Wound Repair
Based upon diagnosis codes which were written in the chart

Top Procedures (Projected Total Volume, 2008)
1.5
2.9
3.0
4.24.3
5.6
6.3
8.3
9.413.5
17.022.9
0 5 10 15 20 25
Millions
Injection
Lab test
X-Ray
Blood Analysis
Urinalysis
Inhalation Treatment
Vaccination
Oximetry
Special Supplies
Injury treatments
Brace/Support
Wound Repair
Projections based on 100 Million patient visits to 8,335 urgent care clinics annually

Top Blood Tests (Projected Total Volume, 2008)
0.3
0.4
0.4
0.6
0.8
1.8
2.4
0 1 1 2 2 3
Millions
CBC
CMP
HETEROPHILE ANTIBODIES
LIPID PANEL
BMET
ASSAY THYROID STIMHORMONE
HEPATIC FUNCTION PANEL
Projections based on 100 Million patient visits to 8,335 urgent care clinics annually

Top Lab Tests (Projected Total Volume, 2008)
0.2
0.2
0.2
1.2
5.1
9.4
0 2 4 6 8 10
Millions
STREP A
INFLUENZA
CULT,BACT
SMR,PRI SRC
N.GONORRHOEAE
CHYLMD TRACH
Projections based on 100 Million patient visits to 8,335 urgent care clinics annually

Top Vaccinations (Projected Total Volume, 2008)
0.0
0.1
0.1
1.5
1.7
2.1
0 1 1 2 2 3
Millions
Immunization Admin
Flu
Tetanus
Hep A/B
Pneumococcal
MMR Vaccine
Projections based on 100 Million patient visits to 8,335 urgent care clinics annually

Disposition of Visits to Urgent Care Facilities
2%
14%
14%
19%
85%
100%
0% 20% 40% 60% 80% 100%
Released
Follow up Visit PRN
Follow up Visit Scheduled
Refer to Primary CarePhysician
Refer to Specialist
Refer to the ER

The Braveheart Group - Bio• Peter Murphy
– Former Publisher of JAMA and American Medical News –12 years
– Former VP/GM of Advanstar Medical Economics’ Primary Care Group – 2 years
• Stuart Williams– Former Director of Sales at American Medical Association –
10 years– Former Publisher of Medical Economics Magazine and
Patient Care Magazine – 2 years
41 Years of Combined Medical Publishing Experience
Contact Peter Murphy or Stuart Williams:Peter: 201-847-1934 or [email protected]: 201-529-4004 or [email protected]