urgent care budgeting presentation€¦ · urgent care budgeting presentation urgent care...
TRANSCRIPT
Urgent Care Budgeting Presentation
Urgent Care Association of AmericaTuesday, April 29, 2008New Orleans, Louisiana
1
1
Alan A. Ayers, MBA, MAccContent Advisor
Urgent Care Association of America
Assistant Vice PresidentConcentra Urgent Care
Dallas, Texas
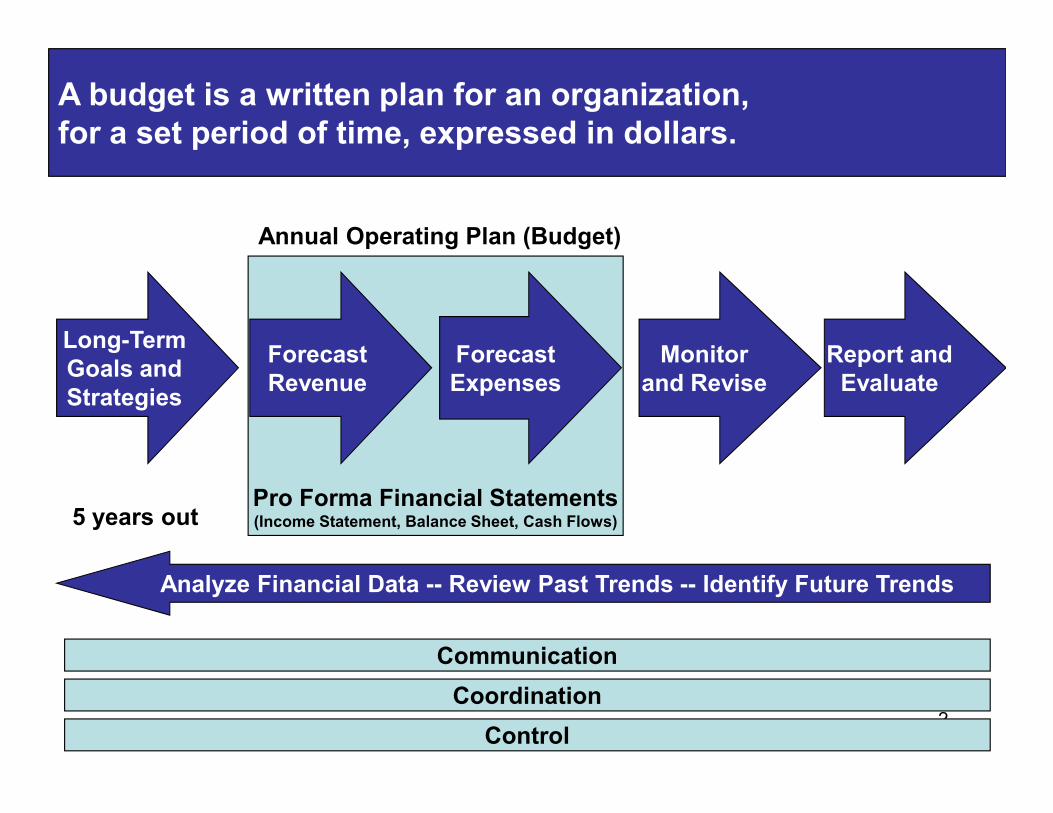
Long-TermGoals andStrategies
ForecastRevenue
ForecastExpenses
Monitorand Revise
Annual Operating Plan (Budget)
Report andEvaluate
A budget is a written plan for an organization, for a set period of time, expressed in dollars.
2
Pro Forma Financial Statements(Income Statement, Balance Sheet, Cash Flows)
Strategies
5 years out
Analyze Financial Data -- Review Past Trends -- Identify Future Trends
Communication
Coordination
Control
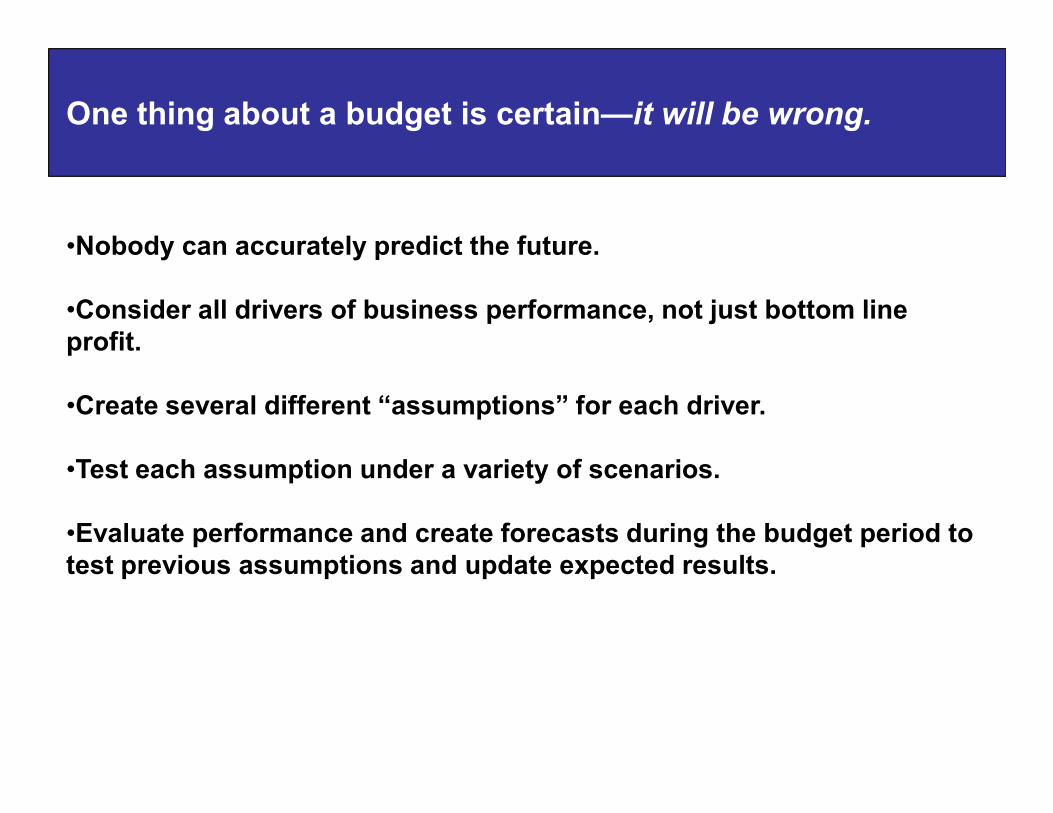
•Nobody can accurately predict the future.
•Consider all drivers of business performance, not just bottom line profit.
•Create several different “assumptions” for each driver.
One thing about a budget is certain—it will be wrong.
•Create several different “assumptions” for each driver.
•Test each assumption under a variety of scenarios.
•Evaluate performance and create forecasts during the budget period to test previous assumptions and update expected results.
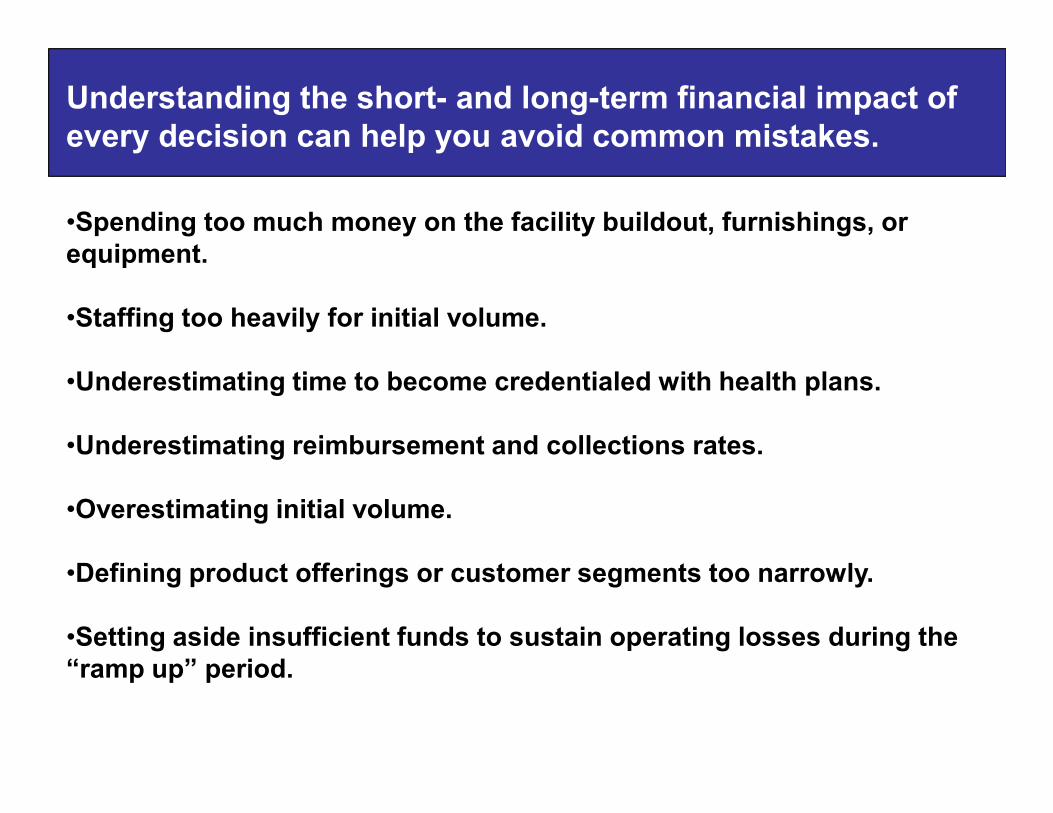
•Spending too much money on the facility buildout, furnishings, or equipment.
•Staffing too heavily for initial volume.
•Underestimating time to become credentialed with health plans.
Understanding the short- and long-term financial impact of every decision can help you avoid common mistakes.
•Underestimating reimbursement and collections rates.
•Overestimating initial volume.
•Defining product offerings or customer segments too narrowly.
•Setting aside insufficient funds to sustain operating losses during the “ramp up” period.
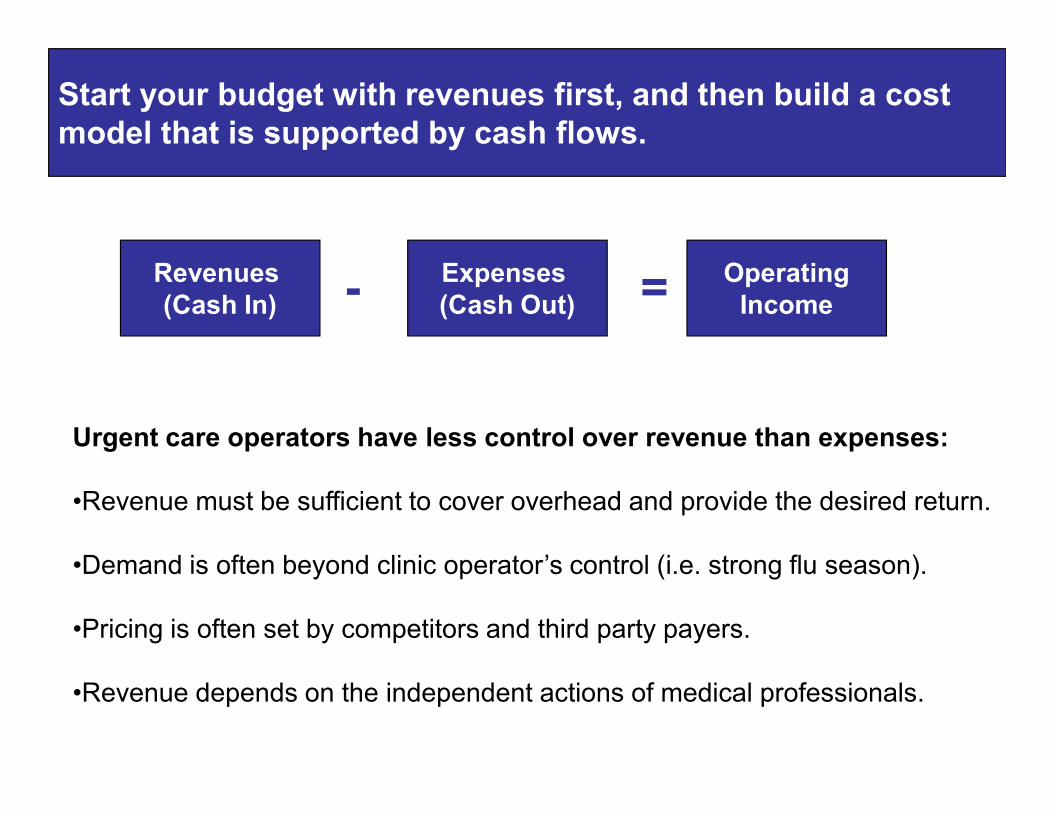
Start your budget with revenues first, and then build a cost model that is supported by cash flows.
Revenues (Cash In)
Expenses (Cash Out)
OperatingIncome- =
Urgent care operators have less control over revenue than expenses:
•Revenue must be sufficient to cover overhead and provide the desired return.
•Demand is often beyond clinic operator’s control (i.e. strong flu season).
•Pricing is often set by competitors and third party payers.
•Revenue depends on the independent actions of medical professionals.
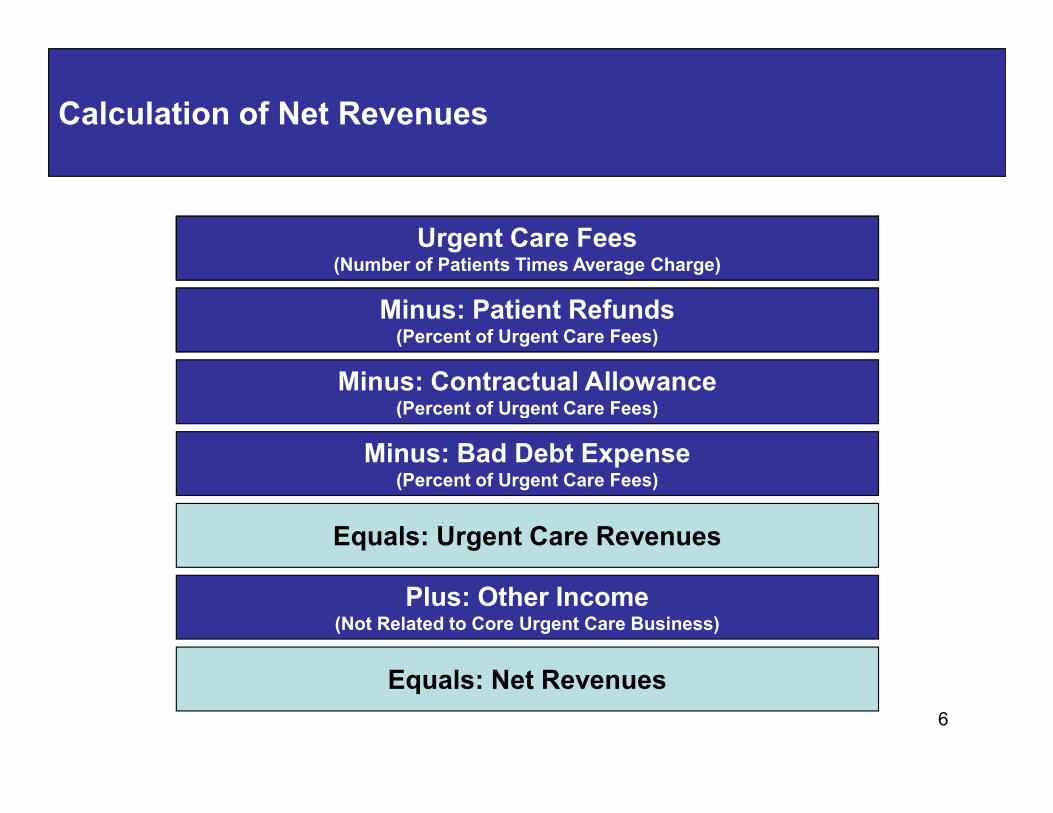
Calculation of Net Revenues
Urgent Care Fees(Number of Patients Per Day Times Average Charge)
Minus: Contractual Allowance(Percent of Urgent Care Fees)
Minus: Patient Refunds(Percent of Urgent Care Fees)
Urgent Care Fees(Number of Patients Times Average Charge)
Minus: Patient Refunds(Percent of Urgent Care Fees)
6
(Percent of Urgent Care Fees)
Minus: Bad Debt Expense(Percent of Urgent Care Fees)
Plus: Other Income(Not Related to Core Urgent Care Business)
Equals: Urgent Care Revenues
Equals: Net Revenues
Revenue Forecasting
Using the income statement as a template:
•Evaluate site volume trends and project site volume growth.
•Evaluate historical averages for patient charges, refunds, contractual allowances, and write-offs.
7
•Include any “known” variables including new contract terms and changes to collections policies.
•Adjust model for changes in payer and patient mix.
•Add incremental revenue from new initiatives.
Revenue Drivers
•Site Location and Capacity
•Products and Services Offered
•Fee Schedule
•Number of Physicians/Providers
8
•Number of Physicians/Providers
•Hours/Days of Operation
•Payer Mix
•Patient Mix
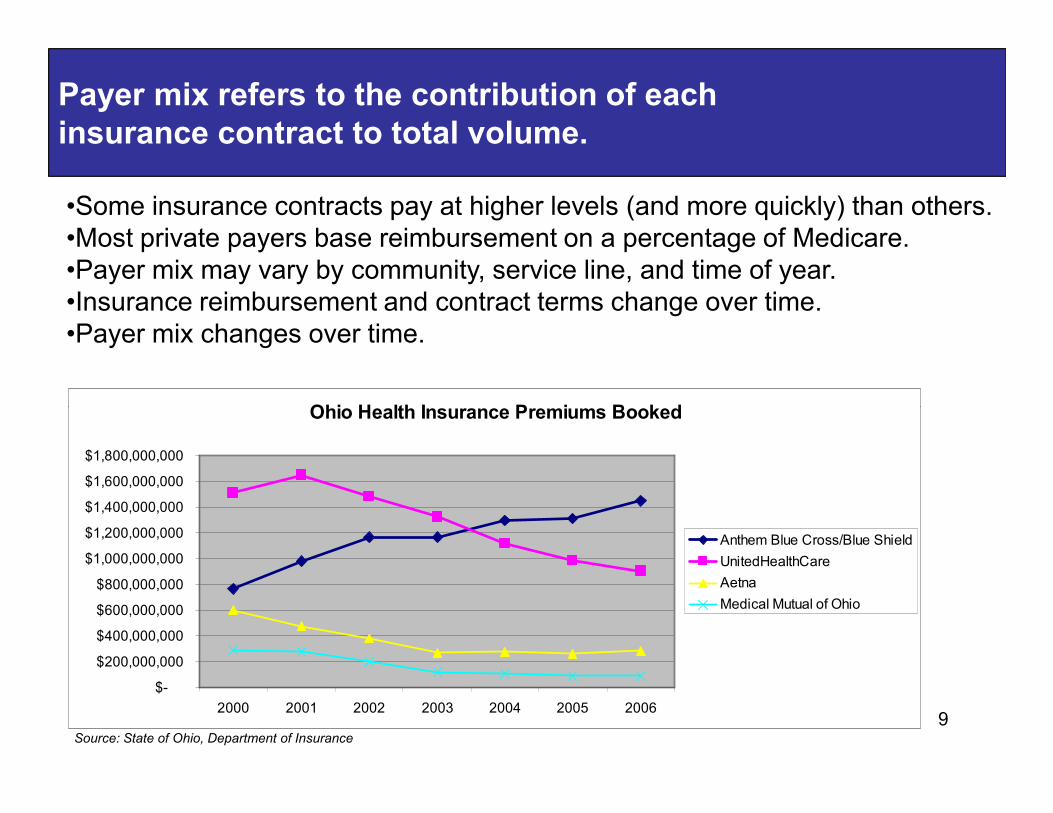
Payer mix refers to the contribution of each insurance contract to total volume.
•Some insurance contracts pay at higher levels (and more quickly) than others.•Most private payers base reimbursement on a percentage of Medicare.•Payer mix may vary by community, service line, and time of year. •Insurance reimbursement and contract terms change over time.•Payer mix changes over time.
Ohio Health Insurance Premiums Booked
9
Ohio Health Insurance Premiums Booked
$-
$200,000,000
$400,000,000
$600,000,000
$800,000,000
$1,000,000,000
$1,200,000,000
$1,400,000,000
$1,600,000,000
$1,800,000,000
2000 2001 2002 2003 2004 2005 2006
Anthem Blue Cross/Blue Shield
UnitedHealthCare
Aetna
Medical Mutual of Ohio
Source: State of Ohio, Department of Insurance
Setting the Fee Schedule and Evaluating Contracts
•Fees generally set at 150 to 200% of Medicare •Reimbursement is lesser of contract or billed charges•Set fees no less than highest paying contract for each CPT code
•Evaluate each payer’s reimbursement by CPT code•80/20 rule drives most commonly used codes in the practice•A contract that pays an average 20% premium to Medicare may be
unfavorable if reimbursement on the top two or three codes is low.
10
unfavorable if reimbursement on the top two or three codes is low.
•Assure pricing is fair for self-pay patients•Patients in some markets will pay full-price•Cash discounts bring pricing parity•Cash price should be in-line with competitors•Patients care about total cost, not value of discount
•Evaluation and management coding audit•Coding is always according to the documentation•Coding is independent of billing•Under-coding leaves money on the table
Not only do the ways patients pay change, but personal characteristics and use patterns of patients also change.
•New vs. Established
•Employment/Benefit Trends
•Aging Population
11
•Acuity of Visit
•Services Rendered
•Physician Coding
•Seasonal Trends
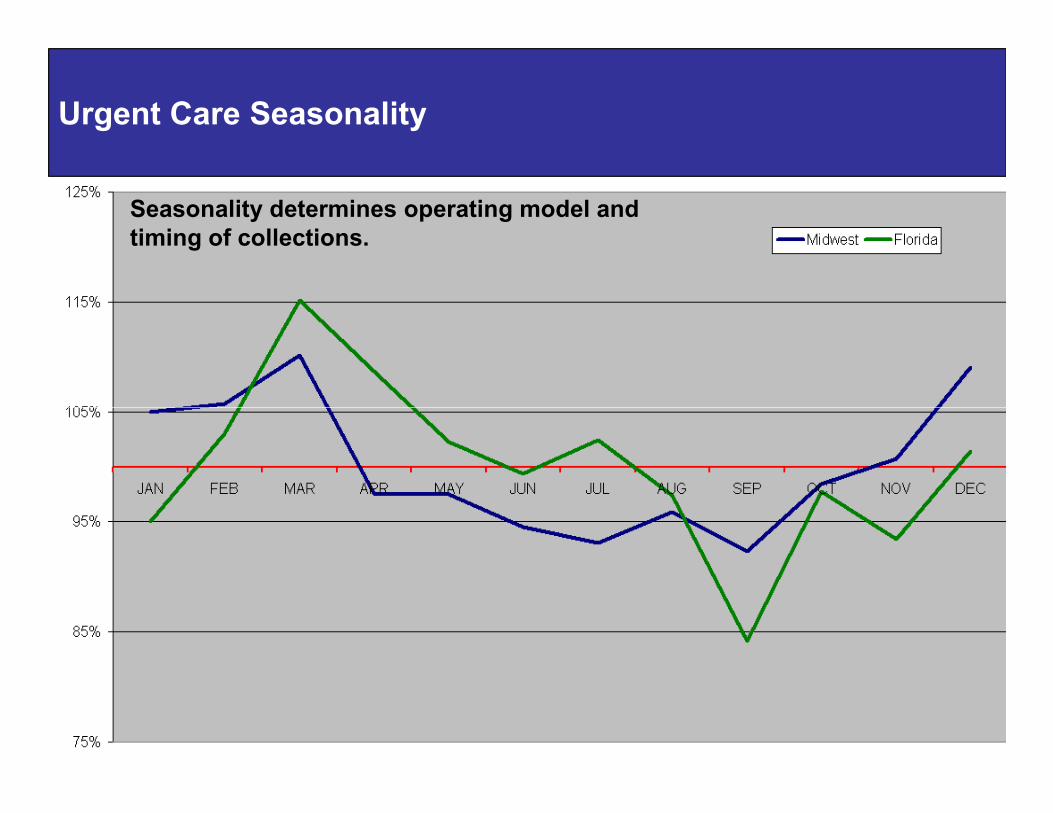
Urgent Care Seasonality
Seasonality determines operating model and timing of collections.
12
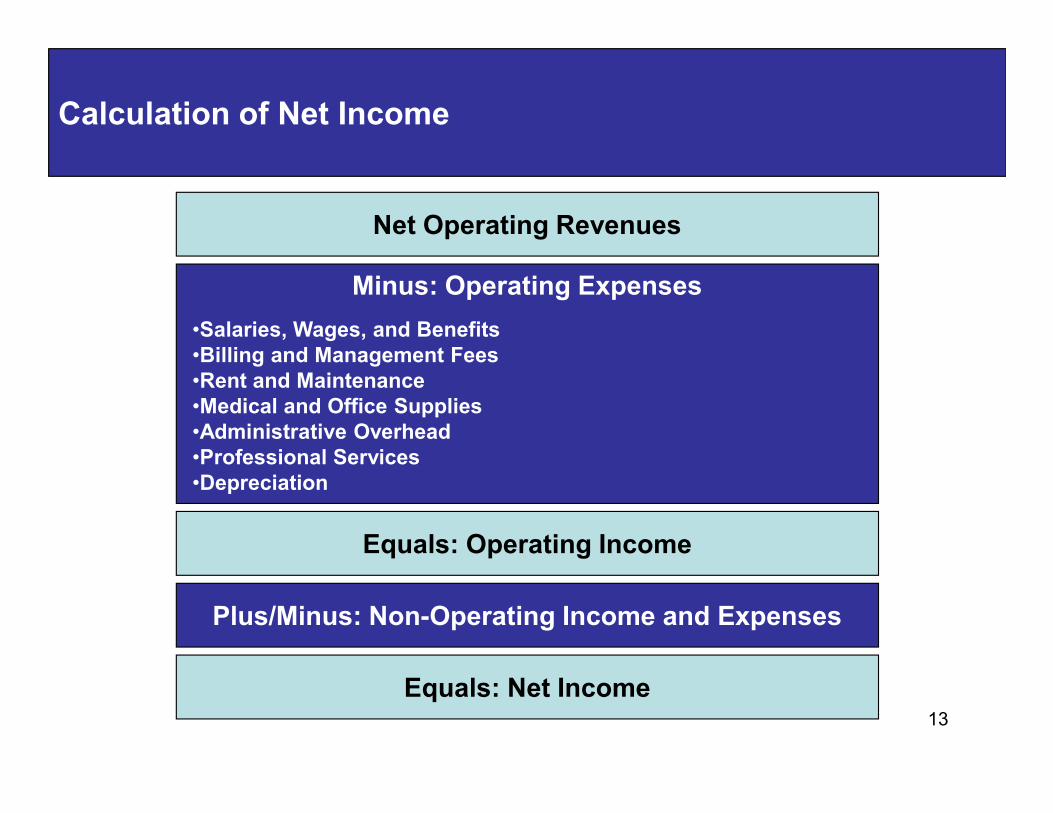
Calculation of Net Income
Net Operating Revenues
Minus: Operating Expenses
•Salaries, Wages, and Benefits•Billing and Management Fees•Rent and Maintenance•Medical and Office Supplies
13
Plus/Minus: Non-Operating Income and Expenses
Equals: Operating Income
Equals: Net Income
•Medical and Office Supplies•Administrative Overhead•Professional Services•Depreciation
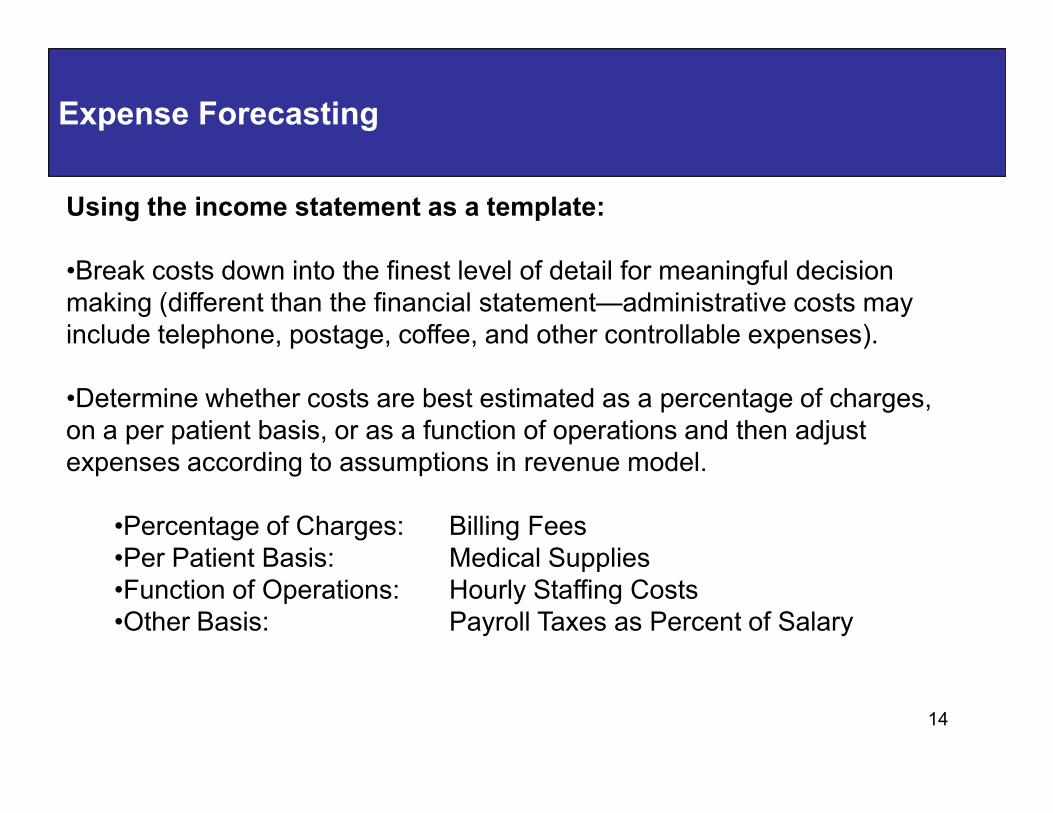
Expense Forecasting
Using the income statement as a template:
•Break costs down into the finest level of detail for meaningful decision making (different than the financial statement—administrative costs may include telephone, postage, coffee, and other controllable expenses).
•Determine whether costs are best estimated as a percentage of charges,
14
•Determine whether costs are best estimated as a percentage of charges, on a per patient basis, or as a function of operations and then adjust expenses according to assumptions in revenue model.
•Percentage of Charges: Billing Fees•Per Patient Basis: Medical Supplies•Function of Operations: Hourly Staffing Costs•Other Basis: Payroll Taxes as Percent of Salary
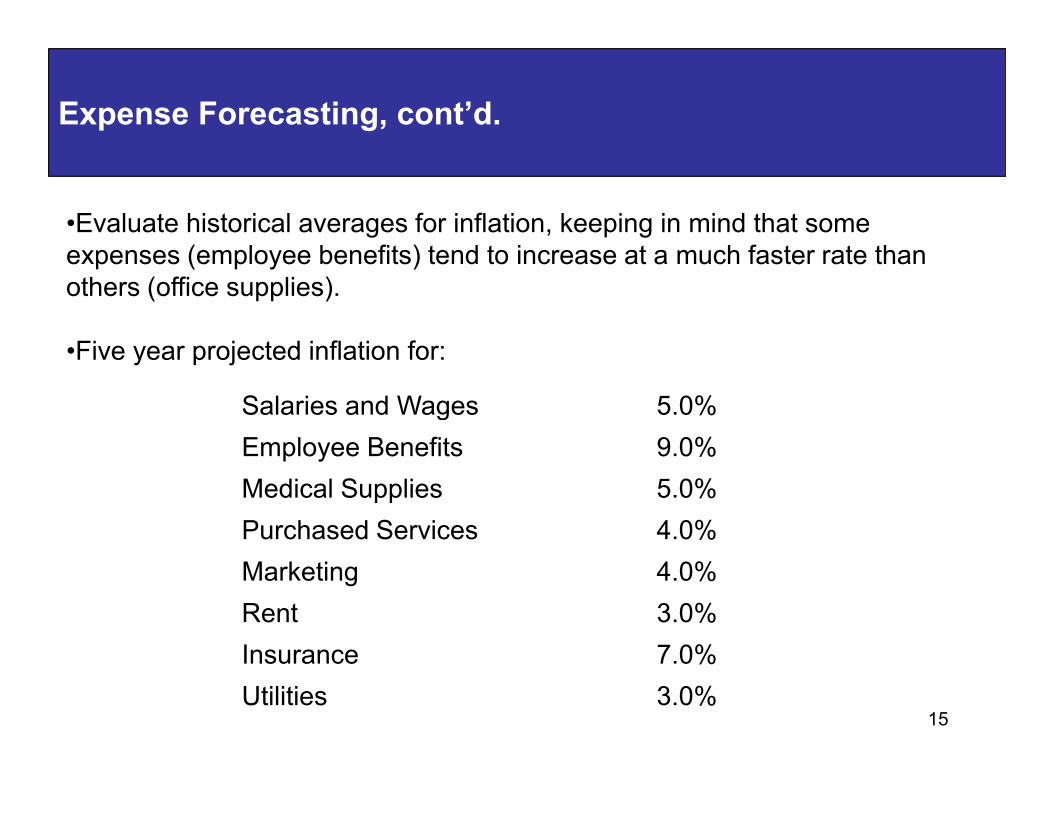
Expense Forecasting, cont’d.
•Evaluate historical averages for inflation, keeping in mind that some expenses (employee benefits) tend to increase at a much faster rate than others (office supplies).
•Five year projected inflation for:
Salaries and Wages 5.0%
15
Salaries and Wages 5.0%
Employee Benefits 9.0%
Medical Supplies 5.0%
Purchased Services 4.0%
Marketing 4.0%
Rent 3.0%
Insurance 7.0%
Utilities 3.0%
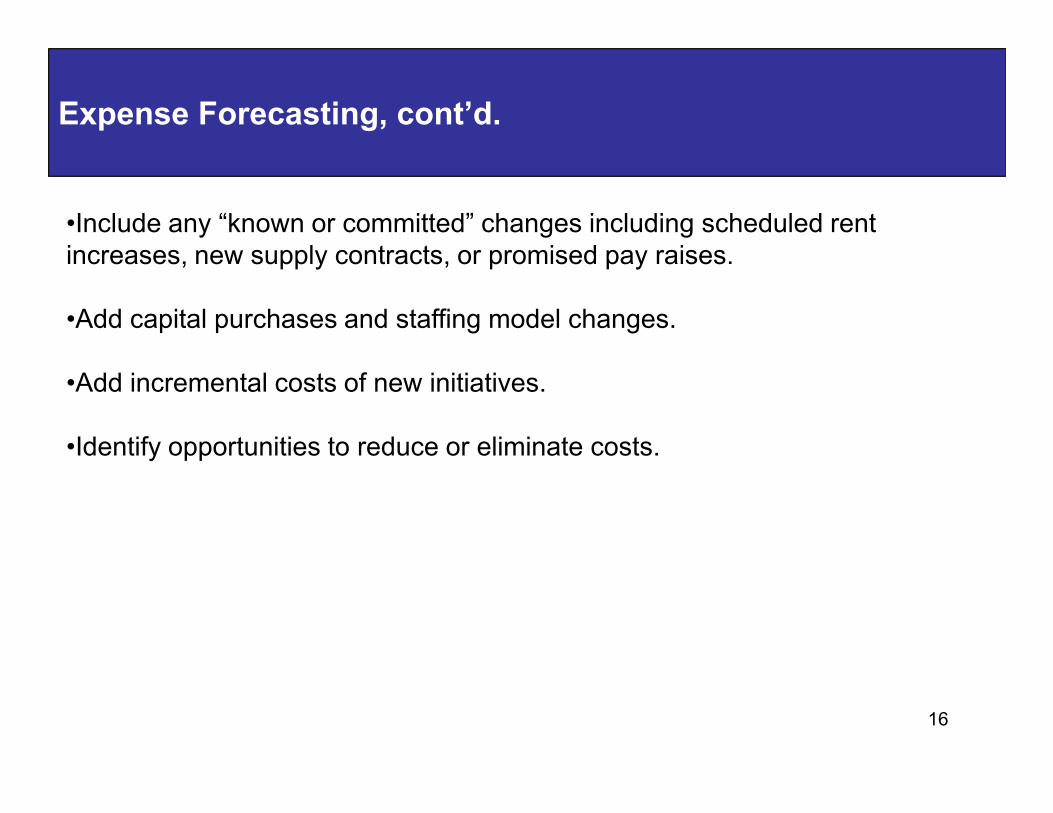
Expense Forecasting, cont’d.
•Include any “known or committed” changes including scheduled rent increases, new supply contracts, or promised pay raises.
•Add capital purchases and staffing model changes.
•Add incremental costs of new initiatives.
16
•Identify opportunities to reduce or eliminate costs.
12%
14%
16%
18%
Weekday
Saturday
Sunday
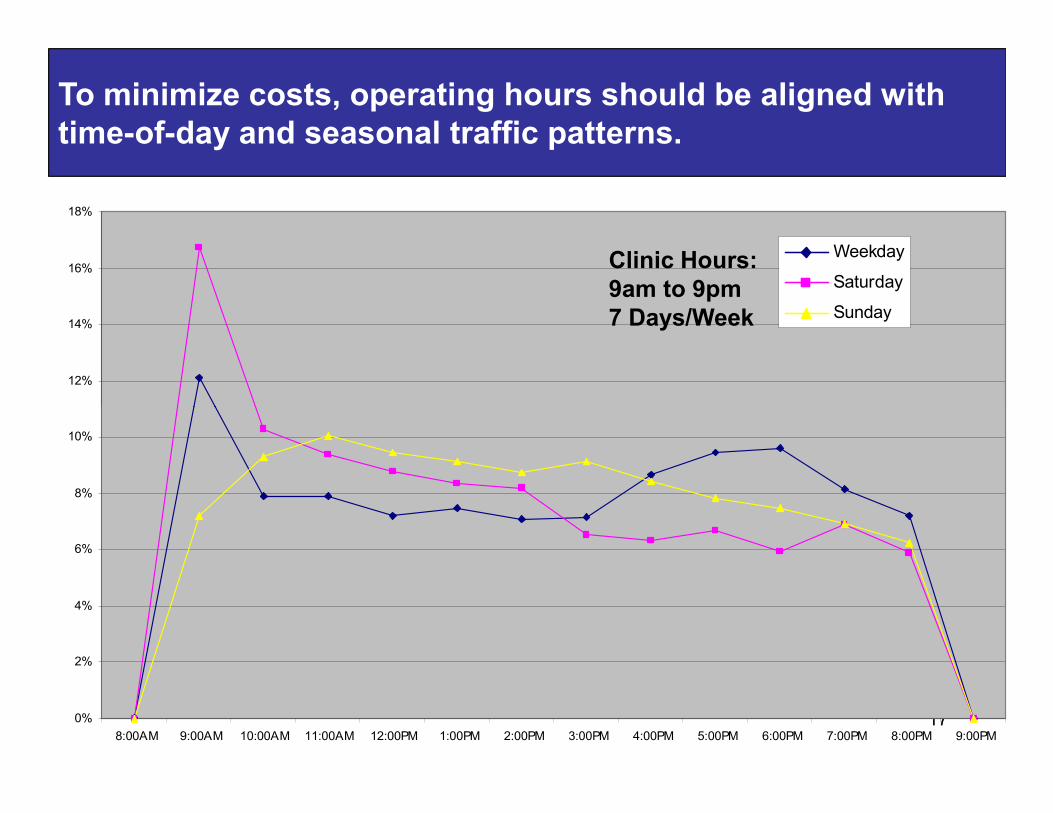
To minimize costs, operating hours should be aligned with time-of-day and seasonal traffic patterns.
Clinic Hours:9am to 9pm7 Days/Week
170%
2%
4%
6%
8%
10%
8:00AM 9:00AM 10:00AM 11:00AM 12:00PM 1:00PM 2:00PM 3:00PM 4:00PM 5:00PM 6:00PM 7:00PM 8:00PM 9:00PM
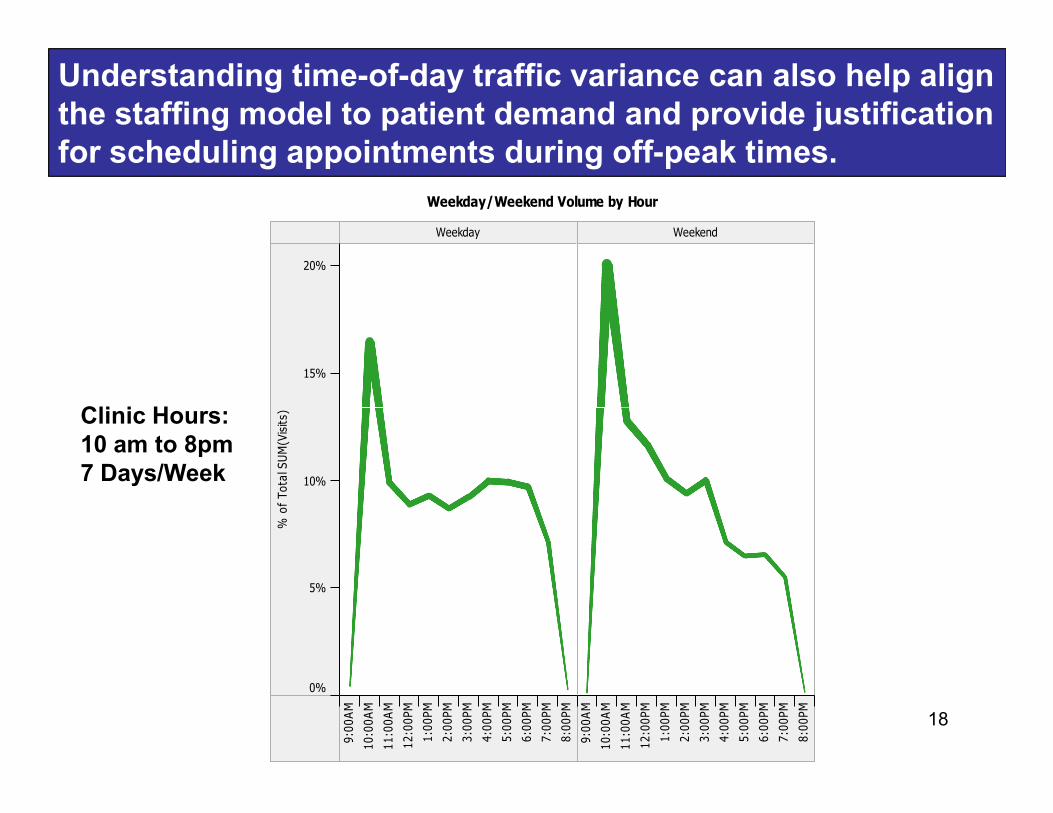
Understanding time-of-day traffic variance can also help align the staffing model to patient demand and provide justification for scheduling appointments during off-peak times.
Weekday Weekend
15%
20%
Weekday/Weekend Volume by Hour
Clinic Hours:
18
9:00AM
10:00AM
11:00AM
12:00PM
1:00PM
2:00PM
3:00PM
4:00PM
5:00PM
6:00PM
7:00PM
8:00PM
9:00AM
10:00AM
11:00AM
12:00PM
1:00PM
2:00PM
3:00PM
4:00PM
5:00PM
6:00PM
7:00PM
8:00PM
0%
5%
10%
% of Total SUM(Visits)Clinic Hours:
10 am to 8pm7 Days/Week
Budget as a Management Tool
Comparing actual to budgeted results (variance analysis) can help managers pinpoint specific performance issues while evaluating common ratios (ratio analysis) identifies changes in:
•Productivity of fixed assets and other investments (such as marketing).
•Productivity of providers and staff.
19
•Productivity of providers and staff.
•Effectiveness of billing and collections.
•Management control over costs.
•Obligations to third parties (such as bank loan covenants).
Budget as a Management Tool
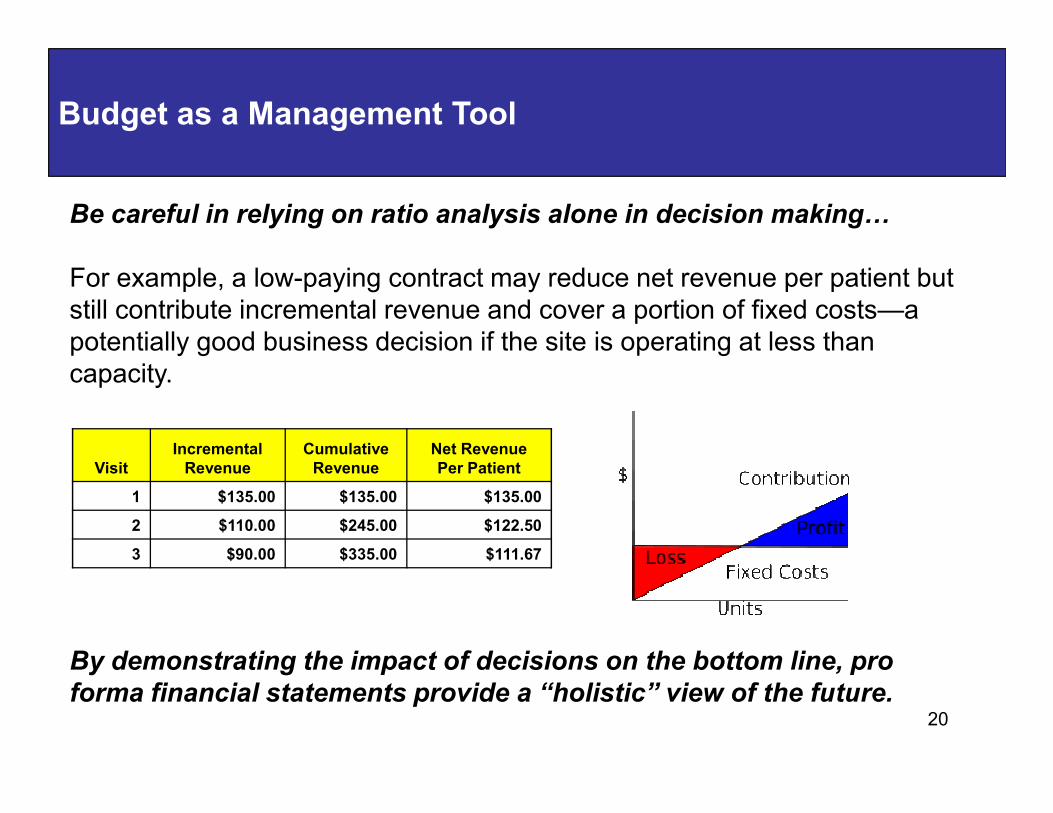
Be careful in relying on ratio analysis alone in decision making�
For example, a low-paying contract may reduce net revenue per patient but still contribute incremental revenue and cover a portion of fixed costs—a potentially good business decision if the site is operating at less than capacity.
20
By demonstrating the impact of decisions on the bottom line, pro
forma financial statements provide a “holistic” view of the future.
VisitIncrementalRevenue
CumulativeRevenue
Net Revenue Per Patient
1 $135.00 $135.00 $135.00
2 $110.00 $245.00 $122.50
3 $90.00 $335.00 $111.67
Cash is King: You can’t pay bills with IOU’s.
Consider the timing of cash flows:•Fixed costs paid in advance (or financed).•Operating expenses paid as incurred.•Cash flow subject to collections cycle.
Planning steps:•Understand accounts receivable cycle by payer.
21
•Understand accounts receivable cycle by payer.•Project timing of cash flows based on payer and patient mix.•Assess impact of collection policies on cash flow.
Non-expense cash outlays:•Loan principal payments•Capital purchases•Tax payments•Owner distributions
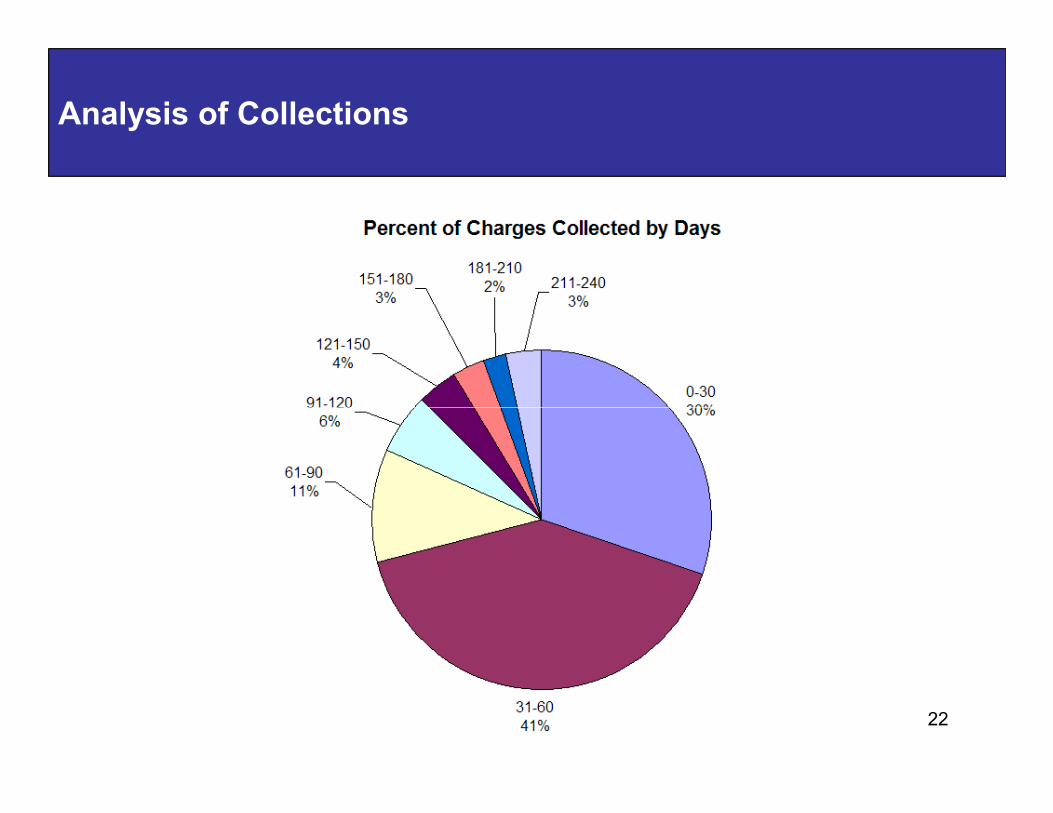
Analysis of Collections
22
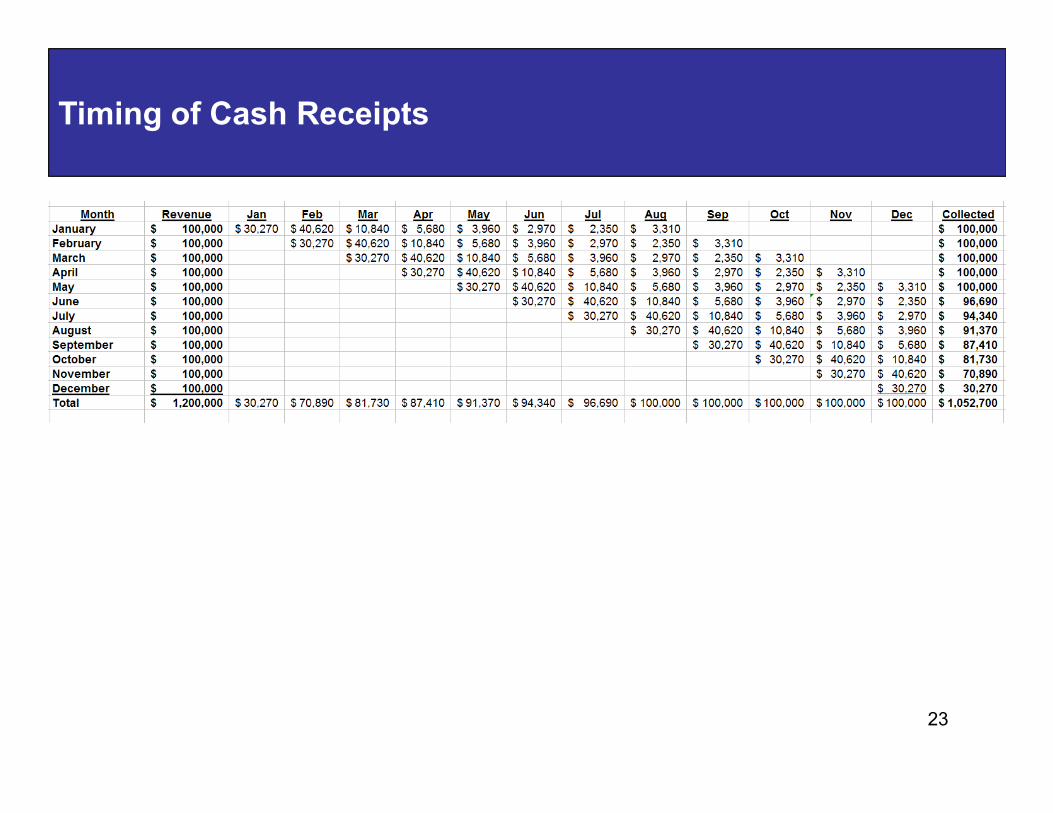
Timing of Cash Receipts
23
Hidden Sources of Cash
•Accounts receivable:•>45 days and >20% patient balances indicate problems
•Front desk understanding of medical billing terminology•Verifying and collecting co-pay, deductibles, and prior balances•Correctly entering demographics including guarantor and co-insurance•Charge entry timeliness and accuracy including use of modifiers
24
•Supply inventory levels:•Excess inventory ties up cash and increases risk of expired product•Supplies should be appropriate to center volume and acuity•1-2 day turn-around from major suppliers
•Treasury management:•Use lockbox and sweep accounts to accelerate collections•Use online bill pay to assure prompt pay discounts and stretch payments to maximum allowed by terms•Relationship banking earnings credit offsets bank service charges including credit card processing
DuPont Equation
Profit = Margin x Turns
Margin = How much you make on each patient.Turns = How many patients you see.Turns = How many patients you see.
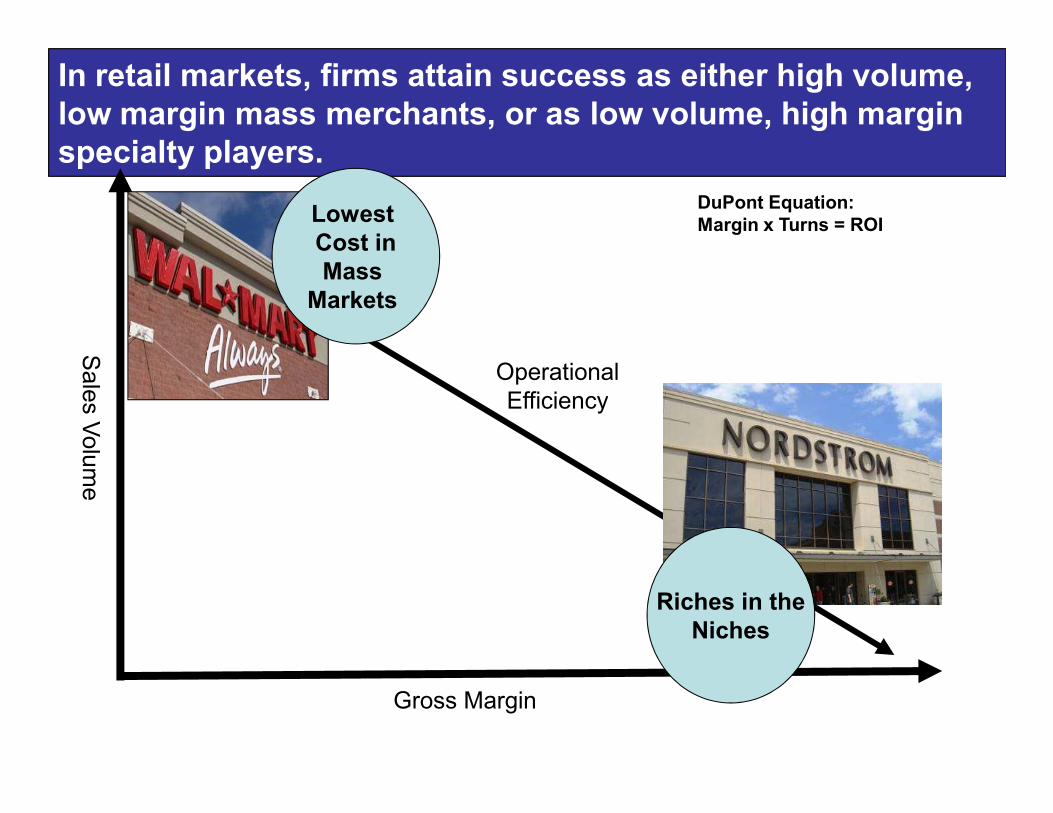
In retail markets, firms attain success as either high volume, low margin mass merchants, or as low volume, high margin specialty players.
Sales Volume
Lowest Cost inMass Markets
OperationalEfficiency
DuPont Equation:Margin x Turns = ROI
Gross Margin
Sales Volume
Efficiency
Riches in theNiches
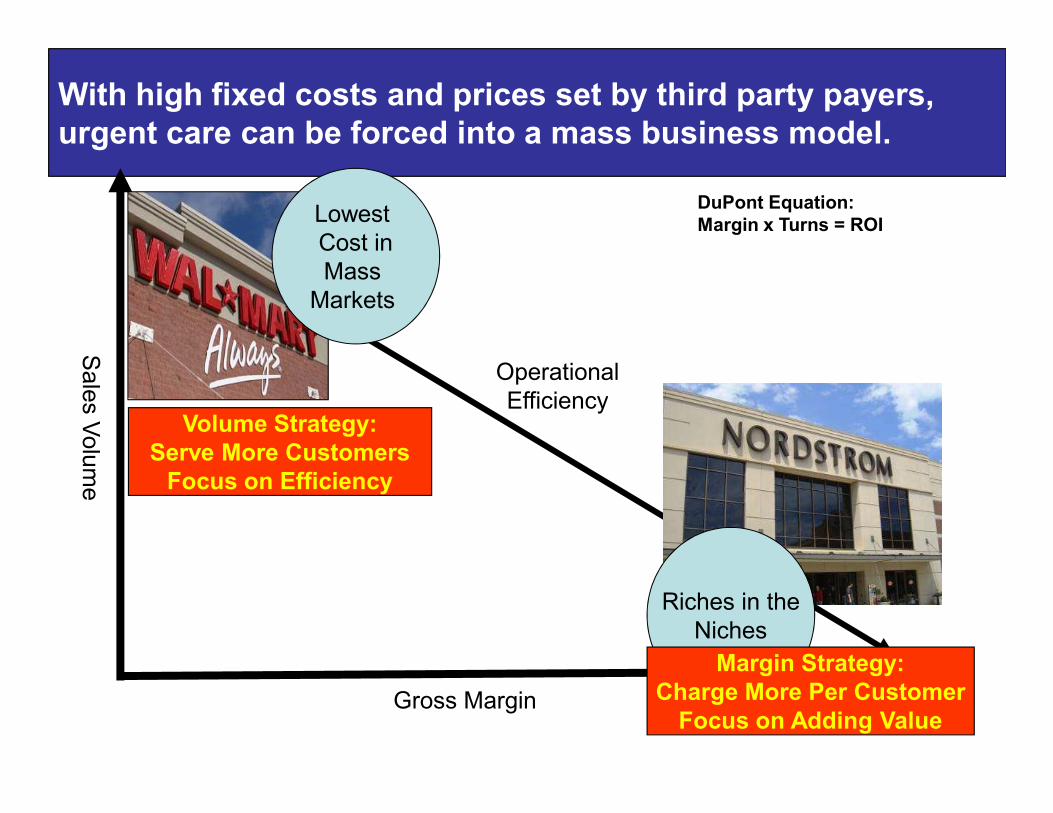
With high fixed costs and prices set by third party payers, urgent care can be forced into a mass business model.
Sales Volume
Lowest Cost inMass
Markets
OperationalEfficiency
DuPont Equation:Margin x Turns = ROI
Gross Margin
Sales Volume
EfficiencyVolume Strategy:
Serve More CustomersFocus on Efficiency
Riches in theNiches
Margin Strategy:Charge More Per CustomerFocus on Adding Value
To increase profits, an urgent care operator can:
•Increase volume and reduce costs.
•Diversify the revenue stream with higher margin ancillary services.
•Reduce billing costs and increase average reimbursement by contracting
Urgent care struggles with margin compression due to declining insurance reimbursement and rising operating costs.
•Reduce billing costs and increase average reimbursement by contracting directly with employers or consumers.
•Utilize physician extenders (NP’s/PA’s) and staff according to demand.
•Add value to basic medical visits to justify price premium over lower cost providers.
Diversifying the product and service offering not only enhances
revenue and margin, but it also flattens seasonality, smoothes
traffic flow, and reduces risk.
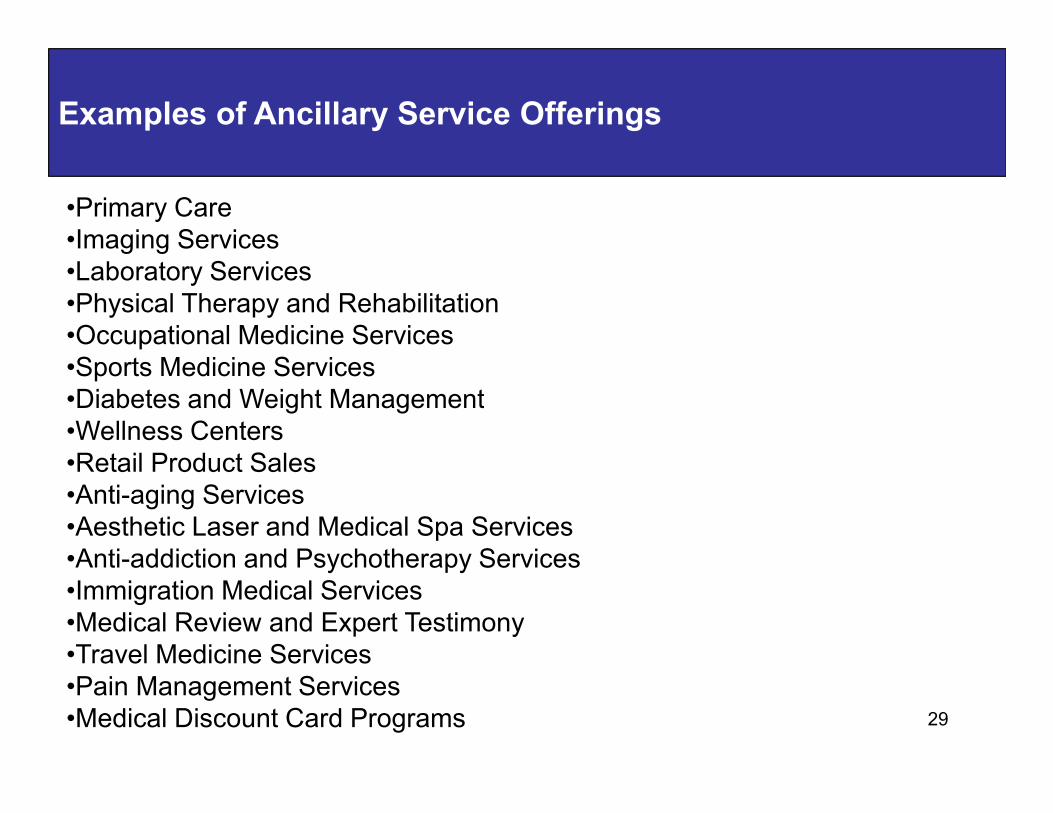
•Primary Care•Imaging Services•Laboratory Services•Physical Therapy and Rehabilitation•Occupational Medicine Services•Sports Medicine Services•Diabetes and Weight Management
Examples of Ancillary Service Offerings
29
•Diabetes and Weight Management•Wellness Centers•Retail Product Sales•Anti-aging Services•Aesthetic Laser and Medical Spa Services•Anti-addiction and Psychotherapy Services•Immigration Medical Services•Medical Review and Expert Testimony•Travel Medicine Services•Pain Management Services•Medical Discount Card Programs
UCAOA Member Resources
30

Alan A. Ayers, MBA, MAccAssistant Vice PresidentConcentra Urgent Care
31
31
Dallas, Texas
[email protected](214) 538-8432