national survey of student engagement at iu kokomo administrative council 26 september 2007
TRANSCRIPT

NATIONAL SURVEY OF STUDENT ENGAGEMENT AT IU KOKOMOAdministrative Council 26 September 2007

What is NSSE?
Administered by IU Center for Postsecondary Research
More than 500 institutions nationwide participate each year
Designed to measure “Student Engagement”

What is NSSE?
•What students do—time and energy spent devoted to educationally purposeful activities•What institutions do—using effective educational practices to induce students to do the right things
Two Components of Student Engagement

Why Engagement?
Student engagement is one measure of the quality of the institution
Research shows that students who are engaged Learn more Move further along in their development Are more likely to persist to complete their
degree

NSSE At IU Kokomo
Administered to First Year and Senior students in Spring of 2000, 2001, 2004, 2005, and 2006
Plan to participate again in Spring 2009 Have not routinely released our results
to any outside group Campus leadership and some campus
groups have discussed some of the results

New NSSE/USA Today Joint Venture
Goal is “to further educate the public about the link between student engagement and a high quality undergraduate experience.”
NSSE Benchmarks (composite scores) will be published on a new USA Today website


NSSE at IU Kokomo
Respondents
Benchmarks
Difference Scores
Supportive Campus Environment
Overall Satisfaction

Respondent Characteristics
How they spend their time compared to peers: Less time working for pay on campus More time working for pay off campus Less time in co-curricular activities (except 2006) About the same amount of time preparing for class About the same amount of time relaxing &
socializing More time caring for dependents living with them
(except 2006 FY) About the same amount of time commuting to class

Parents’ Educational Attainment ~10 – 20% of respondents’ fathers did
not finish high school ~5 – 10% of respondents’ mothers did
not finish high school ~55 – 60% of fathers have not attended
college ~45 – 60% of mothers have not
attended college

Benchmark Scores
Level of Academic Challenge
Active and Collaborative Learning
Student-Faculty Interaction
Enriching Educational Experiences
Supportive Campus Environment

Level of Academic Challenge
2004 2005 200630
35
40
45
50
55
60
KokomoSelected PeersBac-Gen
2004 2005 200630
35
40
45
50
55
60
KokomoSelected PeersBac-Gen
First Year Students Senior Students

Active & Collaborative Learning
2004 2005 200630
35
40
45
50
55
60
KokomoSelected PeersBac-Gen
2004 2005 200630
35
40
45
50
55
60
KokomoSelected PeersBac-Gen
First Year Students Senior Students

Student-Faculty Interaction
2004 2005 2006101520253035404550
Kokomo PeersBac-Gen
2004 2005 2006101520253035404550
Kokomo PeersBac-Gen
First Year Students Senior Students

Enriching Educational Experiences
2004 2005 2006101520253035404550
Kokomo PeersBac-Gen
2004 2005 2006101520253035404550
Kokomo PeersBac-Gen
First Year Students Senior Students

Supportive Campus Environment
2004 2005 200620
30
40
50
60
KokomoSelected PeersBac-Gen
2004 2005 200620
30
40
50
60
KokomoSelected PeersBac-Gen
First Year Students Senior Students

Mean Differences from Selected Peers 2005 - 06
LAC ACL SFI EEE SCE
-8
-6
-4
-2
0
2
4
6
8
FY 2005FY 2006Sr 2005Sr 2006
**
*
***
*
*
* p < .05 ** p < .01 *** p < .001

Significant Mean Differences from Selected Peers 2005 - 06
LAC ACL SFI EEE SCE
-8
-6
-4
-2
0
2
4
6
8
FY 2005
FY 2006
**
*
***
*
*
Supportive Campus En-vironment
* p < .05 ** p < .01 *** p < .001
Level of Academic Challenge

Supportive Campus Environment
Two types of items: Quality of relationships with other students,
faculty, and administrative offices & staff Extent of campus support in academic,
non-academic (work, family), and social arenas

SCE: Quality of Relationships with Other Students
2004 2005 20061
2
3
4
5
6
7
KO Peers
2004 2005 20061
2
3
4
5
6
7
KO Peers
Mean for First Year Students
Mean for Senior Students
1 = Unfriendly, unsupportive, sense of alienation; 7 = Friendly, supportive, sense of belonging

SCE: Quality of Relationships with Other Students
1 2 3 4 5 6 70%5%
10%15%20%25%30%35%40%
2004 2005 2006
1 2 3 4 5 6 70%5%
10%15%20%25%30%35%40%
2004 2005 2006
First Year Students Senior Students
1 = Unfriendly, unsupportive, sense of alienation; 7 = Friendly, supportive, sense of belonging

SCE: Quality of Relationships with Faculty
2004 2005 20061
2
3
4
5
6
7
KO Peers
2004 2005 20061
2
3
4
5
6
7
KO Peers
Mean for First Year Students
Mean for Senior Students
1 = Unavailable, unhelpful, unsympathetic; 7 = Available, helpful, sympathetic

SCE: Quality of Relationships with Faculty
1 2 3 4 5 6 70%5%
10%15%20%25%30%35%40%
2004 2005 2006
1 2 3 4 5 6 70%5%
10%15%20%25%30%35%40%
2004 2005 2006
First Year Students Senior Students
1 = Unavailable, unhelpful, unsympathetic; 7 = Available, helpful, sympathetic

SCE: Quality of Relationships with Administrative Personnel and Offices
2004 2005 20061
2
3
4
5
6
7
KO Peers
2004 2005 20061
2
3
4
5
6
7
KO Peers
Mean for First Year Students
Mean for Senior Students
1 = Unhelpful, inconsiderate, rigid; 7 = Helpful, considerate, flexible
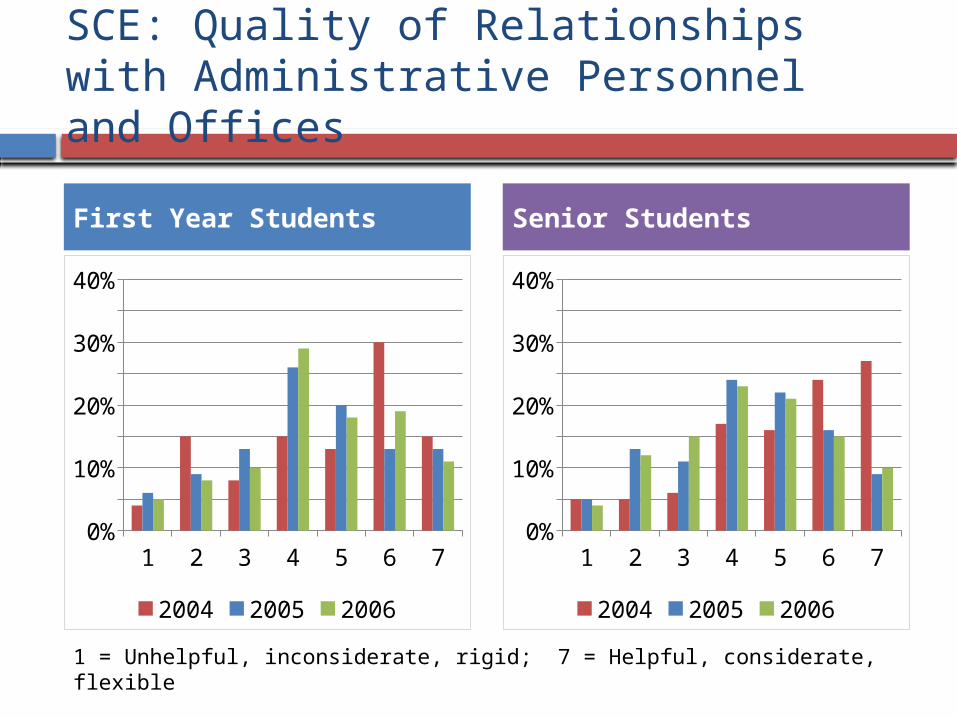
SCE: Quality of Relationships with Administrative Personnel and Offices
1 2 3 4 5 6 70%5%
10%15%20%25%30%35%40%
2004 2005 2006
1 2 3 4 5 6 70%5%
10%15%20%25%30%35%40%
2004 2005 2006
First Year Students Senior Students
1 = Unhelpful, inconsiderate, rigid; 7 = Helpful, considerate, flexible

SCE: Extent to Which Institution Provides Support to Help you Succeed Academically
2004 2005 20061
1.5
2
2.5
3
3.5
4
KO Peers
2004 2005 20061
1.5
2
2.5
3
3.5
4
KO Peers
Mean for First Year Students
Mean for Senior Students
1 = Very Little; 2 = Some; 3 = Quite a Bit; 4 = Very Much

SCE: Extent to Which Institution Provides Support to Help you Succeed Academically
2004 2005 20060%
20%
40%
60%
80%
100%
Very Much Quite a BitSome Very Little
2004 2005 20060%
20%
40%
60%
80%
100%
Very Much Quite a BitSome Very Little
First Year Students Senior Students

SCE: Extent to Which Institution Provides Support to Help You Cope with Non-Academic Responsibilities
2004 2005 20061
1.5
2
2.5
3
3.5
4
KO Peers
2004 2005 20061
1.5
2
2.5
3
3.5
4
KO Peers
Mean for First Year Students
Mean for Senior Students
1 = Very Little; 2 = Some; 3 = Quite a Bit; 4 = Very Much

SCE: Extent to Which Institution Provides Support to Help You Cope with Non-Academic Responsibilities
2004 2005 20060%
20%
40%
60%
80%
100%
Very Much Quite a BitSome Very Little
2004 2005 20060%
20%
40%
60%
80%
100%
Very Much Quite a BitSome Very Little
First Year Students Senior Students

SCE: Extent to Which Institution Provides Support You Need to Thrive Socially
2004 2005 20061
1.5
2
2.5
3
3.5
4
KO Peers
2004 2005 20061
1.5
2
2.5
3
3.5
4
KO Peers
Mean for First Year Students
Mean for Senior Students
1 = Very Little; 2 = Some; 3 = Quite a Bit; 4 = Very Much

SCE: Extent to Which Institution Provides Support You Need to Thrive Socially
2004 2005 20060%
20%
40%
60%
80%
100%
Very Much Quite a BitSome Very Little
2004 2005 20060%
20%
40%
60%
80%
100%
Very Much Quite a BitSome Very Little
First Year Students Senior Students

Overall Satisfaction Items
Overall, how would you evaluate the quality of academic advising you have received at your institution?
How would you evaluate your entire educational experience at this institution?
If you could start over again, would you go to the same institution you are now attending?

Overall, how would you evaluate the quality of academic advising you have received at your institution?
1 = Poor
2 = Fair
3 = Good
4 = Excellent
2004 FY
2004 Sr
2005 FY
2005 Sr
2006 FY
2006 Sr
1
1.5
2
2.5
3
3.5
4
KO Peer
Academic Advising: Peer Comparison

Academic Advising: Frequencies
2004 2005 20060%
20%
40%
60%
80%
100%
Excellent GoodFair Poor
2004 2005 20060%
20%
40%
60%
80%
100%
Excellent GoodFair Poor
First Year Students Senior Students

How would you evaluate your entire educational experience at this institution?
1 = Poor
2 = Fair
3 = Good
4 = Excellent2004
FY2004
Sr2005
FY2005
Sr2006
FY2006
Sr
1
1.5
2
2.5
3
3.5
4
KO Peer
Entire Educational Experience: Peer Comparison

Entire Educational Experience: Frequencies
2004 2005 20060%
20%
40%
60%
80%
100%
Excellent GoodFair Poor
2004 2005 20060%
20%
40%
60%
80%
100%
Excellent GoodFair Poor
First Year Students Senior Students

If you could start over again, would you go to the same institution you are now attending?
1 = Definitely No
2 = Probably No
3 = Probably Yes
4 = Definitely Yes
2004 FY
2004 Sr
2005 FY
2005 Sr
2006 FY
2006 Sr
1
1.5
2
2.5
3
3.5
4
KO Peer
Choose Same Institution: Peer Comparison
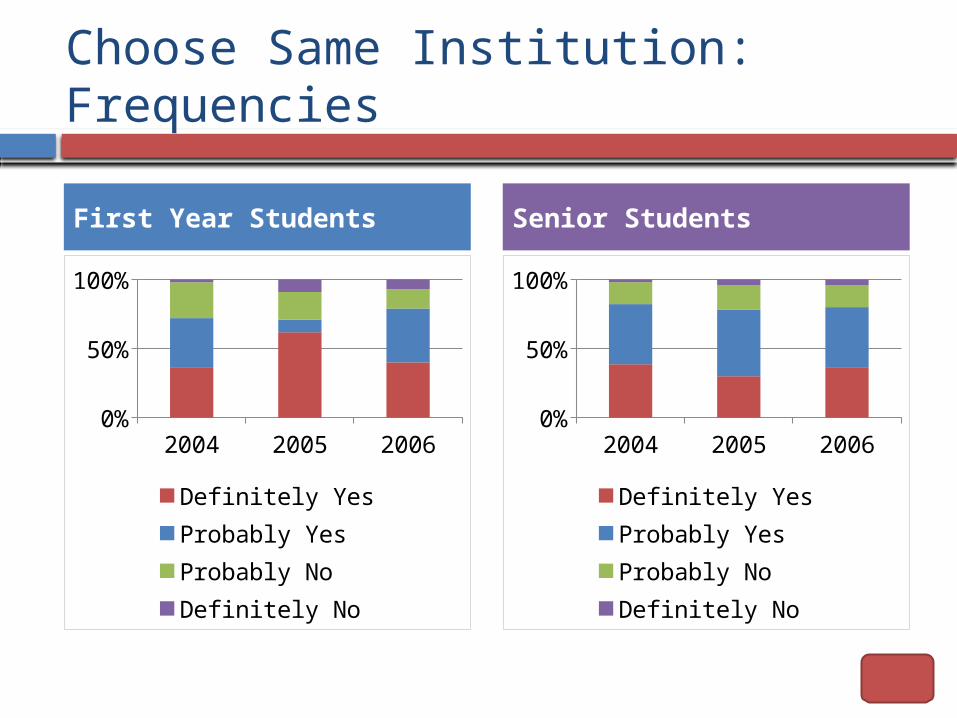
Choose Same Institution: Frequencies
2004 2005 20060%
20%40%60%80%
100%
Definitely YesProbably YesProbably NoDefinitely No
2004 2005 20060%
20%40%60%80%
100%
Definitely YesProbably YesProbably NoDefinitely No
First Year Students Senior Students