national results, 2016 -17 - cae.orgcae.org/images/uploads/pdf/cla_national_results_2016-17.pdf ·...
TRANSCRIPT

National Results, 2016 -17
cae | 215 Lexington Avenue, Floor 16 | New York, NY 10016 | [email protected] | (212) 217-0700 | @CAEnews
Copyright © 2018 Council for Aid to Education
CLA+ NATIONAL RESULTS, 2016-17
1
Contents INTRODUCTION .................................................................................................................................... 2
METHODOLOGY ................................................................................................................................... 2
THE INSTRUMENT .......................................................................................................................... 2
MASTERY lEVELS ............................................................................................................................ 3
INSTITUTIONAL AND STUDENT SAMPLE .................................................................................... 3
GROWTH ESTIMATES ..................................................................................................................... 5
STATISTICAL METHODOLOGY ....................................................................................................... 5
2016-17 CLA+ RESULTS ..................................................................................................................... 5
INSTITUTION-LEVEL CHARACTERISTICS .................................................................................... 5
STUDENT-LEVEL CHARACTERISTICS .......................................................................................... 7
MASTERY LEVELS ........................................................................................................................... 8
SUBSCORES ..................................................................................................................................... 9
GROWTH ESTIMATES .................................................................................................................. 10
CONCLUSION ..................................................................................................................................... 13
REFERENCES .................................................................................................................................... 14
APPENDIX A: LIST OF PARTICIPATING INSTITUTIONS, 2016-17 ................................................ 15
APPENDIX B: CLA+ MASTERY LEVELS .......................................................................................... 16
APPENDIX C: CLA+ PERFORMANCE TASK RUBRIC ...................................................................... 19

CLA+ NATIONAL RESULTS, 2016-17
2
INTRODUCTION In 2002, CAE (the Council for Aid to Education) introduced the Collegiate Learning Assessment (CLA) as a major initiative. Since its launch, CLA has offered institutions a valuable measure of their contributions—or value added—to students’ attainment of higher-order skills. The assessment requires students to analyze, evaluate, and synthesize information as they demonstrate their ability to think critically and solve problems. To date, hundreds of institutions and hundreds of thousands of students have participated in the CLA testing program. In 2013, CAE introduced CLA+, an enhanced version of the assessment that includes new subscores, criterion-referenced mastery levels, and reliable information about performance at the student and institutional levels. Advancing beyond a growth-centered model, CLA+ is designed to measure critical thinking and written communication—key higher-order skills that are valued by both educational institutions and employers. CLA+ provides students with reliable evidence that they possess these skills. Higher-order skills are a necessity for navigating and excelling in today’s complex Knowledge Economy. Employers overwhelmingly report valuing employees who exhibit strong critical-thinking and written-communication skills (Hart Research Associates, 2013). Correspondingly, students who excel in the areas measured by CLA+ have been shown to experience greater success in their immediate post-college careers (Arum & Roksa, 2014). CLA+ enables schools to identify areas of strength and weakness so they can improve their teaching and learning processes and ultimately graduate students who are prepared to succeed in the post-collegiate arena. Concurrently, CLA+ provides graduating students with the tools to stand out in a competitive job market by highlighting key skills for professional success. This report summarizes the performance of the 91 institutions and 19,440 students who participated in the 2016-2017 academic year of CLA+. METHODOLOGY THE INSTRUMENT CLA+ includes two major components: the Performance Task (PT) and the Selected-Response Question (SRQ) section. The Performance Task presents students with a real-world scenario that requires a purposeful written response. Students are asked to address an issue, propose the solution to a problem, or recommend a course of action to resolve a conflict. Students are instructed to support their responses by using information provided in the Document Library. This repository contains a variety of reference materials, such as technical reports, data tables, newspaper articles, office memoranda, and emails. A full PT includes four to nine documents in its Document Library. Students have 60 minutes to complete this constructed-response task. Student responses to the PT are scored in three skill areas: Analysis and Problem Solving, Writing Effectiveness, and Writing Mechanics. Students receive subscores based on the CLA+ rubric, ranging from 1 to 6, for each skill category based on key characteristics of their written responses. These characteristics are described in detail within the PT rubric, available on CAE’s website at http://www.cae.org/claptrubric. PT subscores are then summed to yield raw total PT scores, which are then scaled and equated so that all scores are comparable regardless of which PT was administered. This process, which is accomplished via a linear transformation, puts the PT scores on a scale with an approximate mean of 1000 and standard deviation of 200. In the second part of the examination, students are asked to answer 25 Selected-Response Questions. Like the PT, the 25 SRQs require students to draw information from provided materials. Students have 30 minutes to complete this section of the assessment. Each of three question sets represents a skill area: Scientific and Quantitative Reasoning (10 questions), Critical Reading and Evaluation (10 questions), and Critique an Argument (five questions).
CLA+ NATIONAL RESULTS, 2016-17
3
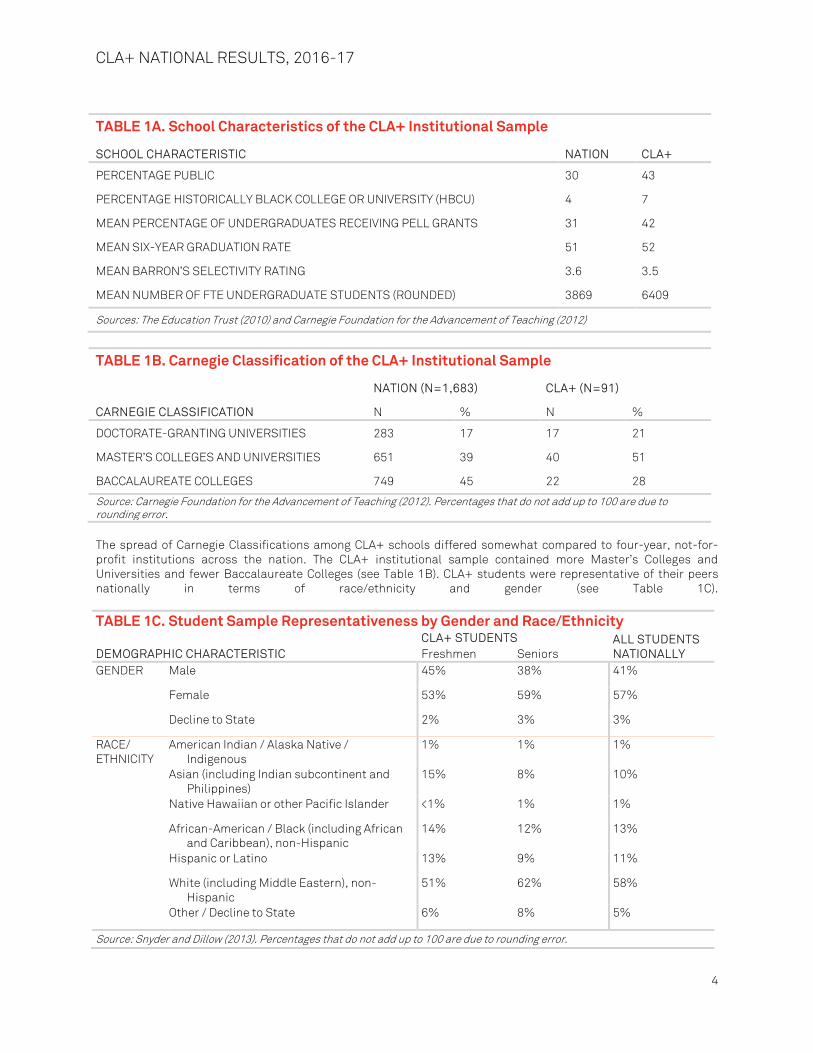
The SRQ section is scored based on the number of correct responses that a student provides. Each set of questions is scored separately and then equated via a linear transformation. This process puts the three SRQ subscores on approximately the same scale as each other and as SRQs given previously, and results in an approximate score range of 200 to 800 for each section, with approximate mean and standard deviation of 500 and 100, respectively. A total SRQ score is created by taking a weighted average of the equated SRQ subscores, with weights corresponding to the number of questions in the subset. In addition to receiving scores for each of the two sections of the assessment, students receive total scores, which are simply the average of the PT and SRQ scores. MASTERY LEVELS CLA+ Mastery Levels contextualize CLA+ scores in relation to the qualities exhibited by examinees. There are five mastery levels: Below Basic, Basic, Proficient, Accomplished, and Advanced. The full standard-setting report can be found at http://cae.org/images/uploads/pdf/cla_ss.pdf. Each mastery level corresponds to specific evidence of critical-thinking and written-communication skills. While the profiles of all five mastery levels can be found in Appendix B, the two most prominent mastery level profiles from the 2016-17 testing administration are highlighted here. Students who score at the Basic Mastery Level provide evidence of a discernible and relevant attempt to analyze the details of the PT and demonstrate that they are able to communicate in a manner that is understandable to the reader. Students with Basic Mastery also show some judgment about the quality of evidence provided in the Document Library. In addition, students scoring at the Basic Mastery Level know the difference between correlation and causality, and they can read and interpret a bar graph—but not necessarily a scatterplot or regression analysis. Tables may be out of reach for Basic Mastery Level students as well. Students scoring at the Proficient Mastery Level have shown that they are able to extract the major relevant pieces of evidence provided in the Document Library and develop a cohesive argument and analysis of the PT. Proficient Mastery Level students are able to distinguish the quality of evidence in these documents and express the appropriate level of conviction in their conclusion given the provided evidence. Additionally, Proficient Mastery Level students are able to suggest additional research or consider counterarguments. Students scoring at the Proficient Mastery Level can correctly identify logical fallacies, accurately interpret quantitative evidence, and distinguish the validity of evidence and its purpose. Likewise, they have the ability to determine the reliability and validity of an argument. Students at this level also recognize when a graph or table is applicable to an argument. INSTITUTIONAL AND STUDENT SAMPLE Participating schools are individually responsible for student sampling and recruitment, with guidance available from CAE on strategies for achieving a representative sample. Schools are recommended to test at least 100 students, or 25% to 50% of the population size for each class level tested. The relative similarity between students who tested and students who did not test increases confidence in the inferences made about schools based only on the students in the CLA+ sample. Additionally, the sample of participating institutions was fairly representative of all four-year institutions nationwide (see Table 1A). Public school representation (43% within CLA+ institutions vs. 30% nationally), percentage of students receiving Pell grants (42% within CLA+ institutions vs. 31% nationally), and average undergraduate student body size (6409 full-time equivalent undergraduates within CLA+ institutions vs. 3869 nationally) were notable exceptions.
CLA+ NATIONAL RESULTS, 2016-17
4
TABLE 1A. School Characteristics of the CLA+ Institutional Sample
SCHOOL CHARACTERISTIC NATION CLA+
PERCENTAGE PUBLIC 30 43
PERCENTAGE HISTORICALLY BLACK COLLEGE OR UNIVERSITY (HBCU) 4 7
MEAN PERCENTAGE OF UNDERGRADUATES RECEIVING PELL GRANTS 31 42
MEAN SIX-YEAR GRADUATION RATE 51 52
MEAN BARRON’S SELECTIVITY RATING 3.6 3.5
MEAN NUMBER OF FTE UNDERGRADUATE STUDENTS (ROUNDED) 3869 6409
Sources: The Education Trust (2010) and Carnegie Foundation for the Advancement of Teaching (2012)
TABLE 1B. Carnegie Classification of the CLA+ Institutional Sample
NATION (N=1,683) CLA+ (N=91)
CARNEGIE CLASSIFICATION N % N %
DOCTORATE-GRANTING UNIVERSITIES 283 17 17 21
MASTER’S COLLEGES AND UNIVERSITIES 651 39 40 51
BACCALAUREATE COLLEGES 749 45 22 28
Source: Carnegie Foundation for the Advancement of Teaching (2012). Percentages that do not add up to 100 are due to rounding error. The spread of Carnegie Classifications among CLA+ schools differed somewhat compared to four-year, not-for-profit institutions across the nation. The CLA+ institutional sample contained more Master’s Colleges and Universities and fewer Baccalaureate Colleges (see Table 1B). CLA+ students were representative of their peers nationally in terms of race/ethnicity and gender (see Table 1C).
TABLE 1C. Student Sample Representativeness by Gender and Race/Ethnicity
DEMOGRAPHIC CHARACTERISTIC CLA+ STUDENTS ALL STUDENTS
NATIONALLY Freshmen Seniors GENDER Male 45% 38% 41%
Female 53% 59% 57%
Decline to State 2% 3% 3%
RACE/ ETHNICITY
American Indian / Alaska Native / Indigenous
1% 1% 1%
Asian (including Indian subcontinent and Philippines)
15% 8% 10%
Native Hawaiian or other Pacific Islander <1% 1% 1%
African-American / Black (including African and Caribbean), non-Hispanic
14% 12% 13%
Hispanic or Latino 13% 9% 11%
White (including Middle Eastern), non-Hispanic
51% 62% 58%
Other / Decline to State 6% 8% 5%
Source: Snyder and Dillow (2013). Percentages that do not add up to 100 are due to rounding error.

CLA+ NATIONAL RESULTS, 2016-17
5
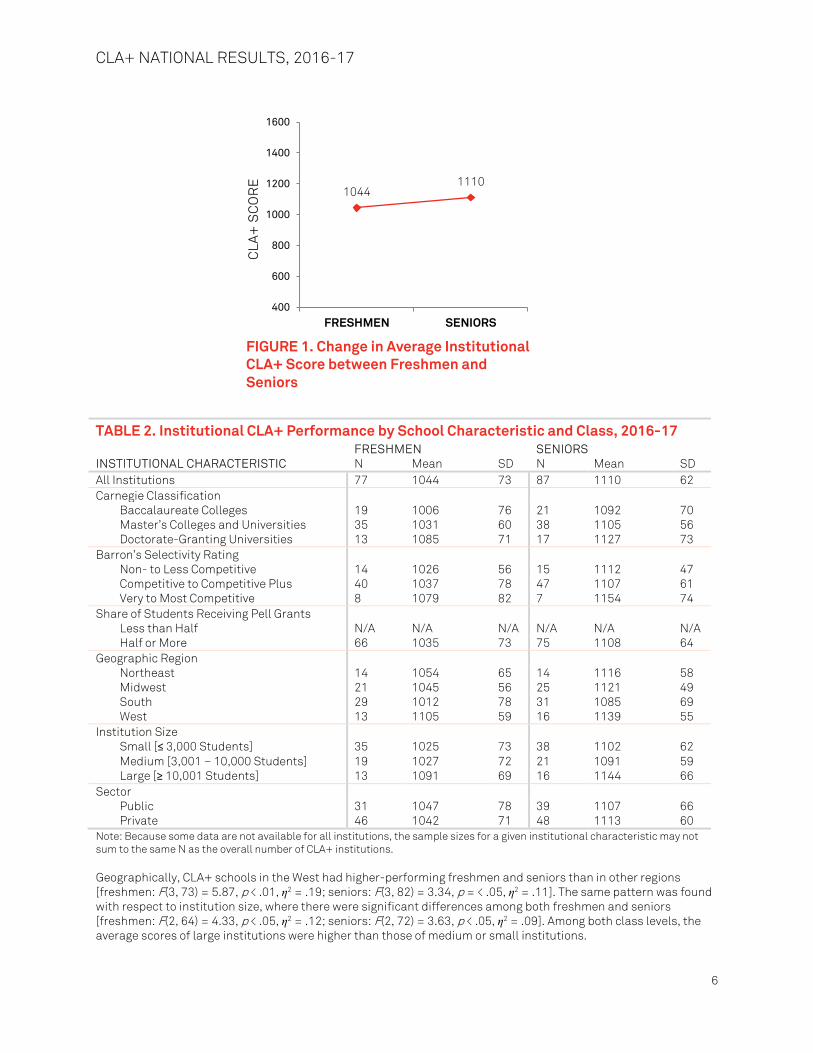
GROWTH ESTIMATES CAE calculates two types of growth estimates for participating schools: effect sizes and value-added scores. Effect sizes characterize the amount of growth that is evident across classes based on mean differences in CLA+ scores. They do so by subtracting the mean freshman score from the mean score of the sophomores, juniors, or seniors, and dividing this amount by the freshman standard deviation. This report only considers freshman-to-senior effect sizes. While effect sizes measure growth between freshman year and subsequent years within an institution, value-added scores relate that growth meaningfully to the growth of students across other colleges and universities. A simple comparison of the average achievement at all schools would fail to account for the many ways that students differ from each other on factors unrelated to their institutions and would therefore present some institutions in a more favorable light than others. Value-added modeling attempts to equalize factors that are not school effects so that between-school comparisons of growth are not confounded with factors outside of schools’ control, such as parent education. Compared to effect sizes, value-added scores are generally viewed as a more equitable way of estimating an institution’s contribution to learning and thus of demonstrating its relative educational efficacy. Value-added scores are only calculated for growth between freshman and senior years. To calculate value-added estimates, CAE employs a statistical technique to yield value-added scores that indicate the degree to which observed senior CLA+ mean scores at an institution meet, exceed, or fall below expectations as established by two factors: the seniors’ parent education, which accounts for differences between students unrelated to their school, and the mean CLA+ performance of freshmen at the school, which serves as a baseline for growth at each school. STATISTICAL METHODOLOGY Most of the results reported here are comparisons of different groups of institutions on mean freshman and senior CLA+ test scores, value-added scores, and effect sizes. To determine which comparisons are statistically significant, independent-samples t-tests (yielding a t-statistic and p-value) are used to compare two groups and one-way analyses of variance (ANOVAs; yielding an F-statistic and p-value) are used to compare three or more groups. As a general rule, p-values less than .05 (p < .05, p < .01, or p < .001) are considered statistically significant and indicative of substantively meaningful findings. Any p-values greater than .05 indicate that any observed differences between groups are not great enough to indicate substantively meaningful differences (i.e., the results could have been obtained simply by chance). 2016-17 CLA+ RESULTS INSTITUTION-LEVEL CHARACTERISTICS The average institutional mean freshman CLA+ score in fall 2016 was 1044, indicating basic mastery of the skills measured by CLA+. The average institutional mean senior CLA+ score was 66 points higher (1110), indicating proficient mastery of critical-thinking and written-communication skills. Performance differed considerably across institutions. Table 2 summarizes differences in average institutional score by each of the previously discussed institutional characteristics. Interestingly, there was no significant difference among institutions based on Barron’s Selectivity Rating [freshmen: F(2, 59) = 1.35, p = .27; seniors: F(2, 66) = 1.89, p = .16]. Additionally, there were no significant differences between public and private schools at either class level [freshmen: t(75) = .33, p = .74; seniors: t(85) = -.45, p = .66]. However, there were small, but significant, differences based on Carnegie Classification among freshmen [F(2, 64) = 5.51, p < .01, η2 = .15]. These differences did not hold among seniors [F(2, 73) = 1.38, p = .26].
CLA+ NATIONAL RESULTS, 2016-17
6
TABLE 2. Institutional CLA+ Performance by School Characteristic and Class, 2016-17 FRESHMEN SENIORS INSTITUTIONAL CHARACTERISTIC N Mean SD N Mean SD All Institutions 77 1044 73 87 1110 62 Carnegie Classification
Baccalaureate Colleges 19 1006 76 21 1092 70 Master’s Colleges and Universities 35 1031 60 38 1105 56 Doctorate-Granting Universities 13 1085 71 17 1127 73
Barron’s Selectivity Rating Non- to Less Competitive 14 1026 56 15 1112 47 Competitive to Competitive Plus 40 1037 78 47 1107 61 Very to Most Competitive 8 1079 82 7 1154 74
Share of Students Receiving Pell Grants Less than Half N/A N/A N/A N/A N/A N/A Half or More 66 1035 73 75 1108 64
Geographic Region Northeast 14 1054 65 14 1116 58 Midwest 21 1045 56 25 1121 49 South 29 1012 78 31 1085 69 West 13 1105 59 16 1139 55
Institution Size Small [≤ 3,000 Students] 35 1025 73 38 1102 62 Medium [3,001 – 10,000 Students] 19 1027 72 21 1091 59 Large [≥ 10,001 Students] 13 1091 69 16 1144 66
Sector Public 31 1047 78 39 1107 66 Private 46 1042 71 48 1113 60
Note: Because some data are not available for all institutions, the sample sizes for a given institutional characteristic may not sum to the same N as the overall number of CLA+ institutions.
Geographically, CLA+ schools in the West had higher-performing freshmen and seniors than in other regions [freshmen: F(3, 73) = 5.87, p < .01, η2 = .19; seniors: F(3, 82) = 3.34, p = < .05, η2 = .11]. The same pattern was found with respect to institution size, where there were significant differences among both freshmen and seniors [freshmen: F(2, 64) = 4.33, p < .05, η2 = .12; seniors: F(2, 72) = 3.63, p < .05, η2 = .09]. Among both class levels, the average scores of large institutions were higher than those of medium or small institutions.
FIGURE 1. Change in Average Institutional CLA+ Score between Freshmen and Seniors
1044 1110
400
600
800
1000
1200
1400
1600
FRESHMEN SENIORS
CLA
+ S
CO
RE
CLA+ NATIONAL RESULTS, 2016-17
7
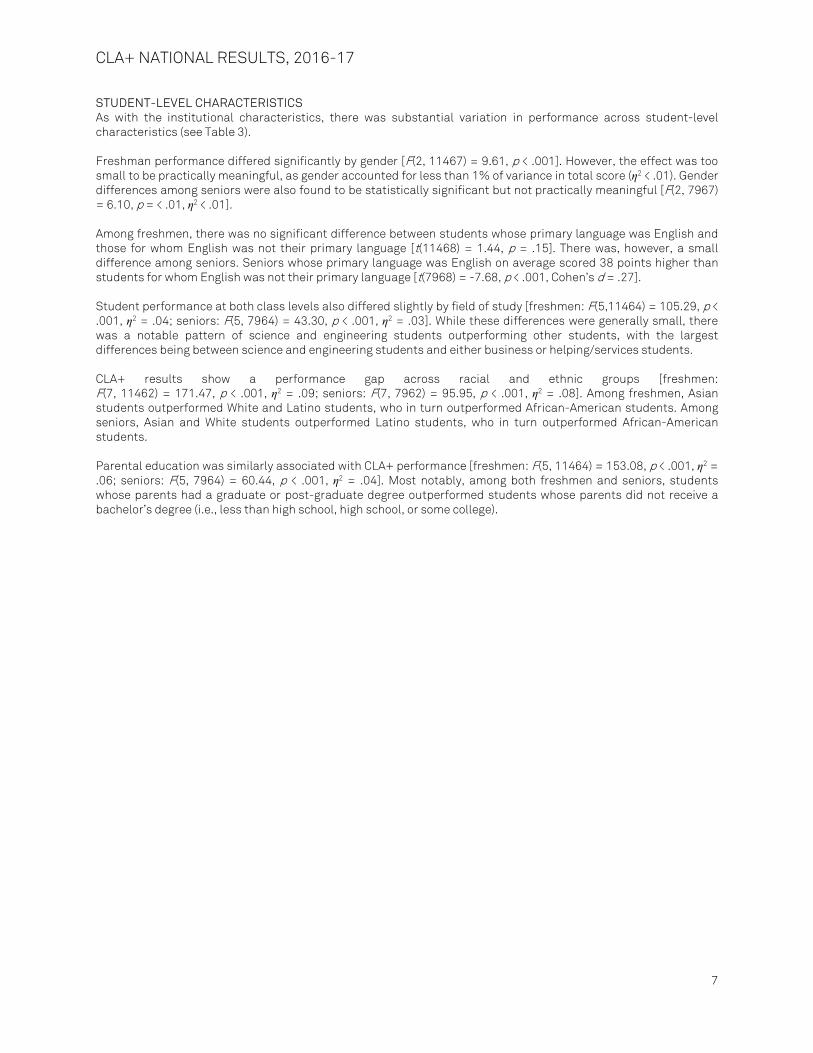
STUDENT-LEVEL CHARACTERISTICS As with the institutional characteristics, there was substantial variation in performance across student-level characteristics (see Table 3). Freshman performance differed significantly by gender [F(2, 11467) = 9.61, p < .001]. However, the effect was too small to be practically meaningful, as gender accounted for less than 1% of variance in total score (η2 < .01). Gender differences among seniors were also found to be statistically significant but not practically meaningful [F(2, 7967) = 6.10, p = < .01, η2 < .01]. Among freshmen, there was no significant difference between students whose primary language was English and those for whom English was not their primary language [t(11468) = 1.44, p = .15]. There was, however, a small difference among seniors. Seniors whose primary language was English on average scored 38 points higher than students for whom English was not their primary language [t(7968) = -7.68, p < .001, Cohen’s d = .27]. Student performance at both class levels also differed slightly by field of study [freshmen: F(5,11464) = 105.29, p < .001, η2 = .04; seniors: F(5, 7964) = 43.30, p < .001, η2 = .03]. While these differences were generally small, there was a notable pattern of science and engineering students outperforming other students, with the largest differences being between science and engineering students and either business or helping/services students.
CLA+ results show a performance gap across racial and ethnic groups [freshmen: F(7, 11462) = 171.47, p < .001, η2 = .09; seniors: F(7, 7962) = 95.95, p < .001, η2 = .08]. Among freshmen, Asian students outperformed White and Latino students, who in turn outperformed African-American students. Among seniors, Asian and White students outperformed Latino students, who in turn outperformed African-American students. Parental education was similarly associated with CLA+ performance [freshmen: F(5, 11464) = 153.08, p < .001, η2 = .06; seniors: F(5, 7964) = 60.44, p < .001, η2 = .04]. Most notably, among both freshmen and seniors, students whose parents had a graduate or post-graduate degree outperformed students whose parents did not receive a bachelor’s degree (i.e., less than high school, high school, or some college).
CLA+ NATIONAL RESULTS, 2016-17
8
TABLE 3. Student CLA+ Performance by Class and Demographic Characteristic, 2016-17 FRESHMEN SENIORS DEMOGRAPHIC CHARACTERISTIC N Mean SD N Mean SD All Students 11470 1063 144 7970 1110 140 Transfer Status
Transfer Student -- -- -- 1674 1074 137 Non-Transfer Student -- -- -- 6296 1120 140
Gender Male 5096 1068 147 3047 1113 144 Female 6172 1058 140 4697 1111 137 Decline to State 202 1084 165 226 1079 153
Primary Language English 9646 1062 145 7058 1115 140 Other 1824 1067 140 912 1077 138
Field of Study Sciences and Engineering 3832 1099 143 1583 1148 137 Social Sciences 1092 1078 147 1108 1125 143 Humanities and Languages 991 1070 143 1178 1114 144 Business 1743 1045 140 1849 1091 136 Helping / Services 2696 1024 132 1869 1097 137 Undecided / Other / N/A 1116 1041 144 383 1070 136
Race/Ethnicity American Indian / Alaska Native /
Indigenous 75 1001 124 50 1106 149
Asian [Including Indian Subcontinent and Philippines]
1708 1109 135 619 1121 138
Native Hawaiian or Other Pacific Islander
50 1062 145 84 1052 127
African-American / Black [Including African and Caribbean], Non-Hispanic
1564 963 125 910 1016 129
Hispanic or Latino 1438 1043 136 720 1093 134 White [Including Middle Eastern], Non-
Hispanic 5996 1082 138 4955 1134 134
Other 304 1048 157 245 1085 146 Decline to State 335 1070 156 387 1075 147
Parent Education Less Than High School 368 1022 126 217 1064 125 High School 1931 1012 131 1250 1076 132 Some College 2266 1036 138 1952 1093 137 Bachelor’s Degree 3594 1073 143 2443 1121 140 Graduate or Post-Graduate Degree 3194 1109 143 2026 1144 140 Don’t Know/Decline to State 117 991 121 82 1030 152
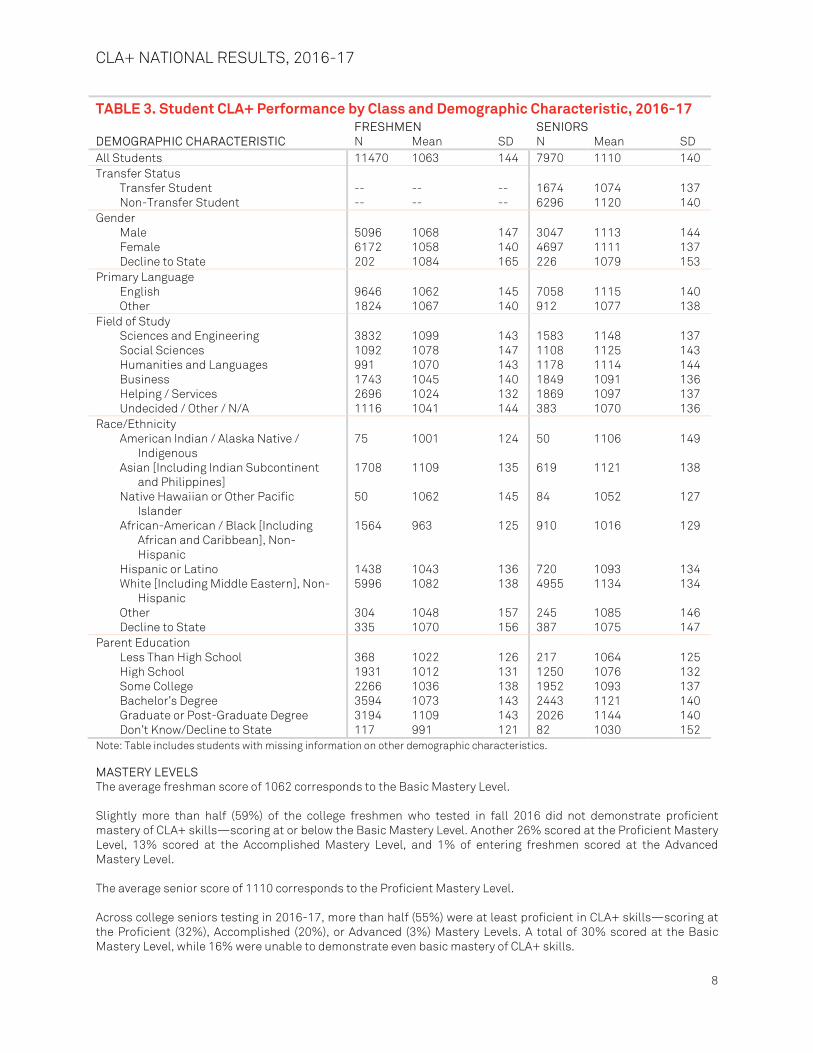
Note: Table includes students with missing information on other demographic characteristics. MASTERY LEVELS The average freshman score of 1062 corresponds to the Basic Mastery Level. Slightly more than half (59%) of the college freshmen who tested in fall 2016 did not demonstrate proficient mastery of CLA+ skills—scoring at or below the Basic Mastery Level. Another 26% scored at the Proficient Mastery Level, 13% scored at the Accomplished Mastery Level, and 1% of entering freshmen scored at the Advanced Mastery Level. The average senior score of 1110 corresponds to the Proficient Mastery Level. Across college seniors testing in 2016-17, more than half (55%) were at least proficient in CLA+ skills—scoring at the Proficient (32%), Accomplished (20%), or Advanced (3%) Mastery Levels. A total of 30% scored at the Basic Mastery Level, while 16% were unable to demonstrate even basic mastery of CLA+ skills.
CLA+ NATIONAL RESULTS, 2016-17
9
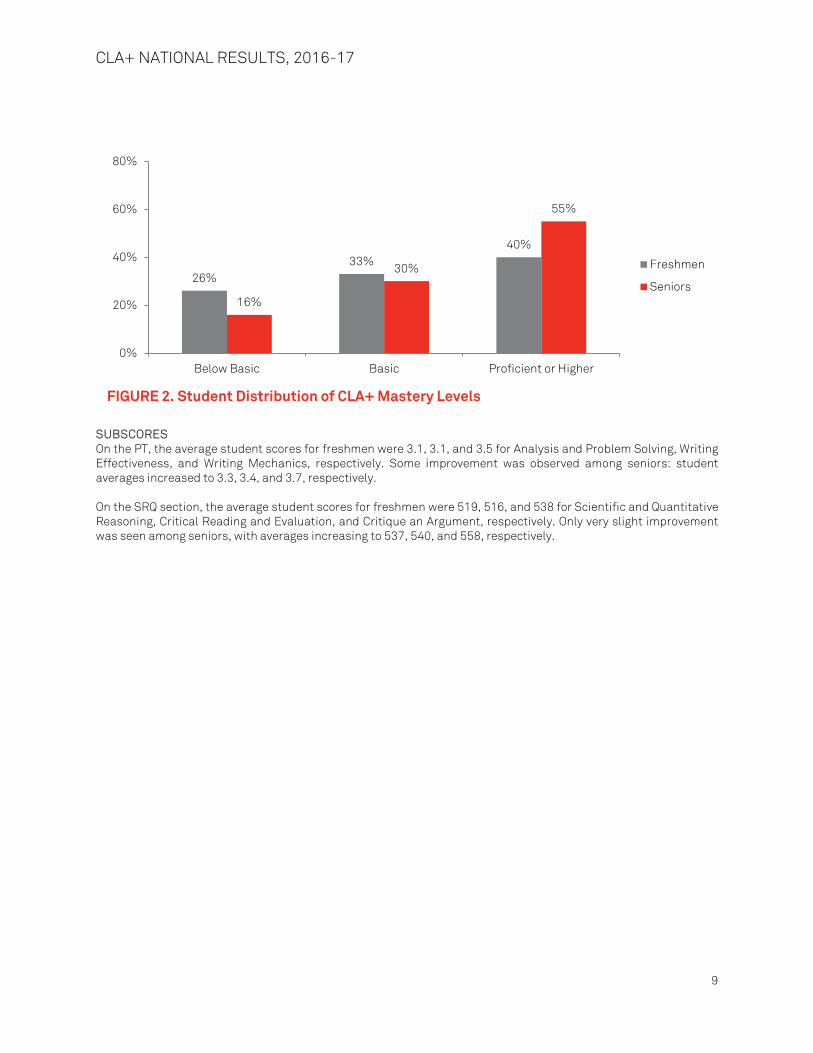
SUBSCORES On the PT, the average student scores for freshmen were 3.1, 3.1, and 3.5 for Analysis and Problem Solving, Writing Effectiveness, and Writing Mechanics, respectively. Some improvement was observed among seniors: student averages increased to 3.3, 3.4, and 3.7, respectively. On the SRQ section, the average student scores for freshmen were 519, 516, and 538 for Scientific and Quantitative Reasoning, Critical Reading and Evaluation, and Critique an Argument, respectively. Only very slight improvement was seen among seniors, with averages increasing to 537, 540, and 558, respectively.
26% 33%
40%
16%
30%
55%
0%
20%
40%
60%
80%
Below Basic Basic Proficient or Higher
FIGURE 2. Student Distribution of CLA+ Mastery Levels
Freshmen
Seniors
CLA+ NATIONAL RESULTS, 2016-17
10
GROWTH ESTIMATES The average effect size for freshman-to-senior growth across all CLA+ institutions in 2016-17 was 0.48, representing almost half a standard deviation of improvement relative to freshman scores. Only 5% of schools showed negative growth (freshmen outperforming seniors), while 8% of schools showed growth larger than one standard deviation, which is a substantial improvement in performance (see Figure 4). As noted in the methodology section of this report, value-added scores meaningfully relate the growth within an institution to the growth of students across similar colleges and universities. Figure 5 illustrates the observed and expected performance of all CLA+ institutions. The diagonal line in the figure represents the points at which expected and observed senior mean scores are equivalent. The vertical distance from the diagonal line indicates the value added by an institution. Institutions above the diagonal line add more value than expected based on the model; institutions below the line add less value than expected. Value-added scores can be categorized into levels of performance relative to expectations. These levels are as follows:
• above 2.00: well above expected • 2.00 to 1.00: above expected • 1.00 to -1.00: near expected • -1.00 to -2.00: below expected • below -2.00: well below expected
519 516 538 537 540 558
200
300
400
500
600
700
800
Scientific &Quantitative Reasoning
Critical Reading& Evaluation
Critique an Argument
ME
AN
SU
BS
CO
RE
VA
LUE
SELECTED-RESPONSE QUESTIONS
3.1 3.1 3.5 3.3 3.4
3.7
1
2
3
4
5
6
Analysis &Problem Solving
WritingEffectiveness
WritingMechanics
ME
AN
SU
BS
CO
RE
VA
LUE
PERFORMANCE TASK
Freshmen Seniors
FIGURE 3. Average CLA+ Subscores across Institutions

CLA+ NATIONAL RESULTS, 2016-17
11
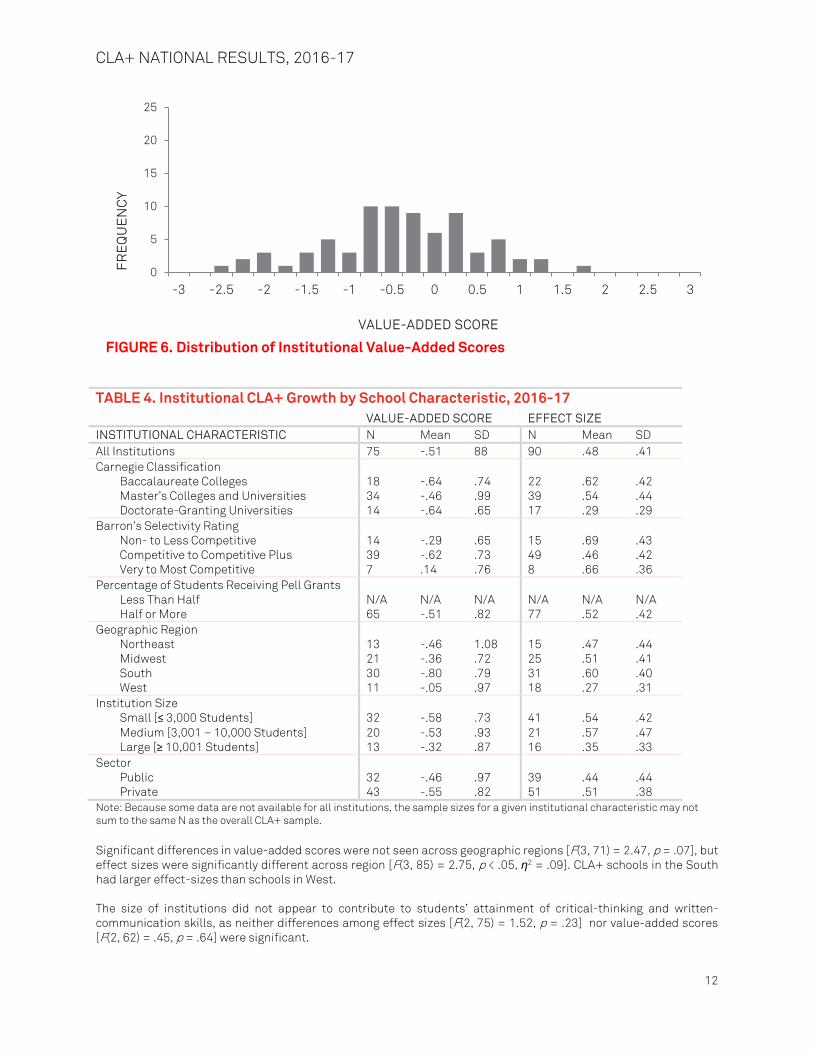
As in the case of actual CLA+ scores, both of these growth estimates—effect sizes and value-added scores—differ, in some cases to a large degree, across various types of institutions. Table 4 provides average value-added scores and effect sizes across the CLA+ institutional sample, as well as for specific categories of institutions.
Differences across the mean effect sizes of the three primary Carnegie Classifications were significant yet small [F(2, 75) = 3.33, p < .05, η2 = .08], with Doctorate-Granting Universities significantly underperforming Baccalaureate Colleges. Differences in value-added scores, however, were insignificant [F(2, 63) = 0.35, p = .71]. Differences between Barron’s selectivity ratings for effect sizes were not statistically significant [F(2, 69) = 2.21, p = .12], and they were marginally significant for value-added scores [F(2, 57) = 3.81, p < .05, η2 = .12].
0
5
10
15
20
25
-1 -0.5 0 0.5 1 1.5 2 2.5 3 3.5 4 4.5
FR
EQ
UE
NC
Y
EFFECT SIZE
FIGURE 4. Distribution of Institutional Effect Sizes
800
900
1000
1100
1200
1300
1400
800 900 1000 1100 1200 1300 1400
OB
SE
RV
ED
SE
NIO
R M
EA
N C
LA+
S
CO
RE
EXPECTED SENIOR MEAN CLA+ SCORE
FIGURE 5. Expected vs. Observed CLA+ Scores
Observed Mean SeniorCLA+ Score
CLA+ NATIONAL RESULTS, 2016-17
12
TABLE 4. Institutional CLA+ Growth by School Characteristic, 2016-17 VALUE-ADDED SCORE EFFECT SIZE INSTITUTIONAL CHARACTERISTIC N Mean SD N Mean SD All Institutions 75 -.51 88 90 .48 .41 Carnegie Classification
Baccalaureate Colleges 18 -.64 .74 22 .62 .42 Master’s Colleges and Universities 34 -.46 .99 39 .54 .44 Doctorate-Granting Universities 14 -.64 .65 17 .29 .29
Barron’s Selectivity Rating Non- to Less Competitive 14 -.29 .65 15 .69 .43 Competitive to Competitive Plus 39 -.62 .73 49 .46 .42 Very to Most Competitive 7 .14 .76 8 .66 .36
Percentage of Students Receiving Pell Grants Less Than Half N/A N/A N/A N/A N/A N/A Half or More 65 -.51 .82 77 .52 .42
Geographic Region Northeast 13 -.46 1.08 15 .47 .44 Midwest 21 -.36 .72 25 .51 .41 South 30 -.80 .79 31 .60 .40 West 11 -.05 .97 18 .27 .31
Institution Size Small [≤ 3,000 Students] 32 -.58 .73 41 .54 .42 Medium [3,001 – 10,000 Students] 20 -.53 .93 21 .57 .47 Large [≥ 10,001 Students] 13 -.32 .87 16 .35 .33
Sector Public 32 -.46 .97 39 .44 .44 Private 43 -.55 .82 51 .51 .38
Note: Because some data are not available for all institutions, the sample sizes for a given institutional characteristic may not sum to the same N as the overall CLA+ sample. Significant differences in value-added scores were not seen across geographic regions [F(3, 71) = 2.47, p = .07], but effect sizes were significantly different across region [F(3, 85) = 2.75, p < .05, η2 = .09]. CLA+ schools in the South had larger effect-sizes than schools in West. The size of institutions did not appear to contribute to students’ attainment of critical-thinking and written-communication skills, as neither differences among effect sizes [F(2, 75) = 1.52, p = .23] nor value-added scores [F(2, 62) = .45, p = .64] were significant.
0
5
10
15
20
25
-3 -2.5 -2 -1.5 -1 -0.5 0 0.5 1 1.5 2 2.5 3
FR
EQ
UE
NC
Y
VALUE-ADDED SCORE
FIGURE 6. Distribution of Institutional Value-Added Scores
CLA+ NATIONAL RESULTS, 2016-17
13
Finally, the institutional sector did not make a difference in terms of either effect size [t(88) = -0.86, p = .39] or value-added scores [t(73) = 0.42, p = .68]. CONCLUSION With ballooning student debt and—following the most recent recession—a higher unemployment rate among recent college graduates than in the labor force overall (Shierholz, Davis et al., 2014), it is easy to dismiss college as an unnecessary cost. What CLA+ data show, however, is that colleges and universities are contributing considerably to the development of key skills that can make graduates stand out in a competitive labor market. College certainly matters; it can narrow achievement gaps across students from different racial/ethnic and socio-economic backgrounds, and it can help students develop and enhance the complex, broadly transferrable skills that are valued by employers across fields and sectors. What CLA+ data likewise show is that where a student goes to college can matter, as well—and that the schools contributing most heavily to their students’ growth in CLA+ skills are not necessarily the schools one would expect. There are clear differences in students’ raw performance on skills measured by the CLA+ and in the growth fostered by schools on these skills. While there is marked variation in performance across schools, the students, on average, enter college with basic critical-thinking and written-communication skills and leave college proficient in these skills. Graduating from college—especially from a college that fosters critical thinking and written communication—can be crucial for long-term career success.

CLA+ NATIONAL RESULTS, 2016-17
14
REFERENCES Arum, R. and J. Roksa (2014). Aspiring adults adrift: Tentative transitions of college graduates. Chicago, IL, The
University of Chicago Press. Carnegie Foundation for the Advancement of Teaching (2012). Carnegie Classifications Data File. Hart Research Associates (2013). It takes more than a major: Employer priorities for college learning and student
success. Washington, DC, Hart Research Associates. Shierholz, H., et al. (2014). The class of 2014: The week economy is idling too many young graduates. Washington,
DC, Economic Policy Institute. Snyder, T. D. and S. A. Dillow (2013). Digest of education statistics. Washington, DC, National Center for Education
Statistics, Institute of Education Sciences, U.S. Department of Education. Steedle, J. T. and M. Bradley (2012). Majors Matter: Differential Performance on a Test of General College
Outcomes. Annual Meeting of the American Educational Research Association. Vancouver, British Columbia.
The Education Trust (2010). College Results Online.

CLA+ NATIONAL RESULTS, 2016-17
15
APPENDIX A: LIST OF PARTICIPATING INSTITUTIONS, 2016-17 The colleges and universities listed below in alphabetical order agreed to be identified as participating schools in 2016-17, and they constitute the institutional sample for CLA+. To view a list of currently participating schools, please visit http://cae.org/images/uploads/pdf/claschoollist.pdf. CLA+ SCHOOLS
Augustana University Aurora University Bethel University Bob Jones University Bowie State University Bowling Green State University Bridgewater College Brigham Young University-Idaho California Polytechnic State University, San Luis Obispo California State Polytechnic University, Pomona California State University, Channel Islands California State University, Monterey Bay, Computer Science and Information Technology California State University, San Bernardino California State University, Stanislaus Carlow University Christopher Newport University Coastal Carolina University Concordia University Texas Culver-Stockton College Embry-Riddle Aeronautical University, Prescott Fayetteville State University Fort Hays State University Gardner-Webb University Hardin-Simmons University Hastings College Illinois College Indiana University of Pennsylvania Kent State University La Sierra University LaGrange College Lake Forest College Loyola Marymount University, College of Business Administration Lynchburg College Malone University Marian University Marshall University McMurry University Miles College Minerva Schools at KGI Mississippi University for Women Montclair State University Morgan State University North Park University Northern Arizona University Notre Dame of Maryland University Nyack College Ouachita Baptist University Presbyterian College Radford University Saginaw Valley State University

CLA+ NATIONAL RESULTS, 2016-17
16
Saint Mary's University of Minnesota Schreiner University Shawnee State University Shippensburg University Southern Connecticut State University Southern New Hampshire University Southwestern University Stockton University SUNY Oswego, School of Business Texas Lutheran University The Citadel The New School, CoPA The New School, Lang The New School, Parsons BBA The New School, Parsons BFA The Sage Colleges The University of Toledo Trinity Christian College Truman State University University of Colorado, Boulder University of Great Falls University of Guam University of Hartford University of Hawaii at Hilo, College of Business and Economics University of Houston University of Missouri-St Louis University of Pittsburgh University of Saint Mary University of Texas at Dallas Ursuline College Warner University Weber State University Western Governors University WGU Indiana WGU Texas WGU Washington Wichita State University Wiley College William Peace University Winston-Salem State University Wisconsin Lutheran College
APPENDIX B: CLA+ MASTERY LEVELS SETTING STANDARDS FOR CLA+ Following the creation of CLA+, a standard-setting study was conducted to establish fair and defensible levels of mastery for the new and improved assessment. This formal study was held at CAE headquarters in New York City on December 12, 2013. A two-step follow-up study was conducted in November 2014 to establish the cut score for the Accomplished student, an additional level of mastery for CLA+. Twelve distinguished panelists, representing a variety of educational and commercial sectors, were invited to participate. The table below lists each panelist. During the initial standard-setting study, panelists defined descriptions of four mastery levels: Below Basic, Basic, Proficient, and Advanced. Panelists returned in November 2014 to define a fifth level of mastery—Accomplished—using the same methods. Their discussions were based on the CLA+ scoring rubric as well as the knowledge, skills, and abilities required to perform well on CLA+. The purpose of this activity was to develop consensus among the judges regarding each mastery level and to create a narrative profile of the knowledge, skills, and abilities necessary for CLA+ students.
CLA+ NATIONAL RESULTS, 2016-17
17
During subsequent rating activities, panelists relied on these consensus profiles to make item performance estimates. Judges broke into three groups of four and each group evaluated characteristics related to one mastery level. The groups then reconvened and reported their findings to the group at large so they could form final consensus on student performance at each of the mastery levels.
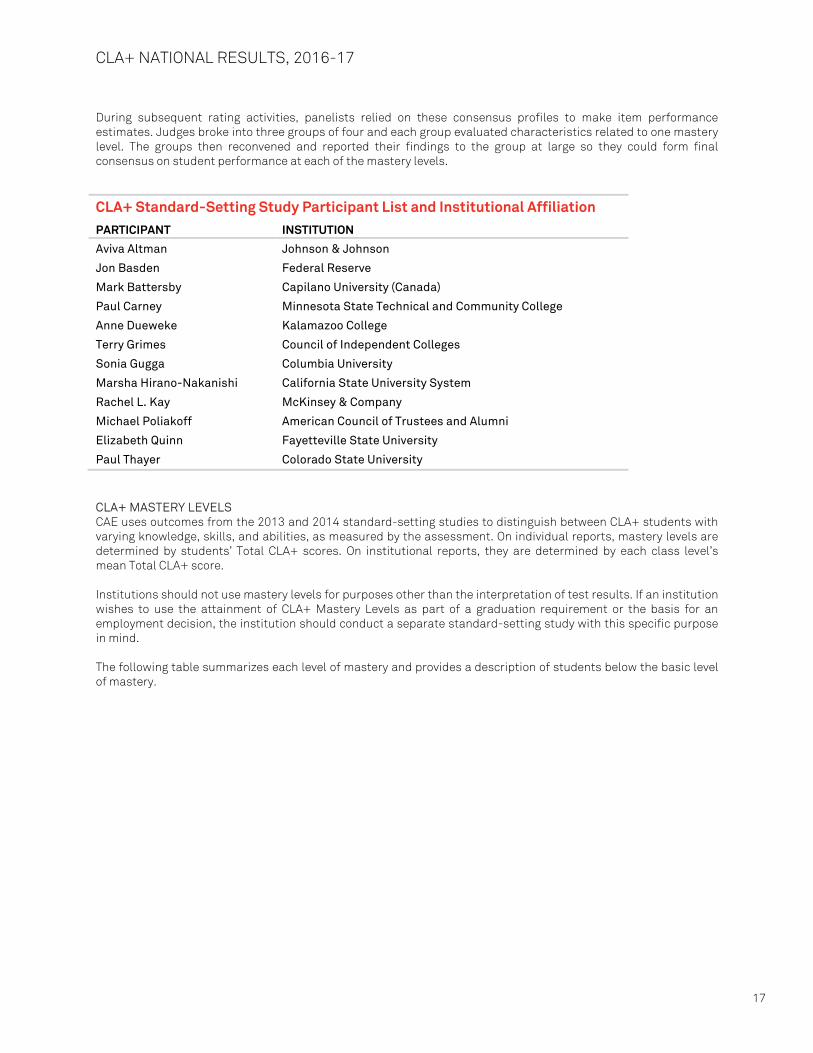
CLA+ Standard-Setting Study Participant List and Institutional Affiliation
PARTICIPANT INSTITUTION
Aviva Altman Johnson & Johnson
Jon Basden Federal Reserve
Mark Battersby Capilano University (Canada)
Paul Carney Minnesota State Technical and Community College
Anne Dueweke Kalamazoo College
Terry Grimes Council of Independent Colleges
Sonia Gugga Columbia University
Marsha Hirano-Nakanishi California State University System
Rachel L. Kay McKinsey & Company
Michael Poliakoff American Council of Trustees and Alumni
Elizabeth Quinn Fayetteville State University
Paul Thayer Colorado State University
CLA+ MASTERY LEVELS CAE uses outcomes from the 2013 and 2014 standard-setting studies to distinguish between CLA+ students with varying knowledge, skills, and abilities, as measured by the assessment. On individual reports, mastery levels are determined by students’ Total CLA+ scores. On institutional reports, they are determined by each class level’s mean Total CLA+ score. Institutions should not use mastery levels for purposes other than the interpretation of test results. If an institution wishes to use the attainment of CLA+ Mastery Levels as part of a graduation requirement or the basis for an employment decision, the institution should conduct a separate standard-setting study with this specific purpose in mind. The following table summarizes each level of mastery and provides a description of students below the basic level of mastery.

CLA+ NATIONAL RESULTS, 2016-17
18
Student Levels of Mastery Profiles
LEVEL OF MASTERY PROFILE BELOW BASIC Students who are below basic do not meet the minimum requirements to merit a
basic level of mastery. BASIC Students at the basic level should be able to demonstrate that they at least read the
documents, made a reasonable attempt at an analysis of the details, and are able to communicate in a manner that is understandable to the reader. Students should also show some judgment about the quality of the evidence. Students at the basic level should also know the difference between correlation and causality. They should be able to read and interpret a bar graph, but not necessarily a scatter plot or comprehend a regression analysis. Tables may be out of reach for basic students as well.
PROFICIENT Students at the proficient level should be able to extract the major relevant pieces of evidence provided in the documents and provide a cohesive argument and analysis of the task. Proficient students should be able to distinguish the quality of the evidence in these documents and express the appropriate level of conviction in their conclusion given the provided evidence. Additionally, students should be able to suggest additional research and/or consider the counterarguments. Proficient students have the ability to correctly identify logical fallacies, accurately interpret quantitative evidence, and distinguish the validity of evidence and its purpose. They should have the ability to determine the truth and validity of an argument. Finally, students should know when a graph or table is applicable to an argument.
ACCOMPLISHED Students at the accomplished level of mastery should be able to analyze the information provided in the documents, extract relevant pieces of evidence, and make correct inferences about this information. Accomplished students should be able to identify bias, evaluate the credibility of the sources, and craft an original and independent argument. When appropriate, students will identify the need for additional research or further investigation. They will refute some but not all of the counterarguments within the documents and use this information to advance their argument. Accomplished students also have the ability to correctly identify logical fallacies, accurately interpret and analyze qualitative and quantitative evidence (e.g., graphs and charts), and incorporate this information into their argument. Students will be able to correctly identify false claims and other sources of invalid information and integrate this information in their responses. Student responses are presented in a cohesive and organized fashion. There may be infrequent or minor errors in writing fluency and mechanics, but they will not detract from the reader’s comprehension of the text.
ADVANCED Students at the advanced level demonstrate consistency, completeness, and show a command of the English language in their response. They have a level of sophistication that is not seen in the proficient or basic levels. Advanced students create and synthesize the provided evidence, are comfortable with ambiguity, are able to structure their thoughts, understand causality, add new ideas, and introduce new concepts in order to create or seek new evidence. They think about conditions and nuances and express finer points and caveats by proposing a conditional conclusion. The students at this level display creativity and synthesis, while understanding the finer points in the documents. For example, advanced students will be able to synthesize the information across multiple documents and address the ambiguities in the data that are presented, such as outliers and knowing how sample size affects outcomes. Advanced students will also be able to identify and highlight gaps in logic and reasoning.
CLA+ NATIONAL RESULTS, 2016-17
19
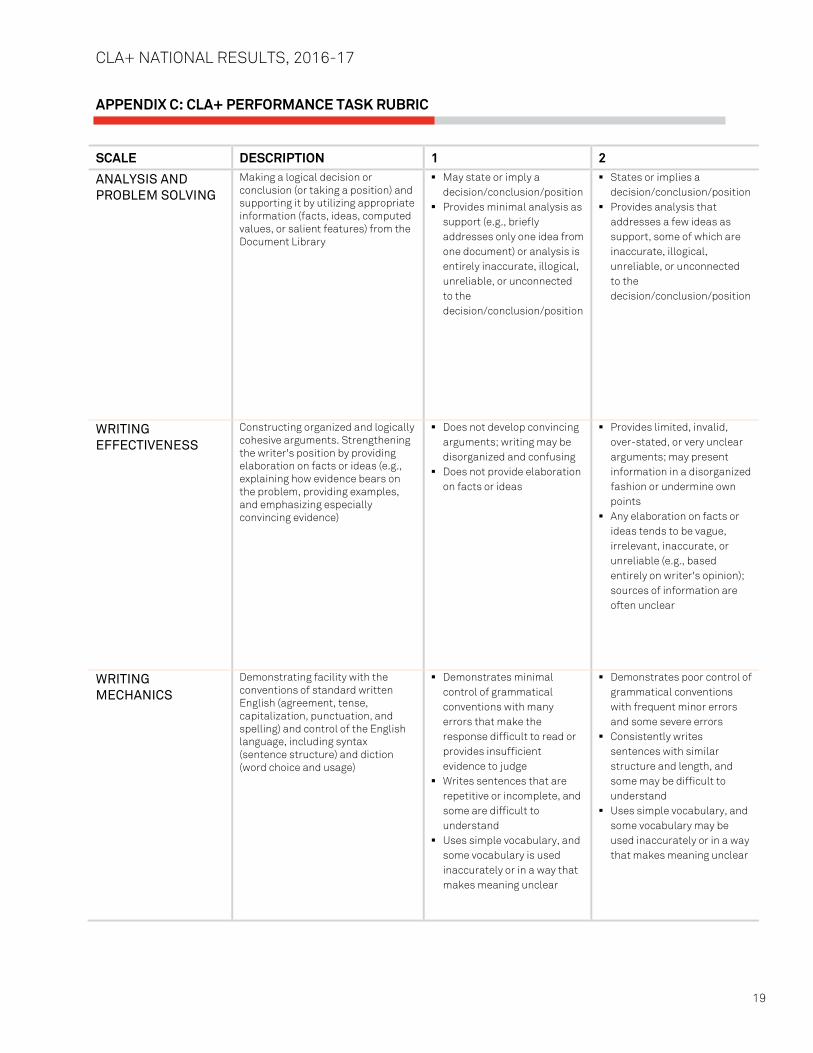
APPENDIX C: CLA+ PERFORMANCE TASK RUBRIC
SCALE DESCRIPTION 1 2
ANALYSIS AND PROBLEM SOLVING
Making a logical decision or conclusion (or taking a position) and supporting it by utilizing appropriate information (facts, ideas, computed values, or salient features) from the Document Library
May state or imply a decision/conclusion/position
Provides minimal analysis as support (e.g., briefly addresses only one idea from one document) or analysis is entirely inaccurate, illogical, unreliable, or unconnected to the decision/conclusion/position
States or implies a decision/conclusion/position
Provides analysis that addresses a few ideas as support, some of which are inaccurate, illogical, unreliable, or unconnected to the decision/conclusion/position
WRITING EFFECTIVENESS
Constructing organized and logically cohesive arguments. Strengthening the writer's position by providing elaboration on facts or ideas (e.g., explaining how evidence bears on the problem, providing examples, and emphasizing especially convincing evidence)
Does not develop convincing arguments; writing may be disorganized and confusing
Does not provide elaboration on facts or ideas
Provides limited, invalid, over-stated, or very unclear arguments; may present information in a disorganized fashion or undermine own points
Any elaboration on facts or ideas tends to be vague, irrelevant, inaccurate, or unreliable (e.g., based entirely on writer's opinion); sources of information are often unclear
WRITING MECHANICS
Demonstrating facility with the conventions of standard written English (agreement, tense, capitalization, punctuation, and spelling) and control of the English language, including syntax (sentence structure) and diction (word choice and usage)
Demonstrates minimal control of grammatical conventions with many errors that make the response difficult to read or provides insufficient evidence to judge
Writes sentences that are repetitive or incomplete, and some are difficult to understand
Uses simple vocabulary, and some vocabulary is used inaccurately or in a way that makes meaning unclear
Demonstrates poor control of grammatical conventions with frequent minor errors and some severe errors
Consistently writes sentences with similar structure and length, and some may be difficult to understand
Uses simple vocabulary, and some vocabulary may be used inaccurately or in a way that makes meaning unclear

CLA+ NATIONAL RESULTS, 2016-17
20
3 4 5 6 States or implies a
decision/conclusion/position Provides some valid support,
but omits or misrepresents critical information, suggesting only superficial analysis and partial comprehension of the documents
May not account for contradictory information (if applicable)
States an explicit decision/conclusion/position
Provides valid support that addresses multiple pieces of relevant and credible information in a manner that demonstrates adequate analysis and comprehension of the documents; some information is omitted
May attempt to address contradictory information or alternative decisions/conclusions/positions (if applicable)
States an explicit decision/conclusion/position
Provides strong support that addresses much of the relevant and credible information, in a manner that demonstrates very good analysis and comprehension of the documents
Refutes contradictory information or alternative decisions/conclusions/positions (if applicable)
States an explicit decision/conclusion/position
Provides comprehensive support, including nearly all the relevant and credible information, in a manner that demonstrates outstanding analysis and comprehension of the documents
Thoroughly refutes contradictory evidence or alternative decisions/conclusions/positions (if applicable)
Provides limited or somewhat unclear arguments. Presents relevant information in each response, but that information is not woven into arguments
Provides elaboration on facts or ideas a few times, some of which is valid; sources of information are sometimes unclear
Organizes response in a way that makes the writer's arguments and logic of those arguments apparent but not obvious
Provides valid elaboration on facts or ideas several times and cites sources of information
Organizes response in a logically cohesive way that makes it fairly easy to follow the writer's arguments
Provides valid elaboration on facts or ideas related to each argument and cites sources of information
Organizes response in a logically cohesive way that makes it very easy to follow the writer's arguments
Provides valid and comprehensive elaboration on facts or ideas related to each argument and clearly cites sources of information
Demonstrates fair control of grammatical conventions with frequent minor errors
Writes sentences that read naturally but tend to have similar structure and length
Uses vocabulary that communicates ideas adequately but lacks variety
Demonstrates good control of grammatical conventions with few errors
Writes well-constructed sentences with some varied structure and length
Uses vocabulary that clearly communicates ideas but lacks variety
Demonstrates very good control of grammatical conventions
Consistently writes well-constructed sentences with varied structure and length
Uses varied and sometimes advanced vocabulary that effectively communicates ideas
Demonstrates outstanding control of grammatical conventions
Consistently writes well-constructed complex sentences with varied structure and length
Displays adept use of vocabulary that is precise, advanced, and varied