national resource center for health and safety in child ...nrckids.org/files/ashw report 2014 final...
TRANSCRIPT

Copyright 2015, National Resource Center for Health and Safety in Child Care and Early Education.
Suggested citation: National Resource Center for Health and Safety in Child Care and Early Education. 2014. Achieving a state of healthy weight: 2014 update. Aurora, CO: University of Colorado Denver.
This project was supported by Grant Number U46MC09810 from the U.S. Department of Health and Human Services, Health Resources and Services Administration, Maternal and Child Health Bureau.
The National Resource Center for Health and Safety in Child Care and Early Education (NRC) is a program of the Healthy Child Care America (HCCA) Cooperative Agreement Program, funded by the Maternal and Child Health Bureau (MCHB), Health Resources and Services Administration, U.S. Department of Health and Human Services. The NRC is operated by the College of Nursing of the University of Colorado, Anschutz Medical Campus, Aurora, Colorado.
National Resource Center for Health and Safety in Child Care and Early Education
ACKNOWLEDGMENTS
NRC Director Marilyn J. Krajicek, EdD, RN, FAAN
Research Associate and NRC Evaluator Geraldine Steinke, PhD
2014 Healthy Weight Project Manager Betty Geer, DNP, RN, CPNP
Co-Rater Linda Satkowiak, ND, RN
Copy Editors Susan Purcell, MA
Lorina Washington, BA Information Technologist
Doug Chapman, BS
MCHB Project Officer Barbara U. Hamilton, MA
Note: The ASHW 2014 Supplement (April 2015) contains additional details
and state specific information.
April 2015
Achieving a State of Healthy Weight 2014 i
`` ASHW 2014 findings are displayed in 4 sections designated above. Click on the arrow to see more details within any section. Also see the Appendix: Source of ASHW Variables in PCO2/CFOC3 Standards at the end of the report.
CHANGES
NATIONAL
5% more regulations fully support healthy weight practices
(2010 vs 2014)
PRACTICE
For the first time, there were no changes made resulting in lower ratings.
6
9
7
Supported by MCHB Grant Number U46MC09810
S T A T E S
Leading states in 2014 remain DE, MS, NC & RI
Most improved ratings were for variables related to infants: ensuring tummy time and
prohibiting feeding juice. 15
6
Introduction to ASHW and Methods
ASHW
1
Achieving a State of Healthy Weight
Table of Contents
Achieving a State of Healthy Weight 2014 1
Early childhood is a critical time for development of healthy habits. Early care and education (ECE) programs contribute to attainment of the national goal of stemming childhood obesity by instituting policies to provide healthy meals, snacks, and exercise.i States may guide ECE providers toward this goal by establishing in their childcare licensing regulations clear expectations about the practices that support children’s achievement and maintenance of healthy weight status.
In 2010, as early childhood obesity was an increasing focus of national attention, the Maternal and Child Health Bureau (MCHB) funded the National Resource Center for Health and Safety in Child Care and Early Education (NRC) to conduct an assessment of obesity prevention content in all states’ licensing regulations for: child care centers, large or group family child care homes, and small family child care homes. Regulations were assessed for text consistent with best practices drawn from selected standards in Caring for Our Children: National Health and Safety Performance Standards; Guidelines for Early Care and Education Programs, 3rd Ed. (CFOC3). More specifically, the standards were those included in the CFOC-based topical collection, Preventing Childhood Obesity in Early Care and Education Programs: Selected Standards from Caring for Our Children: National Health and Safety Performance Standards; Guidelines for Early Care and Education Programs, 3rd Edition (PCO2).ii The detailed report of the study’s methodology and findings was published by the NRC as Achieving a State of Healthy Weight: A National Assessment of Obesity Prevention Terminology in Child Care Regulations 2010, or ASHW 2010.iii
ASHW 2010 is the baseline study against which each state’s newly introduced or revised regulations may be compared to identify improvements or declines in healthy weight practices that states require of licensed childcare programs. National reassessments that examined new and revised regulations followed for 2011, 2012, and 2013. Each ASHW study examines 47 practices (the ASHW variables) that were identified by the NRC’s Healthy Weight Advisory Committee as high in impact upon childhood obesity if fully implemented in early care settings.iv The variables are grouped into practices in three domains: Nutrition, Infant Feeding, and Physical Activity/Screen Time. (See Appendix A. Source of ASHW Variables in PCO2/CFOC3 Standards.) To promote reliable ratings, the NRC scaled each of the 47 variables, and developed instructions specific to the content of each healthy weight practice. The instructions help raters determine whether pertinent regulatory text is:
• fully consistent with the recommended practice, rating = 4
• partially consistent with the recommended practice, rating = 3
• absent (no relevant content), rating = 2 • contradict recommended practice, rating = 1v
Previous Assessments ASHW 2010 (baseline) & ASHW 2011*
In 2010 (when all the states were assessed) and in 2011 (when only Arizona, Arkansas, and North Dakota made pertinent regulatory changes), findings revealed that child care licensing regulations overall did little to support implementation of healthy weight practices, especially for physical activity and screen time.
• 51% of the ratings performed on states’ child care regulations indicated that no, or insufficient, obesity prevention terminology was identified.
• Only 13% of ratings indicated language fully consistent with the 47 healthy weight practices.
• No one type of child care that was assessed—center-based care, large or group family homes, or small family child care homes—was substantially better regulated in terms of obesity prevention.
• States with the strongest regulations were Delaware and Mississippi.
ASHW 2012 In 2012, 12 states enacted new or revised regulations
related to one or more of the 47 variables: California, Colorado, Florida, Iowa, Kansas, Maryland, Nevada, New Mexico, North Carolina, Texas, Washington, and Wyoming. Document ratings revealed that:
• All 12 states made some improvements. ♦ 89% of the changes strengthened obesity
prevention practices in licensing regulations ♦ 11% weakened them
• Washington, North Carolina, Nevada, Wyoming, and Iowa made the greatest numbers of positive changes, although changes within states were few.
Data from the 2012 assessment also included improvements to ratings that accrue to those states that require licensed child care programs to follow the Meals Patterns of the USDA Food and Nutrition Services, Child and Adult Care Food Program (CACFP), which subsidizes programs that serve nutritious meals to low-income individuals. Adherence to the CACFP Meal Patterns is a CFOC3 recommendation that the NRC Healthy Weight Advisors rated high in impact upon obesity prevention. Consequently, the NRC rated the Meal Patterns on the ASHW nutrition and infant feeding variables. States that require adherence to the Meal Patterns receive the ratings assigned to CACFP, although additional state-specific text may raise or lower the ratings from those assigned to the Meal Patterns. In 2012, CACFP made changes that affected two healthy weight practices, yielding higher ratings for states that regulate adherence by licensed childcare to the CACFP guidance:
• 30 states received higher ratings for the practice Serve 1% or skim milk to children 2 and older
• 25 states received higher ratings for the practice Make water available both inside and outside.
ASHW 2012 reflected the improved ratings resulting from the CACFP changes above. In addition, the report

Achieving a State of Healthy Weight 2014 2
included state-initiated changes in newly enacted and revised documents. Together these two sources affected the relative rankings of states, such that:
• Seven states’ regulations (Alaska, Delaware, Florida, Mississippi, North Carolina, North Dakota, and South Dakota) fully supported more than 20% of the healthy weight practices consistently across all three child care types.
• Five states (Arizona, Delaware, Washington, Mississippi, and Virginia) at least partially supported 70% of the practices in at least one child care type.
In 2012, as a result of CACFP and state-initiated changes, NRC identified the first small, but positive, improvements in the regulatory landscape nationally. By 2012 there were 2% fewer ratings indicating no pertinent content. As in prior years, however, there was little improvement in the Physical Activity/Screen Time domain. Thus, as 2013 began, childcare regulations remained an under-developed resource for promoting healthy weight practices in ECE.
ASHW 2013 In 2013, 10 states initiated regulatory changes related
to the ASHW healthy weight practices. The states were: Florida, Kansas, Kentucky, Mississippi, Nebraska, New Jersey, North Carolina, North Dakota, Rhode Island and Wyoming. The net impact of their changes was a 14% improvement in regulations at least partially addressing the practices for the care types licensed by those states. Nationally, the result was a 4% rise in ratings indicative of regulations that fully support healthy weight practices. Of the four leading states nationally, three states–Mississippi, North Carolina and Rhode Island–initiated regulatory changes in 2013. Furthermore, these three states, along with North Dakota, are the most improved since the 2010 baseline assessment.
Two states, Florida and South Dakota, lost some ground in 2013. In a process similar to that NRC used for the CACFP Meal Patterns, in 2010, MyPyramid (a food-guidance resource in the first edition of PCO) was rated for its content on nutrition and physical activity. Florida and South Dakota were assigned these ratings in 2010 as they required licensed child care providers to adhere to the MyPyramid guidance. However, MyPyramid was retired by the USDA in 2011. The two states did not alter their regulations to address the void in the ensuing years, so the baseline scores for Florida and South Dakota were lowered in ASHW 2013 to reflect the absence of content on the variables formerly associated with MyPyramid.
To simplify the presentation of findings in ASHW 2013, the NRC introduced a weighted summary score that facilitated comparisons among states and among
variables. The measure is the Childcare Obesity Prevention Regulation Score, or COPR Score, and is used again in the 2014 update. (Computation of the COPR Score is elaborated below in the Method section.)
METHOD The study methodology, as developed in 2010 and
used in ASHW 2014, includes the following essential steps: 1. Identification of new and revised documents.
Documents are identified through phone/email contact with all states’ licensing agencies and monitoring of states’ child care licensing websites.
2. Screening of documents for content pertinent to obesity prevention. New documents were screened for key search terms related to the study variables. Revised documents were compared with the version examined for ASHW 2010, using Adobe® Acrobat® X Pro. Revised documents then were searched for terminology related to healthy weight practices, using advanced Boolean search methods in Adobe® Reader® X.
3. Re-training of an experienced rater dyad for high inter-rater reliability. In 2014, the raters maintained extremely high inter-rater reliability, as in all previous assessments (rs >.90).
4. Rating of pertinent documents and data entry. Two raters independently rated each document on the 47 variables and entered ratings into NRC’s ASHW database (in Microsoft ACCESS).
5. Resolution of discrepant ratings. The text each rater recorded as the basis for the numerical rating was reviewed by the raters with the NRC Evaluator to resolve differences in assigned values.
6. Establishment of “final ratings.” A single score for each variable was assigned in cases where multiple documents regulate a given care type in a state (see ASHW 2010).
7. Data analysis and exportation to Excel (for further analysis and generation of charts and graphics).
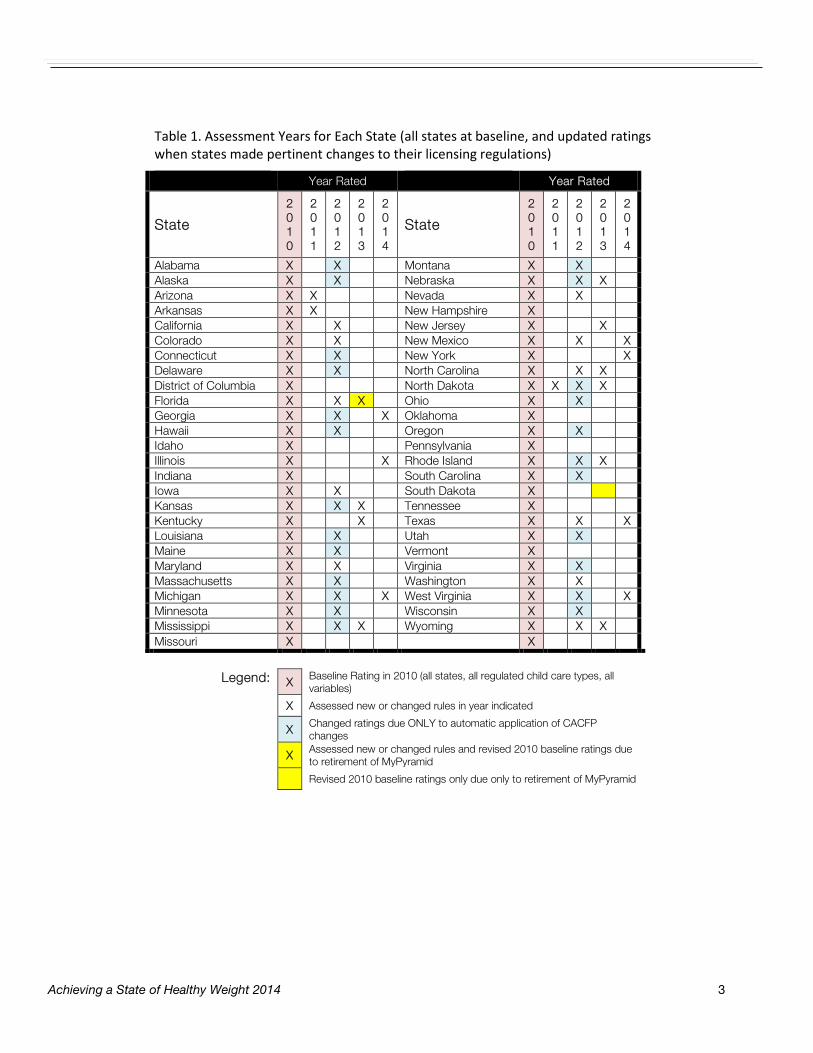
Table 1 below provides a quick view of which states were rated in each year of ASHW assessments 2010-2014. All states were rated in 2010, and subsequently when new content related to healthy weight practices was discovered in states’ new and revised rules. Seven states made regulatory changes that were rated for the current assessment. (Additional adjustments were made as described earlier for CACFP changes and retirement of MyPyramid.)
Achieving a State of Healthy Weight 2014 3
Table 1. Assessment Years for Each State (all states at baseline, and updated ratings when states made pertinent changes to their licensing regulations)
Year Rated Year Rated
State
2010
2 0 1 1
2 0 1 2
2 0 1 3
2 0 1 4
State
2010
2 0 1 1
2 0 1 2
2 0 1 3
2 0 1 4
Alabama X
X
Montana X
X
Alaska X
X
Nebraska X
X X
Arizona X X Nevada X X Arkansas X X New Hampshire X California X X New Jersey X X Colorado X X New Mexico X X X Connecticut X
X
New York X
X
Delaware X
X
North Carolina X
X X
District of Columbia X North Dakota X X X X Florida X X X Ohio X X Georgia X X X Oklahoma X Hawaii X X Oregon X X Idaho X
Pennsylvania X
Illinois X
X Rhode Island X
X X
Indiana X South Carolina X X Iowa X X South Dakota X Kansas X X X Tennessee X Kentucky X X Texas X X X Louisiana X
X
Utah X
X
Maine X
X
Vermont X
Maryland X X Virginia X X Massachusetts X X Washington X X Michigan X X X West Virginia X X X Minnesota X X Wisconsin X X Mississippi X
X X
Wyoming X
X X
Missouri X X
Legend: X Baseline Rating in 2010 (all states, all regulated child care types, all
variables)
X Assessed new or changed rules in year indicated
X Changed ratings due ONLY to automatic application of CACFP changes
X Assessed new or changed rules and revised 2010 baseline ratings due to retirement of MyPyramid
Revised 2010 baseline ratings only due only to retirement of MyPyramid
Achieving a State of Healthy Weight 2014 4
Calculation of Childcare Obesity Prevention Regulation Scores (COPR Scores)
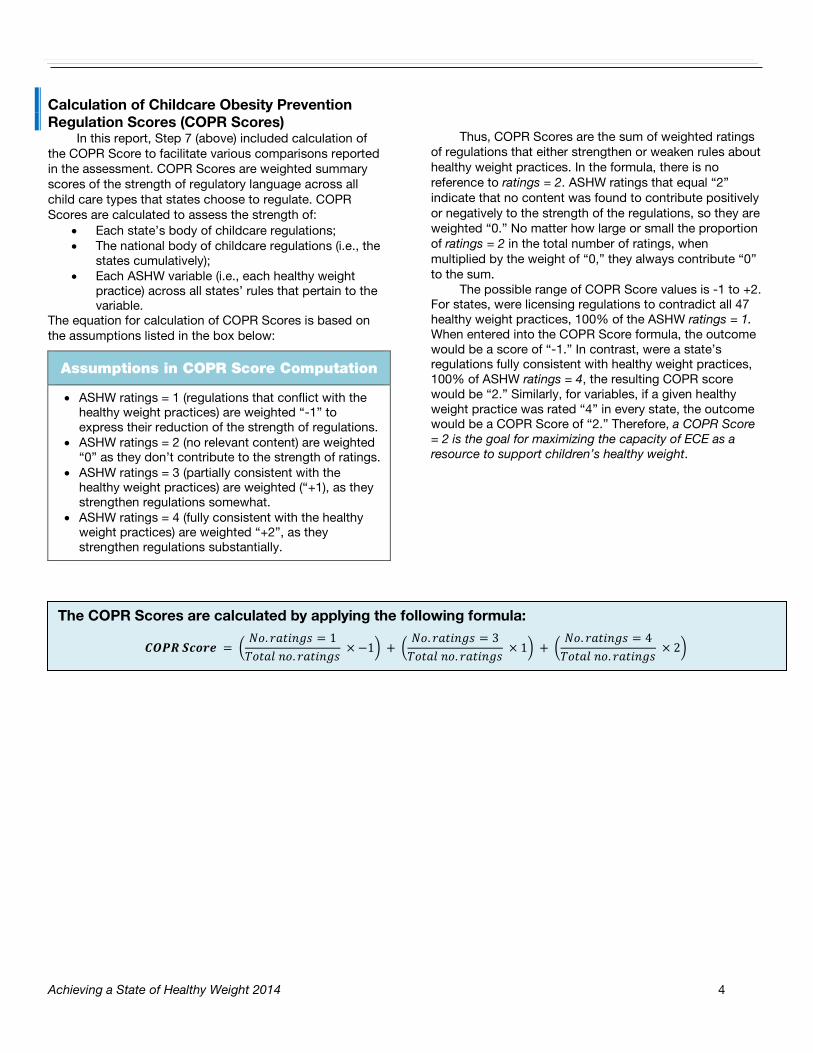
In this report, Step 7 (above) included calculation of the COPR Score to facilitate various comparisons reported in the assessment. COPR Scores are weighted summary scores of the strength of regulatory language across all child care types that states choose to regulate. COPR Scores are calculated to assess the strength of:
• Each state’s body of childcare regulations; • The national body of childcare regulations (i.e., the
states cumulatively); • Each ASHW variable (i.e., each healthy weight
practice) across all states’ rules that pertain to the variable.
The equation for calculation of COPR Scores is based on the assumptions listed in the box below:
Thus, COPR Scores are the sum of weighted ratings of regulations that either strengthen or weaken rules about healthy weight practices. In the formula, there is no reference to ratings = 2. ASHW ratings that equal “2” indicate that no content was found to contribute positively or negatively to the strength of the regulations, so they are weighted “0.” No matter how large or small the proportion of ratings = 2 in the total number of ratings, when multiplied by the weight of “0,” they always contribute “0” to the sum.
The possible range of COPR Score values is -1 to +2. For states, were licensing regulations to contradict all 47 healthy weight practices, 100% of the ASHW ratings = 1. When entered into the COPR Score formula, the outcome would be a score of “-1.” In contrast, were a state’s regulations fully consistent with healthy weight practices, 100% of ASHW ratings = 4, the resulting COPR score would be “2.” Similarly, for variables, if a given healthy weight practice was rated “4” in every state, the outcome would be a COPR Score of “2.” Therefore, a COPR Score = 2 is the goal for maximizing the capacity of ECE as a resource to support children’s healthy weight.
Assumptions in COPR Score Computation
• ASHW ratings = 1 (regulations that conflict with the healthy weight practices) are weighted “-1” to express their reduction of the strength of regulations.
• ASHW ratings = 2 (no relevant content) are weighted “0” as they don’t contribute to the strength of ratings.
• ASHW ratings = 3 (partially consistent with the healthy weight practices) are weighted (“+1), as they strengthen regulations somewhat.
• ASHW ratings = 4 (fully consistent with the healthy weight practices) are weighted “+2”, as they strengthen regulations substantially.
𝑪𝑪𝑪𝑪 𝑺𝑺𝑺𝑺𝑺 = �𝑁𝑁. 𝑟𝑟𝑟𝑟𝑟𝑟𝑟 = 1𝑇𝑁𝑟𝑟𝑇 𝑟𝑁. 𝑟𝑟𝑟𝑟𝑟𝑟𝑟
× −1� + �𝑁𝑁. 𝑟𝑟𝑟𝑟𝑟𝑟𝑟 = 3𝑇𝑁𝑟𝑟𝑇 𝑟𝑁. 𝑟𝑟𝑟𝑟𝑟𝑟𝑟
× 1� + �𝑁𝑁. 𝑟𝑟𝑟𝑟𝑟𝑟𝑟 = 4𝑇𝑁𝑟𝑟𝑇 𝑟𝑁. 𝑟𝑟𝑟𝑟𝑟𝑟𝑟
× 2�
The COPR Scores are calculated by applying the following formula:

Achieving a State of Healthy Weight 2014 5
2014 Notable Findings In 2014, seven states made changes in their
regulations that were pertinent to ASHW. Some notable findings bear mentioning. Illinois, New York, and Texas made sufficient positive changes to significantly improve their rules affecting healthy weight practices. Furthermore, Illinois and Texas made the greatest number of changes, which markedly improved their standing among all states (refer to the chart on page 11, COPR Scores: 2014 Status).
New Mexico’s cumulative changes over the past two years yielded impressive gains in healthy weight language (refer to the map States Best Meeting Standards 2014 on page 13).
For the first time in these reassessments, no state enacted a regulation that contradicted an ASHW healthy weight practice. In fact, there were no instances at all of states introducing changes that lowered their ratings.
NOTES: iFriedman-Krauss, A & Barnett, W. S. (2013) Early childhood education: Pathways to better health. NIEER Preschool Policy Brief. 25. Retrieved from
http://www.nieer.org/sites/nieer/files/health%20brief.pdf
ii NRC co-publishes both CFOC3 and PCO2 with American Academy of Pediatrics, American Public Health Association: American Academy of Pediatrics, American Public Health Association, National Resource Center for Health and Safety in Child Care and Early
Education. 2011. Caring for our children: National health and safety performance standards; Guidelines for early care and education programs. 3rd edition. Elk Grove Village, IL: American Academy of Pediatrics; Washington, DC: American Public Health Association. Also available @ http://nrckids.org.
American Academy of Pediatrics, American Public Health Association, and National Resource Center for Health and Safety in Child Care and Early Education. 2012. Preventing childhood obesity in early care and education: Selected standards from caring for our children: National health and safety performance standards; Guidelines for early care and education programs, 3rd Edition. http://nrckids.org/CFOC3/PDFVersion/preventing_obesity.pdf
iii National Resource Center for Health and Safety in Child Care and Early Education. 2011. Achieving a state of healthy weight: A national assessment of obesity prevention terminology in child care regulations 2010. Aurora, CO. http://nrckids.org/default/assets/File/Products/ASHW/regulations_report_2010.pdf National Resource Center for Health and Safety in Child Care and Early Education. 2012. Achieving a state of healthy weight: 2011 update. Aurora, CO: University of Colorado Denver. http://nrckids.org/default/assets/File/Products/ASHW/ASHW%202011-Final-8-1.pdf National Resource Center for Health and Safety in Child Care and Early Education. 2013. Achieving a state of healthy weight: 2012 update. Aurora, CO: University of Colorado Denver. http://nrckids.org/default/assets/File/Products/ASHW/ASHW%202012%20Final%20Report%209-18-13%20reduced%20size.pdf National Resource Center for Health and Safety in Child Care and Early Education. 2014. Achieving a state of healthy weight: 2013 update. Aurora, CO: University of Colorado Denver. http://nrckids.org/default/assets/File/Products/ASHW/ASHW%20Report%202013%20final.pdf
iv In July 2010, the NRC Healthy Weight Advisory Meeting was convened in Aurora, Colorado, supported by the DHHS, Maternal and Child Health Bureau (MCHB) and the Administration for Children and Families, Child Care Bureau (CCB, now Office of Child Care) to inform plans for use of the healthy weight recommendations in Preventing Childhood Obesity (PCO). Advisors were selected in collaboration with MCHB and CCB officers to include experts in a range of health and academic disciplines, government agencies, and professional organizations, as well as child care providers and licensing professionals (see ASHW 2010 for the list of Advisors). A goal of the meeting was to identify PCO/CFOC standards most likely to have a direct impact on obesity in child care. NRC staff extracted 275 healthy weight practices from the 49 PCO/CFOC standards so that their independent contributions to obesity prevention could be evaluated. The advisors’ ratings of the practices helped inform selection of ASHW variables, as described in ASHW 2010.
v The complete set of ASHW rating scales and instructions are available at the NRC website: National Resource Center for Health and Safety in Child Care and Early Education. 2013. Achieving a state of healthy weight rating scales: Supporting obesity prevention language in child care licensing regulations. Aurora, CO: University of Colorado, Anschutz Medical Campus. http://nrckids.org/default/assets/File/ASHW%20Rating%20Scales%20final.pdf

Achieving a State of Healthy Weight 2014 6
*Baseline ratings were for the year 2010.
National Results
(total pool of ratings of regulations across all states and all child care types they regulate)
Contradicted 4%
Not Addressed
46% Partially
Met 33%
Fully Met 17%
2014
Contradicted 4%
Not Addressed
52%
Partially Met 32%
Fully Met 12%
Baseline*
National Picture Changes in Composition of Ratings from Baseline to 2014 for All
Variables across All Child Care Types and All States
14%
17%
18%
31%
34%
33%
51%
45%
45%
3%
4%
4%
Small Family
Large Family
Centers
Composition of Ratings Nationally By Child Care Type
Fully Met Partially MetNot Addressed Contradicted
In the Baseline and 2014 pie charts, the shift in the proportion of red (variables not addressed) to more purple and green is a positive indicator.

Achieving a State of Healthy Weight 2014 7
States reassessed in 2014: GEORGIA ILLINOIS
MICHIGAN NEW MEXICO
NEW YORK TEXAS
WEST VIRGINIA
States that made changes in 2014
* Baseline ratings were for the year 2010.
Contradicted 4%
Not Addressed
39% Partially Met
36%
Fully Met 21%
2014
Contradicted 4%
Not Addressed
45% Partially Met 38%
Fully Met 13%
Baseline*
Composition of Ratings Comparing Baseline to 2014
(only states that revised regulations)

Achieving a State of Healthy Weight 2014 8
2014 At-A-Glance This table shows practice rules that were improved in states that made 2014 changes
for each care type (C=center, L=large family, S=Small family).
Achieving a State of Healthy Weight 2014 9
WYOMINGWISCONSIN
WEST VIRGINIAWASHINGTON
VIRGINIAVERMONT
UTAHTEXAS
TENNESSEESOUTH DAKOTA
*SOUTH CAROLINARHODE ISLANDPENNSYLVANIA
OREGONOKLAHOMA
OHIONORTH DAKOTA
NORTH CAROLINANEW YORK
NEW MEXICONEW JERSEY
NEW HAMPSHIRENEVADA
NEBRASKAMONTANAMISSOURI
MISSISSIPPIMINNESOTA
MICHIGANMASSACHUSETTS
MARYLANDMAINE
*LOUISIANAKENTUCKY
KANSASIOWA
INDIANAILLINOIS
IDAHOHAWAII
GEORGIAFLORIDA
DISTRICT OF COLUMBIADELAWARE
CONNECTICUTCOLORADO
*CALIFORNIAARKANSAS
ARIZONAALASKA
ALABAMANATIONAL
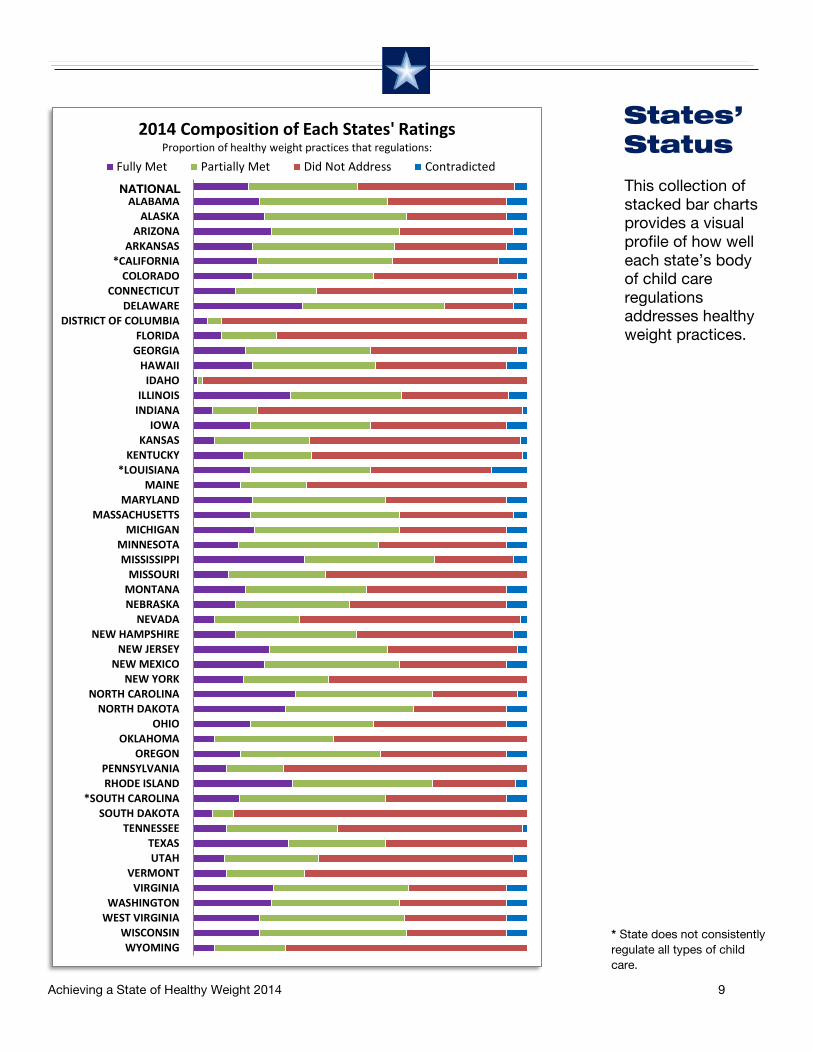
2014 Composition of Each States' Ratings Proportion of healthy weight practices that regulations:
Fully Met Partially Met Did Not Address ContradictedThis collection of stacked bar charts provides a visual profile of how well each state’s body of child care regulations addresses healthy weight practices.
States’ Status
* State does not consistently regulate all types of child care.
NATIONAL

Achieving a State of Healthy Weight 2014 10
0.34 0.77 0.77 0.79
0.82 0.43 0.43
0.86 0.52
0.18 0.65
0.98 0.37
0.64 0.48
0.65 0.87
0.99 0.55
0.77 0.78
0.57 0.36
0.53 0.61
0.50 1.01
0.62 0.74 0.74
0.69 0.48
0.60 0.49
0.39 0.64
0.23 0.86
0.04 0.66 0.66
0.33 1.04
0.13 0.45
0.69 0.70 0.72
0.81 0.79
0.72 0.62
0.00 0.50 1.00 1.50 2.00
WYOMINGWISCONSIN
WEST VIRGINIAWASHINGTON
VIRGINIAVERMONT
UTAHTEXAS
TENNESSEESOUTH DAKOTA
*SOUTH CAROLINARHODE ISLANDPENNSYLVANIA
OREGONOKLAHOMA
OHIONORTH DAKOTA
NORTH CAROLINANEW YORK
NEW MEXICONEW JERSEY
NEW HAMPSHIRENEVADA
NEBRASKAMONTANAMISSOURI
MISSISSIPPIMINNESOTA
MICHIGANMASSACHUSETTS
MARYLANDMAINE
*LOUISIANAKENTUCKY
KANSASIOWA
INDIANAILLINOIS
IDAHOHAWAII
GEORGIAFLORIDA
DELAWARE*D.C.
CONNECTICUTCOLORADO
CALIFORNIAARKANSAS
ARIZONAALASKA
ALABAMANATIONAL
COPR Scores by State: Baseline (2010) and 2014 2010 Score2014 Score
* State does not consistently regulate all types of child
The COPR Score is a weighted summary score of the strength of regulations promoting healthy weight practices. The closer the COPR Score is to a value of “2,” the stronger the regulatory language. (See Method, Calculation of Childcare Obesity Prevention Regulation Scores.)
GOAL

Achieving a State of Healthy Weight 2014 11
0.04 0.13
0.18 0.23
0.33 0.34 0.36 0.37 0.39
0.43 0.43 0.45
0.48 0.48 0.49 0.50 0.52 0.53 0.55 0.57 0.60 0.61 0.62 0.62 0.64 0.64 0.65 0.65 0.66 0.66
0.69 0.69 0.70 0.72 0.72 0.74 0.74 0.77 0.77 0.77 0.78 0.79 0.79 0.81 0.82
0.86 0.86 0.87
0.98 0.99 1.01 1.04
0.00 0.50 1.00
IDAHO*D.C.
SOUTH DAKOTAINDIANAFLORIDA
WYOMINGNEVADA
PENNSYLVANIAKANSAS
UTAHVERMONT
CONNECTICUTOKLAHOMA
MAINEKENTUCKYMISSOURI
TENNESSEENEBRASKANEW YORK
NEW HAMPSHIRE*LOUISIANA
MONTANANATIONAL
MINNESOTAOREGON
IOWAOHIO
*SOUTH CAROLINAHAWAII
GEORGIAMARYLANDCOLORADO
CALIFORNIAARKANSASALABAMAMICHIGAN
MASSACHUSETTSWEST VIRGINIA
NEW MEXICOWISCONSIN
NEW JERSEYWASHINGTON
ALASKAARIZONAVIRGINIAILLINOIS
TEXASNORTH DAKOTA
RHODE ISLANDNORTH CAROLINA
MISSISSIPPIDELAWARE
COPR Scores: 2014 Status (Highest to Lowest) (States with 2014 changes in lighter color)
The closer the COPR Score is to a value of “2,” the stronger the regulatory language. (See Method, Calculation of Childcare Obesity Prevention Regulation Scores.)
Note: Maximum of 2.00 not shown on this chart.
* State does not consistently regulate all types of child care.

Achieving a State of Healthy Weight 2014 12
0.11 0.06
0.09 0.15
0.23 0.00
0.04 0.20
0.00 0.00
0.04 0.36
0.00 0.07
0.00 0.04
0.48 0.30
0.19 0.09
0.43 0.00
0.06 0.25
0.06 0.00
0.05 0.06
0.11 0.06
0.09 0.07
0.04 0.16
0.09 0.12
0.00 0.18
0.00 0.06
0.09 0.13
0.07 0.00
0.03 0.06
0.13 0.13
0.04 0.09 0.08 0.08
0.00 0.50 1.00
WYOMINGWISCONSIN
WEST VIRGINIAWASHINGTON
VIRGINIAVERMONT
UTAHTEXAS
TENNESSEESOUTH DAKOTA
*SOUTH CAROLINARHODE ISLANDPENNSYLVANIA
OREGONOKLAHOMA
OHIONORTH DAKOTA
NORTH CAROLINANEW YORK
NEW MEXICONEW JERSEY
NEW HAMPSHIRENEVADA
NEBRASKAMONTANAMISSOURI
MISSISSIPPIMINNESOTA
MICHIGANMASSACHUSETTS
MARYLANDMAINE
*LOUISIANAKENTUCKY
KANSASIOWA
INDIANAILLINOIS
IDAHOHAWAII
GEORGIAFLORIDA
DELAWARE*D. C.
CONNECTICUTCOLORADO
CALIFORNIAARKANSAS
ARIZONAALASKA
ALABAMANATIONAL
COPR Score Changes Since Baseline
* State does not consistently regulate all types of child care.
Note: Maximum of 2.00 not shown on this chart.

Achieving a State of Healthy Weight 2014 13

Achieving a State of Healthy Weight 2014 14
States with the least obesity prevention language in their regulations

Achieving a State of Healthy Weight 2014 15
ID2ID3
NG2PA2PB4NA1PA4NE1NE2PA3NG1ID1
NC2PD1NA4PB3PE1PB2PE2PB1
CompositeIC3IC2
NF2NA3NH1IA1
PA5PC3IB2
NB1NA2PC2NC4NC3IC1
NB2NB3NH2PC1IB3
NA5IA2
NC1IB1
NF1ND1PA1
Composition of Ratings of Individual Practices 2014 (Highest to Lowest)
Fully Met Paratially Met Not Addressed Contradicted
This collection of stacked bar charts provides a visual profile of how well each healthy weight practice is addressed across all states and child care types.
Healthy Weight Practice Results Practice Description
Space for active play Make water available Appropriate servings Feed infants on cue 100% juice No cow’s milk < 1yr Low fat milk > 2 y/o Hold infant to feed Outdoor play occasions Food no reward/punish Variety of whole fruit Variety of vegetables Plan solid introduction Juice 4-6 oz. 1-6 y/o Juice 8-12 oz. 7+ y/o Toddler play time Low fat meat/proteins Whole grains Stop feed @ satiety Preschool play time Don’t withhold play Support breastfeeding Food no force/bribe Low fat milk equivalents Healthy seconds Intro solids @ 4-6 mo Iron-Fort @ 4-6 mo Composite No screen time < 2 yr Limit time infant equip. Screen time 30 min/wk Tummy time often Screen time purpose Whole milk 1-2 y/o Structured play Juice only @ meals Don’t mix formula Limit salt Write activity policies Eat with children Teach portion sizes Play with children Limit oils/fats No TV w/meals Training on activities Avoid sugary foods No juice < 12 mo Whole fruit 7 m-1 yr
(treatment of healthy weight practices across all states)

Achieving a State of Healthy Weight 2014 16
0.06 0.07 0.08 0.08
0.13 0.14 0.14 0.15 0.16 0.16
0.24 0.28
0.37 0.40 0.42 0.43
0.54 0.62 0.62
0.69 0.69 0.69 0.69
0.73 0.73 0.73 0.74 0.75
0.79 0.82 0.82 0.83 0.84
0.87 0.99
1.04 1.05
1.08 1.19 1.19
1.39 1.46
1.59 1.60
1.80
0.00 0.50 1.00 1.50 2.00
ID2ID3
NG2PA2PB4NA1PA4NE1NE2PA3NG1ID1
NC2PD1NA4PB3PE1PB2PE2PB1
CompositeIC3IC2
NF2NA3NH1IA1
PA5PC3IB2
NB1NA2PC2NC4NC3IC1
NB2NB3NH2PC1IB3
NA5IA2
NC1IB1
NF1ND1PA1
COPR Scores: 2014 Status of Individual Practices (Highest to Lowest)
The closer the COPR Score is to a value of “2,” the stronger the regulatory language. (See Method, Calculation of Childcare Obesity Prevention Regulation Scores.)
Childcare Obesity Prevention Practices
Quick Reference Chart
IA1 Support breastfeeding IA2 No cow’s milk < 1yr IB1 Feed infants on cue IB2 Stop feed @ satiety IB3 Hold infant to feed IC1 Plan solid introduction IC2 Intro solids @ 4-6 mo IC3 Iron-Fort @ 4-6 mo ID1 Don’t mix formula ID2 Whole fruit 7 m-1 yr ID3 No juice < 12 mo NA1 Limit oils/fats NA2 Low fat meat/proteins NA3 Low fat milk equivalents NA4 Whole milk 1-2 y/o NA5 Low fat milk > 2 y/o NB1 Whole grains NB2 Variety of vegetables NB3 Variety of whole fruit NC1 100% juice NC2 Juice only @ meals NC3 Juice 4-6 oz. 1-6 y/o NC4 Juice 8-12 oz. 7+ y/o ND1 Make water available NE1 Teach portion sizes NE2 Eat with children NF1 Appropriate servings NF2 Healthy seconds NG1 Limit salt NG2 Avoid sugary foods NH1 Food no force/bribe NH2 Food no reward/punish PA1 Space for active play PA2 Training on activities PA3 Write activity policies PA4 Play with children PA5 Don’t withhold play PB1 No screen time < 2 yr PB2 Screen time 30 min/wk PB3 Screen time purpose PB4 No TV w/meals PC1 Outdoor play occasions PC2 Toddler play time PC3 Preschool play time PD1 Structured play PE1 Tummy time often PE2 Limit time infant equip.
-0.19 -0.42 -0.58

`
Achieving a State of Healthy Weight 2014 17
0.01 0.02 0.02 0.03 0.03 0.04 0.04 0.04 0.04 0.05 0.05 0.05 0.05 0.06 0.06 0.06 0.06 0.06 0.06 0.06 0.07 0.07 0.07 0.07 0.08 0.08 0.09 0.09 0.09 0.09 0.09 0.10 0.11 0.11 0.11 0.11 0.11 0.11 0.12 0.13 0.13 0.13 0.15 0.16
0.21 0.51
1.08
-0.50 0.00 0.50 1.00 1.50
ID2PA1NA2NC2NB3NA1NE1NF2PA2ID3
PD1PB2NA3IB3IC3
NH1NB2NH2
IC1PE2ID1
NG1PC3IB1
PB4NG2PA4NB1PA3PA5NC4PB1
CompositeNC1NC3NE2IC2
PC1PB3PC2NF1NA4IA2IA1PE1IB2
ND1NA5
Variables' COPR Score Changes: 2010-2014
The chart to the left expresses (as COPR scores) changes in the strength of regulations nationally for each ASHW variable (healthy weight practice), 2010-2014.
Two variable changes reported in ASHW 2012, due to CACFP revisions, are still most improved since 2010:
NA5: Serve skim or 1% pasteurized milk to children two years of age and older.
ND1: Make water available both inside and outside.
-0.06
Achieving a State of Healthy Weight 2014 18
Conclusion
Typically, each year since 2010, a small number of states enacted a few child care regulations impacting obesity prevention. Therefore, the ASHW assessments document very slow progress nationally toward improved regulatory language that fully supports the PCO2/CFOC3 obesity prevention practices, with a corresponding decline in the proportion of variables that states do not address. The 2014 update is the first time no state enacted regulations that lowered its ASHW ratings.
The year of the most progress to date was recorded in the 2012 assessment. That year, state-initiated changes were supplemented by improvements in several states’ ASHW ratings for two variables. The variables were associated with the USDA Food and Nutrition Service actions that strengthened healthy weight practices (for availability of water, and serving skim/1% fat milk for children age 2 and older) of the Child and Adult Care Food Program (CACFP). In early 2015, revision of the CACFP Meal Patterns remains in progress. When finalized and made effective, these changes are expected to have predominantly positive and systemic effects that strengthen several infant feeding and nutrition healthy weight practices in the many states that require licensed child care programs to follow the CACFP requirements. States that direct child care personnel to the USDA FNS CACFP webpages will have their ratings adjusted (taking into account any state-specific text that raises or lowers the CACFP ratings). It should be noted however that states that physically reproduce the Meal Patterns
guidelines in their regulations– versus referring caregivers to the external CACFP Meal Pattern webpages–must revise their regulations to reflect the new changes to be assigned new ASHW ratings. That is, these states will be credited with changed CACFP ratings only if they either: 1) revise their regulations to replicate the updated Meal Patterns, or 2) remove their out-of-date information and direct providers to view and follow the guidelines at the CACFP website. Otherwise, their ASHW ratings will reflect the scores associated with the pre-revision CACFP Meal Patterns.
Finally, although slow gains in the campaign to mobilize child care regulations as a resource are accruing, even leading states have a long way to go. The coming CACFP revision most likely will have discernible, positive impact upon several states’ ratings. However, even the states with the best ASHW ratings barely have passed the halfway mark in achieving child care regulations fully supportive of healthy weight practices (refer to COPR Scores by State: Baseline (2010) and 2014, p. 10, and the map States with the Least Obesity Prevention Language in Their Regulations, p. 14). Furthermore, healthy weight practices in the Physical Activity/Screen Time domain remain substantially under-addressed across the nation (refer to Composition of Ratings of Individual Practices 2014, p. 15). This underscores the message that, despite some progress since 2010, much remains to be done in our effort to mobilize child care licensing regulations as a resource to support the healthy weight of our youngest children.

Achieving a State of Healthy Weight 2014 19
Appendix Table 1 displays the source standards in PCO2 and CFOC3 from which the ASHW study
variables were derived. The link to the NRC’s searchable CFOC3 data base (http://cfoc.nrckids.org/index.cfm) enables viewing the complete standard(s), rationale, references and related standards for each study variable. The page numbers of source standards in the print copies of PCO2 and CFOC3 also are provided.
Multiple source variables. The concepts captured in some ASHW variables are present in different contexts in more than one PCO2/CFOC3 standard. For example, the Infant Feeding variable IB2: do not feed beyond satiety, is a core concept that is addressed slightly differently in two standards: Standard 4.3.1.2 - Feeding Infants on Cue by a Consistent Caregiver/Teacher (“observing satiety cues can limit overfeeding”) and Standard 4.3.1.8 - Techniques for Bottle Feeding ("Allow infant to stop the feeding”). The table below identifies those ASHW variables that were informed by more than one standard, including the numbers and names of the standards.
INFANT FEEDING Print copy pg #
Variable # ASHW Variable Text Source of Variable in CFOC3
Standards PCO2 CFOC3
IA1 Encourage and support breastfeeding and feeding of breast milk by making arrangements for mothers to feed their children comfortably on-site.
4.3.1.1 - General Plan for Feeding Infants
26 162
IA2 Serve human milk or infant formula to at least age 12 months, not cow's milk, unless written exception is provided by primary care provider and parent/guardian.
4.3.1.7 - Feeding Cow's Milk & 4.2.0.4 - Categories of Foods
39 & 18
169 &
155
IB1 Feed infants on cue. 4.3.1.2 - Feeding Infants on Cue by a Consistent Caregiver/Teacher & 4.3.1.8 - Techniques for Bottle Feeding
27 & 33
164 &
170 IB2 Do not feed infants beyond satiety; Allow infant to
stop the feeding. 4.3.1.2 - Feeding Infants on Cue by a Consistent Caregiver/Teacher & 4.3.1.8 - Techniques for Bottle Feeding
27 & 33
164 &
170 IB3 Hold infants while bottle feeding; Position an
infant for bottle feeding in the caregiver/teacher's arms or sitting up on the caregiver/teacher’s lap.
4.3.1.8 - Techniques for Bottle Feeding 33 170
IC1 Develop a plan for introducing age-appropriate solid foods (complementary foods) in consultation with the child’s parent/guardian and primary care provider.
4.3.1.11 - Introduction of Age-Appropriate Solid Foods to Infants
35 172
IC2 Introduce age-appropriate solid foods (128 a) no sooner than 4 months of age, and preferably around 6 months of age.
4.3.1.11 - Introduction of Age-Appropriate Solid Foods to Infants
35 172
IC3 Introduce breastfed infants gradually to iron-fortified foods no sooner than four months of age, but preferably around six months to complement the human milk.
4.3.1.11 - Introduction of Age-Appropriate Solid Foods to Infants
35 172
ID1 Do not feed an infant formula mixed with cereal, fruit juice or other foods unless the primary care provider provides written instruction.
4.3.1.5 - Preparing, Feeding, and Storing Infant Formula
31 167
ID2 Serve whole fruits, mashed or pureed, for infants 7 months up to one year of age.
4.2.0.4 - Categories of Foods 18 155
ID3 Serve no fruit juice to children younger than 12 months of age.
4.2.0.4 - Categories of Foods & 4.2.0.7 - 100% Fruit Juice
18 & 21
155 &
157
APPENDIX SOURCE OF ASHW VARIABLES IN PCO2/CFOC3 STANDARDS

Achieving a State of Healthy Weight 2014 20
NUTRITION Print copy pg #
Variable # ASHW Variable Text Source of Variable in CFOC3
Standards PCO2 CFOC3
NA1 Limit oils by choosing monounsaturated and polyunsaturated fats (such as olive oil or safflower oil) and avoiding trans fats, saturated fats and fried foods.
4.2.0.4 - Categories of Foods 18 155
NA2 Serve meats and/or beans - chicken, fish, lean meat, and/or legumes (such as dried peas, beans), avoiding fried meats.
4.2.0.4 - Categories of Foods 18 155
NA3 Serve other milk equivalent products such as yogurt and cottage cheese, using low-fat varieties for children 2 years of age and older.
4.2.0.4 - Categories of Foods 18 155
NA4 Serve whole pasteurized milk to twelve to twenty-four month old children who are not on human milk or prescribed formula, or serve reduced fat (2%) pasteurized milk to those who are at risk for hypercholesterolemia or obesity
4.3.2.3 - Encouraging Self-Feeding by Older Infants and Toddlers
39 175
NA5 Serve skim or 1% pasteurized milk to children two years of age and older.
4.3.2.3 - Encouraging Self-Feeding by Older Infants and Toddlers
39 175
NB1 Serve whole grain breads, cereals, and pastas. 4.2.0.4 - Categories of Foods 18 155 NB2 Serve vegetables, specifically, dark green, orange,
deep yellow vegetables; and root vegetables, such as potatoes and viandas.
4.2.0.4 - Categories of Foods 18 155
NB3 Serve fruits of several varieties, especially whole fruits.
4.2.0.4 - Categories of Foods 18 155
NC1 Use only 100% juice with no added sweeteners. 4.2.0.7 - 100% Fruit Juice 21 157 NC2 Offer juice only during meal times. 4.2.0.7 - 100% Fruit Juice 21 157 NC3 Serve no more than 4 to 6 oz juice/day for children
1-6 years of age. 4.2.0.4 - Categories of Foods & 4.2.0.7 - 100% Fruit Juice
17 & 21
155 &
157 NC4 Serve no more than 8 to 12 oz juice/day for
children 7-12 years of age. 4.2.0.4 - Categories of Foods & 4.2.0.7 - 100% Fruit Juice
18 & 21
155 &
157 ND1 Make water available both inside and outside. 4.2.0.6 - Availability of Drinking Water 20 157 NE1 Teach children appropriate portion size by using
plates, bowls and cups that are developmentally appropriate to their nutritional needs.
4.3.2.2 - Serving Size for Toddlers and Preschoolers & 4.7.0.1 - Nutrition Learning Experiences for Children
38 & 46
174 &
183
NE2 Require adults eating meals with children to eat items that meet nutrition standards.
4.5.0.4 - Socialization During Meals 41 179
NF1 Serve small-sized, age-appropriate portions. 4.3.2.2 - Serving Size for Toddlers and Preschoolers
38 174
NF2 Permit children to have one or more additional servings of the nutritious foods that are low in fat, sugar, and sodium as needed to meet the caloric needs of the individual child; Teach children who require limited portions about portion size and monitor their portions.
4.3.2.2 - Serving Size for Toddlers and Preschoolers & 4.5.0.4 - Socialization During Meals
38 & 41
174 &
179
NG1 Limit salt by avoiding salty foods such as chips and pretzels.
4.2.0.4 - Categories of Foods 18 155
NG2 Avoid sugar, including concentrated sweets such as candy, sodas, sweetened drinks, fruit nectars, and flavored milk.
4.2.0.4 - Categories of Foods 18 155
NH1 Do not force or bribe children to eat. 4.5.0.11 - Prohibited Uses of Food 43 182 NH2 Do not use food as a reward or punishment. 4.5.0.11 - Prohibited Uses of Food 43 182

Achieving a State of Healthy Weight 2014 21
PHYSICAL ACTIVITY/SCREEN TIME Print copy pg #
Variable # ASHW Variable Text Source of Variable in CFOC3
Standards PCO2 CFOC3
PA1 Provide children with adequate space for both inside and outside play.
3.1.3.1 - Active Opportunities for Physical Activity
51 90
PA2 Provide orientation and annual training opportunities for caregivers/teachers to learn about age-appropriate gross motor activities and games that promote children’s physical activity.
3.1.3.4 - Caregivers'/Teachers' Encouragement of Physical Activity
57 95
PA3 Develop written policies on the promotion of physical activity and the removal of potential barriers to physical activity participation.
9.2.3.1 - Policies and Practices that Promote Physical Activity
58 353
PA4 Require caregivers/teachers to promote children’s active play, and participate in children’s active games at times when they can safely do so.
3.1.3.4 - Caregivers'/Teachers' Encouragement of Physical Activity
57 95
PA5 Do not withhold active play from children who misbehave, although out-of-control behavior may require five minutes or less calming periods to help the child settle down before resuming cooperative play or activities.
3.1.3.1 - Active Opportunities for Physical Activity
51 90
PB1 Do not utilize media (television [TV], video, and DVD) viewing and computers with children younger than two years.
2.2.0.3 - Limiting Screen Time – Media, Computer Time
59 66
PB2 Limit total media time for children two years and older to not more than 30 minutes once a week; Limit screen time (TV, DVD, computer time).
2.2.0.3 - Limiting Screen Time – Media, Computer Time & 3.1.3.4 - Caregivers'/Teachers' Encouragement of Physical Activity
59 & 57
66 & 95
PB3 Use screen media with children age two years and older only for educational purposes or physical activity.
2.2.0.3 - Limiting Screen Time – Media, Computer Time
59 66
PB4 Do not utilize TV, video, or DVD viewing during meal or snack time.
2.2.0.3 - Limiting Screen Time – Media, Computer Time
59 66
PC1 Provide daily for all children, birth to six years, two to three occasions of active play outdoors, weather permitting.
3.1.3.1 - Active Opportunities for Physical Activity
51 90
PC2 Allow toddlers sixty to ninety minutes per eight-hour day for vigorous physical activity.
3.1.3.1 - Active Opportunities for Physical Activity
51 90
PC3 Allow preschoolers ninety to one-hundred and twenty minutes per eight-hour day for vigorous physical activity.
3.1.3.1 - Active Opportunities for Physical Activity
52 90
PD1 Provide daily for all children, birth to six years, two or more structured or caregiver/ teacher/ adult-led activities or games that promote movement over the course of the day—indoor or outdoor.
3.1.3.1 - Active Opportunities for Physical Activity & 3.1.3.4 - Caregivers'/Teachers' Encouragement of Physical Activity
51 & 57
90 & 95
PE1 Ensure that infants have supervised tummy time every day when they are awake.
3.1.3.1 - Active Opportunities for Physical Activity
51 90
PE2 Use infant equipment such as swings, stationary activity centers (ex. exersaucers), infant seats (ex. bouncers), molded seats, etc. only for short periods of time if at all.
3.1.3.1 - Active Opportunities for Physical Activity
51 90