achieving a state of healthy weight: 2012 updatenrckids.org/files/ashw 2012 final report 9-18-13...
TRANSCRIPT
NNaattiioonnaall RReessoouurrccee CCeenntteerr ffoorr HHeeaalltthh aanndd SSaaffeettyy
iinn CChhiilldd CCaarree aanndd EEaarrllyy EEdduuccaattiioonn
Achieving a State of Healthy Weight:
2012 Update
June 2013

Copyright 2013, National Resource Center for Health and Safety in Child Care and Early Education.
Suggested citation: National Resource Center for Health and Safety in Child Care and Early Education. 2013. Achieving a state of healthy weight: 2012 update. Aurora, CO: University of Colorado Denver.
This project was supported by Grant Number U46MC09810 from the U.S. Department of Health and Human Services, Health Resources and Services Administration, Maternal and Child Health Bureau.
The National Resource Center for Health and Safety in Child Care and Early Education (NRC) is a program of the Healthy Child Care America (HCCA) Cooperative Agreement Program, funded by the Maternal and Child Health Bureau (MCHB), Health Resources and Services Administration, U.S. Department of Health and Human Services. The NRC is operated by the College of Nursing of the University of Colorado, Anschutz Medical Campus, Aurora, Colorado.

Table of Contents
Executive Summary ........................................... i
Introduction ....................................................... 1
Method: 2012 .................................................... 4
Findings ............................................................ 8
Discussion ......................................................25
Notes & References .......................................26
Appendices .....................................................27
Appendix A. Frequently Used Acronyms ....28
Appendix B. State Documents
Searched: 2012 ........................................29
Appendix C. Sample Rating Scales ............33
Appendix D. Source of ASHW Variables
in PCO2/CFOC3 Standards .....................35
Appendix E. CACFP Rating Rules
and Explanation........................................45
Appendix F. Individual State Data ...............53
Appendix G. Degree to Which States
Address Variables: By State...................142
Appendix H. Ranking of All States by All
Variables and by Topic Areas ................144
Appendix I. Degree to Which States
Address Variables: By Variable .............. 148

Executive Summary
In Achieving a State of Healthy Weight: A National Assessment of Obesity Prevention Terminology in Child Care Regulations 2010 (ASHW 2010), the National Resource Center for Health and Safety in Child Care and Early Education (NRC) established a baseline for tracking states’ child care regulatory changes that promote healthy nutrition and physical activity practices in three regulated child care types: centers, large/group family homes; and small family child care homes. The current report, Achieving a State of Healthy Weight: 2012 Update, is the second annual update to the baseline assessment. All three ASHW studies to date, the baseline 2010 assessment and the 2011 and 2012 updates, were supported by US Department of Health and Human Services (DHHS), Health Resources and Services Administration (HRSA), Maternal and Child Health Bureau (MCHB).
The ASHW study variables for all three assessments were the 47 high-impact components of the best practice guidelines published in Preventing Childhood Obesity in Early Care and Education Programs: Selected Standards from Caring for Our Children: National Health and Safety Performance Standards (PCO) (American Academy of Pediatrics, American Public Health Association, and National Resource Center for Health and Safety in Child Care and Early Education, 2010). In 2010 and 2011, child care licensing regulations either did not address or only partially addressed many of these healthy weight variables,
especially those in the domain of physical activity/screen time.
2012 State-Level Changes
Twelve states enacted child care licensing regulations that included new or revised text related to obesity prevention in 2012. The states were California, Colorado, Florida, Iowa, Kansas, Maryland, Nevada, New Mexico, North Carolina, Texas, Washington, and Wyoming.
• States’ changes yielded a total of 121 ratings, distributed across 24 variables and the three child care types: 89% strengthened licensing regulations and 11% weakened regulations.
• Washington, North Carolina, Nevada, Wyoming, and Iowa made the greatest number of positive changes (i.e., improved ratings) of the 12 states. However, the absolute numbers of changes within states were all small.
• All 12 states made some improvements, although decrements in ratings also resulted from new or revised text (a single rating for Washington, some for Wyoming and, several for Nevada).
• Washington’s improvements elevated the state’s standing to the third highest in the nation, following Arizona and Delaware, in terms of changes that partially or fully addressed 74% of the ASHW variables.
Also Reported
Two changes in the US Department of Agriculture Food and Nutrition Child and Adult Care Food Program (CACFP) program requirements were made effective in the last quarter of 2011. The CACFP changes, pertaining to milk fat levels and availability of water, affected ratings for two related ASHW variables. The CACFP improvements resulted in positive, automatic changes for many states that require some or all licensed child care programs to adhere to CACFP guidelines. The CACFP changes affected 30 states for one variable (milk) and 25 for the second variable (water). When states’ rating were adjusted in the ASHW national database, the two strengthened CACFP program requirements accounted for more positive change than all state-specific regulatory changes combined in 2012 report.
Status of All the States in 2012
As a result of CACFP changes that affected many states, as well as the new and revised regulations introduced by the 12 states above, the ranking of states across the nation was updated in 2012. Seven states completely addressed more than 20% of the ASHW variables by achieving the maximum value consistently in each of the three child care types. The states were Mississippi, Delaware, Florida, and South Dakota, and new in 2012, North Carolina, Alaska, and North Dakota.
Five states all addressed more than 70% of ASHW variables to some extent (partially or
National Resource Center for Health and Safety in Child Care and Early Education - ASHW 2012 i

Executive Summary
fully) in at least one type of child care the states regulate (center-based programs, large/group and small family child care homes). The states were Arizona, Delaware, Washington, Mississippi and Virginia.
States that addressed the most variables in the three major content areas, either partially or fully, in at least one care type, include, for:
• Infant feeding - Delaware, Arizona, Colorado, Massachusetts, Michigan, Mississippi, and Washington
• Nutrition – Arizona, West Virginia, Illinois, and Mississippi
• Physical Activity/Screen Time - Arkansas, Delaware, Virginia, and Washington
Treatment of Specific Content Across All States
Of the 47 ASHW variables, those that states most often fully addressed (achieving the maximum rating value) in at least one care type were:
• Space for active play ( in all states, which includes the District of Columbia)
• Make water available indoors and outside (42 states)
• Feed children developmentally-appropriate sized servings (41 states)
• Feed infants on cue (40 states)
• Serve 100% juice (39 states)
• Serve skim or 1% pasteurized fat milk to children two years if age and older (34 states)
• Serve no cow’s milk to children younger than one year (31 states)
There are 16 ASHW variables for which fewer than half the states have applicable text in their regulations. Physical Activity/Screen Time is disproportionately represented among them, as 9 of the 16 variables fall in that domain.
In 2012, the overall effect of the state-level changes in new and revised text remains very modest but positive in its potential impact upon prevention of childhood obesity and development of healthy weight habits. Although the 2011 CACFP introduction of new program requirements affected only two ASHW variables, the impact was noticeable in the 2012 dataset, particularly when combined with state changes.
A significant revision of the CACFP program requirements and Meal Patterns for child care is underway at the USDA FNS and is expected to take effect in 2014. Based on the NRC’s review of the 2011 recommendations for CACFP revision, the program will earn improved ratings for several ASHW variables. Consequently, when the CACFP revision is enacted, states that require some or all licensed child care program types to adhere to CACFP should see an improvement in several nutrition and infant feeding ASHW variables. The degree of improvement will depend on the final form of the CACFP revision and the content of related state-specific regulations. In addition, states seeking to implement strategic efforts to bring child care regulations into consistent alignment with the PCO2/CFOC3 healthy weight standards may refer to the NRC’s recent release of the ASHW rating scales to review how their text may be strengthened. States are encouraged to do so especially in regard to the Physical Activity and Screen Time domain, which remains the least often addressed component of development of healthy habits in child care regulations.
National Resource Center for Health and Safety in Child Care and Early Education - ASHW 2012 ii

Introduction
Achieving a State of Healthy Weight: 2012 Update (ASHW 2012) is the annual report of the National Resource Center for Health and Safety in Child Care and Early Education (NRC) on the status of obesity prevention terminology in the States’ child care licensing regulations. NRC published the baseline study in 2010, Achieving a State of Healthy Weight: A National Assessment of Obesity Prevention Terminology in Child Care Regulations 2010 (ASHW 2010).1 A subsequent 2011 update examined rules enacted January 1 through December 31, 2011.2 ASHW assessments are funded and conducted as part of the cooperative agreement for the NRC between the University of Colorado, College of Nursing and the Maternal and Child Health Bureau (MCHB), Health Resources and Services Administration (HRSA), U.S. Department of Health and Human Services. (See frequently used acronyms in Appendix A.)
The purpose of the ASHW reports is to examine child care regulations for text related to 47 high impact healthy weight variables, that is, practices expected to reduce childhood obesity if implemented in child care and early education settings. The variables were drawn from the nutrition, infant feeding, and physical activity/screen time standards first published in 2010 in Preventing Childhood Obesity in Early Care and Education Programs: Selected Standards from Caring for Our Children: National Health and Safety Performance Standards; Guidelines for Early Care and Education Programs, 3rd Edition (PCO).3, 4 The healthy weight standards of PCO
subsequently were included in the comprehensive volume Caring for Our Children: National Health and Safety Performance Standards; Guidelines for Out-of-Home Child Care Programs, Third Edition (CFOC3).5 The PCO/CFOC3-based ASHW variables are aligned substantially with the child care elements of the 2011 Institute of Medicine recommendations for policies promoting early childhood obesity prevention.6 (PCO was updated in 2012 and is referred to hereafter as PCO2.)
ASHW 2010 reported the detailed methodology (including rating scale development and rating procedures) and the results of the examination of the child care licensing regulations in effect in all 50 states and the District of Columbia as of December 31, 2010. The care types examined were center-based care, large or group family child care homes, and small child care family homes. The 2010 findings established a baseline for tracking in ensuing years changes to regulations that relate to obesity prevention in licensed child care programs. Achieving a State of Healthy Weight: 2011 Update (ASHW 2011) was the first followup. The Synopsis of 2010 and 2011 Findings reveals that, at the 2010 baseline, many of the PCO2/CFOC3 Healthy Weight Standards for obesity prevention in child care programs were not reflected in child care regulations nationwide. In 2011, with only three states, Arizona, Arkansas, and North Dakota, making pertinent regulatory changes, there was minimal progress in strengthening early care regulations to help prevent childhood obesity.
ACKNOWLEDGMENTS
NRC Director
Marilyn J. Krajicek, EdD,
RN, FAAN
Research Associate and NRC Evaluator
Geraldine Steinke, PhD
2012 Healthy Weight Project Leader and Chief
Research Assistant
Betty Geer, DNP, MSN,
RN, C-PNP
Rating Team
Caitlin Trucksess, BA
Lorina Washington, BA
ASHW Database Development and
Information Technologists
Kent Hogue, MA
Information Technology Consultant
Daren Childers, BS EE
Document Design
Susan Purcell, MA
Lorina Washington, BA
MCHB Project Officer
Barbara U. Hamilton, MA
National Resource Center for Health and Safety in Child Care and Early Education - ASHW 2012 1

Synopsis of 2010 and 2011 Findings 2010 Baseline Findings
No, or insufficient, obesity prevention terminology was detected in more than half of the ratings performed on states’ child care regulations.
Language fully supportive of high impact obesity variables was indicated in only 13% of the ratings performed.
No one type of child care assessed--center-based care, large or group family homes, and small family child care homes—was better regulated in terms of obesity prevention.
2011 Update
Documents (revised or previously unrated) from four states regulations were reviewed in 2011:
Arizona
A 2011 revision of Child Care Group Homes yielded mixed results but added new rules that slightly strengthened obesity the state’s prevention regulations, so that Arizona remained in the upper tier of states that fully met criteria for obesity prevention in at least 20% of the study variables for at least one care type.
Arkansas
Three revised documents (one per child care type rated) yielded the most positive changes in 2011, primarily improving the state’s physical activity and screen time rules.
North Dakota
Three revised documents (one per child care type) especially strengthened nutrition and infant feeding rules. In 2011, North Dakota fully and consistently addressed standards across all three child care types for 8 of 47 variables (compared to only one in 2010).
Virginia
A previously unrated document for large and small family child care homes yielded 20 ratings that were higher than those reported in 2010.
Nationally, the relatively small number of regulations examined in 2011 had little overall impact on the national profile, so that:
• Nutrition remained the most often addressed content area, followed by Infant Feeding. Physical Activity and Screen Time continued to be largely unaddressed across the nation.
• The highest quality childhood obesity prevention regulations continued to be those of Delaware and Mississippi.
• Delaware, Florida, Mississippi, and South Dakota had the most regulations that fully met the standards across all three child care types assessed in ASHW (center-based care, large/group family homes, and small family child care homes).
• Arkansas, Florida, Illinois, Maryland, Massachusetts, Michigan, Minnesota, New Mexico, North Carolina, North Dakota, Oregon, South Carolina, Virginia, West Virginia, and Wisconsin all ranked highly in at least one topic (Nutrition, Infant Feeding, or Physical Activity/Screen Time) for at least one child care type.
National Resource Center for Health and Safety in Child Care and Early Education - ASHW 2012 2

The current update examined changes in documents produced by 12 states during 2012. The states were: California, Colorado, Florida, Iowa, Kansas, Maryland, Nevada, New Mexico, North Carolina, Texas, Washington, and Wyoming. In addition, the US Department of Agriculture (USDA) Food and Nutrition Service (FNS) Child and Adult
Care Food Program (CACFP), which establishes minimum nutritional standards for enrolled programs serving low income individuals, introduced two program requirements in 2011. Participating child care programs were expected to be in full compliance with the new requirements during the last quarter of the year. These CACFP changes had
implications for two variables in the ASHW assessments. The CACFP improvements resulted in favorable rating adjustments for many states that require one or more types of regulated care to adhere to CACFP guidelines. These improved ratings are reflected in the Findings reported later.
National Resource Center for Health and Safety in Child Care and Early Education - ASHW 2012 3

Method: 2012
Identification of Child Care Regulations Rated for the 2012 Update
Several steps were undertaken to identify new and revised child care regulations for rating in the 2012 update. NRC staff contacted the licensing office of each state and the District of Columbia by phone and/or email at least twice during 2012. In addition, each child care licensing website was monitored at least three times for this report, with the final check performed during early 2013.7 The monitoring process revealed that more than 20 states made changes to child care licensing regulations that were effective during the period January 1 - December 31, 2012. Seventy-two new or revised documents were then screened, revealing 39 that had some content relevant to the ASHW variables. Brief documents were visually scanned for relevant text. Longer new documents were examined for key search terms. Revised documents were compared electronically with the previous versions to detect new and/or deleted relevant text. The vast majority of searches, to identify pertinent content for document inclusion/exclusion, and for identification of text for rating, were conducted using advanced Boolean search methods in Adobe® Reader® X. Of the 39 documents that were searched, 17 documents contained new and revised regulatory text, which was then rated. These 17
documents were rules issued by 12 states: California,8 Colorado, Florida, Iowa, Kansas, Maryland, New Mexico, Nevada, North Carolina, Texas, Washington,9 and Wyoming. (See Appendix B.)
Rating Procedures and Generation of Results
The rating methodology to assess child care regulations issued in 2012 was based upon procedures used in the 2010 and 2011 ASHW assessments. That is, the screened 2012 documents were examined for text related to the 47 ASHW variables. Ratings are based on a four point rating schema:
1 = contradicts the intent (/requirements) of the standard 2 = no content related to (the requirements of) the standard 3 = partially meets (the requirements of) the standard 4 = fully meets (the requirements of) the standard To achieve consistently high inter-rater reliability (rs ≥ .90), there are 47 variable-specific 4-point rating scales, each of which defines the type of terminology that must be -*present in a state’s document to earn each rating value, ‘1’ through ‘4’ (see Appendix C).10
New documents were rated on all 47 variables. Revised documents were rated only on changed text (i.e., additional, deleted or modified text). (See Appendix D for additional information about the ASHW variables.)
Raters for the 2012 update included the NRC’s Chief Research Assistant (and 2012 Healthy Weight Project Leader), a second experienced rater from the 2011 team, and
a new rater. Following training in ASHW search and rating procedures, the new rater assessed all 47 components for three child care types in one state that was rated in ASHW 2010, while blinded to the results of the baseline study. The ratings then were compared to the 2010 results and discrepancies were discussed to achieve consistent ratings. Each 2012 document was rated by at least two raters. As part of the reliability check, discrepancies were resolved in a meeting of the rating team with the NRC Evaluator (who led the 2010 and 2011 processes).
Raters entered the 2012 data into a Microsoft Access database. At the end of the rating process and reliability check, results were output to Microsoft Excel to generate tables and figures reported under Findings.
CACFP and Related Food Guidance Programs
The Child and Adult Care Food Program (CACFP) Meal Patterns of the Food and Nutrition Service (FNS), US Department of Agriculture (USDA), establish appropriate foods and age-specific serving sizes for good nutrition in child and adult care programs that are enrolled and eligible for reimbursement for meals served to low income individuals. Many states require licensed child care programs to adhere to the CACFP food guidance, whether or not the programs participate in CACFP. As in previous ASHW assessments, the NRC assigned to such states predetermined scores for ASHW nutrition and infant feeding variables, based on
National Resource Center for Health and Safety in Child Care and Early Education - ASHW 2012 4

NRC’s rating of the CACFP Meal Patterns. Supplemental state-specific text may raise or lower the state’s rating on a variable relative to the rating of CACFP for that variable. (See Appendix E for the ratings assigned by the NRC to the Meal Patterns.)
In late 2011, the USDA FNS issued two new CACFP program requirements: a) that only skim or 1% pasteurized milk be served to children aged two years and older, and b) that water be available to children throughout the day and upon request. These new CACFP program requirements are in full alignment with the related Standards of PCO2 and CFOC3, and therefore raised the ratings of CACFP for the related two ASHW variables (NA5 and ND1, respectively in the tables that follow below) to ‘4’ (fully meeting the requirements of
the standard). The current report reflects the improved ratings of these variables for many states. The changes are reflected in the charts, tables and figures throughout this report and Appendix F.
In 2010, using a process similar to that for CACFP, the NRC also rated the USDA MyPyramid Food Guidance System and applied ratings to selected ASHW nutrition and physical activity variables consistent with NRC ratings of the food guidance.11 However, MyPyramid was replaced in mid-2011 by the MyPlate icon and program.12 Choose MyPlate is consumer guidance to the federally approved program on healthy nutrition presented in the Dietary Guidelines for Americans, 2010.13 PCO2 and CFOC3 promote MyPlate as the successor to MyPyramid, as a valuable consumer education
tool. However, there is no CFOC3 standard specific to the MyPlate recommendations, and ASHW scores are not assigned for states’ references to the MyPlate program.
ASHW Content Areas
The 47 ASHW variables were categorized into three major content areas to facilitate reporting of findings: 1) Infant Feeding, 2) Nutrition, and 3) Physical Activity and Screen Time. The set of variables assigned to each major content area and the alpha numeric code assigned to each are presented in the following three tables. These tables may serve as a reference, as the alphanumeric codes are used throughout the report of Findings.
INFANT FEEDING: Variables and Description
IA1 - Encourage and support breastfeeding and feeding of breast milk by making arrangements for mothers to feed their children comfortably on-site.
IA2 - Serve human milk or infant formula to at least age 12 months, not cow's milk, unless written exception is provided by primary care provider and parent/guardian.
IB1 - Feed infants on cue.
IB2 - Do not feed infants beyond satiety; AND, Allow infant to stop the feeding.
IB3 - Hold infants while bottle feeding; AND, Position an infant for bottle feeding in the caregiver/teacher's arms or sitting up on the caregiver/teacher’s lap.
IC1 - Develop a plan for introducing age-appropriate solid foods (complementary foods) in consultation with the child’s parent/guardian and primary care provider.
IC2 - Introduce age-appropriate solid foods no sooner than 4 months of age, and preferably around 6 months of age.
IC3 - Introduce breastfed infants gradually to iron-fortified foods no sooner than 4 months of age, but preferably around 6 months to complement the human milk.
ID1 - Do not feed an infant formula mixed with cereal, fruit juice or other foods unless the primary care provider provides written instruction.
ID2 - Serve whole fruits, mashed or pureed, for infants 7 months up to 1 year of age.
ID3 - Serve no fruit juice to children younger than 12 months of age.
National Resource Center for Health and Safety in Child Care and Early Education - ASHW 2012 5

NUTRITION: Variables and Description
NA1 - Limit oils by choosing monounsaturated and polyunsaturated fats (such as olive oil or safflower oil) and avoiding trans fats, saturated fats, and fried foods.
NA2 - Serve meats and/or beans - chicken, fish, lean meat, and/or legumes (such as dried peas, beans), avoiding fried meats.
NA3 - Serve other milk equivalent products such as yogurt and cottage cheese, using low-fat varieties for children 2 years of age and older.
NA4 - Serve whole pasteurized milk to 12- to 24-month old children who are not on human milk or prescribed formula, or serve reduced fat (2%) pasteurized milk to those who are at risk for hypercholesterolemia or obesity.
NA5 - Serve skim or 1% pasteurized milk to children 2 years of age and older.
NB1 - Serve whole grain breads, cereals, and pastas.
NB2 - Serve vegetables, specifically, dark green, orange, deep yellow vegetables; and root vegetables, such as potatoes and viandas.
NB3 - Serve fruits of several varieties, especially whole fruits.
NC1 - Use only 100% juice with no added sweeteners, and offer only during meal times.
NC2 - Use only 100% juice with no added sweeteners, and offer only during meal times.
NC3 - Serve no more than 4 to 6 oz juice/day for children 1-6 years of age.
NC4 - Serve no more than 8 to 12 oz juice/day for children 7-12 years of age.
ND1 - Make water available both inside and outside.
NE1 - Teach children about appropriate portion sizes. AND, Teach children appropriate portion size by using plates, bowls, and cups that are developmentally appropriate to their nutritional needs.
NE2 - Require adults eating meals with children to eat items that meet nutrition standards.
NF1 - Serve small-sized, age-appropriate portions.
NF2 - Permit children to have one or more additional servings of the nutritious foods that are low in fat, sugar, and sodium as needed to meet the caloric needs of the individual child. AND, Teach children who require limited portions about portion size and monitor their portions. (Combined component)
NG1 - Limit salt by avoiding salty foods such as chips and pretzels. (Selected to complete the food groups)
NG2 - Avoid sugar, including concentrated sweets such as candy, sodas, sweetened drinks, fruit nectars, and flavored milk.
NH1 - Do not force or bribe children to eat.
NH2 - Do not use food as a reward or punishment.
National Resource Center for Health and Safety in Child Care and Early Education - ASHW 2012 6
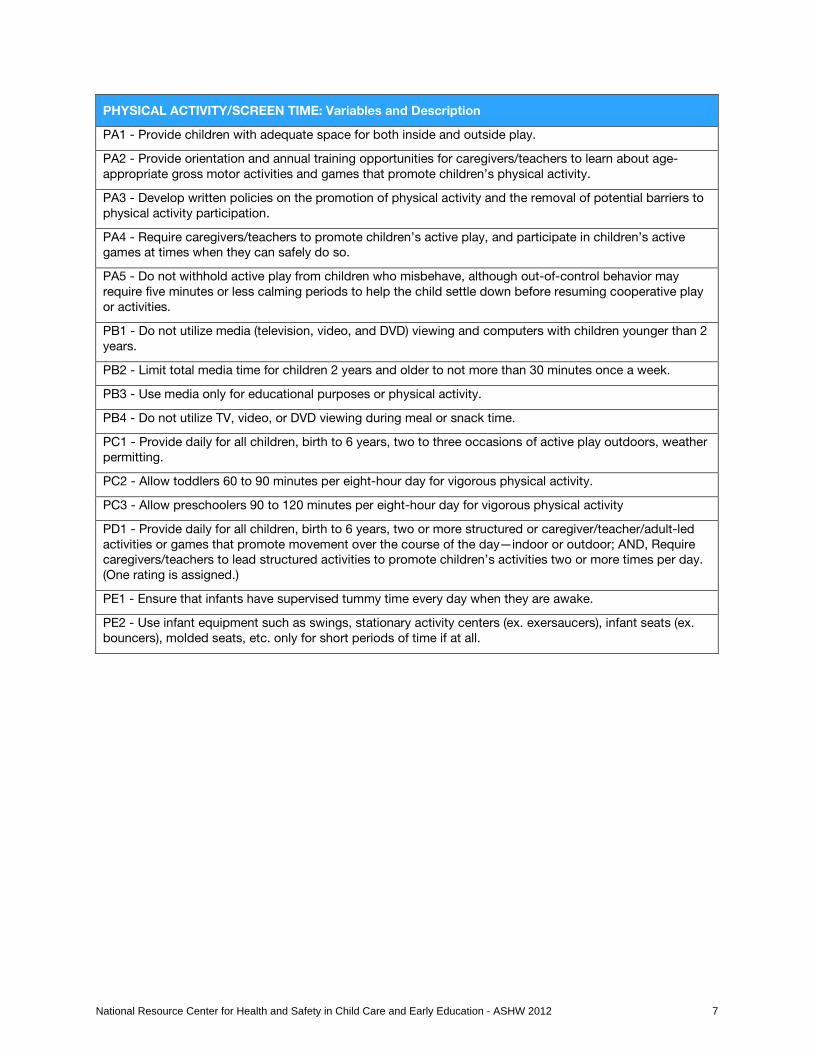
PHYSICAL ACTIVITY/SCREEN TIME: Variables and Description
PA1 - Provide children with adequate space for both inside and outside play.
PA2 - Provide orientation and annual training opportunities for caregivers/teachers to learn about age-appropriate gross motor activities and games that promote children’s physical activity.
PA3 - Develop written policies on the promotion of physical activity and the removal of potential barriers to physical activity participation.
PA4 - Require caregivers/teachers to promote children’s active play, and participate in children’s active games at times when they can safely do so.
PA5 - Do not withhold active play from children who misbehave, although out-of-control behavior may require five minutes or less calming periods to help the child settle down before resuming cooperative play or activities.
PB1 - Do not utilize media (television, video, and DVD) viewing and computers with children younger than 2 years.
PB2 - Limit total media time for children 2 years and older to not more than 30 minutes once a week.
PB3 - Use media only for educational purposes or physical activity.
PB4 - Do not utilize TV, video, or DVD viewing during meal or snack time.
PC1 - Provide daily for all children, birth to 6 years, two to three occasions of active play outdoors, weather permitting.
PC2 - Allow toddlers 60 to 90 minutes per eight-hour day for vigorous physical activity.
PC3 - Allow preschoolers 90 to 120 minutes per eight-hour day for vigorous physical activity
PD1 - Provide daily for all children, birth to 6 years, two or more structured or caregiver/teacher/adult-led activities or games that promote movement over the course of the day—indoor or outdoor; AND, Require caregivers/teachers to lead structured activities to promote children’s activities two or more times per day. (One rating is assigned.)
PE1 - Ensure that infants have supervised tummy time every day when they are awake.
PE2 - Use infant equipment such as swings, stationary activity centers (ex. exersaucers), infant seats (ex. bouncers), molded seats, etc. only for short periods of time if at all.
National Resource Center for Health and Safety in Child Care and Early Education - ASHW 2012 7

Findings
This update reports the status of child care licensing regulations as of December 31, 2012. The data set for this report consists of ratings for all 50 states and the District of Columbia (for convenience hereafter, the states) of 47 ASHW variables for each of three major types of child care programs (i.e., center-based care, large/group family care, and/or small family child care homes) the state may regulate. (Some states regulate fewer than three child care types, and some states regulate additional care types not rated in ASHW studies.) The data set includes the 2010 baseline ratings, updated where appropriate to incorporate 2011 and 2012 ratings derived from new or revised state documents, as well as improved ratings associated with 2011 CACFP program requirements, as described earlier (NA5: serve skim or 1% pasteurized milk to children age two years and older; and ND1: Make water available both inside and outside) (see preceding section, Method: 2012).
The findings are presented in the following order: 2012 New and Revised Child Care Regulations, Status of Obesity Prevention in Child Care Nationally in 2012, 2012 Status of All States, Variable-Level Analysis.
2012 New and Revised Child Care Regulations
Twelve states made changes in child care licensing regulations that were pertinent to obesity prevention in 2012: California, Colorado, Florida, Iowa, Kansas, Maryland, New Mexico, Nevada, North Carolina, Texas, Washington,
and Wyoming. The number of ASHW variables impacted in each state was small, ranging from as few as one and up to seven ASHW variables.
Table 1 presents a synopsis of the 2012 changes. The table is coded to provide substantial information. (See sidebar on following page for detailed explanation of Table 1).
Table 1 shows that there were 121 total ratings changes to different types of regulated care in the 12 states, of which 89% were improved ratings, and 11% were decrements. The greatest numbers of positive changes were seen in: Washington (14), North Carolina (13), Nevada (12), Wyoming (13), and Iowa (10). However, mixed results were obtained, in that Nevada also had 9 decrements in ratings, Wyoming, 3, and Washington, 1. Other 2012 states had fewer changes.
In later analyses in which states are ranked, 2012 data changes are evaluated in the context of each state’s full set of regulatory documents. The comparisons among states utilize the highest rating for each care type for each ASHW variable, under the assumption that caregivers are responsible to meet the all the
requirements in their state, so that the highest standard prevails. Considering the 12 states in light of their full complement of regulatory documents, the changes made in 2012 advance Washington’s standing in the nation. Cumulatively, Washington regulations as of 2012 earned ratings of ‘3’ or ‘4’ in 74% of the ASHW variables, that is, at
least partially addressing key guidelines of the PCO2/CFOC3 healthy weight standards. Among the 12 making 2012 revisions, other states that addressed at least half the ASHW variables, partially or fully, include: Colorado (68% of the variables), North Carolina (64%), Florida and New Mexico (62% each), Maryland (60%), Iowa (57%), California (55%), and Texas (53%). In addition, as of 2012, the states among these 12 with the most content that fully aligns with POCO/CFOC3 healthy weight standards (is rated ‘4’) were: Florida (40 ratings), North Carolina (35), Washington (33), Colorado and New Mexico (27 each), Maryland (25), Texas (24), and Iowa (23).
The 121 changes were distributed among 22 ASHW variables. The variables that were most changed were the
Twelve states made changes in child care
licensing regulations that were pertinent to
obesity prevention in 2012: California, Colorado,
Florida, Iowa, Kansas, Maryland, New Mexico,
Nevada, North Carolina, Texas, Washington, and
Wyoming.
National Resource Center for Health and Safety in Child Care and Early Education - ASHW 2012 8

two affected by the 2011 CACFP program requirements, NA5: Serve skim or 1% pasteurized milk to children 2 years of age and older [abbreviated low fat > 2y/o] and ND1: Make water available indoors and outside. Twenty-four positive changes (among care types) were seen in eight of the 12 states for these two variables. Although these changes were largely driven by the CACFP improvements, state text also was a factor in some changes. Considering new state text only, the variable IA1 (support breastfeeding) was the only variable that had double digit (11) improved ratings (across the care types in Iowa, Nevada, Texas, and Washington). In a few instances, negative changes were observed for five variables: IB1 (feed infants on cue), IB3 (hold infants to feed), NA5 (low fat milk for 2 y/o), NF2 (provide healthy seconds), and NH1 (food use: no force/as bribe).
Table 1 Description
The following guides interpretation of the material displayed in the Table regarding: Individual ratings by variable and by state; Totals (cumulative changes a) by variable, b) by state and c) by ratings = 4; and Color coding in the table.
Individual ratings. Each ASHW variable is listed in the two far left columns (column 1 = alphanumeric variable code, column 2 = abbreviated variable description). The 12 states with 2012 changes are listed alphabetically in the following columns across the page. Under each state name, three columns are embedded to report changes by care types (C = center, L = large or group family homes, S = small family child care homes). An improved rating in 2012 is indicated by a plus sign (+) and a lowered rating by a minus sign (-) in each cell. Cells without either symbol indicate unchanged ratings.
Totals. Information is also summarized by variable and by state. The final columns at the right of the Table (adjacent to Wyoming’s ratings) display 2012 outcomes by variable (across the 12states): for each variable the sum of positive changes (+), negative changes (-), and total number of ratings = ‘4’ (4s) across care types, in the 12 states as of 2012. Rows at the bottom of the table report similar state totals, tallying within each state and each care type within the state, across all 47 variables, the following sums: a) Total Increase (+) or positive rating changes, b) Total Decrease (-) or negative changes, and c) Total Rating = 4 (i.e., the sum of instances of the best possible rating value). The final three rows present summaries across care types for each state states: a) # Pos/Neg Changes (total number of positive/negative), and in the last two rows b), the # and % (number and percentage) 4s per State, or the number of ratings of ‘4’ across all care types and all variables in the state.
Color coding. Throughout the table, pink-shaded cells are indicative of ratings of ‘4’ in the 12 states, including newly rated ‘4s’ as of this report (a shaded cell that contains the plus sign, ‘+’) and pre-existing ‘4s’ (a shaded cell with no symbol). Furthermore, if a state requires licensed programs to follow CACFP guidelines, the state name is highlighted: in yellow, if all care types must adhere to CACFP; or in blue, if only particular types of care must comply. Green shaded cells, located in the final column to the right, titled “4’s”, and the row titled “# Pos/Neg Changes”, indicate Top Performers. Top Performers in 2012 were: a) variables with 20 or more ratings (across states) = 4 (full alignment with PCO2/CFOC3 healthy weight guidelines); and b) states that received 10 or more improved ratings.
For example, inspection of Table 1 reveals that as of 2012, Texas has 8 variables with ratings = 4, consistent across the three child care types (24 pink shaded cells). However, only one variable, IA1, support breastfeeding, received the new ratings of ‘4’ (indicated by the ‘+s’ in the pink cells). North Carolina shows a mixture of pink-shaded cells with and without pluses, as well as 2012 improvements to variable PA4 (play with children). The plus sign in the un-shaded cell for PA4 indicates that, while improved, North Carolina text did not fully meet the criterion for a rating = 4. Nevada had preexisting ratings = 4 for two variables (ND1 and NH2), whereas 2012 changes were a mixture of decrements (indicated by the minus sign) and improvements (rated less than ‘4’) throughout their columns.
National Resource Center for Health and Safety in Child Care and Early Education - ASHW 2012 9

Table 1. States' Changes in 2012 At-A-Glance
LEGEND
CACFP required for some types CACFP required for all types Rating of 4 Top Performer
Variable Description C L S C L S C L S C L S C L S C L S C L S C L S C L S C L S C L S C L S + ‐ 4sIA1 Support breastfeeding + + + + + + + + + + 10 0 9IA2 No cow’s milk < 1yr 0 0 18IB1 Feed infants on cue - - - 0 3 23IB2 Stop feed @ satiety + + + + 4 0 4IB3 Hold infant to feed - - - + + + 3 3 3IC1 Plan solid introduction + + + 3 0 4IC2 Intro solids @ 4-6 mo 0 0 0IC3 Iron-Fort @ 4-6 mo 0 0 1ID1 Don’t mix formula + + + + 4 0 0ID2 Whole fruit 7 m-1 yr 0 0 0ID3 No juice < 12 mo 0 0 0
NA1 Limit oils/fats 0 0 3NA2 Low fat meat/proteins 0 0 3NA3 Low fat milk equivalents 0 0 3NA4 Whole milk 1-2 y/o + 1 0 1NA5 Low fat milk > 2 y/o + + + + + + + + + + + + + + + + + + + - + + 21 1 24NB1 Whole grains 0 0 3NB2 Variety of vegetables 0 0 3NB3 Variety of whole fruit 0 0 7NC1 100% juice 0 0 24NC2 Juice only @ meals 0 0 0NC3 Juice 4-6 oz. 1-6 y/o + + + + + 5 0 5NC4 Juice 8-12 oz. 7+ y/o + + 2 0 2ND1 Make water available + + + + + + + + + + + + + + + + 16 0 27NE1 Teach portion sizes + + + 3 0 0NE2 Eat with children + + + 3 0 0NF1 Appropriate servings 0 0 23NF2 Healthy seconds - - - + + + 3 3 3
TotalsNORTH
CAROLINA TEXASIOWACALIFORNIA COLORADO FLORIDA+ Improved Rating
- Lowered Rating WASHINGTON WYOMINGKANSAS MARYLAND NEVADA NEW MEXICO
NF2 Healthy seconds + + + 3 3 3NG1 Limit salt 0 0 3NG2 Avoid sugary foods + + + 3 0 0NH1 Food no force/bribe + + - - - 2 3 0NH2 Food no reward/punish 0 0 6
PA1 Space for active play 0 0 32PA2 Training on activities + + + 3 0 0PA3 Write activity policies + + + 3 0 3PA4 Play with children + + 2 0 0PA5 Don’t withhold play + + 2 0 5PB1 No screen time < 2 yr + + + 3 0 6PB2 Screen time 30 min/wk 0 0 0PB3 Screen time purpose 0 0 2PB4 No TV w/meals 0 0 0PC1 Outdoor play occasions + + + 3 0 3PC2 Toddler play time + + + + 4 0 4PC3 Preschool play time + + + 3 0 0PD1 Structured play 0 0 0PE1 Tummy time often + + 2 0 9PE2 Limit time infant equip. 0 0 0
Total Increase (+) 1 4 4 1 3 2 2 2 2 4 4 2 0 3 3 2 4 2 4 4 4 3 3 3 3 5 5 1 1 1 0 7 7 4 4 4 108Total Decrease (-) 0 0 0 0 0 0 0 0 0 0 0 0 0 0 0 0 0 0 3 3 3 0 0 0 0 0 0 0 0 0 1 0 0 1 1 1 13
Total Rating = 4 9 1 1 5 11 11 14 13 13 8 8 7 3 3 3 8 10 7 3 3 3 9 9 9 11 12 12 8 8 8 9 12 12 2 2 2 266# Pos/Neg Changes by State 9 / 0 6 / 0 6 / 0 10 / 0 6 / 0 8 / 0 12 / 9 9 / 0 13 / 0 3 / 0 14 / 1 12 / 3
# 4's Per State% 4's Per State 23% 4%18% 6% 19% 25% 17%8% 19% 28% 16% 6%
40 23 9 25 9 27 35 24 33 62711
National Resource Center for Health and Safety in Child Care and Early Education - ASHW 2012 10

To summarize, states’ changes to regulatory text were overwhelmingly positive (at 89%) but small in number in 2012. Improved CACFP program requirements effected the most consistent, positive change in the 12 states. Figure 1 shows the full data (all 47 variables, all care types) for the 12 states combined. The stacked bar chart depicts the decline in ratings of 2 (no relevant content) and increases in ratings of 3 (partially) and 4 (fully meeting the criterion for healthy weight) from 2010 to 2012 in these states. (See Appendix F for the full final ratings for the 2012 states and all other states.)
Figure 1. 2010-1012 Comparison - 12 States
Status of Obesity Prevention in Child Care Nationally in 2012
In addition to the changes made by the 12 states with new and revised regulatory documents, the national database also was affected by the CACFP improvements in two program requirements, which enrolled programs were expected to make effective by the last quarter of 2011.
As noted, these changes strengthened CACFP so that it received new ratings of ‘4’ for both related ASHW variables. As applied to the states that require CACFP adherence for some or all of the care types regulated in the state, 29 states were affected by the change to NA5: low fat milk >2 y/o, and 25 by the change to ND1: availability of water. (Although more states require adherence to CACFP, some states already had state-specific text that earned the higher ratings in previous years).14 Together, the two variables accounted for 137 changed ratings across care types nationwide, nearly all CACFP-related.
All but one of the changed ratings for these two variables was positive (the exception, a result of new, contradictory language in California for one care type for NA5).Of the 137 rating changes for the two variables, 127 were straightforward improvements driven entirely by the CACFP changes. Ten other changes were the results of: state-specific text-only (Kansas), or articulation of the CACFP
changes with state text, which in a few cases earned a rating of ‘3’ instead of a ‘4’, as well as the single California rating, which earned a ‘1’.
Cumulative improvements resulting from new and revised 2012 state text and the CACFP changes may be discerned in the national data base, as displayed in Figure 2 (note that the CACFP changes are incorporated in the 2012 pie chart). The percentages of rating values (‘1’ through ‘4’) apply nearly equally to the three care types: centers= 35% of ratings, large/group child care, and small family child care homes each =33% of the national ratings. That is, two percent more of the rated text applied to centers than the other care types.
Cumulative improvements resulting from new
and revised 2012 state text and the CACFP
changes may be discerned in the
national database.
National Resource Center for Health and Safety in Child Care and Early Education - ASHW 2012 11

Figure 2. National Data: 2010 & 2011 versus 2012
2012 Status of All States
The changes to the child care regulations of the 12 states and those states with CACFP changes affected changes in the comparative standing of states in 2012. As in previous years, the NRC sought various ways to acknowledge the states that are best promoting obesity prevention in child care regulations, as well as those states that are progressing toward this goal, by using two methods of determining the top ranking states. First, states were identified that consistently promote obesity prevention in each child care type they regulate (i.e., that had the most ASHW variables that were uniformly rated ‘4’ across all regulated child care types). Second, states were identified that were addressing, partially or fully, the most ASHW variables, although not consistently across the care types (i.e., the most ratings of ‘3’ or ‘4’ in any care type/s).
The map in Figure 3 shows the states that best met standards for obesity prevention in 2012. In 2010, four states, Delaware, Florida, Mississippi, and South Dakota, had the highest number of regulations that fully met the standards (ratings = 4) consistently for all three child care types, signified by stars on the map. They were joined in 2012 by three other starred states: Alaska, North Carolina, and North Dakota.
Where states are shaded in green, the darker the shading, the more closely the state’s regulations met the standards for obesity prevention in at least one child care type. Dark green signifies the states that had high percentages of ratings of both ‘3’ and ‘4’ (partially or fully met standards): Delaware and Mississippi in 2010, along with Alaska and Virginia by 2012.
In 2010, Delaware, Florida, Mississippi, and
South Dakota had the highest number of
regulations that fully met the standards
consistently for all three child care types.
They were joined in 2012 by Alaska,
North Carolina, and North Dakota.
National Resource Center for Health and Safety in Child Care and Early Education - ASHW 2012 12

Medium green signifies the states in which at least 20% of the applicable regulations fully met the standards (ratings of ‘4’): in 2010, Arizona, Florida, and South Dakota, joined by 2012 by North Carolina, North Dakota, and Washington. Light green signifies the
states in which at least 40% of regulations partially met the standards (ratings of ‘3’). There were 13 such states in 2010: Alaska, Arkansas, Maryland, Massachusetts, Michigan, Minnesota, New Mexico, North Carolina, Oregon, South Carolina, Virginia, West Virginia, and
Wisconsin. By 2012, California joined this group, as two states, Virginia and Alaska moved to higher levels of alignment with PCO2/CFOC3, as described above. (Appendix G displays for each state the rating distribution across all study variables.)
Figure 3. States with the Most Regulations Partially to Fully Meeting Standards - 2012
National Resource Center for Health and Safety in Child Care and Early Education - ASHW 2012 13

Table 2*. Consistent Use of Obesity Prevention Language across Child Care Types
State Names No. Variables Rating = 4 All Regulated Child Care Types
Rank
MISSISSIPPI 15 1 DELAWARE 13
3 FLORIDA 13 SOUTH DAKOTA 13 NORTH CAROLINA 11 5 ALASKA 10
6.5 NORTH DAKOTA 10 ALABAMA 9
8.5 NEW MEXICO 9 CALIFORNIA 8
12.5
HAWAII 8 LOUISIANA 8 MASSACHUSETTS 8 TEXAS 8 WISCONSIN 8 IOWA 7
18.5
MARYLAND 7 MICHIGAN 7 MONTANA 7 OHIO 7 VIRGINIA 7 ARKANSAS 6
25
ILLINOIS 6 MAINE 6 NEW HAMPSHIRE 6 OREGON 6 SOUTH CAROLINA 6 WASHINGTON 6 MINNESOTA 5 29.5 MISSOURI 5 NEW YORK 4
32.5 PENNSYLVANIA 4 VERMONT 4 WEST VIRGINIA 4 ARIZONA 3
36.5 COLORADO 3 KENTUCKY 3 NEVADA 3 CONNECTICUT 2
41.5
DISTRICT OF COLUMBIA 2 GEORGIA 2 OKLAHOMA 2 RHODE ISLAND 2 WYOMING 2 KANSAS 1
46.5 NEBRASKA 1 NEW JERSEY 1 TENNESSEE 1 IDAHO 0
50 INDIANA 0 UTAH 0 Total instances of variables rated ‘4’ for all child care types.
289
* Where two or more states had the same number of variables fully meeting the standard (center column), an
average rank was computed and assigned to those states.
Table 2* shows how each state ranked on the criterion of fully meeting the standards for each of three child care types (centers, large/group family, and small family). States that regulate only one or two types of child care do not meet the criterion for comprehensive regulation of all types of care.
The instances of variables being uniformly addressed across child care types in states are few but are improving. Whereas in 2010 and 2011, only four states had ratings = 4 for more than 20% of variables for all child care types (the starred states in Figure 3), there are seven in 2012 (Mississippi, Delaware, Florida, South Dakota, North Carolina, Alaska, and North Dakota).
*Table 2 corrected on 8-13-13 for data transposition error affecting Alabama and Utah.
National Resource Center for Health and Safety in Child Care and Early Education - ASHW 2012 14

The second ranking method, the 3-4 High Score, identifies states that at least partially address obesity prevention (i.e., that earn either a ‘3’ or a ‘4’) in at least one, but not necessarily all three child care types (including states that do not regulate all three care types). In this method, for each variable, a state’s ratings for all child care types regulated (varying from one to three types) are examined. The highest score among the care types regulated by the state is the high score for that variable.
If that value is either a ‘3’ or a ‘4’, the state receives credit for at least partially addressing the variable. The maximum total score a state could achieve for this method is 47,
attained by having at least one care type earn a rating of either a ‘3’ or ‘4’ for each of the 47 ASHW variables.
Table 3 ranks the states on their 3-4 High Scores, that is, on the number of variables for which their rules have some positive impact upon obesity prevention. In 2012, Arizona and Delaware led the nation, followed closely by Washington, Mississippi and Virginia, all of which addressed
at least 70% of ASHW variables to some extent (a score of ‘3’ or ‘4’) in at least one type of child care. In 2012, 34 states had 3-4 High Scores for more than half of the ASHW variables (a minimum of 24 variables). This is one more state than in 2011, with the 2012 addition of Connecticut. Appendix H shows the 3-4 High Score report for all 50 states and the District of Columbia.
In 2010 and 2011, only four states had ratings = 4
for more than 20% of variables for
all child care types.
National Resource Center for Health and Safety in Child Care and Early Education - ASHW 2012 15
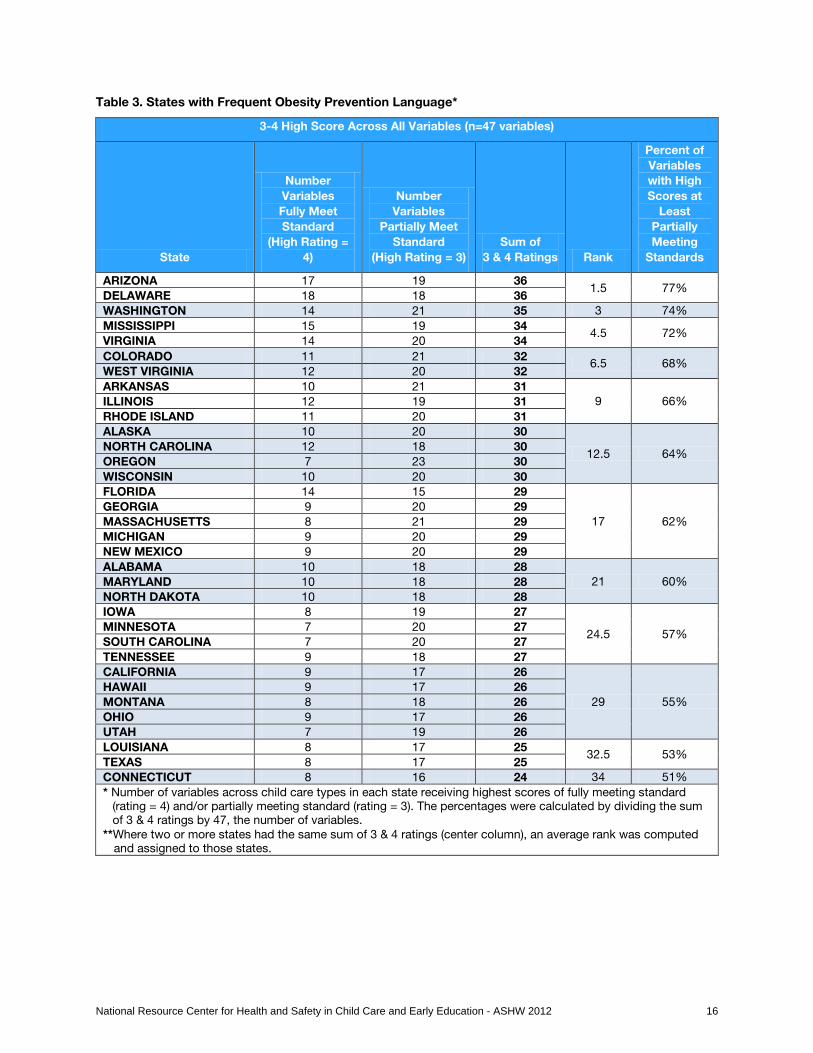
Table 3. States with Frequent Obesity Prevention Language*
3-4 High Score Across All Variables (n=47 variables)
State
Number Variables Fully Meet Standard
(High Rating = 4)
Number Variables
Partially Meet Standard
(High Rating = 3) Sum of
3 & 4 Ratings Rank
Percent of Variables with High Scores at
Least Partially Meeting
Standards
ARIZONA 17 19 36 1.5 77%
DELAWARE 18 18 36 WASHINGTON 14 21 35 3 74% MISSISSIPPI 15 19 34
4.5 72% VIRGINIA 14 20 34 COLORADO 11 21 32
6.5 68% WEST VIRGINIA 12 20 32 ARKANSAS 10 21 31
9 66% ILLINOIS 12 19 31 RHODE ISLAND 11 20 31 ALASKA 10 20 30
12.5 64% NORTH CAROLINA 12 18 30 OREGON 7 23 30 WISCONSIN 10 20 30 FLORIDA 14 15 29
17 62% GEORGIA 9 20 29 MASSACHUSETTS 8 21 29 MICHIGAN 9 20 29 NEW MEXICO 9 20 29 ALABAMA 10 18 28
21 60% MARYLAND 10 18 28 NORTH DAKOTA 10 18 28 IOWA 8 19 27
24.5 57% MINNESOTA 7 20 27 SOUTH CAROLINA 7 20 27 TENNESSEE 9 18 27 CALIFORNIA 9 17 26
29 55% HAWAII 9 17 26 MONTANA 8 18 26 OHIO 9 17 26 UTAH 7 19 26 LOUISIANA 8 17 25
32.5 53% TEXAS 8 17 25 CONNECTICUT 8 16 24 34 51% * Number of variables across child care types in each state receiving highest scores of fully meeting standard
(rating = 4) and/or partially meeting standard (rating = 3). The percentages were calculated by dividing the sum of 3 & 4 ratings by 47, the number of variables.
**Where two or more states had the same sum of 3 & 4 ratings (center column), an average rank was computed and assigned to those states.
National Resource Center for Health and Safety in Child Care and Early Education - ASHW 2012 16
The following tables, Tables 4 – 6, report the states with the best (greatest number of) 3-4 High Scores for variables in each of the three major topic areas: Infant Feeding, Nutrition, and Physical Activity/Screen Time. In addition to state changes in 2012, the effects of the CACFP improvements were detected in the upward movement of some states in the domain of Nutrition. (Refer to Appendix H for the
complete rankings for all states in all three topic areas.)
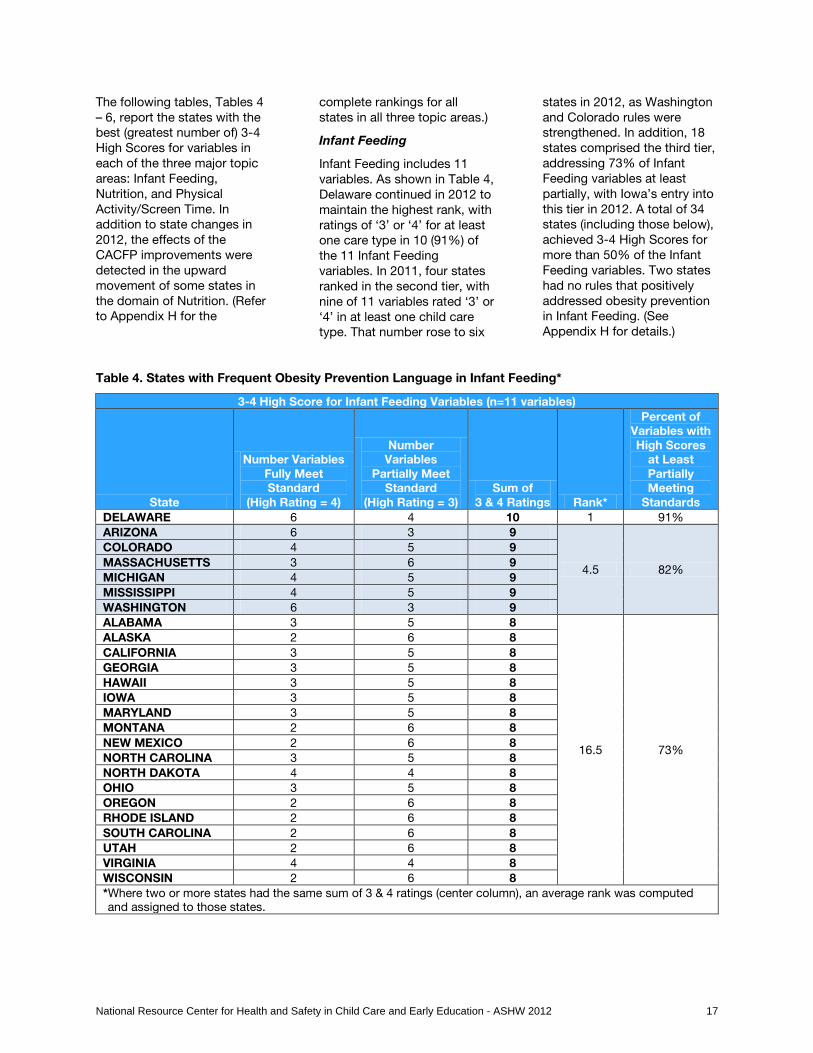
Infant Feeding
Infant Feeding includes 11 variables. As shown in Table 4, Delaware continued in 2012 to maintain the highest rank, with ratings of ‘3’ or ‘4’ for at least one care type in 10 (91%) of the 11 Infant Feeding variables. In 2011, four states ranked in the second tier, with nine of 11 variables rated ‘3’ or ‘4’ in at least one child care type. That number rose to six
states in 2012, as Washington and Colorado rules were strengthened. In addition, 18 states comprised the third tier, addressing 73% of Infant Feeding variables at least partially, with Iowa’s entry into this tier in 2012. A total of 34 states (including those below), achieved 3-4 High Scores for more than 50% of the Infant Feeding variables. Two states had no rules that positively addressed obesity prevention in Infant Feeding. (See Appendix H for details.)
Table 4. States with Frequent Obesity Prevention Language in Infant Feeding*
3-4 High Score for Infant Feeding Variables (n=11 variables)
State
Number Variables Fully Meet Standard
(High Rating = 4)
Number Variables
Partially Meet Standard
(High Rating = 3) Sum of
3 & 4 Ratings Rank*
Percent of Variables with High Scores
at Least Partially Meeting
Standards DELAWARE 6 4 10 1 91% ARIZONA 6 3 9
4.5 82%
COLORADO 4 5 9 MASSACHUSETTS 3 6 9 MICHIGAN 4 5 9 MISSISSIPPI 4 5 9 WASHINGTON 6 3 9 ALABAMA 3 5 8
16.5 73%
ALASKA 2 6 8 CALIFORNIA 3 5 8 GEORGIA 3 5 8 HAWAII 3 5 8 IOWA 3 5 8 MARYLAND 3 5 8 MONTANA 2 6 8 NEW MEXICO 2 6 8 NORTH CAROLINA 3 5 8 NORTH DAKOTA 4 4 8 OHIO 3 5 8 OREGON 2 6 8 RHODE ISLAND 2 6 8 SOUTH CAROLINA 2 6 8 UTAH 2 6 8 VIRGINIA 4 4 8 WISCONSIN 2 6 8 *Where two or more states had the same sum of 3 & 4 ratings (center column), an average rank was computed and assigned to those states.
National Resource Center for Health and Safety in Child Care and Early Education - ASHW 2012 17
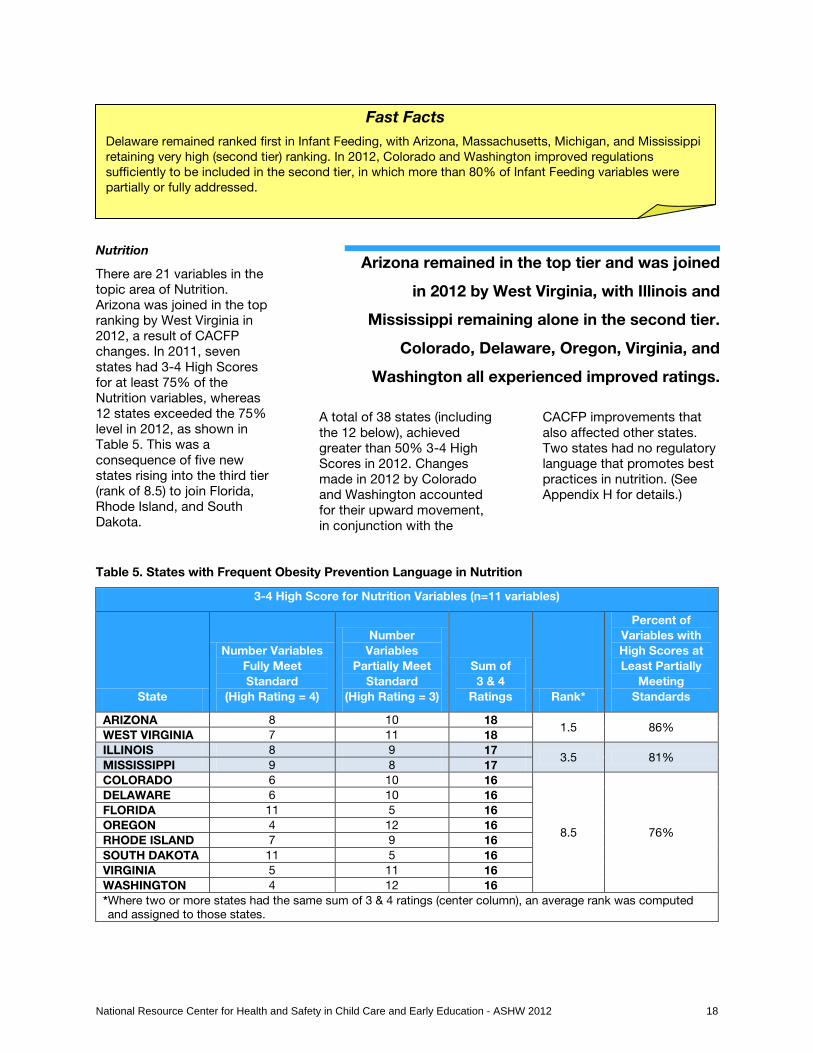
Nutrition
There are 21 variables in the topic area of Nutrition. Arizona was joined in the top ranking by West Virginia in 2012, a result of CACFP changes. In 2011, seven states had 3-4 High Scores for at least 75% of the Nutrition variables, whereas 12 states exceeded the 75% level in 2012, as shown in Table 5. This was a consequence of five new states rising into the third tier (rank of 8.5) to join Florida, Rhode Island, and South Dakota.
A total of 38 states (including the 12 below), achieved greater than 50% 3-4 High Scores in 2012. Changes made in 2012 by Colorado and Washington accounted for their upward movement, in conjunction with the
CACFP improvements that also affected other states. Two states had no regulatory language that promotes best practices in nutrition. (See Appendix H for details.)
Table 5. States with Frequent Obesity Prevention Language in Nutrition
3-4 High Score for Nutrition Variables (n=11 variables)
State
Number Variables Fully Meet Standard
(High Rating = 4)
Number Variables
Partially Meet Standard
(High Rating = 3)
Sum of 3 & 4
Ratings Rank*
Percent of Variables with High Scores at Least Partially
Meeting Standards
ARIZONA 8 10 18 1.5 86%
WEST VIRGINIA 7 11 18 ILLINOIS 8 9 17
3.5 81% MISSISSIPPI 9 8 17 COLORADO 6 10 16
8.5 76%
DELAWARE 6 10 16 FLORIDA 11 5 16 OREGON 4 12 16 RHODE ISLAND 7 9 16 SOUTH DAKOTA 11 5 16 VIRGINIA 5 11 16 WASHINGTON 4 12 16 *Where two or more states had the same sum of 3 & 4 ratings (center column), an average rank was computed and assigned to those states.
Arizona remained in the top tier and was joined
in 2012 by West Virginia, with Illinois and
Mississippi remaining alone in the second tier.
Colorado, Delaware, Oregon, Virginia, and
Washington all experienced improved ratings.
Fast Facts Delaware remained ranked first in Infant Feeding, with Arizona, Massachusetts, Michigan, and Mississippi retaining very high (second tier) ranking. In 2012, Colorado and Washington improved regulations sufficiently to be included in the second tier, in which more than 80% of Infant Feeding variables were partially or fully addressed.
National Resource Center for Health and Safety in Child Care and Early Education - ASHW 2012 18
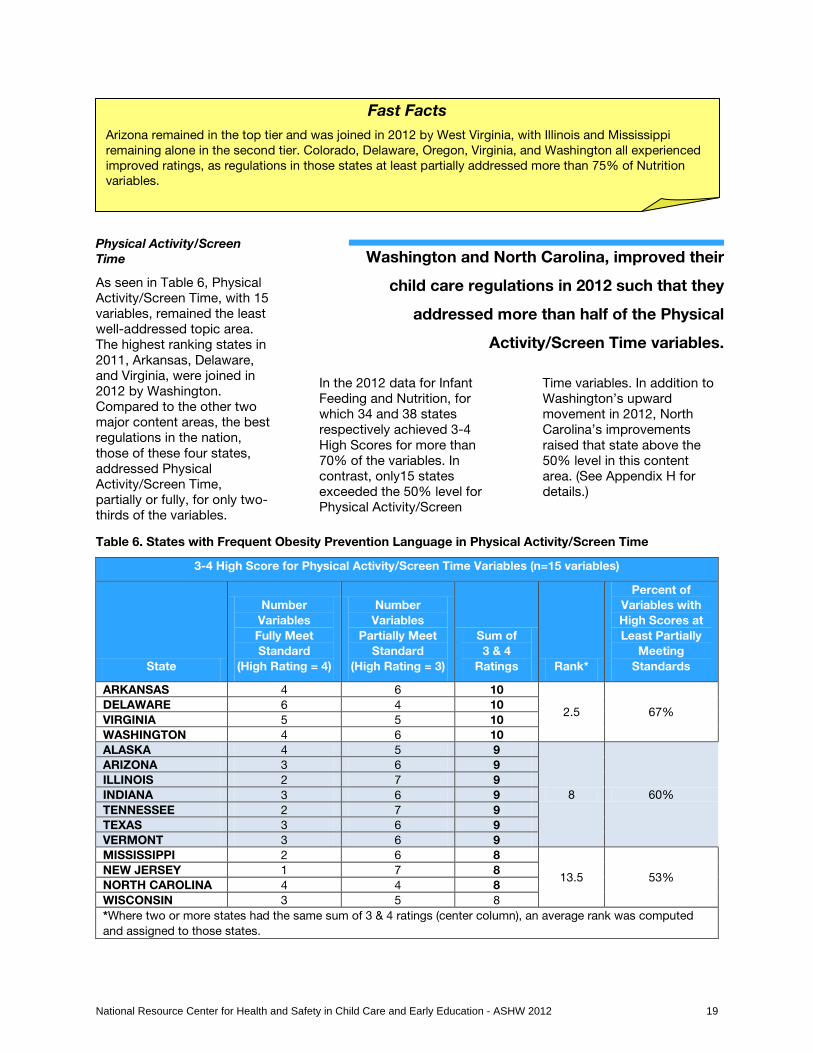
Physical Activity/Screen Time
As seen in Table 6, Physical Activity/Screen Time, with 15 variables, remained the least well-addressed topic area. The highest ranking states in 2011, Arkansas, Delaware, and Virginia, were joined in 2012 by Washington. Compared to the other two major content areas, the best regulations in the nation, those of these four states, addressed Physical Activity/Screen Time, partially or fully, for only two-thirds of the variables.
In the 2012 data for Infant Feeding and Nutrition, for which 34 and 38 states respectively achieved 3-4 High Scores for more than 70% of the variables. In contrast, only15 states exceeded the 50% level for Physical Activity/Screen
Time variables. In addition to Washington’s upward movement in 2012, North Carolina’s improvements raised that state above the 50% level in this content area. (See Appendix H for details.)
Table 6. States with Frequent Obesity Prevention Language in Physical Activity/Screen Time
3-4 High Score for Physical Activity/Screen Time Variables (n=15 variables)
State
Number Variables Fully Meet Standard
(High Rating = 4)
Number Variables
Partially Meet Standard
(High Rating = 3)
Sum of 3 & 4
Ratings Rank*
Percent of Variables with High Scores at Least Partially
Meeting Standards
ARKANSAS 4 6 10
2.5 67% DELAWARE 6 4 10 VIRGINIA 5 5 10 WASHINGTON 4 6 10 ALASKA 4 5 9
8 60%
ARIZONA 3 6 9 ILLINOIS 2 7 9 INDIANA 3 6 9 TENNESSEE 2 7 9 TEXAS 3 6 9 VERMONT 3 6 9 MISSISSIPPI 2 6 8
13.5 53% NEW JERSEY 1 7 8 NORTH CAROLINA 4 4 8 WISCONSIN 3 5 8 *Where two or more states had the same sum of 3 & 4 ratings (center column), an average rank was computed and assigned to those states.
Washington and North Carolina, improved their
child care regulations in 2012 such that they
addressed more than half of the Physical
Activity/Screen Time variables.
Fast Facts Arizona remained in the top tier and was joined in 2012 by West Virginia, with Illinois and Mississippi remaining alone in the second tier. Colorado, Delaware, Oregon, Virginia, and Washington all experienced improved ratings, as regulations in those states at least partially addressed more than 75% of Nutrition variables.
National Resource Center for Health and Safety in Child Care and Early Education - ASHW 2012 19

Variable-Level Analysis
Variable-level analysis identifies individual best practices that were well-represented in child care regulations versus those that were addressed rarely or in a manner contrary to the intent of the PCO2/CFOC3 Healthy Weight standards. Tables 7-9 reveal variables on which half of the states did or did not address the PCO2/CFOC3 Healthy Weight standards expressed in ASHW variables. That is, Tables 7–9 list those variables for which at least half the states: in Table 7, solidly addressed the variable (received a rating
of ‘4’); in Table 8, partially addressed the variable (received a rating of ‘3’ as their highest rating); and in Table 9, did not address the variable at all (received a rating of ‘2’ as their highest rating). Table 10 lists all variables that received any rating = ‘1’ (where any regulations contradict the content of the standard). Table 7 shows the seven variables that were best addressed in 2012. That is, at least half of the states had ratings = 4 for at least one care type. Variable PA1: adequate space for play is unique, as the only Physical
Activity/Screen Time variable on the list, as well as the only variable fully addressed consistently across all states. This is attributable to the building codes in each state that require adequate space per occupant in child care facilities. States’ requirements for adherence to CACFP Meal Patterns were largely responsible for the high scores of the other five variables in this table. The two new CACFP program requirements were responsible for the addition of variables ND1 and NA5 on this list.
Table 7. Variables in Which Standards Were Fully Met by More than Half the States
Highest Ratings in Any Child Care Type = 4, Fully Met Standards
Variable Description Number of States
PA1 Space for active play 51
ND1 Make water available 42
NF1 Appropriate servings 41
IB1 Feed infants on cue 40
NC1 100% juice 39
NA5 Low fat milk > 2 y/o 34
IA2 No cow’s milk < 1yr 31
Fast Fact Two states, Washington and North Carolina, improved their child care regulations in 2012 by addressing more than half of the Physical Activity/Screen Time variables.
Fast Facts ND1: Make water available throughout the day both indoors and outside, and NA5: Serve skim or 1% pasteurized milk to children 2 years of age and older, were newly identified among the most frequently, fully addressed variables, due to new CACFP program requirements.
National Resource Center for Health and Safety in Child Care and Early Education - ASHW 2012 20
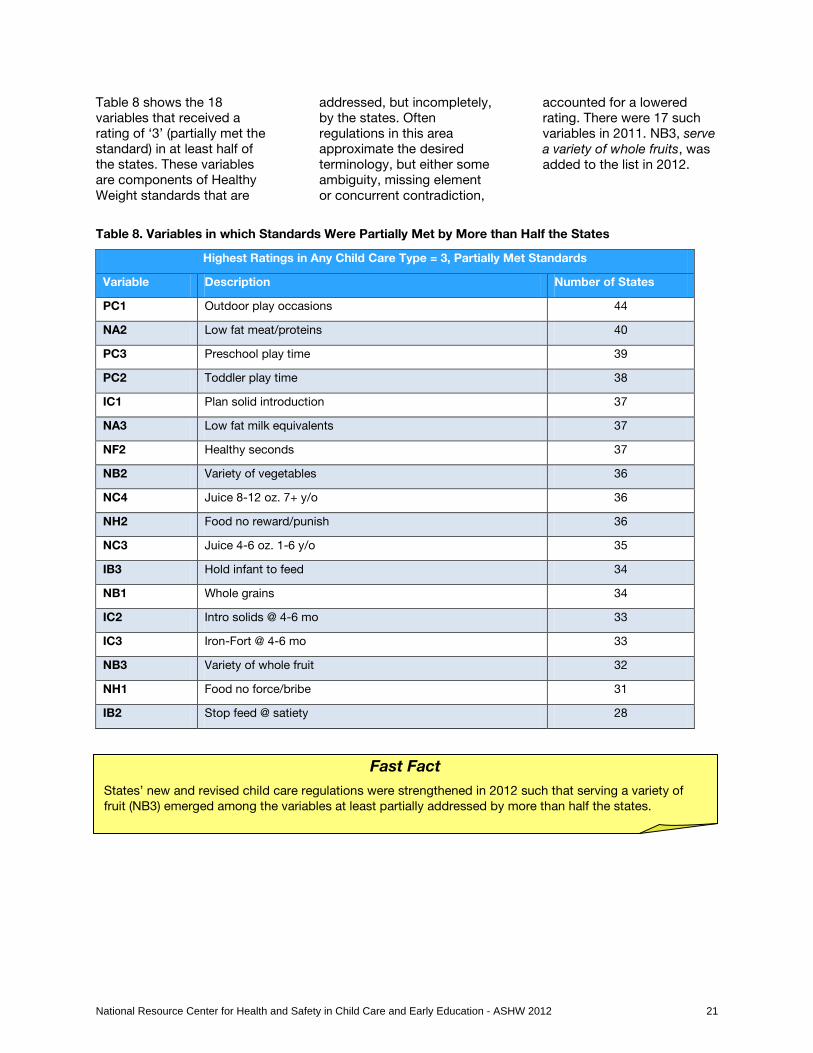
Table 8 shows the 18 variables that received a rating of ‘3’ (partially met the standard) in at least half of the states. These variables are components of Healthy Weight standards that are
addressed, but incompletely, by the states. Often regulations in this area approximate the desired terminology, but either some ambiguity, missing element or concurrent contradiction,
accounted for a lowered rating. There were 17 such variables in 2011. NB3, serve a variety of whole fruits, was added to the list in 2012.
Table 8. Variables in which Standards Were Partially Met by More than Half the States
Highest Ratings in Any Child Care Type = 3, Partially Met Standards
Variable Description Number of States
PC1 Outdoor play occasions 44
NA2 Low fat meat/proteins 40
PC3 Preschool play time 39
PC2 Toddler play time 38
IC1 Plan solid introduction 37
NA3 Low fat milk equivalents 37
NF2 Healthy seconds 37
NB2 Variety of vegetables 36
NC4 Juice 8-12 oz. 7+ y/o 36
NH2 Food no reward/punish 36
NC3 Juice 4-6 oz. 1-6 y/o 35
IB3 Hold infant to feed 34
NB1 Whole grains 34
IC2 Intro solids @ 4-6 mo 33
IC3 Iron-Fort @ 4-6 mo 33
NB3 Variety of whole fruit 32
NH1 Food no force/bribe 31
IB2 Stop feed @ satiety 28
Fast Fact States’ new and revised child care regulations were strengthened in 2012 such that serving a variety of fruit (NB3) emerged among the variables at least partially addressed by more than half the states.
National Resource Center for Health and Safety in Child Care and Early Education - ASHW 2012 21

Table 9 shows the variables that were least often addressed nationwide (rating = 2). In Table 9, a position at the top is not desirable. In 2011, there were 17 such variables. In 2012, the number reduced to 16, as many states received ratings = 4 for the ASHW
variable NA5: Serve skim or 1% pasteurized milk to children 2 years of age and older, as result of CACFP changes.
It remained unchanged that nine of the least addressed variables are in the topic area
of Physical Activity/Screen Time (designated by the letter ‘P’ in the variable code). One variable, PB4, which prohibits TV viewing while eating, remained unaddressed nationwide.
Table 9. Variables in Which No Relevant Content Was Found in More than Half the States
Highest Ratings in Any Child Care Type = 2, No Related Content
Variable Description Number of States
PB4 No TV w/meals 51
PA2 Training on activities 49
PA4 Play with children 48
NE2 Eat with children 47
ID1 Don’t mix formula 45
NA1 Limit oils/fats 45
NC2 Juice only @ meals 45
NG1 Limit salt 45
PA3 Write activity policies 45
NE1 Teach portion sizes 43
PB3 Screen time purpose 42
PE1 Tummy time often 42
PD1 Structured play 40
NA4 Whole milk 1-2 y/o 38
PB2 Screen time 30 min/wk 27
PE2 Limit time infant equip. 26
As in Table 9, a top slot in Table 10 is equally undesirable. Table 10 shows all variables that were contradicted in any state’s regulation. For most of the
12 variables listed, the instances of contradiction are few (5 or less). However, the top three variables, ID2, ID3, and NG2, are commonly contradicted, with
occurrences for at least one care type in more than half of the states. For example, ID2: serve whole fruits, mashed or pureed, for infants 7 months up to 1 year of age (ID2) is
Fast Facts Physical Activity/Screen Time remained the least often addressed domain with 9 variables that were not or rarely addressed in child care regulations. A change to CACFP program requirements vaulted NA5: Serve skim or 1% pasteurized milk to children 2 years of age and older from the one of the least to one of the most addressed variables in the 2012 dataset.
National Resource Center for Health and Safety in Child Care and Early Education - ASHW 2012 22

commonly contradicted, often in regulations that specify an age earlier than 7 months, or by default to CACFP Meal Patterns, which allow serving fruit to infants
at 4 months of age. As explained in 2011, “Paradoxically, states that generally had stronger regulations were also most likely those that had
occasional scores of ‘1.’ That is to say, doing something results in more contradictory language than doing nothing.”
Table 10. Variables in Which Standards Were Contradicted in Any States
Any Ratings in Any Child Care Type = 1, Contradicted the Standards
Variable Description Number of States
ID2 Whole fruit 7 m-1 yr 33
ID3 No juice < 12 mo 32
NG2 Avoid sugary foods 27
NF2 Healthy seconds 5
IA2 No cow’s milk < 1yr 2
PE2 Limit time infant equip. 2
IB1 Feed infants on cue 1
IB3 Hold infant to feed 1
IC2 Intro solids @ 4-6 mo 1
NA3 Low fat milk equivalents 1
NA5 Low fat milk > 2 y/o 2
NC1 100% juice 1
Figure 4, on the following page, complements the preceding tables by graphically depicting the treatment of all variables in child care licensing regulations across the nation in 2012. Variables are presented in rank order by their mean ratings, across all child care types and
states. Individual rows are color coded to show the distribution of rating scores ‘1’-‘4’ for each variable.
In 2012, the predominant single color remains red (representing ratings = 2,), which signifies the extent to which the ASHW variables, as
key components of the PCO2/CFOC3 Healthy Weight standards, fail to be addressed in child care regulations. Appendix I presents more detail on the treatment of individual variables in states’ regulations.
Fast Fact Since the first ASHW report of 2010, CACFP adherence occasionally contributes to states receiving ratings of ‘1’, that is in a few instances the Meal Patterns (2010-2012) contradict the intent of PCO2/CFOC3 Healthy Weight standards.
Fast Fact The most notable difference in treatment of individual variables in the 2012 national dataset is the re-positioning of ND1 and NA5 within the top six variables compared to earlier findings, a direct consequence of the new CACFP program requirements.
National Resource Center for Health and Safety in Child Care and Early Education - ASHW 2012 23

Variable Description Space for active play Make water available Appropriate servings Feed infants on cue 100% juice Low fat milk > 2 y/o No cow’s milk < 1yr Variety of whole fruit Hold infant to feed Food no reward/punish Outdoor play occasions Variety of vegetables Low fat meat/proteins Plan solid introduction Juice 4-6 oz. 1-6 y/o Juice 8-12 oz. 7+ y/o Whole grains Low fat milk equivalents Toddler play time Preschool play time Don’t withhold play Support breastfeeding Healthy seconds Stop feed @ satiety Intro solids @ 4-6 mo Food no force/bribe Iron-Fort @ 4-6 mo Composite No screen time < 2 yr Screen time 30 min/wk Limit time infant equip. Tummy time often Screen time purpose Structured play Whole milk 1-2 y/o Limit salt Write activity policies Juice only @ meals Don’t mix formula Limit oils/fats Teach portion sizes Eat with children Play with children Training on activities No TV w/meals Avoid sugary foods No juice < 12 mo Whole fruit 7 m-1 yr
Figure 4*. Individual Variables
*Figure 4 corrected on 9-18-13 for label transposition errors affecting PA5, IA1, NF2, IB2, PA3, ID1, PA4 and PA2.
National Resource Center for Health and Safety in Child Care and Early Education - ASHW 2012 24

Discussion
This is the second update to the ASHW 2010 baseline assessment by the National Resource Center for Health and Safety in Child Care and Early Education. It presents the cumulative changes that accrued from state-specific text in 2012 new and revised child care licensing regulations of 12 states and from the systemic improvements attributable to two strengthened program requirements of the Child and Adult Care Food Program. Together these improvements discernibly moved the needle slightly forward in reinforcing child care as a factor in prevention of childhood obesity and development of healthy weight habits.
The power of systemic change is evident in the effect of the two CACFP changes reported in the 2012 update. Introduction of the two new CACFP program requirements resulted in more changed ratings in the national data set than did all the state-specific changes of the 12 states combined. When the entire set of CACFP Meal Patterns is revised (as is expected in
2014), those states that require adherence to the CACFP guidelines for some or all regulated care types should experience a substantial effect on their ratings for several ASHW infant feeding and nutrition variables. (Some aspects of the Meal Patterns already are at the ceiling of a rating = 4). Furthermore, the way that states refer child caregivers to the CACFP guidelines may also impact states’ ratings. States that refer caregivers directly to the USDA FNS CACFP website ensure access to the up-to-date Meal Patterns. Those that reproduce the Meal Patterns in their own documents will need to assure that their version is up to date or that caregivers are required to ensure the recency of the reproduced material.
The majority of 2012 changes attributable to state-specific text in new or revised child care licensing regulations were improvements, but the total number was modest across the 12 states that made changes related to PCO2/CFOC3 F healthy weight practices. States that
currently are planning or are engaged in strategic efforts to incorporate PCO2/CFOC3 healthy weight practices in child care licensing regulations now may refer to the NRC’s recent release of Achieving a State of Healthy Weight Rating Scales: Supporting Obesity Prevention Language in Child Care Licensing Regulations. The document presents the rating scales and guidance for each of the 47 ASHW variables, including the type of text that earns the ratings ‘1’ to ‘4.’ States particularly are encouraged to refer to the scales, as well as PCO2 and CFOC3, to support promulgation of rules related to Physical Activity and Screen Time. The data reported in this update reaffirm that content area remains the least addressed of the three domains of child care regulations examined, and disproportionately so. Regulations in this domain are essential to support a balanced approach to development of healthy weight and healthy life course outcomes.
National Resource Center for Health and Safety in Child Care and Early Education - ASHW 2012 25

Notes & References
1 National Resource Center for Health and Safety in Child Care and Early Education, University of Colorado Denver. 2011. Achieving a state of healthy weight: A national assessment of obesity prevention terminology in child care regulations 2010. Aurora, CO.
2 National Resource Center for Health and Safety in Child Care and Early Education. 2012. Achieving a state of healthy weight: 2011 update. Aurora, CO: University of Colorado Denver.
3 Accelerated standards-revision for creation of Preventing Childhood Obesity in Child Care and Early Education Programs: Selected Standards from Caring for Our Children: National Health and Safety Performance Standards; Guidelines for Early Care and Education Programs, 3rd Edition, was made possible by support of the U.S. Department of Health and Human Services, Health Resources and Services Administration, Maternal and Child Health Bureau and the Administration for Children and Families, Child Care Bureau (now Office of Child Care).
4 American Academy of Pediatrics, American Public Health Association, and National Resource Center for Health and Safety in Child Care and Early Education. 2012. Preventing childhood obesity in early care and education: Selected standards from caring for our children: National health and safety performance standards; Guidelines for early care and education programs, 3rd edition. http://nrckids.org/CFOC3/PDFVersion/preventing_obesity.pdf
5 American Academy of Pediatrics, American Public Health Association, National Resource Center for Health and Safety in Child Care and Early Education. 2011. Caring for our children: National health and safety performance standards; Guidelines for early care and education programs, 3rd edition. Elk Grove Village, IL: American Academy of Pediatrics; Washington, DC: American Public Health Association. Also available at http://nrckids.org.
6 Institute of Medicine (IOM). 2011. Early childhood obesity prevention policies. Washington, DC: The National Academies Press.
7 In addition to the 2012 NRC rating team, the NRC gratefully acknowledge the technical assistance of former research assistant Mitchell Johnson, BS, particularly in supporting accuracy of the NRC web site pages on states’ child care licensing regulations.
8 The California document was dated 2011, although the regulations took effect in 2012. 9 In ASHW 2011, it was reported that a 2011 document from the state of Washington had been
uncovered too late to include in the report. Further investigation revealed that the document actually was not made effective until 2012. The document, Chapter 170-296A WAC: Licensed Family Home Child Care Standards, was treated along with other 2012 documents in the current report.
10 See Achieving a State of Healthy Weight Rating Scales @ http://nrckids.org/ASHW/index.html to view the variables-specific scales and guidance for rating.
11 MyPyramid did not address children under age two years. 12 In PCO2, references to MyPyramid made in the first edition were replaced with references to
MyPlate. MyPlate may be viewed at http://www.choosemyplate.gov/. 13 See the Dietary Guidelines for Americans, 2010 @ http://www.cnpp.usda.gov/dietaryguidelines.htm 14 In a few instances, in states that do not require all child care types to adhere to CACFP guidelines,
the state’s own text accounted for the change. In one case, new state text conflicted with the CACFP program requirement, resulting in a lower rating for a care type.
National Resource Center for Health and Safety in Child Care and Early Education - ASHW 2012 26

Appendices
Appendix A. Frequently Used Acronyms
Appendix B. State Documents Searched: 2012
Appendix C. Sample Rating Scales
Appendix D. Source of ASHW Variables in PCO2/CFOC3 Standards
Appendix E. CACFP Rating Rules and Explanation
Appendix F. Individual State Data
Appendix G. Degree to Which States Address Variables: By State
Appendix H. Ranking of All States by All Variables and by Topic Areas
Appendix I. Degree to Which States Address Variables: By Variable
National Resource Center for Health and Safety in Child Care and Early Education - ASHW 2012 27

Appendix A. Frequently Used Acronyms
ASHW Achieving a State of Healthy Weight: A National Assessment of Obesity Prevention Terminology in Child Care Regulations 2010, 2011
CACFP Child and Adult Care Food Program, US Department of Agriculture, Food and Nutrition Service
CFOC2 Caring for Our Children: National Health and Safety Performance Standards; Guidelines for Out-of-Home Child Care Programs, 2nd Edition
CFOC3 Caring for Our Children: National Health and Safety Performance Standards; Guidelines for Out-of-Home Child Care Programs, 3rd Edition
DHHS US Department of Health and Human Services
FNS US Department of Agriculture Food and Nutrition Service
HRSA Health Resources and Service Administration
MCHB Maternal and Child Health Bureau
NRC National Resource Center for Health and Safety in Child Care and Early Education
PCO(PCO2) Preventing Childhood Obesity in Early Care and Education Programs: Selected Standards from Caring for Our Children: National Health and Safety Performance Standards; Guidelines for Early Care and Education Programs, 3rd Edition
USDA US Department of Agriculture
National Resource Center for Health and Safety in Child Care and Early Education - ASHW 2012 28

Appendix B. State Documents Searched: 2012
Although the NRC makes extensive efforts to discover new and revised documents each year through website searches and calls to state child care licensing agencies, a new regulation may go undiscovered and unrated in the year it is made effective. In such a case, the document will be examined and rated as appropriate for inclusion in the ASHW report for year it is discovered. If state licensing personnel are aware of any such documents in their state’s regulatory set, please inform the NRC at [email protected].
STATE DOCUMENT TITLE
New Document
Revised Document
Child care types covered by document
New/revised pertinent content
Date Date previous version C L S
CA California
rated Community Care Licensing Division Child Care Update - Winter/Spring 2011
Winter/Spring 2011 X X X X
CO Colorado rated Rules Regulating Family Child Care Homes 6/1/2012 X X X
rated Rules Regulating Child Care Centers (Less than 24 hrs) 7/1/2012 X X X
General Rules for Child Care Facilities 6/1/2012 8/7/2006 X X X FL Florida
rated 2012 Florida Child Care Statutes Section 402 2012 X X X X
GA Georgia
Child Care Learning Centers 1/1/2012 1/1/2010 X X X
Group Day Care Homes 1/1/2012 1/1/2010 X IA Iowa
rated Chapter 109: Child Care Centers 5/1/2012 6/1/2010 X X X
KS Kansas rated Regulations for Licensing Preschools and Child Care Centers 2/3/2012 7/11/2008 X X
rated Regulations for Licensing Day Care Homes and Group Day Care Homes 2/3/2012 7/8/2011 X X X
National Resource Center for Health and Safety in Child Care and Early Education - ASHW 2012 29

STATE DOCUMENT TITLE
New Document
Revised Document
Child care types covered by document
New/revised pertinent content
Date Date previous version C L S
LA Louisana
Class A Child Day Care Center 1/1/2012 11/1/2003 X
Class B Child Day Care Center 1/1/2012 10/1/2000 X MD Maryland
rated COMAR 13A. 18.- Large Family Child Care Homes 2/6/2012 X X
MT Montana
Licensing Requirements for Child Day Care Centers 7/1/2012 9/1/2006 X
Requirements for Registration of Family and Group Day Care Homes 7/1/2012 9/1/2006 X X
NC North Carolina rated Chapter 110- Article 7 8/1/2012 7/1/2010 X X X X
rated Requirements for Family Child Care Homes 12/1/2012 9/1/2012 X X X
Chapter 9- Child Care Rules 2/1/2012 8/1/2010 X X X NM New Mexico
rated Title 8 Social Services Chapter 16 Part 2- Child Care Centers, Before and After School Programs Family Child Care Homes and Other Early Care and Education Programs 11/30/2012 6/1/2010 X X X X
NV Nevada rated Chapter 432A Services and Facilities for Care of Children 8/1/2012 1/1/2010 X X X X
TX Texas
rated Chapter 746: Minimum Standard Rules For Licensed Child-Care Centers (replacement pages) 3/1/2012 3/1/2008 X X X X
rated Chapter 747: Minimum Standard Rules for Registered and Licensed Child-Care Homes (replacement pages) 3/1/2012 6/1/2008 X X X
UT Utah
National Resource Center for Health and Safety in Child Care and Early Education - ASHW 2012 30

STATE DOCUMENT TITLE
New Document
Revised Document
Child care types covered by document
New/revised pertinent content
Date Date previous version C L S
R430-50 Residential Certificate Child Care Standards 5/1/2012 2/1/2011 X
R430-100 Child Care Centers 5/2/2012 7/1/2099 X
R430-90 Licensed Family Child Care 5/3/2012 2/1/2011 X VA Virginia
Standards for Licensed Child Day Centers 11/1/2012 3/6/2008 X WA Washington
Chapter 170-295 WAC Minimum requirements for child care centers 4/17/2012 5/31/2008 X
rated Chapter 170-296A Licensed family home child care standards 5/8/2012 5/31/2008 X X X
WV West Virginia
Title 78, Series 18, Family Child Care Facility Licensing Requirements 5/10/2012 7/1/2007 X
Title 78, Series 19, Family Child Care Home Registration Requirements 5/10/2012 7/1/2007 X
WY Wyoming
Chapter 1- Administrative Rules 4/1/2012 9/1/2008 X X X
Chapter 2- Administrative Rules 4/1/2012 9/1/2008 X X X
Chapter 3- Administrative Rules 4/1/2012 9/1/2008 X X X
Chapter 4- Administrative Rules 4/1/2012 9/1/2008 X X X
Chapter 5- Administrative Rules 4/1/2012 9/1/2008 X X X
Chapter 8- Administrative Rules 4/1/2012 9/1/2008 X X X
Chapter 9- Administrative Rules 4/1/2012 9/1/2008 X X X
National Resource Center for Health and Safety in Child Care and Early Education - ASHW 2012 31

STATE DOCUMENT TITLE
New Document
Revised Document
Child care types covered by document
New/revised pertinent content
Date Date previous version C L S
rated Chapter 6 Administrative Rules for Certification of Child Care facilities Rules relating specifically to Family Child Care Homes 4/1/2012 9/1/2008 X X X X
rated Chapter 7 Administrative Rules for Certification of Child Care facilities Rules relating specifically to Family Child Care Centers 4/1/2012 9/1/2008 X X X X
National Resource Center for Health and Safety in Child Care and Early Education - ASHW 2012 32

Appendix C. Sample Rating Scales
Figure A. Sample Rating Scale for an Uncomplicated Study Variable
(From the Physical Activity/Screen Time Topic Area) Develop written policies on the promotion of physical activity and the removal of potential barriers to physical activity participation.
Assign ratings as follows for state rules that:
1 =Contradict the standard component
2 =Do not mention policies on promotion of physical activity or on removal of barriers to activity (Raters: Both promotion and removal of barriers are absent.)
3 =State one of the following (but not both):
-Require/recommend policies on the promotion of physical activity OR
-Require/recommend policies on removal of potential barriers to physical activity participation
4 = State both of the following:
-Require/recommend written policies on the promotion of physical activity AND
-Require/recommend written policies on removal of potential barriers to physical activity participation
National Resource Center for Health and Safety in Child Care and Early Education - ASHW 2012 33

Figure B. Sample Rating Scale for a Complicated Study Variable with Additional Rating Rules
(From the Infant Feeding Topic Area) Serve human milk or infant formula to at least age 12 months, not cow's milk, unless written exception is provided by primary care provider and parent/guardian.
Assign ratings as follows for state rules that:
1 =Permit cow’s milk for infants under 12 months (explicitly), without primary care provider and parent/guardian written exception
2 =Do not mention prohibiting cow’s milk nor serving only human milk or infant formula for infants less than 12 months of age
3 =State one or both of the following with some limitation/contradictory statement in either or both (other than written exception by primary care provider and parent/guardian): -Prohibit cow’s milk until at least 12 months of age -Require/recommend human milk and/or formula for infants until at least 12
months of age
4 =State one or both of the following: -Prohibit cow’s milk until at least 12 months of age, unless written exception by
primary care provider and parent/guardian AND/OR
-Require human milk or formula for infants until at least 12 months of age
NOTE: If a state refers to CACFP* without additional pertinent text, the rating = 4 because the Meal Plan requires human milk or formula for children under the age of 12 months.
* CACFP refers to the Meal Patterns of the U.S. Department of Agriculture Food and Nutrition Service Child and Adult Care Food Program. Many states require adherence to the Meal Patterns. CFOC and PCO include standards that refer to these requirements/recommendations, as well. The CACFP Meal Patterns were scored on the study variables to inform ratings of states that require them.
National Resource Center for Health and Safety in Child Care and Early Education - ASHW 2012 34

Appendix D. Source of ASHW Variables in PCO2/CFOC3 Standards
The following table displays the source standards in PCO2 and CFOC3 from which the ASHW study variables were derived. The link to the NRC’s searchable CFOC3 data base (http://cfoc.nrckids.org/index.cfm ) enables viewing the complete standard(s), rationale, references and related standards for each study variable. The page numbers of source standards in the print copies of PCO2 and CFOC3 also are provided.
Multiple source variables. The concepts captured in some ASHW variables are present in different contexts in more than one PCO2/CFOC3 standard. For example, the Infant Feeding variable IB2: do not feed beyond satiety, is a core concept that is addressed slightly differently in two standards: Standard 4.3.1.2 - Feeding Infants on Cue by a Consistent Caregiver/Teacher (“observing satiety cues can limit overfeeding”) and Standard 4.3.1.8 - Techniques for Bottle Feeding ("Allow infant to stop the feeding”). The table below identifies those ASHW variables that were informed by more than one standard, including the numbers and names of the standards.
Supplementary components. The ASHW 2010 baseline report described the empirical process by which high impact variables were identified in the expert workgroup convened in the NRC 2010 Healthy Weight Meeting. When, as detailed in ASHW 2010, selection criteria were applied to data generated by the workgroup, a few gaps in representation of age ranges and constructs emerged. NRC staff addressed these gaps by adding supplementary components to create full coverage of all ages and parallel constructs across content areas (in general, supplementary components were quite close to the statistical cut-off point for variable selection). These supplementary components are identified in the table below where an ASHW variable number (listed in the first column in the table below) is followed by the symbol “.” The rationale for addition of the supplementary component is also provided.
National Resource Center for Health and Safety in Child Care and Early Education - ASHW 2012 35

INFANT FEEDING
ASHW Variable #
ASHW Variable Text
2010 Healthy Weight Advisors High Impact Components (component #)
Source of Variable in CFOC3 Standards: Print copy pg #
PCO2 CFOC3
IA1 Encourage and support breastfeeding and
feeding of breast milk by making
arrangements for mothers to feed their
children comfortably on-site.
Encourage and support breastfeeding and
feeding of breast milk by making
arrangements for mothers to feed their
children comfortably on-site (# 64)
4.3.1.1 - General Plan for Feeding Infants
26 162
IA2 Serve human milk or infant formula to at
least age 12 months, not cow's milk, unless
written exception is provided by primary
care provider and parent/guardian.
Serve human milk or infant formula to at
least age 12 months, not cow's milk, unless
written exception is provided by primary
care provider and parent/guardian (#15)
4.3.1.7 - Feeding Cow's Milk &
4.2.0.4 - Categories of Foods
39
&
18
169
&
155
IB1 Feed infants on cue. Feed infants on cue (#68) 4.3.1.2 - Feeding Infants on Cue by a Consistent Caregiver/Teacher & 4.3.1.8 - Techniques for Bottle Feeding
27
&
33
164
&
170
IB2 Do not feed infants beyond satiety; Allow
infant to stop the feeding.
Do not feed infants beyond satiety; &
Allow infant to stop the feeding (#s70 &
101)
4.3.1.2 - Feeding Infants on Cue by a Consistent Caregiver/Teacher & 4.3.1.8 - Techniques for Bottle Feeding
27
&
33
164
&
170
IB3
Hold infants while bottle feeding; Position
an infant for bottle feeding in the
caregiver/teacher's arms or sitting up on
the caregiver/teacher’s lap.
Hold infants while bottle feeding; &
Position an infant for bottle feeding in the
caregiver/teacher's arms or sitting up on
the caregiver/teacher’s lap (#s100 & 101)
4.3.1.8 - Techniques for Bottle Feeding
33 170
National Resource Center for Health and Safety in Child Care and Early Education - ASHW 2012 36

INFANT FEEDING
ASHW Variable #
ASHW Variable Text
2010 Healthy Weight Advisors High Impact Components (component #)
Source of Variable in CFOC3 Standards: Print copy pg #
PCO2 CFOC3
IC1 Develop a plan for introducing age-
appropriate solid foods (complementary
foods) in consultation with the child’s
parent/guardian and primary care
provider.
Develop a plan for introducing age-
appropriate solid foods (complementary
foods) in consultation with the child’s
parent/guardian and primary care provider
(#127)
4.3.1.11 - Introduction of Age-Appropriate Solid Foods to Infants
35 172
IC2 Introduce age-appropriate solid foods (128
a) no sooner than 4 months of age, and
preferably around 6 months of age.
Introduce age-appropriate solid foods no
sooner than 4 months of age, and
preferably around 6 months of age, and as
indicated by the individual child's
nutritional and developmental needs in
consultation with child’s parent/guardian
and primary care provider (#128)
4.3.1.11 - Introduction of Age-Appropriate Solid Foods to Infants
35 172
IC3 Introduce breastfed infants gradually to
iron-fortified foods no sooner than four
months of age, but preferably around six
months to complement the human milk.
Introduce breastfed infants gradually to
iron-fortified foods no sooner than four
months of age, but preferably around six
months to complement the human milk
(#129)
4.3.1.11 - Introduction of Age-Appropriate Solid Foods to Infants
35 172
ID1 Do not feed an infant formula mixed with
cereal, fruit juice or other foods unless the
primary care provider provides written
instruction.
Do not feed an infant formula mixed with
cereal, fruit juice or other foods unless the
primary care provider provides written
instruction (#96)
4.3.1.5 - Preparing, Feeding, and Storing Infant Formula
31 167
ID2 Serve whole fruits, mashed or pureed, for
infants 7 months up to one year of age. Serve whole fruits, mashed or pureed, for
infants 7 months up to one year of age
(#11)
4.2.0.4 - Categories of Foods 18 155
National Resource Center for Health and Safety in Child Care and Early Education - ASHW 2012 37

INFANT FEEDING
ASHW Variable #
ASHW Variable Text
2010 Healthy Weight Advisors High Impact Components (component #)
Source of Variable in CFOC3 Standards: Print copy pg #
PCO2 CFOC3
ID3 Serve no fruit juice to children younger
than 12 months of age. Serve no fruit juice to children younger
than 12 months of age (#12)
4.2.0.4 - Categories of Foods & 4.2.0.7 - 100% Fruit Juice
18
&
21
155
&
157
NUTRITION
ASHW Variable #
ASHW Variable Text
2010 Healthy Weight Advisors High Impact Components (component #)
Source of Variable in CFOC3 Standards: Print copy pg #
PCO2 CFOC3
NA1 Limit oils by choosing monounsaturated
and polyunsaturated fats (such as olive oil
or safflower oil) and avoiding trans fats,
saturated fats and fried foods.
Limit oils by choosing monounsaturated
and polyunsaturated fats (such as olive oil
or safflower oil) and avoiding trans fats,
saturated fats and fried foods. (#20)
4.2.0.4 - Categories of Foods 18 155
NA2 Serve meats and/or beans - chicken, fish,
lean meat, and/or legumes (such as dried
peas, beans), avoiding fried meats.
Serve meats and/or beans - chicken, fish,
lean meat, and/or legumes (such as dried
peas, beans), avoiding fried meats. (#19)
4.2.0.4 - Categories of Foods 18 155
NA3 Serve other milk equivalent products such
as yogurt and cottage cheese, using low-fat
varieties for children 2 years of age and
older.
Serve other milk equivalent products such
as yogurt and cottage cheese, using low-fat
varieties for children 2 years of age and
older. (#18)
4.2.0.4 - Categories of Foods 18 155
NA4 Serve whole pasteurized milk to twelve to
twenty-four month old children who are
not on human milk or prescribed formula,
or serve reduced fat (2%) pasteurized milk
to those who are at risk for
hypercholesterolemia or obesity
Serve whole pasteurized milk to twelve to
twenty-four month old children who are
not on human milk or prescribed formula,
or serve reduced fat (2%) pasteurized milk
to those who are at risk for
hypercholesterolemia or obesity. (#152)
4.3.2.3 - Encouraging Self-Feeding by Older Infants and Toddlers
39 175
National Resource Center for Health and Safety in Child Care and Early Education - ASHW 2012 38

NUTRITION
ASHW Variable #
ASHW Variable Text
2010 Healthy Weight Advisors High Impact Components (component #)
Source of Variable in CFOC3 Standards: Print copy pg #
PCO2 CFOC3
NA5 Serve skim or 1% pasteurized milk to
children two years of age and older.
Serve skim or 1% pasteurized milk to
children two years of age and older. (#153)
4.3.2.3 - Encouraging Self-Feeding by Older Infants and Toddlers
39 175
NB1 Serve whole grain breads, cereals, and
pastas.
Serve whole grain breads, cereals, and
pastas. (#8)
4.2.0.4 - Categories of Foods 18 155
NB2 Serve vegetables, specifically, dark green,
orange, deep yellow vegetables; and root
vegetables, such as potatoes and viandas.
Serve vegetables, specifically, dark green,
orange, deep yellow vegetables; and root
vegetables, such as potatoes and viandas.
(#9)
4.2.0.4 - Categories of Foods 18 155
NB3 Serve fruits of several varieties, especially
whole fruits.
Serve fruits of several varieties, especially
whole fruits. (#10)
4.2.0.4 - Categories of Foods 18 155
NC1 Use only 100% juice with no added
sweeteners.
Use only 100% juice with no added
sweeteners, and offer only during meal
times. (#39a)
4.2.0.7 - 100% Fruit Juice 21 157
NC2 Offer juice only during meal times. Use only 100% juice with no added
sweeteners; and offer only during meal
times. (#39b)
4.2.0.7 - 100% Fruit Juice 21 157
NC3 Serve no more than 4 to 6 oz juice/day for
children 1-6 years of age.
Serve no more than 4 to 6 oz juice/day for
children 1-6 years of age. (#13)
4.2.0.4 - Categories of Foods & 4.2.0.7 - 100% Fruit Juice
17
&
21
155
&
157
NC4 Serve no more than 8 to 12 oz juice/day for
children 7-12 years of age.
Serve no more than 8 to 12 oz juice/day for
children 7-12 years of age. (#14)
4.2.0.4 - Categories of Foods & 4.2.0.7 - 100% Fruit Juice
18
&
21
155
&
157
National Resource Center for Health and Safety in Child Care and Early Education - ASHW 2012 39

NUTRITION
ASHW Variable #
ASHW Variable Text
2010 Healthy Weight Advisors High Impact Components (component #)
Source of Variable in CFOC3 Standards: Print copy pg #
PCO2 CFOC3
ND1
Make water available both inside and
outside.
Make water available inside and outside.
(#34)
Supplementary Component Rationale:
Completed coverage of beverage content,
given restrictions on juice and elimination
of sweetened beverages, water is beverage
of default (after infancy).
4.2.0.6 - Availability of Drinking Water
20 157
NE1
Teach children appropriate portion size by
using plates, bowls and cups that are
developmentally appropriate to their
nutritional needs.
Teach children appropriate portion size by
using plates, bowls and cups that are
developmentally appropriate to their
nutritional needs; & Teach children about
appropriate portion sizes. (#s 147 & 205)
4.3.2.2 - Serving Size for Toddlers and Preschoolers &
4.7.0.1 - Nutrition Learning Experiences for Children
38
&
46
174
&
183
NE2 Require adults eating meals with children
to eat items that meet nutrition standards.
Require adults eating meals with children
to eat items that meet nutrition standards.
(#163)
4.5.0.4 - Socialization During Meals 41 179
NF1 Serve small-sized, age-appropriate
portions.
Serve small-sized, age-appropriate
portions. (#144)
4.3.2.2 - Serving Size for Toddlers and Preschoolers
38 174
NF2 NF2
Permit children to have one or more
additional servings of the nutritious foods
that are low in fat, sugar, and sodium as
needed to meet the caloric needs of the
individual child; Teach children who
require limited portions about portion size
and monitor their portions.
Permit children to have one or more
additional servings of the nutritious foods
that are low in fat, sugar, and sodium as
needed to meet the caloric needs of the
individual child; & Teach children who
require limited portions about portion size
and monitor their portions. (#s 145 & 168)
4.3.2.2 - Serving Size for Toddlers and Preschoolers
& 4.5.0.4 - Socialization During Meals
38
&
41
174
&
179
National Resource Center for Health and Safety in Child Care and Early Education - ASHW 2012 40

NUTRITION
ASHW Variable #
ASHW Variable Text
2010 Healthy Weight Advisors High Impact Components (component #)
Source of Variable in CFOC3 Standards: Print copy pg #
PCO2 CFOC3
NG1
Limit salt by avoiding salty foods such as
chips and pretzels.
Limit salt by avoiding salty foods such as
chips and pretzels. (#22)
Supplementary Component Rationale:
Completed Nutrition content--foods to
limit/avoid
4.2.0.4 - Categories of Foods 18 155
NG2 Avoid sugar, including concentrated sweets
such as candy, sodas, sweetened drinks,
fruit nectars, and flavored milk.
Avoid sugar, including concentrated sweets
such as candy, sodas, sweetened drinks,
fruit nectars, and flavored milk. (#21)
4.2.0.4 - Categories of Foods 18 155
NH1 Do not force or bribe children to eat. Do not force or bribe children to eat.
(#183)
4.5.0.11 - Prohibited Uses of Food 43 182
NH2 Do not use food as a reward or
punishment.
Do not use food as a reward or
punishment. (#184)
4.5.0.11 - Prohibited Uses of Food 43 182
PHYSICAL ACTIVITY/SCREEN TIME
ASHW Variable #
ASHW Variable Text
2010 Healthy Weight Advisors High Impact Components (component #)
Source of Variable in CFOC3 Standards: Print copy pg #
PCO2 CFOC3
PA1 Provide children with adequate space for
both inside and outside play.
Provide children with adequate space for
both inside and outside play. (#237)
3.1.3.1 - Active Opportunities for Physical Activity
51 90
PA2 Provide orientation and annual training
opportunities for caregivers/teachers to
learn about age-appropriate gross motor
activities and games that promote
children’s physical activity.
Provide orientation and annual training
opportunities for caregivers/teachers to
learn about age-appropriate gross motor
activities and games that promote
children’s physical activity. (#256)
3.1.3.4 - Caregivers'/Teachers' Encouragement of Physical Activity
57 95
National Resource Center for Health and Safety in Child Care and Early Education - ASHW 2012 41

PHYSICAL ACTIVITY/SCREEN TIME
ASHW Variable #
ASHW Variable Text
2010 Healthy Weight Advisors High Impact Components (component #)
Source of Variable in CFOC3 Standards: Print copy pg #
PCO2 CFOC3
PA3 Develop written policies on the promotion
of physical activity and the removal of
potential barriers to physical activity
participation.
Develop written policies on the promotion
of physical activity and the removal of
potential barriers to physical activity
participation. (#258)
9.2.3.1 - Policies and Practices that Promote Physical Activity
58 353
PA4 Require caregivers/teachers to promote
children’s active play, and participate in
children’s active games at times when they
can safely do so.
Require caregivers/teachers to promote
children’s active play, and participate in
children’s active games at times when they
can safely do so. (#250)
3.1.3.4 - Caregivers'/Teachers' Encouragement of Physical Activity
57 95
PA5
Do not withhold active play from children
who misbehave, although out-of-control
behavior may require five minutes or less
calming periods to help the child settle
down before resuming cooperative play or
activities.
Do not withhold active play from children
who misbehave, although out-of-control
behavior may require five minutes or less
calming periods to help the child settle
down before resuming cooperative play or
activities. (#233)
Supplementary Component Rationale:
Addresses prohibited uses of physical
activity; theoretical equivalent of
prohibited use of food.
3.1.3.1 - Active Opportunities for Physical Activity
51 90
PB1
Do not utilize media (television [TV], video,
and DVD) viewing and computers with
children younger than two years.
Do not utilize media (television [TV], video,
and DVD) viewing and computers with
children younger than two years. (#269)
Supplementary Component Rationale:
Completed age range coverage
2.2.0.3 - Limiting Screen Time – Media, Computer Time
59 66
National Resource Center for Health and Safety in Child Care and Early Education - ASHW 2012 42

PHYSICAL ACTIVITY/SCREEN TIME
ASHW Variable #
ASHW Variable Text
2010 Healthy Weight Advisors High Impact Components (component #)
Source of Variable in CFOC3 Standards: Print copy pg #
PCO2 CFOC3
PB2 Limit total media time for children two
years and older to not more than 30
minutes once a week; Limit screen time
(TV, DVD, computer time).
Limit total media time for children two
years and older to not more than 30
minutes once a week; Limit screen time
(TV, DVD, computer time). (#s 270a & 257)
2.2.0.3 - Limiting Screen Time – Media, Computer Time & 3.1.3.4 - Caregivers'/Teachers' Encouragement of Physical Activity
59
&
57
66
&
95
PB3 Use screen media with children age two
years and older only for educational
purposes or physical activity.
Use [screen media] only for educational
purposes or physical activity; Limit screen
time ) (#s 270 b & 257)
2.2.0.3 - Limiting Screen Time – Media, Computer Time
59 66
PB4 Do not utilize TV, video, or DVD viewing
during meal or snack time.
Do not utilize TV, video, or DVD viewing
during meal or snack time. (#271)
2.2.0.3 - Limiting Screen Time – Media, Computer Time
59 66
PC1 Provide daily for all children, birth to six
years, two to three occasions of active play
outdoors, weather permitting.
Provide daily for all children, birth to six
years, two to three occasions of active play
outdoors, weather permitting. (#221)
3.1.3.1 - Active Opportunities for Physical Activity
51 90
PC2 Allow toddlers sixty to ninety minutes per
eight-hour day for vigorous physical
activity.
Allow toddlers sixty to ninety minutes per
eight-hour day for vigorous physical
activity. (#226)
3.1.3.1 - Active Opportunities for Physical Activity
51 90
PC3 Allow preschoolers ninety to one-hundred
and twenty minutes per eight-hour day for
vigorous physical activity.
Allow preschoolers ninety to one-hundred
and twenty minutes per eight-hour day for
vigorous physical activity. (# 227)
3.1.3.1 - Active Opportunities for Physical Activity
52 90
National Resource Center for Health and Safety in Child Care and Early Education - ASHW 2012 43

PHYSICAL ACTIVITY/SCREEN TIME
ASHW Variable #
ASHW Variable Text
2010 Healthy Weight Advisors High Impact Components (component #)
Source of Variable in CFOC3 Standards: Print copy pg #
PCO2 CFOC3
PD1
Provide daily for all children, birth to six
years, two or more structured or
caregiver/ teacher/ adult-led activities or
games that promote movement over the
course of the day—indoor or outdoor.
Provide daily for all children, birth to six
years, two or more structured or
caregiver/teacher/adult-led activities or
games that promote movement over the
course of the day—indoor or outdoor; &
Require caregivers/teachers to lead
structured activities to promote children’s
activities two or more times per day. (#s
222 & 251; 222 entirely encompasses 251)
3.1.3.1 - Active Opportunities for Physical Activity & 3.1.3.4 - Caregivers'/Teachers' Encouragement of Physical Activity
51
&
57
90
&
95
PE1
Ensure that infants have supervised tummy
time every day when they are awake.
Ensure that infants have supervised tummy
time every day when they are awake.
(#228)
Supplementary Components Rationale:
Completed Physical Activity coverage of
age ranges (infants), with 235 (below)
3.1.3.1 - Active Opportunities for Physical Activity
51 90
PE2
Use infant equipment such as swings,
stationary activity centers (ex.
exersaucers), infant seats (ex. bouncers),
molded seats, etc. only for short periods of
time if at all.
Use infant equipment such as swings,
stationary activity centers (ex.
exersaucers), infant seats (ex. bouncers),
molded seats, etc. only for short periods of
time if at all. (#235)
Supplementary Components Rationale:
Completed Physical Activity coverage of
age ranges (infants), with 228 (above)
3.1.3.1 - Active Opportunities for Physical Activity
51 90
National Resource Center for Health and Safety in Child Care and Early Education - ASHW 2012 44

Appendix E. CACFP Rating Rules and Explanation (NRC revised 2012)
This appendix includes:
a) Table 1 - listing ASHW Nutrition and Infant Feeding variables and the associated CACFP ratings, as well as the explanation of the ratings;
b) Table 2 - listing states that require some or all licensed child care types to adhere to CACFP guidelines (see end of table for My Pyramid note); and,
c) Table 3 – listing states with changed ratings for 2011/12 for AHSW variables NA5 and ND1, associated with 2011 CACFP program requirements regarding milk and water, and/or state-specific text.
Table 1. Ratings of CACFP on ASHW Variables
Code Variable Description CACFP Rating
Explanation of CACFP Rating
Nutrition
NA1
Limit oils by choosing monounsaturated and polyunsaturated fats (such as olive oil or safflower oil) and avoiding trans fats, saturated fats and fried foods.
2
The rating Oils and fats are not addressed in the CACFP Meal Pattern.
The state receives this rating if they refer to CACFP without additional text.
NA2
Serve meats and/or beans - chicken, fish, lean meat, and/or legumes (such as dried peas, beans), avoiding fried meats.
3
Lean meats and/or beans are recommended in the CACFP Meal Pattern, but the avoidance of fried meats is not stated specifically.
The state receives this rating if they refer to CACFP without additional or contradicting text.
NA3
Serve other milk equivalent products such as yogurt and cottage cheese, using low-fat varieties for children 2 years of age and older.
3
CACFP Meal Pattern does not specify recommended milk fat content.
The state receives this rating if they refer to CACFP without additional or contradicting text pertinent to milk equivalents.
NA4
Serve whole pasteurized milk to twelve to twenty-four month old children who are not on human milk or prescribed formula, or serve reduced fat (2%) pasteurized milk to those who are at risk for hypercholesterolemia or obesity.
2
CACFP Meal Pattern does not specify recommended milk fat content for this age range.
The state receives this rating if they refer to CACFP without additional text pertinent to fat content.
NA5 Serve skim or 1% pasteurized milk to children two years of age and older.
4
CACFP 2011 program requirements specifies serving skim or 1% pasteurized milk to children 2 years of age and older.
The state receives this rating if they refer to CACFP without additional contradictory text.
NB1 Serve whole grain breads, cereals, and pastas.
3
CACFP Meal Pattern includes whole grain breads, but also allows choice of serving enriched grain products. They do not specify all or a percentage that must be whole grain.
The state receives this rating if they refer to CACFP without additional or contradicting text.
NB2 Serve vegetables, specifically, dark green, orange, deep yellow vegetables, and root
3 CACFP recommends vegetables, but does not provide specification on variety and/or
National Resource Center for Health and Safety in Child Care and Early Education - ASHW 2012 45

Code Variable Description CACFP Rating
Explanation of CACFP Rating
vegetables, such as potatoes and viandas.
type.
The state receives this rating if they refer to CACFP without additional or contradicting text.
NB3 Serve fruits of several varieties, especially whole fruits.
3
CACFP recommends fruits, but does not provide specification on variety and/or wholeness.
The state receives this rating if they refer to CACFP without additional or contradicting text.
NC1
Use only 100% juice with no added sweeteners (and NC2 (rater later) and offer only during meal time).
4
CACFP recommends full strength (that is, 100%) fruit juice.
The state receives this rating if they refer to CACFP without additional or contradicting text.
NC2
(NC1 (rated above) Use only 100% juice with no added sweeteners”, and) offer only during meal times.
2
CACFP does not prohibit serving fruit juice at non-meal times.
The state receives this rating if they refer to CACFP without additional text.
NC3 Serve no more than 4 to 6 oz juice/day for children 1-6 years of age.
3
CACFP sets limits per meal or snack, which may exceed CFOC daily limit over the course of a day.
The state receives this rating if they refer to CACFP without additional or contradicting text.
NC4 Serve no more than 8 to 12 oz juice/day for children 7-12 years of age.
3
CACFP sets limits per meal or snack, which may exceed CFOC daily limit over the course of a day.
The state receives this rating if they refer to CACFP without additional or contradicting text.
ND1 Make water available both inside and outside.
4
CACFP 2011 program requirements specify making water available throughout the day and upon request. Upon request is interpreted as covering all locations, indoors and outside. The state receives this rating if they refer to CACFP without additional, contradictory text.
NE1
Teach children about appropriate portion sizes; AND, Teach children appropriate portion size by using plates, bowls and cups that are developmentally appropriate to their nutritional needs.
2
CACFP Meal Pattern does not address teaching, nor does it address tableware (except the term “cup” as a measure).
The state receives this rating if they refer to CACFP without additional text pertinent to “teaching”.
NE2 Require adults eating meals with children to eat items that meet nutrition standards.
2
CACFP Meal Pattern does not mention adults eating meals with children.
The state receives this rating if they refer to CACFP without additional text pertinent to adults eating with children.
NF1 Serve small-sized, age-appropriate portions. 4 CACFP recommends portion sizes based on age.
National Resource Center for Health and Safety in Child Care and Early Education - ASHW 2012 46

Code Variable Description CACFP Rating
Explanation of CACFP Rating
The state receives this rating if they refer to CACFP without additional or contradicting text.
NF2
Permit children to have one or more additional servings of the nutritious foods that are low in fat, sugar, and sodium as needed to meet the caloric needs of the individual child; AND, Teach children who require limited portions about portion size and monitor their portions. (Controlling Portions/Portion Size)
3
CACFP sets minimums for all children and allows additional portions for infants as needed and for older children (does not address limiting potions or individual caloric need overall).
The state receives this rating if they refer to CACFP without additional or contradicting text.
NG1 Limit salt by avoiding salty foods such as chips and pretzels.
2
Salt content of foods is not addressed the CACFP Meal Pattern.
The state receives this rating if they refer to CACFP without additional text pertinent to limiting salt.
NG2
Avoid sugar, including concentrated sweets such as candy, sodas, sweetened drinks, fruit nectars, and flavored milk.
1
CACFP Meal Pattern allows sweetened yogurt.
The state receives this rating if they refer to CACFP without additional text pertinent to sugar and sweets.
NH1 Do not force or bribe children to eat.
2
CACFP Meal Pattern does not mention force or bribery related to eating.
The state receives this rating if they refer to CACFP without additional text pertinent to forcing or bribing a child to eat.
NH2 Do not use food as a reward or punishment.
2
CACFP Meal Pattern does not mention using food as a reward or punishment.
The state receives this rating if they refer to CACFP without additional text pertinent to using food as a punishment or reward.
Infant Feeding Components
IA1
Encourage and support breastfeeding and feeding of breast milk by making arrangements for mothers to feed their children comfortably on-site.
3
“Breast milk” is recommended in the CACFP Meal Pattern, but arrangements for breastfeeding are not mentioned.
The state receives this rating if they refer to CACFP without additional text or contradicting.
IA2
Serve human milk or infant formula to at least age 12 months, not cow's milk, unless written exception is provided by primary care provider and parent/guardian.
4
CACFP Meal Plan requires human milk or formula for children under the age of 12 months.
The state receives this rating if they refer to CACFP without additional or contradicting text.
IB1 Feed infants on cue.
4
CACFP Meal Pattern includes language that implies responsiveness to infant cues.1
The state receives this rating if they refer to
1 From CACFP Meal Pattern Infant charts: “For some breastfed infants who regularly consume less than the
minimum amount of breastmilk per feeding, a serving of less than the minimum amount of breastmilk may be offered, with additional breastmilk offered if the infant is still hungry.”
National Resource Center for Health and Safety in Child Care and Early Education - ASHW 2012 47

Code Variable Description CACFP Rating
Explanation of CACFP Rating
CACFP without additional or contradicting text.
IB2 Do not feed infants beyond satiety; AND, Allow infant to stop the feeding.
3
CACFP Meal Pattern includes language that implies responsiveness to infant cues to stop feeding, but only addresses some infants eating breastmilk.2
The state receives this rating if they refer to CACFP without additional or contradicting text.
IB3
Hold infants while bottle feeding, AND, Position an infant for bottle feeding in the caregiver/teacher's arms or sitting up on the caregiver/teacher’s lap.
2
CACFP Meal Pattern does not mention bottle feeding positions.
The state receives this rating if they refer to CACFP without additional text.
IC1
Develop a plan for introducing age-appropriate solid foods (complementary foods) in consultation with the child’s parent/guardian and primary care provider.
3
CACFP Meal Pattern constitutes a plan for introduction and includes the language regarding developmental readiness for solid foods.
The state receives this rating if they refer to CACFP without additional or contradicting text.
IC2 Introduce age-appropriate solid foods no sooner than 4 months of age, and preferably around 6 months of age.
3
CACFP Meal Pattern allows for the introduction of solid foods between the ages of 4-7 months.
The state receives this rating if they refer to CACFP without additional or contradicting text.
IC3
Introduce breastfed infants gradually to iron-fortified foods no sooner than four months of age, but preferably around six months to complement the human milk.
3
CACFP Meal Pattern allows for the introduction of iron-fortified foods between the ages of 4-7 months.
The state receives this rating if they refer to CACFP without additional or contradicting text.
ID1
Do not feed an infant formula mixed with cereal, fruit juice or other foods unless the primary care provider provides written instruction.
2
CACFP Meal Plan lists human milk or formula and cereal as meal and snack components for infant ages 4 months up, but does not specify the means of preparation of cereal or formula (i.e., no “mixing” or “combining” language).
The state receives this rating if they refer to CACFP without additional text.
ID2 Serve whole fruits, mashed or pureed, for infants 7 months up to one year of age.
1
CACFP Meal Pattern allows fruit to be served at the age of 4-7 months, “when the infant is developmentally ready to accept it.”
The state receives this rating if they refer to CACFP without additional text.
ID3 Serve no fruit juice to children younger than 12 months of age.
1 CACFP Meal Pattern allows for the serving of fruit juice at ages 8-11 months.
2 From CACFP Meal Pattern Infant charts: “For some breastfed infants who regularly consume less than the
minimum amount of breastmilk per feeding, a serving of less than the minimum amount of breastmilk may be offered, with additional breastmilk offered if the infant is still hungry.”
National Resource Center for Health and Safety in Child Care and Early Education - ASHW 2012 48

Code Variable Description CACFP Rating
Explanation of CACFP Rating
The state receives this rating if they refer to
CACFP without additional text.
National Resource Center for Health and Safety in Child Care and Early Education - ASHW 2012 49

Table 2. States that Require Adherence to CACFP Guidelines
CACFP Required CACFP is Optional Alabama Alaska Arizona* California* Colorado* Connecticut* Delaware Georgia* Hawaii Iowa Louisiana
Maryland Massachusetts Maine Michigan Minnesota Mississippi Montana Nebraska* New Mexico North Dakota* North Carolina
Ohio Oregon Rhode Island* South Carolina Utah* Virginia Washington* West Virginia** Wisconsin*
Kentucky
New York
Tennessee
Texas
* States that do not require CACFP for all care types. ** West Virginia does not require CACFP guidelines for infant feeding in all documents. MyPyramid Notes:
States that Required My Pyramid in 2010: Florida and South Dakota
MyPyramid was phased out in mid 2011. It was replaced by Choose MyPlate. There is no PCO2/CFOC3 standard requiring adherence to MyPlate and it is not scored for the ASHW assessments.
National Resource Center for Health and Safety in Child Care and Early Education - ASHW 2012 50

Table 3. States with Changed NA5 and ND1 Ratings: 2011/12
This table is split into two parts to show states making changes in each of the two variables affected by CACFP changes in 2011 or state document changes in 2012. States are not shown in this table if they previously had text for which they received a rating of 4 for these two variables in 2010 or 2011. A state name highlighted in blue indicates the state does not uniformly require CACFP for all child care types. A rating highlighted in yellow indicates the rating change was due to text in a state’s document rather than their reference to CACFP. Pink boxes with ‘X’ in them indicate the pattern of changed ratings for the state.
States which received rating changes for variable NA5: Serve lowfat milk to children > 2 years old. State 2010 Ratings
2011/12 Ratings
Centers Lg. Family Sm. Family
Centers Lg. Family Sm. Family Changes ALABAMA 2 2 2 4 4 4 X X X ALASKA 2 2 2 4 4 4 X X X CALIFORNIA 2 4 4 4 X X X COLORADO 2 2 2 2 4 4
X X
CONNECTICUT 2 2 2 4 4 2 X X DELAWARE 2 2 2 4 4 4 X X X
GEORGIA 2 2 2 4 4 2 X X HAWAII 2 2 2 4 4 4 X X X
IOWA 2 2 2 4 4 4 X X X KANSAS 2 2 2 2 4 4
X X
LOUISIANA 2 4 X MAINE 2 2 2 4 4 4 X X X
MARYLAND 2 2 2 4 4 4 X X X MASSACHUSETTS 2 2 2 4 4 4 X X X MICHIGAN 2 2 2 4 4 4 X X X MINNESOTA 2 2 2 4 4 4 X X X MONTANA 2 2 2 4 4 4 X X X NEBRASKA 2 2 2 4 2 2 X
NEW MEXICO 3 3 3 4 4 4 X X X NORTH CAROLINA 2 2 2 4 4 4 X X X NORTH DAKOTA 2 2 2 4 4 4 X X X OHIO 2 2 2 4 4 4 X X X OREGON 2 2 2 4 4 4 X X X RHODE ISLAND 2 3 3 2 4 4
X X
SOUTH CAROLINA 2 2 4 4 X X UTAH 2 2 2 4 4 2 X X VIRGINIA 2 4 4 4 X X X
WASHINGTON 2 2 2 1 4 4 x X X WEST VIRGINIA 2 2 2 4 3 4 X X X WISCONSIN 2 2 2 2 4 4
X X
National Resource Center for Health and Safety in Child Care and Early Education - ASHW 2012 51
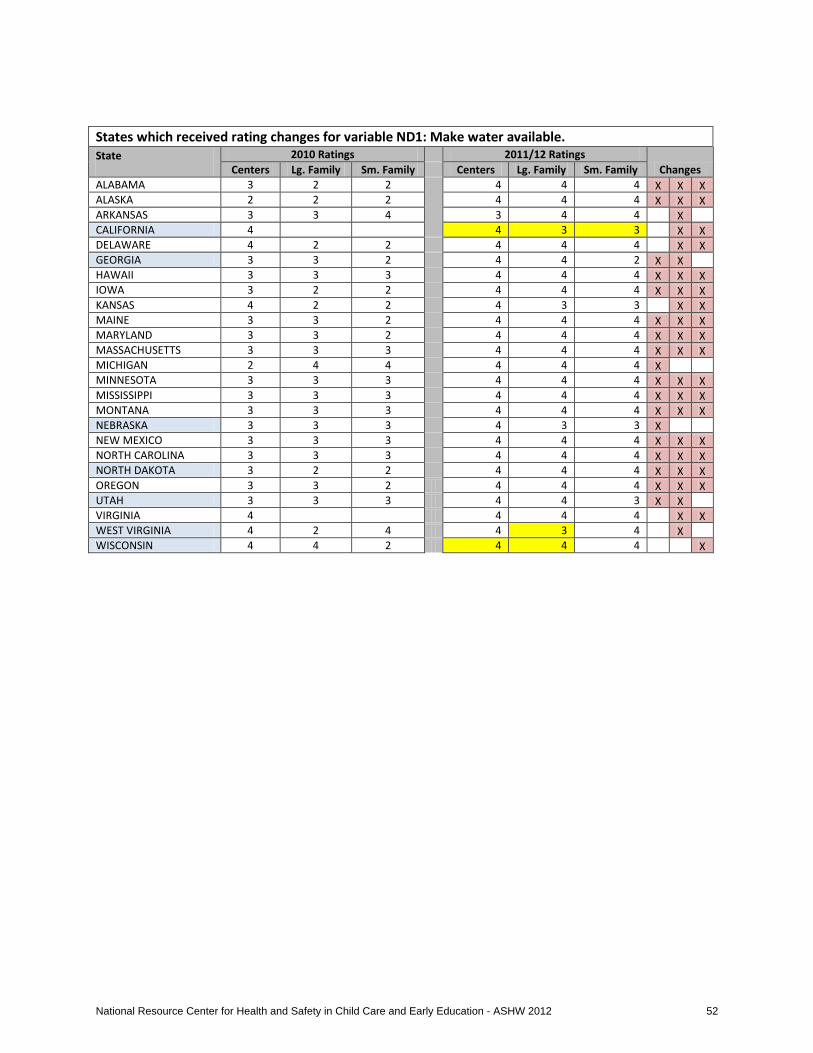
States which received rating changes for variable ND1: Make water available. State 2010 Ratings
2011/12 Ratings
Changes Centers Lg. Family Sm. Family
Centers Lg. Family Sm. Family ALABAMA 3 2 2
4 4 4 X X X ALASKA 2 2 2 4 4 4 X X X ARKANSAS 3 3 4 3 4 4
X
CALIFORNIA 4 4 3 3
X X DELAWARE 4 2 2
4 4 4
X X
GEORGIA 3 3 2
4 4 2 X X HAWAII 3 3 3
4 4 4 X X X
IOWA 3 2 2
4 4 4 X X X KANSAS 4 2 2
4 3 3
X X
MAINE 3 3 2
4 4 4 X X X MARYLAND 3 3 2
4 4 4 X X X
MASSACHUSETTS 3 3 3
4 4 4 X X X MICHIGAN 2 4 4
4 4 4 X
MINNESOTA 3 3 3
4 4 4 X X X MISSISSIPPI 3 3 3
4 4 4 X X X
MONTANA 3 3 3
4 4 4 X X X NEBRASKA 3 3 3
4 3 3 X
NEW MEXICO 3 3 3
4 4 4 X X X NORTH CAROLINA 3 3 3
4 4 4 X X X
NORTH DAKOTA 3 2 2
4 4 4 X X X OREGON 3 3 2 4 4 4 X X X UTAH 3 3 3 4 4 3 X X VIRGINIA 4 4 4 4 X X WEST VIRGINIA 4 2 4 4 3 4 X WISCONSIN 4 4 2 4 4 4 X
National Resource Center for Health and Safety in Child Care and Early Education - ASHW 2012 52

Appendix F. Individual State Data
Explanation of State Data Pages
Last LastState Abbreviations and Order of Pages Update State Abbreviations and Order of Pages Update
AL Alabama 2012 MT Montana 2012AK Alaska 2012 NE Nebraska 2012AZ Arizona 2012 NV Nevada 2012AR Arkansas 2011 NH New HampshireCA California 2012 NJ New JerseyCO Colorado 2012 NM New Mexico 2012CT Connecticut 2012 NY New YorkDE Delaware 2012 NC North Carolina 2012D.C. District of Columbia ND North Dakota 2012FL Florida 2012 OH Ohio 2012GA Georgia 2012 OK OklahomaHI Hawaii 2012 OR Oregon 2012ID Idaho PA PennsylvaniaIL Illinois RI Rhode Island 2012IN Indiana SC South Carolina 2012IA Iowa 2012 SD South DakotaKS Kansas 2012 TN TennesseeKY Kentucky TX Texas 2012LA Louisiana 2012 UT Utah 2012ME Maine 2012 VT VermontMD Maryland 2012 VA Virginia 2012MA Massachusetts 2012 WA Washington 2012MI Michigan 2012 WV West Virginia 2012MN Minnesota 2012 WI Wisconsin 2012MS Mississippi 2012 WY Wyoming 2012MO Missouri
This appendix includes detailed reports for each state and the District of Columbia (for convenience, the states). States may review these pages to see where their child care licensing regulations have strong terminology to promote childhood obesity prevention and to identify areas they may wish to improve.
The reports are presented alphabetically by state name and may be one or two pages in length. States that have two-page reports experienced rating revisions as a result of: a) the state’s introduction since the baseline 2010 ASHW assessment of new or revised regulations with content pertinent to ASHW variables, or b) the NRC assigning new ratings to two ASHW variables (NA5 and ND1) associated with 2011 CACFP program requirements (the updated ratings are incorporated in the 2012 data). States for which ratings have remained stable since 2010 have single page reports.
The state data report includes a listing of the state's ratings for each variable by child care type (center-based, large/group and small child care family homes) for 2010, and, if applicable, revised ratings for 2011 and/or 2012 in additional columns. The ratings in this list are the final rating per variable per care type the state regulates. In states that use multiple documents to regulate a care type, the final rating is the single highest rating for that care type for that variable attained among the documents. (Lower ratings may have been assigned for the variable in another document; however, the NRC assumes caregivers are required to observe all regulations, including those that are more stringent than a similar regulation in a different document.) Final ratings are those the NRC uses to determine states’ comparative rankings in the annual ASHW report. In states with columns for 2011 or 2012 updates, changes from the 2012 baseline are highlighted; improved ratings in green, decreased ratings in magenta. The legend for rating values is presented below the listing. Pie charts and bar graphs also are presented to provide more information about the whole of the state’s data. (Additional explanatory information accompanies these graphics.)
National Resource Center for Health and Safety in Child Care and Early Education - ASHW 2012 53
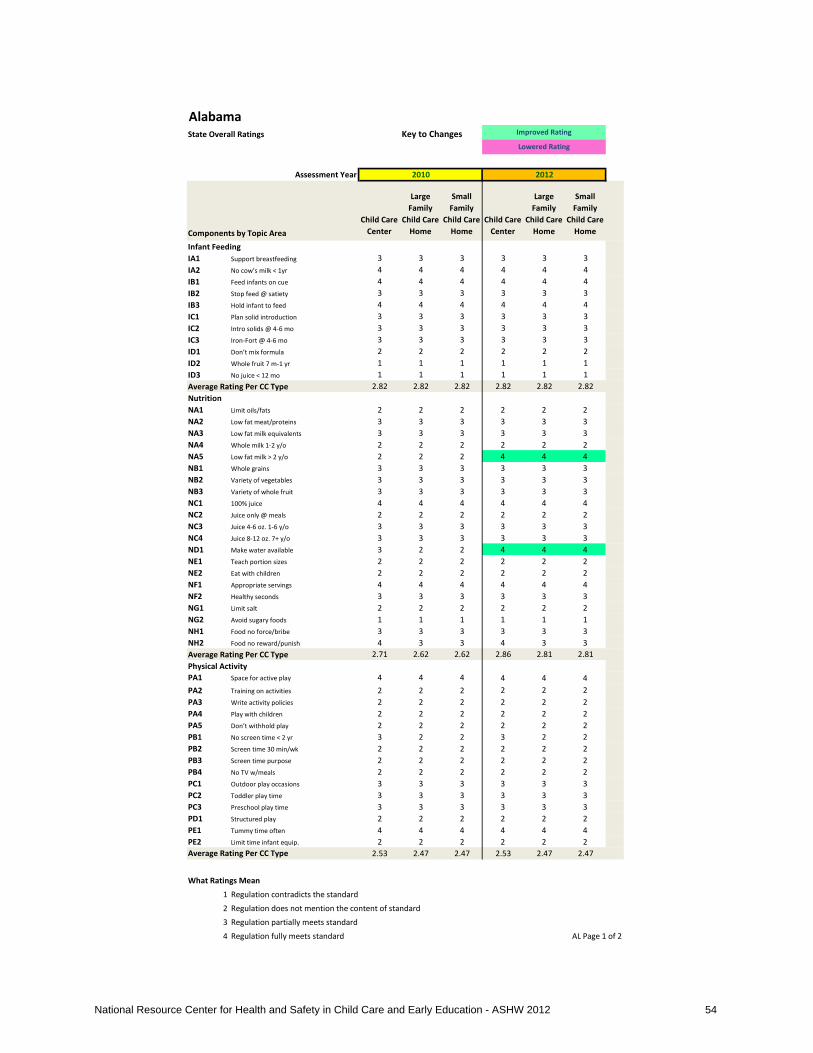
AlabamaState Overall Ratings Key to Changes
Assessment Year
Components by Topic AreaChild Care
Center
Large Family
Child Care Home
Small Family
Child Care Home
Child Care Center
Large Family
Child Care Home
Small Family
Child Care Home
Infant Feeding IA1 Support breastfeeding 3 3 3 3 3 3IA2 No cow’s milk < 1yr 4 4 4 4 4 4IB1 Feed infants on cue 4 4 4 4 4 4IB2 Stop feed @ satiety 3 3 3 3 3 3IB3 Hold infant to feed 4 4 4 4 4 4IC1 Plan solid introduction 3 3 3 3 3 3IC2 Intro solids @ 4-6 mo 3 3 3 3 3 3IC3 Iron-Fort @ 4-6 mo 3 3 3 3 3 3ID1 Don’t mix formula 2 2 2 2 2 2ID2 Whole fruit 7 m-1 yr 1 1 1 1 1 1ID3 No juice < 12 mo 1 1 1 1 1 1Average Rating Per CC Type 2.82 2.82 2.82 2.82 2.82 2.82NutritionNA1 Limit oils/fats 2 2 2 2 2 2NA2 Low fat meat/proteins 3 3 3 3 3 3NA3 Low fat milk equivalents 3 3 3 3 3 3NA4 Whole milk 1-2 y/o 2 2 2 2 2 2NA5 Low fat milk > 2 y/o 2 2 2 4 4 4NB1 Whole grains 3 3 3 3 3 3NB2 Variety of vegetables 3 3 3 3 3 3NB3 Variety of whole fruit 3 3 3 3 3 3NC1 100% juice 4 4 4 4 4 4NC2 Juice only @ meals 2 2 2 2 2 2NC3 Juice 4-6 oz. 1-6 y/o 3 3 3 3 3 3NC4 Juice 8-12 oz. 7+ y/o 3 3 3 3 3 3ND1 Make water available 3 2 2 4 4 4NE1 Teach portion sizes 2 2 2 2 2 2NE2 Eat with children 2 2 2 2 2 2NF1 Appropriate servings 4 4 4 4 4 4NF2 Healthy seconds 3 3 3 3 3 3NG1 Limit salt 2 2 2 2 2 2NG2 Avoid sugary foods 1 1 1 1 1 1NH1 Food no force/bribe 3 3 3 3 3 3NH2 Food no reward/punish 4 3 3 4 3 3Average Rating Per CC Type 2.71 2.62 2.62 2.86 2.81 2.81Physical ActivityPA1 Space for active play 4 4 4 4 4 4PA2 Training on activities 2 2 2 2 2 2PA3 Write activity policies 2 2 2 2 2 2PA4 Play with children 2 2 2 2 2 2PA5 Don’t withhold play 2 2 2 2 2 2PB1 No screen time < 2 yr 3 2 2 3 2 2PB2 Screen time 30 min/wk 2 2 2 2 2 2PB3 Screen time purpose 2 2 2 2 2 2PB4 No TV w/meals 2 2 2 2 2 2PC1 Outdoor play occasions 3 3 3 3 3 3PC2 Toddler play time 3 3 3 3 3 3PC3 Preschool play time 3 3 3 3 3 3PD1 Structured play 2 2 2 2 2 2PE1 Tummy time often 4 4 4 4 4 4PE2 Limit time infant equip. 2 2 2 2 2 2Average Rating Per CC Type 2.53 2.47 2.47 2.53 2.47 2.47
What Ratings Mean
1 Regulation contradicts the standard
2 Regulation does not mention the content of standard
3 Regulation partially meets standard
4 Regulation fully meets standard AL Page 1 of 2
2010
Improved Rating
Lowered Rating
2012
National Resource Center for Health and Safety in Child Care and Early Education - ASHW 2012 54

AlabamaState Overall Ratings
Ratings 1 2 3 4 Ratings 1 2 3 4I - Count 6 3 15 9 I - Count 6 3 15 9N-Count 3 23 30 7 N-Count 3 18 29 13P-Count 0 29 10 6 P-Count 0 29 10 6
Understanding and Using This page
AL Page 2 of 2
On this page are two types of charts and tables based on data from the table on the previous page. The pie charts at the top show the composition of all the ratings for the state by percentage of 1, 2, 3 and 4 ratings, which affords an overall view of the state's ratings. The small table below each pie chart shows the frequency (number) of each rating of 1, 2, 3 and 4 for each topic area: I=Infant Feeding, N=Nutrition, and P=Physical Activity. The stacked bar charts show the percentage of ratings of 1- 4 for each topic area. Ratings of 1 are at the base of the columns and ratings of 4 are at the top. It is suggested that the state reviews this page for analysis of its regulations, to see where terminology is strong and to identify those areas in which terminology may be improved in its child care regulations that have implications for childhood obesity prevention. This page reports the state's ratings for each variable by child care type, so that all final ratings per child care facility type are shown.
Tally of Each Rating Per Topic Area 2010 Tally of Each Rating Per Topic Area 2012
2010 2012
1 6%
2 42%
3 39%
4 13%
AR Overall Rating Composite
1 6%
2 39%
3 39%
4 16%
AL Overall Rating Composite 2010
0%
10%
20%
30%
40%
50%
60%
70%
80%
90%
100%
Infant Feeding
Nutrition Physical Activity
AL Rating Composition Per Topic Area 2010
Series4
Series3
Series2
Series1
1 6%
2 35%
3 38%
4 20%
AL Overall Rating Composite 2012
0%
10%
20%
30%
40%
50%
60%
70%
80%
90%
100%
Infant Feeding
Nutrition Physical Activity
AL Rating Composition Per Topic Area 2012
Series4
Series3
Series2
Series1
National Resource Center for Health and Safety in Child Care and Early Education - ASHW 2012 55

AlaskaState Overall Ratings Key to Changes
Assessment Year
Components by Topic AreaChild Care
Center
Large Family
Child Care Home
Small Family
Child Care Home
Child Care Center
Large Family
Child Care Home
Small Family
Child Care Home
Infant Feeding IA1 Support breastfeeding 3 3 3 3 3 3IA2 No cow’s milk < 1yr 4 4 4 4 4 4IB1 Feed infants on cue 4 4 4 4 4 4IB2 Stop feed @ satiety 3 3 3 3 3 3IB3 Hold infant to feed 3 3 3 3 3 3IC1 Plan solid introduction 3 3 3 3 3 3IC2 Intro solids @ 4-6 mo 3 3 3 3 3 3IC3 Iron-Fort @ 4-6 mo 3 3 3 3 3 3ID1 Don’t mix formula 2 2 2 2 2 2ID2 Whole fruit 7 m-1 yr 1 1 1 1 1 1ID3 No juice < 12 mo 1 1 1 1 1 1Average Rating Per CC Type 2.73 2.73 2.73 2.73 2.73 2.73NutritionNA1 Limit oils/fats 2 2 2 2 2 2NA2 Low fat meat/proteins 3 3 3 3 3 3NA3 Low fat milk equivalents 3 3 3 3 3 3NA4 Whole milk 1-2 y/o 2 2 2 2 2 2NA5 Low fat milk > 2 y/o 2 2 2 4 4 4NB1 Whole grains 3 3 3 3 3 3NB2 Variety of vegetables 3 3 3 3 3 3NB3 Variety of whole fruit 3 3 3 3 3 3NC1 100% juice 4 4 4 4 4 4NC2 Juice only @ meals 2 2 2 2 2 2NC3 Juice 4-6 oz. 1-6 y/o 3 3 3 3 3 3NC4 Juice 8-12 oz. 7+ y/o 3 3 3 3 3 3ND1 Make water available 2 2 2 4 4 4NE1 Teach portion sizes 2 2 2 2 2 2NE2 Eat with children 2 2 2 2 2 2NF1 Appropriate servings 4 4 4 4 4 4NF2 Healthy seconds 3 3 3 3 3 3NG1 Limit salt 2 2 2 2 2 2NG2 Avoid sugary foods 1 1 1 1 1 1NH1 Food no force/bribe 3 3 3 3 3 3NH2 Food no reward/punish 2 2 2 2 2 2Average Rating Per CC Type 2.57 2.57 2.57 2.76 2.76 2.76Physical ActivityPA1 Space for active play 4 4 4 4 4 4PA2 Training on activities 2 2 2 2 2 2PA3 Write activity policies 2 2 2 2 2 2PA4 Play with children 2 2 2 2 2 2PA5 Don’t withhold play 3 3 3 3 3 3PB1 No screen time < 2 yr 3 3 3 3 3 3PB2 Screen time 30 min/wk 3 3 3 3 3 3PB3 Screen time purpose 2 2 2 2 2 2PB4 No TV w/meals 2 2 2 2 2 2PC1 Outdoor play occasions 4 4 4 4 4 4PC2 Toddler play time 3 3 3 3 3 3PC3 Preschool play time 3 3 3 3 3 3PD1 Structured play 4 4 4 4 4 4PE1 Tummy time often 2 2 2 2 2 2PE2 Limit time infant equip. 4 4 4 4 4 4Average Rating Per CC Type 2.87 2.87 2.87 2.87 2.87 2.87
What Ratings Mean
1 Regulation contradicts the standard
2 Regulation does not mention the content of standard
3 Regulation partially meets standard
4 Regulation fully meets standard AK Page 1 of 2
2010
Improved Rating
Lowered Rating
2012
National Resource Center for Health and Safety in Child Care and Early Education - ASHW 2012 56

AlaskaState Overall Ratings
Ratings 1 2 3 4 Ratings 1 2 3 4I - Count 6 3 18 6 I - Count 6 3 18 6N-Count 3 27 27 6 N-Count 3 21 27 12P-Count 0 18 15 12 P-Count 0 18 15 12
Understanding and Using This page
AK Page 2 of 2
On this page are two types of charts and tables based on data from the table on the previous page. The pie charts at the top show the composition of all the ratings for the state by percentage of 1, 2, 3 and 4 ratings, which affords an overall view of the state's ratings. The small table below each pie chart shows the frequency (number) of each rating of 1, 2, 3 and 4 for each topic area: I=Infant Feeding, N=Nutrition, and P=Physical Activity. The stacked bar charts show the percentage of ratings of 1- 4 for each topic area. Ratings of 1 are at the base of the columns and ratings of 4 are at the top. It is suggested that the state reviews this page for analysis of its regulations, to see where terminology is strong and to identify those areas in which terminology may be improved in its child care regulations that have implications for childhood obesity prevention. This page reports the state's ratings for each variable by child care type, so that all final ratings per child care facility type are shown.
2010 2012
Tally of Each Rating Per Topic Area 2010 Tally of Each Rating Per Topic Area 2012
1 6%
2 34%
3 43%
4 17%
AK Overall Rating Composite 2010
0%
10%
20%
30%
40%
50%
60%
70%
80%
90%
100%
Infant Feeding
Nutrition Physical Activity
AK Rating Composition Per Topic Area 2010
Series4
Series3
Series2
Series1
1 6%
2 30%
3 43%
4 21%
AK Overall Rating Composite 2012
0%
10%
20%
30%
40%
50%
60%
70%
80%
90%
100%
Infant Feeding
Nutrition Physical Activity
AK Rating Composition Per Topic Area 2012
Series4
Series3
Series2
Series1
National Resource Center for Health and Safety in Child Care and Early Education - ASHW 2012 57

ArizonaState Overall Ratings Key to Changes
Asssessment Year
Components by Topic AreaChild Care
Center
Large Family
Child Care Home
Small Family
Child Care Home
Child Care Center
Large Family
Child Care Home
Small Family
Child Care Home
Infant Feeding IA1 Support breastfeeding 4 4 4 4 4 4IA2 No cow’s milk < 1yr 3 3 4 3 4 4IB1 Feed infants on cue 2 2 4 2 4 4IB2 Stop feed @ satiety 2 2 3 2 4 3IB3 Hold infant to feed 3 4 4 3 4 4IC1 Plan solid introduction 4 4 3 4 4 3IC2 Intro solids @ 4-6 mo 2 2 3 2 2 3IC3 Iron-Fort @ 4-6 mo 2 2 3 2 2 3ID1 Don’t mix formula 3 3 3 3 3 3ID2 Whole fruit 7 m-1 yr 2 2 1 2 2 1ID3 No juice < 12 mo 2 2 1 2 2 1Average Rating Per CC Type 2.64 2.73 3.00 2.64 3.18 3.00NutritionNA1 Limit oils/fats 2 3 2 2 3 2NA2 Low fat meat/proteins 3 3 3 3 3 3NA3 Low fat milk equivalents 3 3 3 3 3 3NA4 Whole milk 1-2 y/o 2 2 2 2 3 2NA5 Low fat milk > 2 y/o 4 4 2 4 4 2NB1 Whole grains 3 3 3 3 3 3NB2 Variety of vegetables 3 3 3 3 4 3NB3 Variety of whole fruit 4 4 3 4 4 3NC1 100% juice 4 4 4 4 4 4NC2 Juice only @ meals 2 2 2 2 2 2NC3* Juice 4-6 oz. 1-6 y/o 4 4 3 4 4 3NC4 Juice 8-12 oz. 7+ y/o 4 4 3 4 4 3ND1 Make water available 4 4 2 4 4 2NE1 Teach portion sizes 2 2 2 2 2 2NE2 Eat with children 3 3 2 3 3 2NF1 Appropriate servings 4 4 4 4 4 4NF2 Healthy seconds 1 1 3 1 1 3NG1 Limit salt 2 2 2 2 2 2NG2 Avoid sugary foods 3 3 1 3 3 1NH1 Food no force/bribe 3 3 3 3 3 3NH2 Food no reward/punish 3 3 3 3 3 3Average Rating Per CC Type 3.00 3.05 2.62 3.00 3.14 2.62Physical ActivityPA1 Space for active play 4 4 2 4 4 2PA2 Training on activities 2 2 2 2 2 2PA3 Write activity policies 2 2 2 2 3 2PA4 Play with children 2 2 2 2 2 2PA5 Don’t withhold play 3 4 4 3 4 4PB1 No screen time < 2 yr 2 2 2 2 2 2PB2 Screen time 30 min/wk 2 2 2 2 2 2PB3 Screen time purpose 2 2 2 2 2 2PB4 No TV w/meals 2 2 2 2 2 2PC1 Outdoor play occasions 3 3 3 3 3 3PC2 Toddler play time 3 3 3 3 3 3PC3 Preschool play time 3 3 3 3 3 3PD1 Structured play 3 3 3 3 3 3PE1 Tummy time often 4 4 2 4 4 2PE2 Limit time infant equip. 3 3 1 3 3 1Average Rating Per CC Type 2.67 2.73 2.33 2.67 2.80 2.33* Rating highlighted blue indicates correction of baseline data.
What Ratings Mean
1 Regulation contradicts the standard
2 Regulation does not mention the content of standard
3 Regulation partially meets standard
4 Regulation fully meets standard AZ Page 1 of 2
2010 2012
Improved Rating
Lowered Rating
National Resource Center for Health and Safety in Child Care and Early Education - ASHW 2012 58

ArizonaState Overall Ratings
Ratings 1 2 3 4 Ratings 1 2 3 4I - Count 2 12 10 9 I - Count 2 10 9 12N-Count 3 17 27 16 N-Count 3 16 27 17P-Count 1 23 15 6 P-Count 1 22 16 6
Understanding and Using This page
AZ Page 2 of 2
Tally of Each Rating Per Topic Area 2010 Tally of Each Rating Per Topic Area 2012
On this page are two types of charts and tables based on data from the table on the previous page. The pie charts at the top show the composition of all the ratings for the state by percentage of 1, 2, 3 and 4 ratings, which affords an overall view of the state's ratings. The small table below each pie chart shows the frequency (number) of each rating of 1, 2, 3 and 4 for each topic area: I=Infant Feeding, N=Nutrition, and P=Physical Activity. The stacked bar charts show the percentage of ratings of 1- 4 for each topic area. Ratings of 1 are at the base of the columns and ratings of 4 are at the top. It is suggested that the state reviews this page for analysis of its regulations, to see where terminology is strong and to identify those areas in which terminology may be improved in its child care regulations that have implications for childhood obesity prevention. This page reports the state's ratings for each variable by child care type, so that all final ratings per child care facility type are shown.
20122010
1 4%
2 37%
3 37%
4 22%
AZ Overall Rating Composite 2010
0%
10%
20%
30%
40%
50%
60%
70%
80%
90%
100%
Infant Feeding
Nutrition Physical Activity
AZ Rating Composition Per Topic Area 2010
Series4
Series3
Series2
Series1
1 4%
2 34%
3 37%
4 25%
AZ Overall Rating Composite 2012
0%
10%
20%
30%
40%
50%
60%
70%
80%
90%
100%
Infant Feeding
Nutrition Physical Activity
AZ Rating Composition Per Topic Area 2012
Series4
Series3
Series2
Series1
National Resource Center for Health and Safety in Child Care and Early Education - ASHW 2012 59

ArkansasState Overall Ratings Key to Changes
Assessment Year
Components by Topic AreaChild Care
Center
Large Family
Child Care Home
Small Family
Child Care Home
Child Care Center
Large Family
Child Care Home
Small Family
Child Care Home
Infant Feeding IA1 Support breastfeeding 2 2 2 2 2 2IA2 No cow’s milk < 1yr 4 4 4 4 4 4IB1 Feed infants on cue 4 4 4 4 4 4IB2 Stop feed @ satiety 3 3 3 4 4 4IB3 Hold infant to feed 3 3 3 3 3 3IC1 Plan solid introduction 3 3 3 3 3 3IC2 Intro solids @ 4-6 mo 3 3 3 3 3 3IC3 Iron-Fort @ 4-6 mo 3 3 3 3 3 3ID1 Don’t mix formula 2 2 2 2 2 2ID2 Whole fruit 7 m-1 yr 1 1 1 1 1 1ID3 No juice < 12 mo 1 1 1 1 1 1Average Rating Per CC Type 2.64 2.64 2.64 2.73 2.73 2.73NutritionNA1 Limit oils/fats 2 2 2 2 2 2NA2 Low fat meat/proteins 3 3 3 3 3 3NA3 Low fat milk equivalents 3 3 3 3 3 3NA4 Whole milk 1-2 y/o 2 2 2 2 2 2NA5 Low fat milk > 2 y/o 2 2 2 2 2 2NB1 Whole grains 3 3 3 3 3 3NB2 Variety of vegetables 3 3 3 3 3 3NB3 Variety of whole fruit 3 3 3 3 3 3NC1 100% juice 4 4 4 4 4 4NC2 Juice only @ meals 2 2 2 2 2 2NC3 Juice 4-6 oz. 1-6 y/o 3 3 3 3 3 3NC4 Juice 8-12 oz. 7+ y/o 3 3 3 3 3 3ND1 Make water available 3 3 4 3 4 4NE1 Teach portion sizes 2 2 2 2 2 2NE2 Eat with children 2 2 2 3 2 2NF1 Appropriate servings 4 4 4 4 4 4NF2 Healthy seconds 3 3 3 3 3 3NG1 Limit salt 2 2 2 2 2 2NG2 Avoid sugary foods 1 1 1 1 1 1NH1 Food no force/bribe 2 3 3 2 3 3NH2 Food no reward/punish 3 3 3 3 3 3Average Rating Per CC Type 2.62 2.67 2.71 2.67 2.71 2.71Physical ActivityPA1 Space for active play 4 4 2 4 4 2PA2 Training on activities 2 2 2 2 2 2PA3 Write activity policies 2 2 2 3 3 3PA4 Play with children 2 2 2 4 2 2PA5 Don’t withhold play 4 4 4 3 4 4PB1 No screen time < 2 yr 2 2 2 3 2 2PB2 Screen time 30 min/wk 2 2 2 3 3 3PB3 Screen time purpose 2 2 2 4 4 4PB4 No TV w/meals 2 2 2 2 2 2PC1 Outdoor play occasions 3 3 3 3 3 3PC2 Toddler play time 3 3 3 3 3 3PC3 Preschool play time 3 3 3 3 3 3PD1 Structured play 2 2 2 2 2 2PE1 Tummy time often 2 2 2 2 2 2PE2 Limit time infant equip. 2 2 2 2 2 2Average Rating Per CC Type 2.47 2.47 2.33 2.87 2.73 2.60
What Ratings Mean
1 Regulation contradicts the standard
2 Regulation does not mention the content of standard
3 Regulation partially meets standard
4 Regulation fully meets standard AR Page 1 o f2
Lowered Rating
2011
Improved Rating
2010
National Resource Center for Health and Safety in Child Care and Early Education - ASHW 2012 60
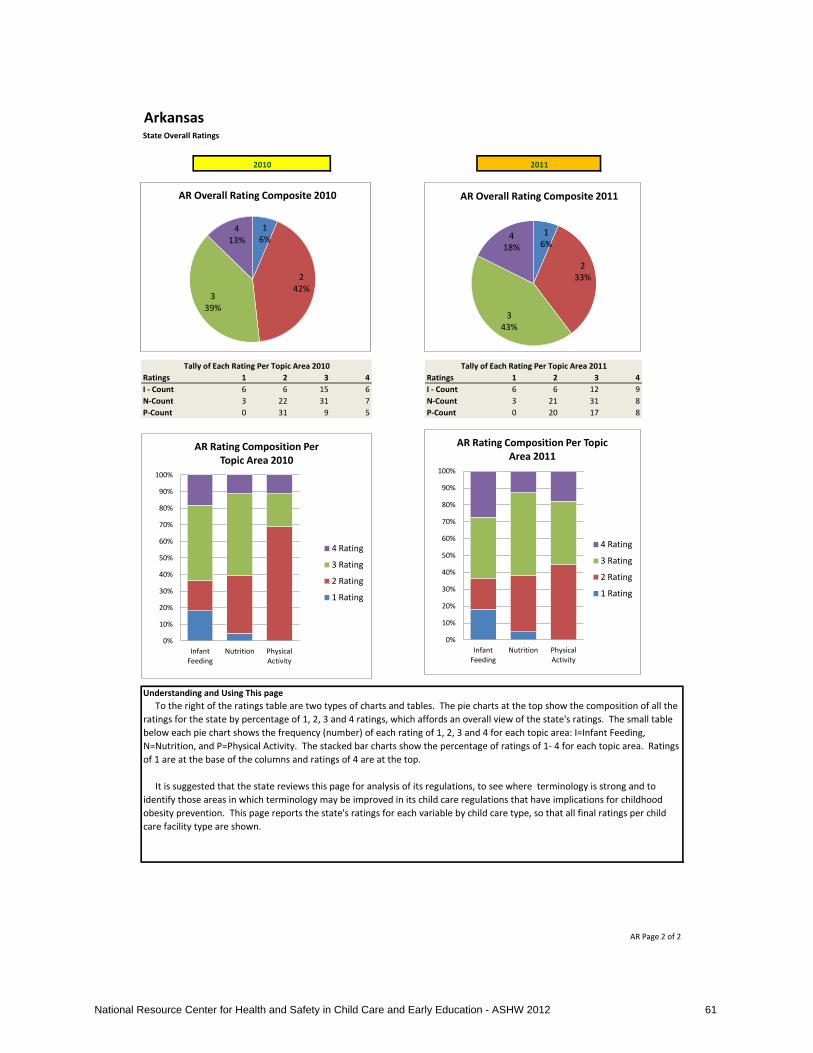
ArkansasState Overall Ratings
Ratings 1 2 3 4 Ratings 1 2 3 4I - Count 6 6 15 6 I - Count 6 6 12 9N-Count 3 22 31 7 N-Count 3 21 31 8P-Count 0 31 9 5 P-Count 0 20 17 8
Understanding and Using This page
AR Page 2 of 2
Tally of Each Rating Per Topic Area 2011
To the right of the ratings table are two types of charts and tables. The pie charts at the top show the composition of all the ratings for the state by percentage of 1, 2, 3 and 4 ratings, which affords an overall view of the state's ratings. The small table below each pie chart shows the frequency (number) of each rating of 1, 2, 3 and 4 for each topic area: I=Infant Feeding, N=Nutrition, and P=Physical Activity. The stacked bar charts show the percentage of ratings of 1- 4 for each topic area. Ratings of 1 are at the base of the columns and ratings of 4 are at the top. It is suggested that the state reviews this page for analysis of its regulations, to see where terminology is strong and to identify those areas in which terminology may be improved in its child care regulations that have implications for childhood obesity prevention. This page reports the state's ratings for each variable by child care type, so that all final ratings per child care facility type are shown.
Tally of Each Rating Per Topic Area 2010
2010 2011
1 6%
2 42%
3 39%
4 13%
AR Overall Rating Composite
1 6%
2 42%
3 39%
4 13%
AR Overall Rating Composite 2010
0%
10%
20%
30%
40%
50%
60%
70%
80%
90%
100%
Infant Feeding
Nutrition Physical Activity
AR Rating Composition Per Topic Area 2010
4 Rating
3 Rating
2 Rating
1 Rating
1 6%
2 33%
3 43%
4 18%
AR Overall Rating Composite 2011
0%
10%
20%
30%
40%
50%
60%
70%
80%
90%
100%
Infant Feeding
Nutrition Physical Activity
AR Rating Composition Per Topic Area 2011
4 Rating
3 Rating
2 Rating
1 Rating
National Resource Center for Health and Safety in Child Care and Early Education - ASHW 2012 61
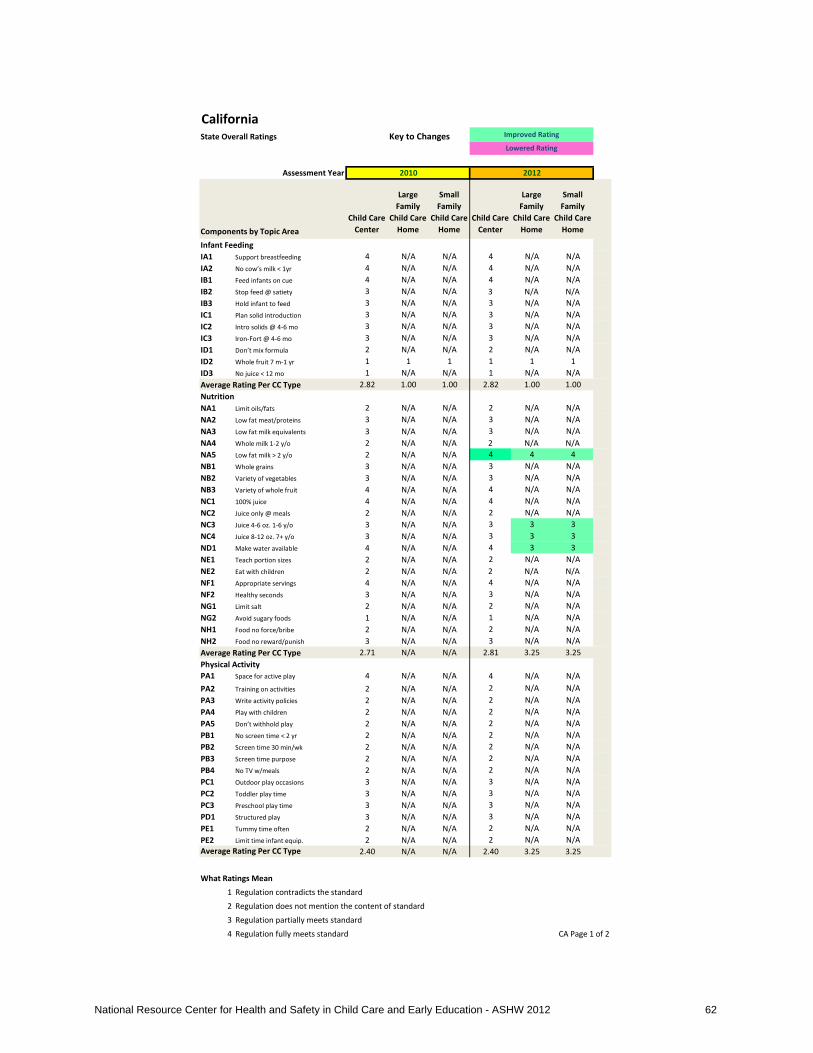
CaliforniaState Overall Ratings Key to Changes
Assessment Year
Components by Topic AreaChild Care
Center
Large Family
Child Care Home
Small Family
Child Care Home
Child Care Center
Large Family
Child Care Home
Small Family
Child Care Home
Infant Feeding IA1 Support breastfeeding 4 N/A N/A 4 N/A N/AIA2 No cow’s milk < 1yr 4 N/A N/A 4 N/A N/AIB1 Feed infants on cue 4 N/A N/A 4 N/A N/AIB2 Stop feed @ satiety 3 N/A N/A 3 N/A N/AIB3 Hold infant to feed 3 N/A N/A 3 N/A N/AIC1 Plan solid introduction 3 N/A N/A 3 N/A N/AIC2 Intro solids @ 4-6 mo 3 N/A N/A 3 N/A N/AIC3 Iron-Fort @ 4-6 mo 3 N/A N/A 3 N/A N/AID1 Don’t mix formula 2 N/A N/A 2 N/A N/AID2 Whole fruit 7 m-1 yr 1 1 1 1 1 1ID3 No juice < 12 mo 1 N/A N/A 1 N/A N/AAverage Rating Per CC Type 2.82 1.00 1.00 2.82 1.00 1.00NutritionNA1 Limit oils/fats 2 N/A N/A 2 N/A N/ANA2 Low fat meat/proteins 3 N/A N/A 3 N/A N/ANA3 Low fat milk equivalents 3 N/A N/A 3 N/A N/ANA4 Whole milk 1-2 y/o 2 N/A N/A 2 N/A N/ANA5 Low fat milk > 2 y/o 2 N/A N/A 4 4 4NB1 Whole grains 3 N/A N/A 3 N/A N/ANB2 Variety of vegetables 3 N/A N/A 3 N/A N/ANB3 Variety of whole fruit 4 N/A N/A 4 N/A N/ANC1 100% juice 4 N/A N/A 4 N/A N/ANC2 Juice only @ meals 2 N/A N/A 2 N/A N/ANC3 Juice 4-6 oz. 1-6 y/o 3 N/A N/A 3 3 3NC4 Juice 8-12 oz. 7+ y/o 3 N/A N/A 3 3 3ND1 Make water available 4 N/A N/A 4 3 3NE1 Teach portion sizes 2 N/A N/A 2 N/A N/ANE2 Eat with children 2 N/A N/A 2 N/A N/ANF1 Appropriate servings 4 N/A N/A 4 N/A N/ANF2 Healthy seconds 3 N/A N/A 3 N/A N/ANG1 Limit salt 2 N/A N/A 2 N/A N/ANG2 Avoid sugary foods 1 N/A N/A 1 N/A N/ANH1 Food no force/bribe 2 N/A N/A 2 N/A N/ANH2 Food no reward/punish 3 N/A N/A 3 N/A N/AAverage Rating Per CC Type 2.71 N/A N/A 2.81 3.25 3.25Physical ActivityPA1 Space for active play 4 N/A N/A 4 N/A N/APA2 Training on activities 2 N/A N/A 2 N/A N/APA3 Write activity policies 2 N/A N/A 2 N/A N/APA4 Play with children 2 N/A N/A 2 N/A N/APA5 Don’t withhold play 2 N/A N/A 2 N/A N/APB1 No screen time < 2 yr 2 N/A N/A 2 N/A N/APB2 Screen time 30 min/wk 2 N/A N/A 2 N/A N/APB3 Screen time purpose 2 N/A N/A 2 N/A N/APB4 No TV w/meals 2 N/A N/A 2 N/A N/APC1 Outdoor play occasions 3 N/A N/A 3 N/A N/APC2 Toddler play time 3 N/A N/A 3 N/A N/APC3 Preschool play time 3 N/A N/A 3 N/A N/APD1 Structured play 3 N/A N/A 3 N/A N/APE1 Tummy time often 2 N/A N/A 2 N/A N/APE2 Limit time infant equip. 2 N/A N/A 2 N/A N/AAverage Rating Per CC Type 2.40 N/A N/A 2.40 3.25 3.25
What Ratings Mean
1 Regulation contradicts the standard
2 Regulation does not mention the content of standard
3 Regulation partially meets standard
4 Regulation fully meets standard CA Page 1 of 2
2010
Improved Rating
Lowered Rating
2012
National Resource Center for Health and Safety in Child Care and Early Education - ASHW 2012 62

CaliforniaState Overall Ratings
Ratings 1 2 3 4 Ratings 1 2 3 4I - Count 4 1 5 3 I - Count 4 1 5 3N-Count 1 8 8 4 N-Count 1 7 14 7P-Count 0 10 4 1 P-Count 0 10 4 1
Understanding and Using This page
CA Page 2 of 2
Tally of Each Rating Per Topic Area 2010 Tally of Each Rating Per Topic Area 2012
On this page are two types of charts and tables based on data from the table on the previous page. The pie charts at the top show the composition of all the ratings for the state by percentage of 1, 2, 3 and 4 ratings, which affords an overall view of the state's ratings. The small table below each pie chart shows the frequency (number) of each rating of 1, 2, 3 and 4 for each topic area: I=Infant Feeding, N=Nutrition, and P=Physical Activity. The stacked bar charts show the percentage of ratings of 1- 4 for each topic area. Ratings of 1 are at the base of the columns and ratings of 4 are at the top. It is suggested that the state reviews this page for analysis of its regulations, to see where terminology is strong and to identify those areas in which terminology may be improved in its child care regulations that have implications for childhood obesity prevention. This page reports the state's ratings for each variable by child care type, so that all final ratings per child care facility type are shown.
2010 2012
1 10%
2 39% 3
35%
4 16%
CA Overall Rating Composite 2010
0%
10%
20%
30%
40%
50%
60%
70%
80%
90%
100%
Infant Feeding
Nutrition Physical Activity
CA Rating Composition Per Topic Area 2010
Series4
Series3
Series2
Series1
1 9%
2 32%
3 40%
4 19%
CA Overall Rating Composite 2012
0%
10%
20%
30%
40%
50%
60%
70%
80%
90%
100%
Infant Feeding
Nutrition Physical Activity
CA Rating Composition Per Topic Area 2012
Series4
Series3
Series2
Series1
National Resource Center for Health and Safety in Child Care and Early Education - ASHW 2012 63

ColoradoState Overall Ratings Key to Changes
Assessment Year
Components by Topic AreaChild Care
Center
Large Family
Child Care Home
Small Family
Child Care Home
Child Care Center
Large Family
Child Care Home
Small Family
Child Care Home
Infant Feeding IA1 Support breastfeeding 2 4 4 2 4 4IA2 No cow’s milk < 1yr 2 4 4 2 4 4IB1 Feed infants on cue 4 4 4 4 4 4IB2 Stop feed @ satiety 2 3 3 2 3 3IB3 Hold infant to feed 3 3 3 3 3 3IC1 Plan solid introduction 2 3 3 2 4 4IC2 Intro solids @ 4-6 mo 2 3 3 2 3 3IC3 Iron-Fort @ 4-6 mo 2 3 3 2 3 3ID1 Don’t mix formula 2 2 2 3 3 2ID2 Whole fruit 7 m-1 yr 2 1 1 2 1 1ID3 No juice < 12 mo 2 1 1 2 1 1Average Rating Per CC Type 2.27 2.82 2.82 2.36 3.00 2.91NutritionNA1 Limit oils/fats 2 3 3 2 3 3NA2 Low fat meat/proteins 2 3 3 2 3 3NA3 Low fat milk equivalents 2 3 3 2 3 3NA4 Whole milk 1-2 y/o 2 2 2 2 2 2NA5 Low fat milk > 2 y/o 2 2 2 2 4 4NB1 Whole grains 2 3 3 2 3 3NB2 Variety of vegetables 2 3 3 2 3 3NB3 Variety of whole fruit 2 3 3 2 3 3NC1 100% juice 2 4 4 2 4 4NC2 Juice only @ meals 2 2 2 2 2 2NC3 Juice 4-6 oz. 1-6 y/o 2 4 4 2 4 4NC4 Juice 8-12 oz. 7+ y/o 2 4 4 2 4 4ND1 Make water available 2 4 4 2 4 4NE1 Teach portion sizes 2 2 2 2 2 2NE2 Eat with children 2 2 2 2 2 2NF1 Appropriate servings 4 4 4 4 4 4NF2 Healthy seconds 2 3 3 2 3 3NG1 Limit salt 2 2 2 2 2 2NG2 Avoid sugary foods 2 3 3 2 3 3NH1 Food no force/bribe 3 3 3 3 3 3NH2 Food no reward/punish 3 3 3 3 3 3Average Rating Per CC Type 2.19 2.95 2.95 2.19 3.05 3.05Physical ActivityPA1 Space for active play 4 4 4 4 4 4PA2 Training on activities 2 2 2 2 2 2PA3 Write activity policies 2 2 2 2 2 2PA4 Play with children 2 2 2 2 2 2PA5 Don’t withhold play 3 3 3 3 3 3PB1 No screen time < 2 yr 3 3 3 3 3 3PB2 Screen time 30 min/wk 2 2 2 2 2 2PB3 Screen time purpose 2 2 2 2 2 2PB4 No TV w/meals 2 2 2 2 2 2PC1 Outdoor play occasions 3 3 3 3 3 3PC2 Toddler play time 3 3 3 3 3 3PC3 Preschool play time 3 3 3 3 3 3PD1 Structured play 2 2 2 2 2 2PE1 Tummy time often 2 2 2 2 2 2PE2 Limit time infant equip. 3 3 3 3 3 3Average Rating Per CC Type 2.53 2.53 2.53 2.53 2.53 2.53
What Ratings Mean
1 Regulation contradicts the standard
2 Regulation does not mention the content of standard
3 Regulation partially meets standard
4 Regulation fully meets standard CO Page 1 of 2
2010
Improved Rating
Lowered Rating
2012
National Resource Center for Health and Safety in Child Care and Early Education - ASHW 2012 64
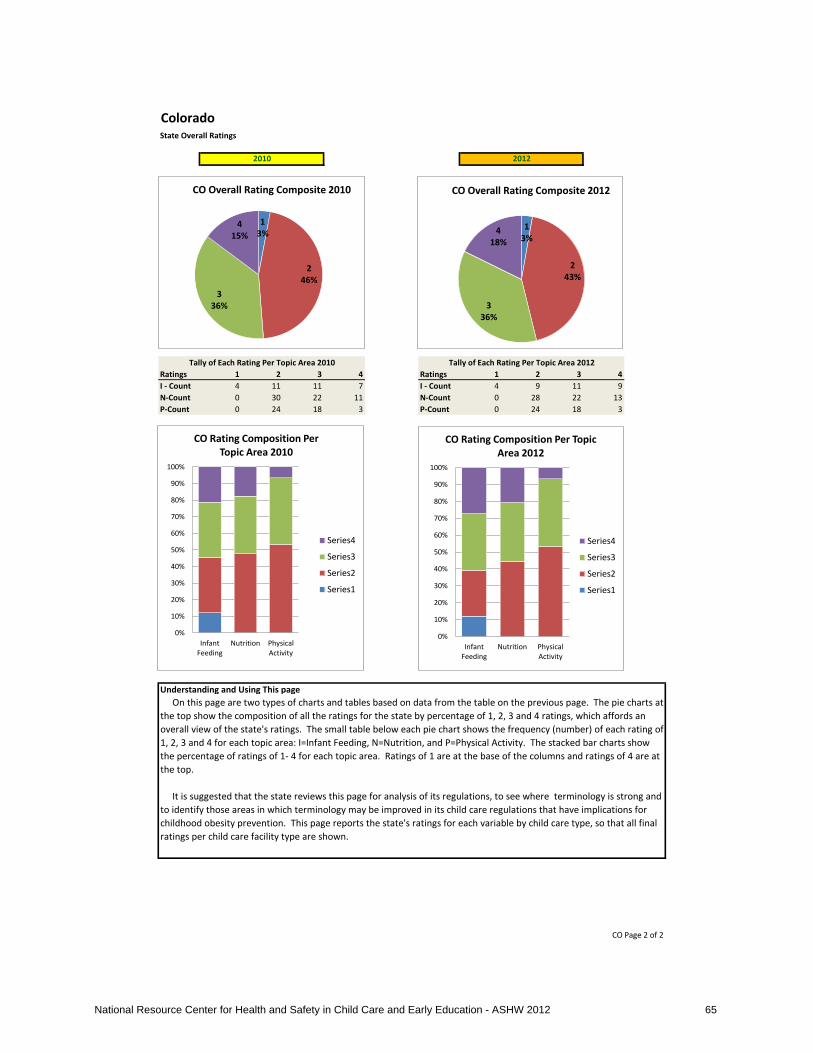
ColoradoState Overall Ratings
Ratings 1 2 3 4 Ratings 1 2 3 4I - Count 4 11 11 7 I - Count 4 9 11 9N-Count 0 30 22 11 N-Count 0 28 22 13P-Count 0 24 18 3 P-Count 0 24 18 3
Understanding and Using This page
CO Page 2 of 2
Tally of Each Rating Per Topic Area 2010 Tally of Each Rating Per Topic Area 2012
On this page are two types of charts and tables based on data from the table on the previous page. The pie charts at the top show the composition of all the ratings for the state by percentage of 1, 2, 3 and 4 ratings, which affords an overall view of the state's ratings. The small table below each pie chart shows the frequency (number) of each rating of 1, 2, 3 and 4 for each topic area: I=Infant Feeding, N=Nutrition, and P=Physical Activity. The stacked bar charts show the percentage of ratings of 1- 4 for each topic area. Ratings of 1 are at the base of the columns and ratings of 4 are at the top. It is suggested that the state reviews this page for analysis of its regulations, to see where terminology is strong and to identify those areas in which terminology may be improved in its child care regulations that have implications for childhood obesity prevention. This page reports the state's ratings for each variable by child care type, so that all final ratings per child care facility type are shown.
2010 2012
1 3%
2 46%
3 36%
4 15%
CO Overall Rating Composite 2010
0%
10%
20%
30%
40%
50%
60%
70%
80%
90%
100%
Infant Feeding
Nutrition Physical Activity
CO Rating Composition Per Topic Area 2010
Series4
Series3
Series2
Series1
1 3%
2 43%
3 36%
4 18%
CO Overall Rating Composite 2012
0%
10%
20%
30%
40%
50%
60%
70%
80%
90%
100%
Infant Feeding
Nutrition Physical Activity
CO Rating Composition Per Topic Area 2012
Series4
Series3
Series2
Series1
National Resource Center for Health and Safety in Child Care and Early Education - ASHW 2012 65

ConnecticutState Overall Ratings Key to Changes
Assessment Year
Components by Topic AreaChild Care
Center
Large Family
Child Care Home
Small Family
Child Care Home
Child Care Center
Large Family
Child Care Home
Small Family
Child Care Home
Infant Feeding IA1 Support breastfeeding 2 2 2 2 2 2IA2 No cow’s milk < 1yr 4 4 2 4 4 2IB1 Feed infants on cue 4 4 2 4 4 2IB2 Stop feed @ satiety 3 3 2 3 3 2IB3 Hold infant to feed 4 4 2 4 4 2IC1 Plan solid introduction 3 3 2 3 3 2IC2 Intro solids @ 4-6 mo 3 3 2 3 3 2IC3 Iron-Fort @ 4-6 mo 3 3 2 3 3 2ID1 Don’t mix formula 2 2 2 2 2 2ID2 Whole fruit 7 m-1 yr 1 1 2 1 1 2ID3 No juice < 12 mo 1 1 2 1 1 2Average Rating Per CC Type 2.73 2.73 2.00 2.73 2.73 2.00NutritionNA1 Limit oils/fats 2 2 2 2 2 2NA2 Low fat meat/proteins 3 3 2 3 3 2NA3 Low fat milk equivalents 3 3 2 3 3 2NA4 Whole milk 1-2 y/o 2 2 2 2 2 2NA5 Low fat milk > 2 y/o 2 2 2 4 4 2NB1 Whole grains 3 3 2 3 3 2NB2 Variety of vegetables 3 3 2 3 3 2NB3 Variety of whole fruit 3 3 2 3 3 2NC1 100% juice 4 4 2 4 4 2NC2 Juice only @ meals 2 2 2 2 2 2NC3 Juice 4-6 oz. 1-6 y/o 3 3 2 3 3 2NC4 Juice 8-12 oz. 7+ y/o 3 3 2 3 3 2ND1 Make water available 4 4 4 4 4 4NE1 Teach portion sizes 2 2 2 2 2 2NE2 Eat with children 2 2 2 2 2 2NF1 Appropriate servings 4 4 2 4 4 2NF2 Healthy seconds 3 3 2 3 3 2NG1 Limit salt 2 2 2 2 2 2NG2 Avoid sugary foods 1 1 2 1 1 2NH1 Food no force/bribe 2 2 2 2 2 2NH2 Food no reward/punish 2 2 2 2 2 2Average Rating Per CC Type 2.62 2.62 2.10 2.71 2.71 2.10Physical ActivityPA1 Space for active play 4 4 4 4 4 4PA2 Training on activities 2 2 2 2 2 2PA3 Write activity policies 2 2 2 2 2 2PA4 Play with children 2 2 2 2 2 2PA5 Don’t withhold play 2 2 2 2 2 2PB1 No screen time < 2 yr 2 2 2 2 2 2PB2 Screen time 30 min/wk 2 2 2 2 2 2PB3 Screen time purpose 2 2 2 2 2 2PB4 No TV w/meals 2 2 2 2 2 2PC1 Outdoor play occasions 3 3 2 3 3 2PC2 Toddler play time 3 3 3 3 3 3PC3 Preschool play time 3 3 3 3 3 3PD1 Structured play 2 2 2 2 2 2PE1* Tummy time often 3 3 2 3 3 2PE2 Limit time infant equip. 2 2 2 2 2 2Average Rating Per CC Type 2.40 2.40 2.27 2.40 2.40 2.27* Rating highlighted blue indicates correction of baseline data.
What Ratings Mean
1 Regulation contradicts the standard
2 Regulation does not mention the content of standard
3 Regulation partially meets standard
4 Regulation fully meets standard CT Page 1 of 2
2010
Improved Rating
Lowered Rating
2012
National Resource Center for Health and Safety in Child Care and Early Education - ASHW 2012 66

ConnecticutState Overall Ratings
Ratings 1 2 3 4 Ratings 1 2 3 4I - Count 4 15 8 6 I - Count 4 15 8 6N-Count 2 38 16 7 N-Count 2 36 16 9P-Count 0 32 10 3 P-Count 0 32 10 3
Understanding and Using This page
CT Page 2 of 2
On this page are two types of charts and tables based on data from the table on the previous page. The pie charts at the top show the composition of all the ratings for the state by percentage of 1, 2, 3 and 4 ratings, which affords an overall view of the state's ratings. The small table below each pie chart shows the frequency (number) of each rating of 1, 2, 3 and 4 for each topic area: I=Infant Feeding, N=Nutrition, and P=Physical Activity. The stacked bar charts show the percentage of ratings of 1- 4 for each topic area. Ratings of 1 are at the base of the columns and ratings of 4 are at the top. It is suggested that the state reviews this page for analysis of its regulations, to see where terminology is strong and to identify those areas in which terminology may be improved in its child care regulations that have implications for childhood obesity prevention. This page reports the state's ratings for each variable by child care type, so that all final ratings per child care facility type are shown.
2010 2012
Tally of Each Rating Per Topic Area 2010 Tally of Each Rating Per Topic Area 2012
1 4%
2 60%
3 24%
4 11%
CT Overall Rating Composite 2010
0%
10%
20%
30%
40%
50%
60%
70%
80%
90%
100%
Infant Feeding
Nutrition Physical Activity
CT Rating Composition Per Topic Area 2010
Series4
Series3
Series2
Series1
1 4%
2 59%
3 24%
4 13%
CT Overall Rating Composite 2012
0%
10%
20%
30%
40%
50%
60%
70%
80%
90%
100%
Infant Feeding
Nutrition Physical Activity
CT Rating Composition Per Topic Area 2012
Series4
Series3
Series2
Series1
National Resource Center for Health and Safety in Child Care and Early Education - ASHW 2012 67
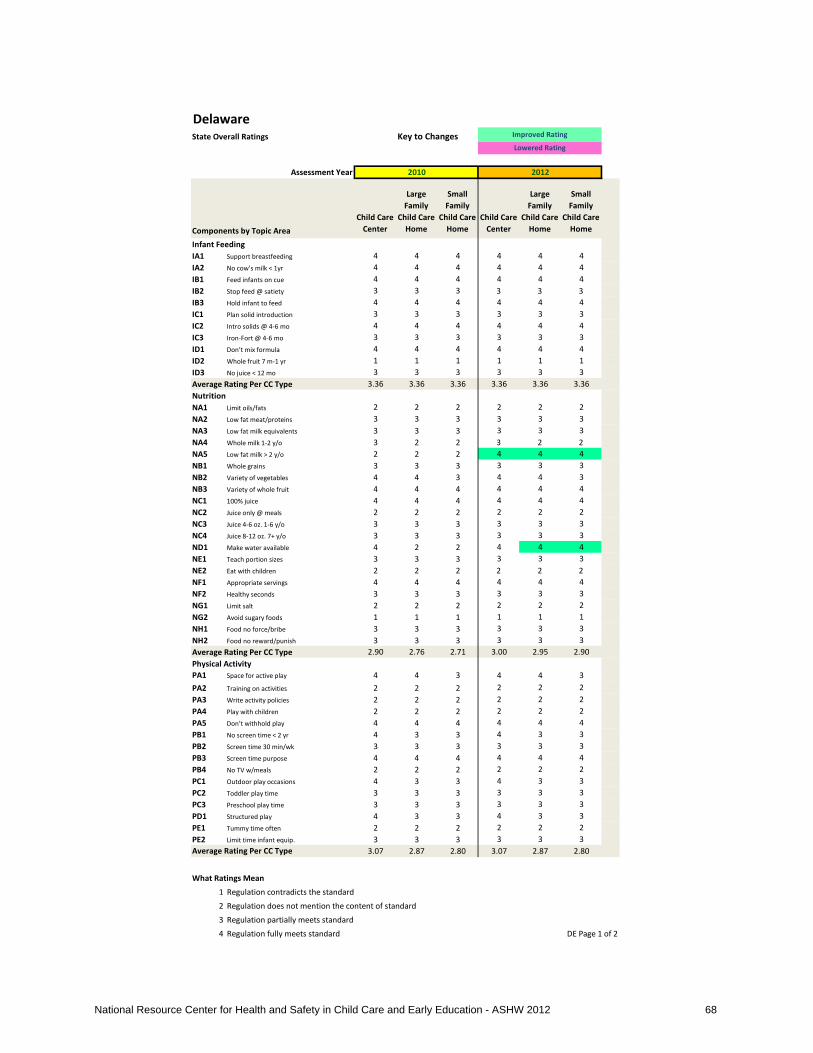
DelawareState Overall Ratings Key to Changes
Assessment Year
Components by Topic AreaChild Care
Center
Large Family
Child Care Home
Small Family
Child Care Home
Child Care Center
Large Family
Child Care Home
Small Family
Child Care Home
Infant Feeding IA1 Support breastfeeding 4 4 4 4 4 4IA2 No cow’s milk < 1yr 4 4 4 4 4 4IB1 Feed infants on cue 4 4 4 4 4 4IB2 Stop feed @ satiety 3 3 3 3 3 3IB3 Hold infant to feed 4 4 4 4 4 4IC1 Plan solid introduction 3 3 3 3 3 3IC2 Intro solids @ 4-6 mo 4 4 4 4 4 4IC3 Iron-Fort @ 4-6 mo 3 3 3 3 3 3ID1 Don’t mix formula 4 4 4 4 4 4ID2 Whole fruit 7 m-1 yr 1 1 1 1 1 1ID3 No juice < 12 mo 3 3 3 3 3 3Average Rating Per CC Type 3.36 3.36 3.36 3.36 3.36 3.36NutritionNA1 Limit oils/fats 2 2 2 2 2 2NA2 Low fat meat/proteins 3 3 3 3 3 3NA3 Low fat milk equivalents 3 3 3 3 3 3NA4 Whole milk 1-2 y/o 3 2 2 3 2 2NA5 Low fat milk > 2 y/o 2 2 2 4 4 4NB1 Whole grains 3 3 3 3 3 3NB2 Variety of vegetables 4 4 3 4 4 3NB3 Variety of whole fruit 4 4 4 4 4 4NC1 100% juice 4 4 4 4 4 4NC2 Juice only @ meals 2 2 2 2 2 2NC3 Juice 4-6 oz. 1-6 y/o 3 3 3 3 3 3NC4 Juice 8-12 oz. 7+ y/o 3 3 3 3 3 3ND1 Make water available 4 2 2 4 4 4NE1 Teach portion sizes 3 3 3 3 3 3NE2 Eat with children 2 2 2 2 2 2NF1 Appropriate servings 4 4 4 4 4 4NF2 Healthy seconds 3 3 3 3 3 3NG1 Limit salt 2 2 2 2 2 2NG2 Avoid sugary foods 1 1 1 1 1 1NH1 Food no force/bribe 3 3 3 3 3 3NH2 Food no reward/punish 3 3 3 3 3 3Average Rating Per CC Type 2.90 2.76 2.71 3.00 2.95 2.90Physical ActivityPA1 Space for active play 4 4 3 4 4 3PA2 Training on activities 2 2 2 2 2 2PA3 Write activity policies 2 2 2 2 2 2PA4 Play with children 2 2 2 2 2 2PA5 Don’t withhold play 4 4 4 4 4 4PB1 No screen time < 2 yr 4 3 3 4 3 3PB2 Screen time 30 min/wk 3 3 3 3 3 3PB3 Screen time purpose 4 4 4 4 4 4PB4 No TV w/meals 2 2 2 2 2 2PC1 Outdoor play occasions 4 3 3 4 3 3PC2 Toddler play time 3 3 3 3 3 3PC3 Preschool play time 3 3 3 3 3 3PD1 Structured play 4 3 3 4 3 3PE1 Tummy time often 2 2 2 2 2 2PE2 Limit time infant equip. 3 3 3 3 3 3Average Rating Per CC Type 3.07 2.87 2.80 3.07 2.87 2.80
What Ratings Mean
1 Regulation contradicts the standard
2 Regulation does not mention the content of standard
3 Regulation partially meets standard
4 Regulation fully meets standard DE Page 1 of 2
2010
Improved Rating
Lowered Rating
2012
National Resource Center for Health and Safety in Child Care and Early Education - ASHW 2012 68

DelawareState Overall Ratings
Ratings 1 2 3 4 Ratings 1 2 3 4I - Count 3 0 12 18 I - Count 3 0 12 18N-Count 3 19 29 12 N-Count 3 14 29 17P-Count 0 15 19 11 P-Count 0 15 19 11
Understanding and Using This page
DE Page 2 of 2
Tally of Each Rating Per Topic Area 2010 Tally of Each Rating Per Topic Area 2012
On this page are two types of charts and tables based on data from the table on the previous page. The pie charts at the top show the composition of all the ratings for the state by percentage of 1, 2, 3 and 4 ratings, which affords an overall view of the state's ratings. The small table below each pie chart shows the frequency (number) of each rating of 1, 2, 3 and 4 for each topic area: I=Infant Feeding, N=Nutrition, and P=Physical Activity. The stacked bar charts show the percentage of ratings of 1- 4 for each topic area. Ratings of 1 are at the base of the columns and ratings of 4 are at the top. It is suggested that the state reviews this page for analysis of its regulations, to see where terminology is strong and to identify those areas in which terminology may be improved in its child care regulations that have implications for childhood obesity prevention. This page reports the state's ratings for each variable by child care type, so that all final ratings per child care facility type are shown.
2010 2012
1 4%
2 24%
3 43%
4 29%
DE Overall Rating Composite 2010
0%
10%
20%
30%
40%
50%
60%
70%
80%
90%
100%
Infant Feeding
Nutrition Physical Activity
DE Rating Composition Per Topic Area 2010
Series4
Series3
Series2
Series1
1 4% 2
21%
3 43%
4 33%
DE Overall Rating Composite 2012
0%
10%
20%
30%
40%
50%
60%
70%
80%
90%
100%
Infant Feeding
Nutrition Physical Activity
DE Rating Composition Per Topic Area 2012
Series4
Series3
Series2
Series1
National Resource Center for Health and Safety in Child Care and Early Education - ASHW 2012 69
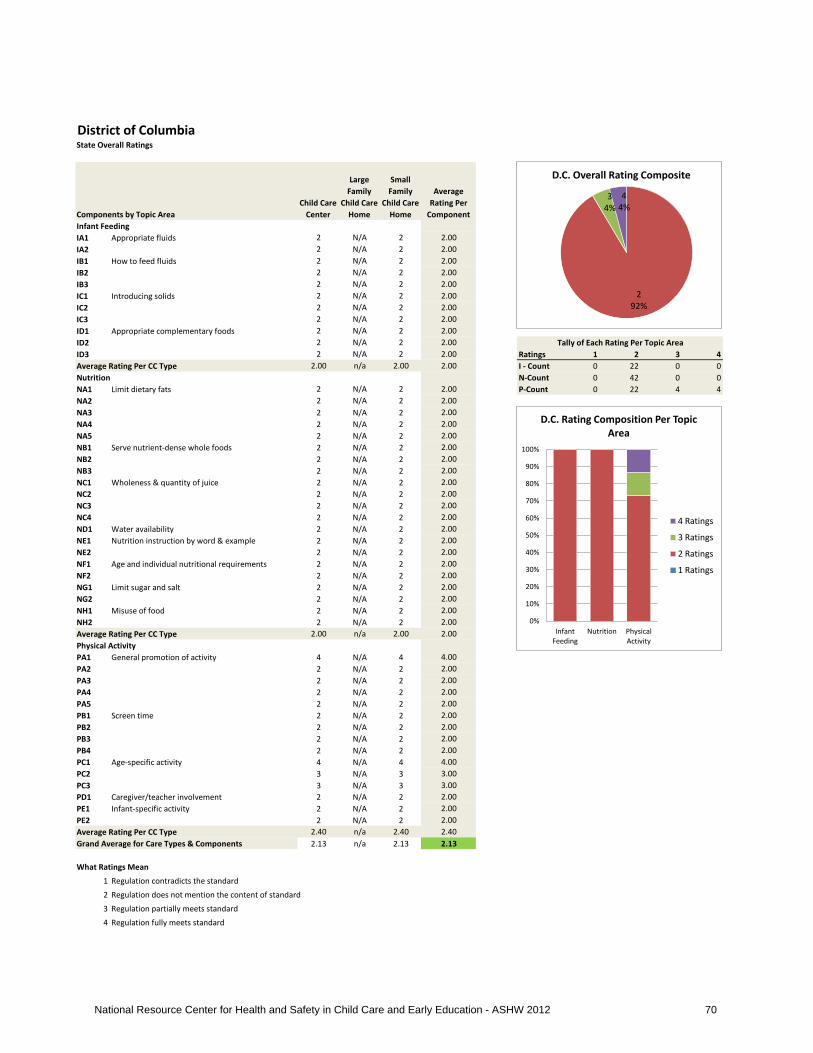
District of ColumbiaState Overall Ratings
Components by Topic AreaChild Care
Center
Large Family
Child Care Home
Small Family
Child Care Home
Average Rating Per
ComponentInfant Feeding IA1 Appropriate fluids 2 N/A 2 2.00IA2 2 N/A 2 2.00IB1 How to feed fluids 2 N/A 2 2.00IB2 2 N/A 2 2.00IB3 2 N/A 2 2.00IC1 Introducing solids 2 N/A 2 2.00IC2 2 N/A 2 2.00IC3 2 N/A 2 2.00ID1 Appropriate complementary foods 2 N/A 2 2.00ID2 2 N/A 2 2.00ID3 2 N/A 2 2.00 Ratings 1 2 3 4Average Rating Per CC Type 2.00 n/a 2.00 2.00 I - Count 0 22 0 0Nutrition N-Count 0 42 0 0NA1 Limit dietary fats 2 N/A 2 2.00 P-Count 0 22 4 4NA2 2 N/A 2 2.00NA3 2 N/A 2 2.00NA4 2 N/A 2 2.00NA5 2 N/A 2 2.00NB1 Serve nutrient-dense whole foods 2 N/A 2 2.00NB2 2 N/A 2 2.00NB3 2 N/A 2 2.00NC1 Wholeness & quantity of juice 2 N/A 2 2.00NC2 2 N/A 2 2.00NC3 2 N/A 2 2.00NC4 2 N/A 2 2.00ND1 Water availability 2 N/A 2 2.00NE1 Nutrition instruction by word & example 2 N/A 2 2.00NE2 2 N/A 2 2.00NF1 Age and individual nutritional requirements 2 N/A 2 2.00NF2 2 N/A 2 2.00NG1 Limit sugar and salt 2 N/A 2 2.00NG2 2 N/A 2 2.00NH1 Misuse of food 2 N/A 2 2.00NH2 2 N/A 2 2.00Average Rating Per CC Type 2.00 n/a 2.00 2.00Physical ActivityPA1 General promotion of activity 4 N/A 4 4.00PA2 2 N/A 2 2.00PA3 2 N/A 2 2.00PA4 2 N/A 2 2.00PA5 2 N/A 2 2.00PB1 Screen time 2 N/A 2 2.00PB2 2 N/A 2 2.00PB3 2 N/A 2 2.00PB4 2 N/A 2 2.00PC1 Age-specific activity 4 N/A 4 4.00PC2 3 N/A 3 3.00PC3 3 N/A 3 3.00PD1 Caregiver/teacher involvement 2 N/A 2 2.00PE1 Infant-specific activity 2 N/A 2 2.00PE2 2 N/A 2 2.00Average Rating Per CC Type 2.40 n/a 2.40 2.40Grand Average for Care Types & Components 2.13 n/a 2.13 2.13
What Ratings Mean
1 Regulation contradicts the standard
2 Regulation does not mention the content of standard
3 Regulation partially meets standard
4 Regulation fully meets standard
Tally of Each Rating Per Topic Area
2 92%
3 4%
4 4%
D.C. Overall Rating Composite
0%
10%
20%
30%
40%
50%
60%
70%
80%
90%
100%
Infant Feeding
Nutrition Physical Activity
D.C. Rating Composition Per Topic Area
4 Ratings
3 Ratings
2 Ratings
1 Ratings
National Resource Center for Health and Safety in Child Care and Early Education - ASHW 2012 70
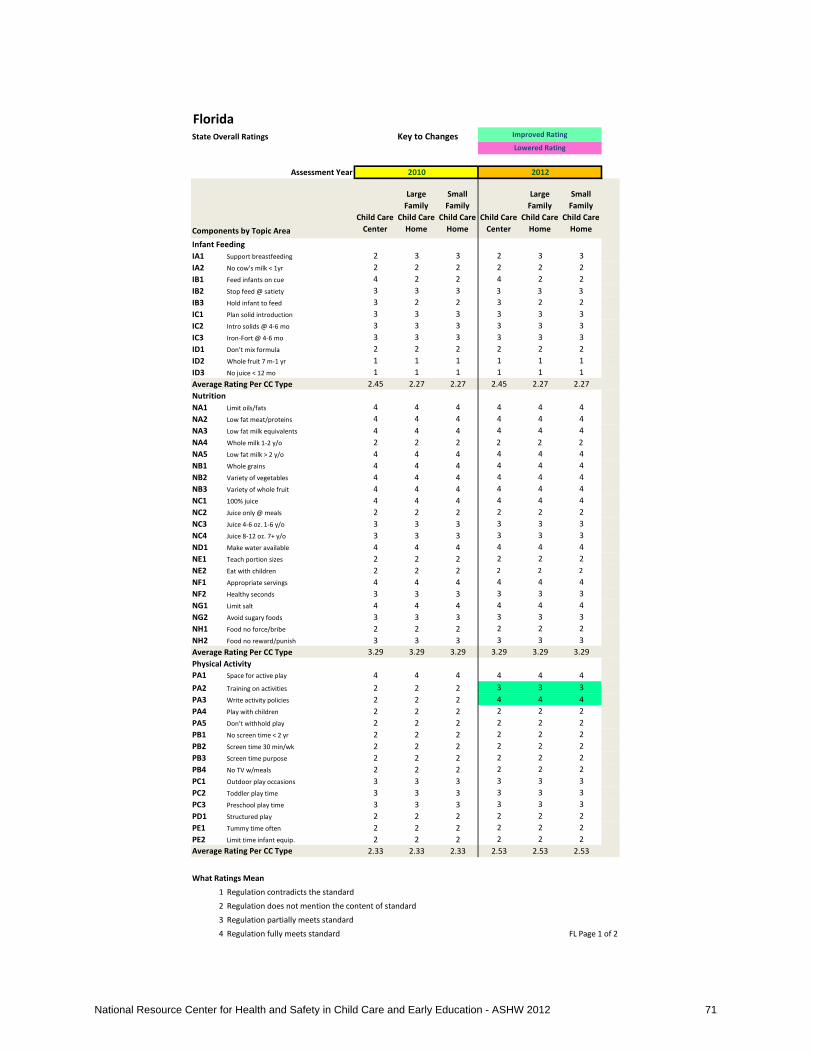
FloridaState Overall Ratings Key to Changes
Assessment Year
Components by Topic AreaChild Care
Center
Large Family
Child Care Home
Small Family
Child Care Home
Child Care Center
Large Family
Child Care Home
Small Family
Child Care Home
Infant Feeding IA1 Support breastfeeding 2 3 3 2 3 3IA2 No cow’s milk < 1yr 2 2 2 2 2 2IB1 Feed infants on cue 4 2 2 4 2 2IB2 Stop feed @ satiety 3 3 3 3 3 3IB3 Hold infant to feed 3 2 2 3 2 2IC1 Plan solid introduction 3 3 3 3 3 3IC2 Intro solids @ 4-6 mo 3 3 3 3 3 3IC3 Iron-Fort @ 4-6 mo 3 3 3 3 3 3ID1 Don’t mix formula 2 2 2 2 2 2ID2 Whole fruit 7 m-1 yr 1 1 1 1 1 1ID3 No juice < 12 mo 1 1 1 1 1 1Average Rating Per CC Type 2.45 2.27 2.27 2.45 2.27 2.27NutritionNA1 Limit oils/fats 4 4 4 4 4 4NA2 Low fat meat/proteins 4 4 4 4 4 4NA3 Low fat milk equivalents 4 4 4 4 4 4NA4 Whole milk 1-2 y/o 2 2 2 2 2 2NA5 Low fat milk > 2 y/o 4 4 4 4 4 4NB1 Whole grains 4 4 4 4 4 4NB2 Variety of vegetables 4 4 4 4 4 4NB3 Variety of whole fruit 4 4 4 4 4 4NC1 100% juice 4 4 4 4 4 4NC2 Juice only @ meals 2 2 2 2 2 2NC3 Juice 4-6 oz. 1-6 y/o 3 3 3 3 3 3NC4 Juice 8-12 oz. 7+ y/o 3 3 3 3 3 3ND1 Make water available 4 4 4 4 4 4NE1 Teach portion sizes 2 2 2 2 2 2NE2 Eat with children 2 2 2 2 2 2NF1 Appropriate servings 4 4 4 4 4 4NF2 Healthy seconds 3 3 3 3 3 3NG1 Limit salt 4 4 4 4 4 4NG2 Avoid sugary foods 3 3 3 3 3 3NH1 Food no force/bribe 2 2 2 2 2 2NH2 Food no reward/punish 3 3 3 3 3 3Average Rating Per CC Type 3.29 3.29 3.29 3.29 3.29 3.29Physical ActivityPA1 Space for active play 4 4 4 4 4 4PA2 Training on activities 2 2 2 3 3 3PA3 Write activity policies 2 2 2 4 4 4PA4 Play with children 2 2 2 2 2 2PA5 Don’t withhold play 2 2 2 2 2 2PB1 No screen time < 2 yr 2 2 2 2 2 2PB2 Screen time 30 min/wk 2 2 2 2 2 2PB3 Screen time purpose 2 2 2 2 2 2PB4 No TV w/meals 2 2 2 2 2 2PC1 Outdoor play occasions 3 3 3 3 3 3PC2 Toddler play time 3 3 3 3 3 3PC3 Preschool play time 3 3 3 3 3 3PD1 Structured play 2 2 2 2 2 2PE1 Tummy time often 2 2 2 2 2 2PE2 Limit time infant equip. 2 2 2 2 2 2Average Rating Per CC Type 2.33 2.33 2.33 2.53 2.53 2.53
What Ratings Mean
1 Regulation contradicts the standard
2 Regulation does not mention the content of standard
3 Regulation partially meets standard
4 Regulation fully meets standard FL Page 1 of 2
2010
Improved Rating
Lowered Rating
2012
National Resource Center for Health and Safety in Child Care and Early Education - ASHW 2012 71
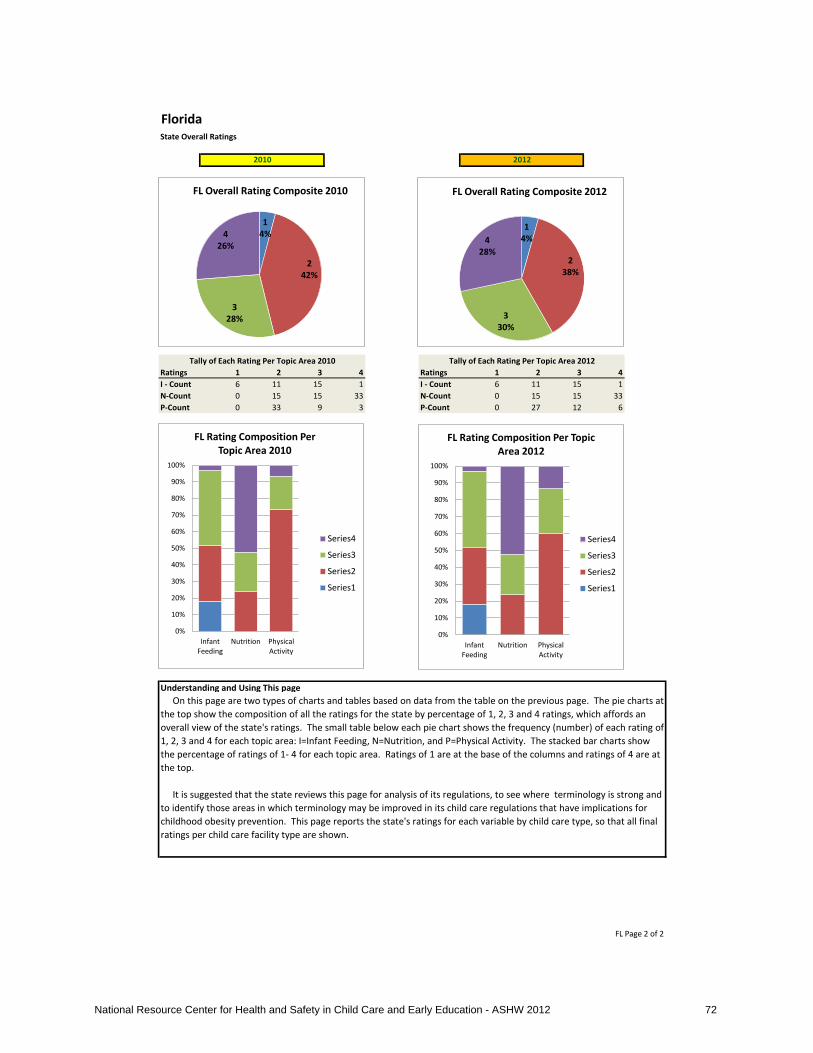
FloridaState Overall Ratings
Ratings 1 2 3 4 Ratings 1 2 3 4I - Count 6 11 15 1 I - Count 6 11 15 1N-Count 0 15 15 33 N-Count 0 15 15 33P-Count 0 33 9 3 P-Count 0 27 12 6
Understanding and Using This page
FL Page 2 of 2
Tally of Each Rating Per Topic Area 2010 Tally of Each Rating Per Topic Area 2012
On this page are two types of charts and tables based on data from the table on the previous page. The pie charts at the top show the composition of all the ratings for the state by percentage of 1, 2, 3 and 4 ratings, which affords an overall view of the state's ratings. The small table below each pie chart shows the frequency (number) of each rating of 1, 2, 3 and 4 for each topic area: I=Infant Feeding, N=Nutrition, and P=Physical Activity. The stacked bar charts show the percentage of ratings of 1- 4 for each topic area. Ratings of 1 are at the base of the columns and ratings of 4 are at the top. It is suggested that the state reviews this page for analysis of its regulations, to see where terminology is strong and to identify those areas in which terminology may be improved in its child care regulations that have implications for childhood obesity prevention. This page reports the state's ratings for each variable by child care type, so that all final ratings per child care facility type are shown.
2010 2012
1 4%
2 42%
3 28%
4 26%
FL Overall Rating Composite 2010
0%
10%
20%
30%
40%
50%
60%
70%
80%
90%
100%
Infant Feeding
Nutrition Physical Activity
FL Rating Composition Per Topic Area 2010
Series4
Series3
Series2
Series1
1 4%
2 38%
3 30%
4 28%
FL Overall Rating Composite 2012
0%
10%
20%
30%
40%
50%
60%
70%
80%
90%
100%
Infant Feeding
Nutrition Physical Activity
FL Rating Composition Per Topic Area 2012
Series4
Series3
Series2
Series1
National Resource Center for Health and Safety in Child Care and Early Education - ASHW 2012 72

GeorgiaState Overall Ratings Key to Changes
Assessment Year
Components by Topic AreaChild Care
Center
Large Family
Child Care Home
Small Family
Child Care Home
Child Care Center
Large Family
Child Care Home
Small Family
Child Care Home
Infant Feeding IA1 Support breastfeeding 4 3 2 4 3 2IA2 No cow’s milk < 1yr 4 4 2 4 4 2IB1 Feed infants on cue 4 4 2 4 4 2IB2 Stop feed @ satiety 3 3 2 3 3 2IB3 Hold infant to feed 3 3 3 3 3 3IC1 Plan solid introduction 3 3 2 3 3 2IC2 Intro solids @ 4-6 mo 3 3 2 3 3 2IC3 Iron-Fort @ 4-6 mo 3 3 2 3 3 2ID1 Don’t mix formula 2 2 2 2 2 2ID2 Whole fruit 7 m-1 yr 1 1 2 1 1 2ID3 No juice < 12 mo 1 1 2 1 1 2Average Rating Per CC Type 2.82 2.73 2.09 2.82 2.73 2.09NutritionNA1 Limit oils/fats 2 2 2 2 2 2NA2 Low fat meat/proteins 3 3 3 3 3 3NA3 Low fat milk equivalents 3 3 3 3 3 3NA4 Whole milk 1-2 y/o 2 2 2 2 2 2NA5 Low fat milk > 2 y/o 2 2 2 4 4 2NB1 Whole grains 3 3 2 3 3 2NB2 Variety of vegetables 3 3 3 3 3 3NB3 Variety of whole fruit 3 3 3 3 3 3NC1 100% juice 4 4 2 4 4 2NC2 Juice only @ meals 2 2 2 2 2 2NC3 Juice 4-6 oz. 1-6 y/o 3 3 2 3 3 2NC4 Juice 8-12 oz. 7+ y/o 3 3 2 3 3 2ND1 Make water available 3 3 2 4 4 2NE1 Teach portion sizes 2 2 2 2 2 2NE2 Eat with children 2 2 2 2 2 2NF1 Appropriate servings 4 4 4 4 4 4NF2 Healthy seconds 3 3 2 3 3 2NG1 Limit salt 2 2 2 2 2 2NG2 Avoid sugary foods 3 3 2 3 3 2NH1 Food no force/bribe 3 3 3 3 3 3NH2 Food no reward/punish 4 4 4 4 4 4Average Rating Per CC Type 2.81 2.81 2.43 2.95 2.95 2.43Physical ActivityPA1 Space for active play 4 4 3 4 4 3PA2 Training on activities 2 2 2 2 2 2PA3 Write activity policies 2 2 2 2 2 2PA4 Play with children 2 2 2 2 2 2PA5 Don’t withhold play 2 2 2 2 2 2PB1 No screen time < 2 yr 2 2 2 2 2 2PB2 Screen time 30 min/wk 3 3 3 3 3 3PB3 Screen time purpose 2 2 2 2 2 2PB4 No TV w/meals 2 2 2 2 2 2PC1 Outdoor play occasions 3 3 3 3 3 3PC2 Toddler play time 3 3 3 3 3 3PC3 Preschool play time 3 3 3 3 3 3PD1 Structured play 2 2 2 2 2 2PE1 Tummy time often 2 2 2 2 2 2PE2 Limit time infant equip. 3 3 2 3 3 2Average Rating Per CC Type 2.47 2.47 2.33 2.47 2.47 2.33
What Ratings Mean
1 Regulation contradicts the standard
2 Regulation does not mention the content of standard
3 Regulation partially meets standard
4 Regulation fully meets standard GA Page 1 of 2
2010
Improved Rating
Lowered Rating
2012
National Resource Center for Health and Safety in Child Care and Early Education - ASHW 2012 73

GeorgiaState Overall Ratings
Ratings 1 2 3 4 Ratings 1 2 3 4I - Count 4 12 12 5 I - Count 4 12 12 5N-Count 0 28 27 8 N-Count 0 26 25 12P-Count 0 28 15 2 P-Count 0 28 15 2
Understanding and Using This page
GA Page 2 of 2
Tally of Each Rating Per Topic Area 2010 Tally of Each Rating Per Topic Area 2012
On this page are two types of charts and tables based on data from the table on the previous page. The pie charts at the top show the composition of all the ratings for the state by percentage of 1, 2, 3 and 4 ratings, which affords an overall view of the state's ratings. The small table below each pie chart shows the frequency (number) of each rating of 1, 2, 3 and 4 for each topic area: I=Infant Feeding, N=Nutrition, and P=Physical Activity. The stacked bar charts show the percentage of ratings of 1- 4 for each topic area. Ratings of 1 are at the base of the columns and ratings of 4 are at the top. It is suggested that the state reviews this page for analysis of its regulations, to see where terminology is strong and to identify those areas in which terminology may be improved in its child care regulations that have implications for childhood obesity prevention. This page reports the state's ratings for each variable by child care type, so that all final ratings per child care facility type are shown.
2010 2012
1 3%
2 48% 3
38%
4 11%
GA Overall Rating Composite 2010
0%
10%
20%
30%
40%
50%
60%
70%
80%
90%
100%
Infant Feeding
Nutrition Physical Activity
GA Rating Composition Per Topic Area 2010
Series4
Series3
Series2
Series1
1 3%
2 47%
3 37%
4 13%
GA Overall Rating Composite 2012
0%
10%
20%
30%
40%
50%
60%
70%
80%
90%
100%
Infant Feeding
Nutrition Physical Activity
GA Rating Composition Per Topic Area 2012
Series4
Series3
Series2
Series1
National Resource Center for Health and Safety in Child Care and Early Education - ASHW 2012 74

HawaiiState Overall Ratings Key to Changes
Assessment Year
Components by Topic AreaChild Care
Center
Large Family
Child Care Home
Small Family
Child Care Home
Child Care Center
Large Family
Child Care Home
Small Family
Child Care Home
Infant Feeding IA1 Support breastfeeding 3 3 3 3 3 3IA2 No cow’s milk < 1yr 4 4 4 4 4 4IB1 Feed infants on cue 4 4 4 4 4 4IB2 Stop feed @ satiety 3 3 3 3 3 3IB3 Hold infant to feed 4 2 3 4 2 3IC1 Plan solid introduction 3 3 3 3 3 3IC2 Intro solids @ 4-6 mo 3 3 3 3 3 3IC3 Iron-Fort @ 4-6 mo 3 3 3 3 3 3ID1 Don’t mix formula 2 2 2 2 2 2ID2 Whole fruit 7 m-1 yr 1 1 1 1 1 1ID3 No juice < 12 mo 1 1 1 1 1 1Average Rating Per CC Type 2.82 2.64 2.73 2.82 2.64 2.73NutritionNA1 Limit oils/fats 2 2 2 2 2 2NA2 Low fat meat/proteins 3 3 3 3 3 3NA3 Low fat milk equivalents 3 3 3 3 3 3NA4 Whole milk 1-2 y/o 2 2 2 2 2 2NA5 Low fat milk > 2 y/o 2 2 2 4 4 4NB1 Whole grains 3 3 3 3 3 3NB2 Variety of vegetables 3 3 3 3 3 3NB3 Variety of whole fruit 3 3 3 3 3 3NC1 100% juice 4 4 4 4 4 4NC2 Juice only @ meals 2 2 2 2 2 2NC3 Juice 4-6 oz. 1-6 y/o 3 3 3 3 3 3NC4 Juice 8-12 oz. 7+ y/o 3 3 3 3 3 3ND1 Make water available 3 3 3 4 4 4NE1 Teach portion sizes 2 2 2 2 2 2NE2 Eat with children 2 2 2 2 2 2NF1 Appropriate servings 4 4 4 4 4 4NF2 Healthy seconds 3 3 3 3 3 3NG1 Limit salt 2 2 2 2 2 2NG2 Avoid sugary foods 1 1 1 1 1 1NH1 Food no force/bribe 3 3 3 3 3 3NH2 Food no reward/punish 4 4 4 4 4 4Average Rating Per CC Type 2.71 2.71 2.71 2.86 2.86 2.86Physical ActivityPA1 Space for active play 4 4 4 4 4 4PA2 Training on activities 2 2 2 2 2 2PA3 Write activity policies 2 2 2 2 2 2PA4 Play with children 2 2 2 2 2 2PA5 Don’t withhold play 2 2 2 2 2 2PB1 No screen time < 2 yr 2 2 2 2 2 2PB2 Screen time 30 min/wk 2 2 2 2 2 2PB3 Screen time purpose 2 2 2 2 2 2PB4 No TV w/meals 2 2 2 2 2 2PC1 Outdoor play occasions 3 3 3 3 3 3PC2 Toddler play time 3 3 3 3 3 3PC3 Preschool play time 3 3 3 3 3 3PD1 Structured play 2 2 2 2 2 2PE1 Tummy time often 2 2 2 2 2 2PE2 Limit time infant equip. 2 2 2 2 2 2Average Rating Per CC Type 2.33 2.33 2.33 2.33 2.33 2.33
What Ratings Mean
1 Regulation contradicts the standard
2 Regulation does not mention the content of standard
3 Regulation partially meets standard
4 Regulation fully meets standard HI Page 1 of 2
2010
Improved Rating
Lowered Rating
2012
National Resource Center for Health and Safety in Child Care and Early Education - ASHW 2012 75

HawaiiState Overall Ratings
Ratings 1 2 3 4 Ratings 1 2 3 4I - Count 6 4 16 7 I - Count 6 4 16 7N-Count 3 21 30 9 N-Count 3 18 27 15P-Count 0 33 9 3 P-Count 0 33 9 3
Understanding and Using This page
HI Page 2 of 2
Tally of Each Rating Per Topic Area 2010 Tally of Each Rating Per Topic Area 2012
On this page are two types of charts and tables based on data from the table on the previous page. The pie charts at the top show the composition of all the ratings for the state by percentage of 1, 2, 3 and 4 ratings, which affords an overall view of the state's ratings. The small table below each pie chart shows the frequency (number) of each rating of 1, 2, 3 and 4 for each topic area: I=Infant Feeding, N=Nutrition, and P=Physical Activity. The stacked bar charts show the percentage of ratings of 1- 4 for each topic area. Ratings of 1 are at the base of the columns and ratings of 4 are at the top. It is suggested that the state reviews this page for analysis of its regulations, to see where terminology is strong and to identify those areas in which terminology may be improved in its child care regulations that have implications for childhood obesity prevention. This page reports the state's ratings for each variable by child care type, so that all final ratings per child care facility type are shown.
2010 2012
1 6%
2 41%
3 39%
4 13%
HI Overall Rating Composite 2010
0%
10%
20%
30%
40%
50%
60%
70%
80%
90%
100%
Infant Feeding
Nutrition Physical Activity
HI Rating Composition Per Topic Area 2010
Series4
Series3
Series2
Series1
1 6%
2 39%
3 37%
4 18%
HI Overall Rating Composite 2012
0%
10%
20%
30%
40%
50%
60%
70%
80%
90%
100%
Infant Feeding
Nutrition Physical Activity
HI Rating Composition Per Topic Area 2012
Series4
Series3
Series2
Series1
National Resource Center for Health and Safety in Child Care and Early Education - ASHW 2012 76

IdahoState Overall Ratings
Components by Topic AreaChild Care
Center
Large Family
Child Care Home
Small Family
Child Care Home
Average Rating Per
ComponentInfant Feeding IA1 Appropriate fluids 2 2 2 2.00IA2 2 2 2 2.00IB1 How to feed fluids 2 2 2 2.00IB2 2 2 2 2.00IB3 2 2 2 2.00IC1 Introducing solids 2 2 2 2.00IC2 2 2 2 2.00IC3 2 2 2 2.00ID1 Appropriate complementary foods 2 2 2 2.00ID2 2 2 2 2.00ID3 2 2 2 2.00 Ratings 1 2 3 4Average Rating Per CC Type 2.00 2.00 2.00 2.00 I - Count 0 33 0 0Nutrition N-Count 0 63 0 0NA1 Limit dietary fats 2 2 2 2.00 P-Count 0 41 2 2NA2 2 2 2 2.00NA3 2 2 2 2.00NA4 2 2 2 2.00NA5 2 2 2 2.00NB1 Serve nutrient-dense whole foods 2 2 2 2.00NB2 2 2 2 2.00NB3 2 2 2 2.00NC1 Wholeness & quantity of juice 2 2 2 2.00NC2 2 2 2 2.00NC3 2 2 2 2.00NC4 2 2 2 2.00ND1 Water availability 2 2 2 2.00NE1 Nutrition instruction by word & example 2 2 2 2.00NE2 2 2 2 2.00NF1 Age and individual nutritional requirements 2 2 2 2.00NF2 2 2 2 2.00NG1 Limit sugar and salt 2 2 2 2.00NG2 2 2 2 2.00NH1 Misuse of food 2 2 2 2.00NH2 2 2 2 2.00Average Rating Per CC Type 2.00 2.00 2.00 2.00Physical ActivityPA1 General promotion of activity 2 4 4 3.33PA2 2 2 2 2.00PA3 2 3 3 2.67PA4 2 2 2 2.00PA5 2 2 2 2.00PB1 Screen time 2 2 2 2.00PB2 2 2 2 2.00PB3 2 2 2 2.00PB4 2 2 2 2.00PC1 Age-specific activity 2 2 2 2.00PC2 2 2 2 2.00PC3 2 2 2 2.00PD1 Caregiver/teacher involvement 2 2 2 2.00PE1 Infant-specific activity 2 2 2 2.00PE2 2 2 2 2.00Average Rating Per CC Type 2.00 2.20 2.20 2.13Grand Average for Care Types & Components 2.00 2.06 2.06 2.04
What Ratings Mean
1 Regulation contradicts the standard
2 Regulation does not mention the content of standard
3 Regulation partially meets standard
4 Regulation fully meets standard
Tally of Each Rating Per Topic Area
2 97%
3 2%
4 1%
ID Overall Rating Composite
0%
10%
20%
30%
40%
50%
60%
70%
80%
90%
100%
Infant Feeding
Nutrition Physical Activity
ID Rating Composition Per Topic Area
4 Ratings
3 Ratings
2 Ratings
1 Ratings
National Resource Center for Health and Safety in Child Care and Early Education - ASHW 2012 77

IllinoisState Overall Ratings
Components by Topic AreaChild Care
Center
Large Family
Child Care Home
Small Family
Child Care Home
Average Rating Per
ComponentInfant Feeding IA1 Appropriate fluids 2 2 2 2.00IA2 1 1 1 1.00IB1 How to feed fluids 2 4 4 3.33IB2 2 2 2 2.00IB3 3 3 3 3.00IC1 Introducing solids 3 3 3 3.00IC2 4 3 3 3.33IC3 3 3 3 3.00ID1 Appropriate complementary foods 2 2 2 2.00ID2 1 1 1 1.00ID3 1 1 1 1.00 Ratings 1 2 3 4Average Rating Per CC Type 2.18 2.27 2.27 2.24 I - Count 9 10 11 3Nutrition N-Count 0 22 24 17NA1 Limit dietary fats 2 2 2 2.00 P-Count 0 22 17 6NA2 3 3 3 3.00NA3 3 3 3 3.00NA4 3 2 2 2.33NA5 3 2 2 2.33NB1 Serve nutrient-dense whole foods 3 3 3 3.00NB2 3 4 3 3.33NB3 4 4 4 4.00NC1 Wholeness & quantity of juice 4 4 4 4.00NC2 2 2 2 2.00NC3 3 4 4 3.67NC4 4 4 4 4.00ND1 Water availability 3 3 3 3.00NE1 Nutrition instruction by word & example 3 2 2 2.33NE2 2 2 2 2.00NF1 Age and individual nutritional requirements 4 4 4 4.00NF2 3 2 2 2.33NG1 Limit sugar and salt 2 2 2 2.00NG2 3 2 2 2.33NH1 Misuse of food 4 3 3 3.33NH2 4 3 3 3.33Average Rating Per CC Type 3.10 2.86 2.81 2.92Physical ActivityPA1 General promotion of activity 4 4 4 4.00PA2 2 2 2 2.00PA3 2 2 2 2.00PA4 2 2 2 2.00PA5 3 3 3 3.00PB1 Screen time 3 2 2 2.33PB2 3 2 2 2.33PB3 2 2 2 2.00PB4 2 2 2 2.00PC1 Age-specific activity 3 3 3 3.00PC2 3 3 3 3.00PC3 3 3 3 3.00PD1 Caregiver/teacher involvement 3 3 3 3.00PE1 Infant-specific activity 4 4 4 4.00PE2 2 2 2 2.00Average Rating Per CC Type 2.73 2.60 2.60 2.64Grand Average for Care Types & Components 2.77 2.64 2.62 2.67
What Ratings Mean
1 Regulation contradicts the standard
2 Regulation does not mention the content of standard
3 Regulation partially meets standard
4 Regulation fully meets standard
Tally of Each Rating Per Topic Area
1 6%
2 38%
3 37%
4 19%
IL Overall Rating Composite
0%
10%
20%
30%
40%
50%
60%
70%
80%
90%
100%
Infant Feeding
Nutrition Physical Activity
IL Rating Composition Per Topic Area
4 Ratings
3 Ratings
2 Ratings
1 Ratings
National Resource Center for Health and Safety in Child Care and Early Education - ASHW 2012 78

IndianaState Overall Ratings
Components by Topic AreaChild Care
Center
Large Family
Child Care Home
Small Family
Child Care Home
Average Rating Per
ComponentInfant Feeding IA1 Appropriate fluids 3 2 2 2.33IA2 2 2 2 2.00IB1 How to feed fluids 3 2 2 2.33IB2 2 2 2 2.00IB3 4 3 3 3.33IC1 Introducing solids 2 2 2 2.00IC2 2 2 2 2.00IC3 2 2 2 2.00ID1 Appropriate complementary foods 2 2 2 2.00ID2 2 2 2 2.00ID3 2 2 2 2.00 Ratings 1 2 3 4Average Rating Per CC Type 2.36 2.09 2.09 2.18 I - Count 0 28 4 1Nutrition N-Count 2 52 5 4NA1 Limit dietary fats 2 2 2 2.00 P-Count 0 32 10 3NA2 2 2 2 2.00NA3 2 2 2 2.00NA4 3 2 2 2.33NA5 1 2 2 1.67NB1 Serve nutrient-dense whole foods 2 2 2 2.00NB2 2 2 2 2.00NB3 2 2 2 2.00NC1 Wholeness & quantity of juice 4 2 2 2.67NC2 2 2 2 2.00NC3 2 2 2 2.00NC4 2 2 2 2.00ND1 Water availability 3 2 4 3.00NE1 Nutrition instruction by word & example 3 2 2 2.33NE2 2 2 2 2.00NF1 Age and individual nutritional requirements 2 2 4 2.67NF2 1 2 2 1.67NG1 Limit sugar and salt 2 2 2 2.00NG2 3 2 2 2.33NH1 Misuse of food 2 2 2 2.00NH2 4 2 3 3.00Average Rating Per CC Type 2.29 2.00 2.24 2.17Physical ActivityPA1 General promotion of activity 4 2 3 3.00PA2 2 2 2 2.00PA3 2 2 2 2.00PA4 2 2 2 2.00PA5 3 2 2 2.33PB1 Screen time 4 2 2 2.67PB2 2 2 2 2.00PB3 4 2 2 2.67PB4 2 2 2 2.00PC1 Age-specific activity 3 2 3 2.67PC2 3 2 3 2.67PC3 3 2 3 2.67PD1 Caregiver/teacher involvement 3 2 2 2.33PE1 Infant-specific activity 2 2 2 2.00PE2 3 2 2 2.33Average Rating Per CC Type 2.80 2.00 2.27 2.36Grand Average for Care Types & Components 2.47 2.02 2.21 2.23
What Ratings Mean
1 Regulation contradicts the standard
2 Regulation does not mention the content of standard
3 Regulation partially meets standard
4 Regulation fully meets standard
Tally of Each Rating Per Topic Area
1 1%
2 79%
3 14%
4 6%
IN Overall Rating Composite
0%
10%
20%
30%
40%
50%
60%
70%
80%
90%
100%
Infant Feeding
Nutrition Physical Activity
IN Rating Composition Per Topic Area
4 Ratings
3 Ratings
2 Ratings
1 Ratings
National Resource Center for Health and Safety in Child Care and Early Education - ASHW 2012 79

IowaState Overall Ratings Key to Changes
Assessment Year
Components by Topic AreaChild Care
Center
Large Family
Child Care Home
Small Family
Child Care Home
Child Care Center
Large Family
Child Care Home
Small Family
Child Care Home
Infant Feeding IA1 Support breastfeeding 2 2 2 3 3 2IA2 No cow’s milk < 1yr 4 4 4 4 4 4IB1 Feed infants on cue 4 4 4 4 4 4IB2 Stop feed @ satiety 3 3 3 4 4 3IB3 Hold infant to feed 3 2 2 3 2 2IC1 Plan solid introduction 3 3 3 3 3 3IC2 Intro solids @ 4-6 mo 3 3 3 3 3 3IC3 Iron-Fort @ 4-6 mo 3 3 3 3 3 3ID1 Don’t mix formula 2 2 2 2 2 2ID2 Whole fruit 7 m-1 yr 1 1 1 1 1 1ID3 No juice < 12 mo 1 1 1 1 1 1Average Rating Per CC Type 2.64 2.55 2.55 2.82 2.73 2.55NutritionNA1 Limit oils/fats 2 2 2 2 2 2NA2 Low fat meat/proteins 3 3 3 3 3 3NA3 Low fat milk equivalents 3 3 3 3 3 3NA4 Whole milk 1-2 y/o 3 2 2 3 2 2NA5 Low fat milk > 2 y/o 2 2 2 4 4 4NB1 Whole grains 3 3 3 3 3 3NB2 Variety of vegetables 3 3 3 3 3 3NB3 Variety of whole fruit 3 3 3 3 3 3NC1 100% juice 4 4 4 4 4 4NC2 Juice only @ meals 2 2 2 2 2 2NC3 Juice 4-6 oz. 1-6 y/o 3 3 3 3 3 3NC4 Juice 8-12 oz. 7+ y/o 3 3 3 3 3 3ND1 Make water available 3 2 2 4 4 4NE1 Teach portion sizes 2 2 2 2 2 2NE2 Eat with children 2 2 2 2 2 2NF1 Appropriate servings 4 4 4 4 4 4NF2 Healthy seconds 3 3 3 3 3 3NG1 Limit salt 2 2 2 2 2 2NG2 Avoid sugary foods 1 1 1 1 1 1NH1 Food no force/bribe 2 2 2 2 2 2NH2 Food no reward/punish 3 3 3 3 3 3Average Rating Per CC Type 2.67 2.57 2.57 2.81 2.76 2.76Physical ActivityPA1 Space for active play 4 4 4 4 4 4PA2 Training on activities 2 2 2 2 2 2PA3 Write activity policies 2 2 2 2 2 2PA4 Play with children 2 2 2 2 2 2PA5 Don’t withhold play 2 2 2 2 2 2PB1 No screen time < 2 yr 2 2 2 2 2 2PB2 Screen time 30 min/wk 2 2 2 2 2 2PB3 Screen time purpose 2 2 2 2 2 2PB4 No TV w/meals 2 2 2 2 2 2PC1 Outdoor play occasions 3 2 2 3 2 2PC2 Toddler play time 3 3 3 3 3 3PC3 Preschool play time 3 3 3 3 3 3PD1 Structured play 3 3 3 3 3 3PE1 Tummy time often 2 2 2 2 2 2PE2 Limit time infant equip. 2 2 2 2 2 2Average Rating Per CC Type 2.40 2.33 2.33 2.40 2.33 2.33
What Ratings Mean
1 Regulation contradicts the standard
2 Regulation does not mention the content of standard
3 Regulation partially meets standard
4 Regulation fully meets standard IA Page 1 of 2
2010
Improved Rating
Lower Rating
2012
National Resource Center for Health and Safety in Child Care and Early Education - ASHW 2012 80
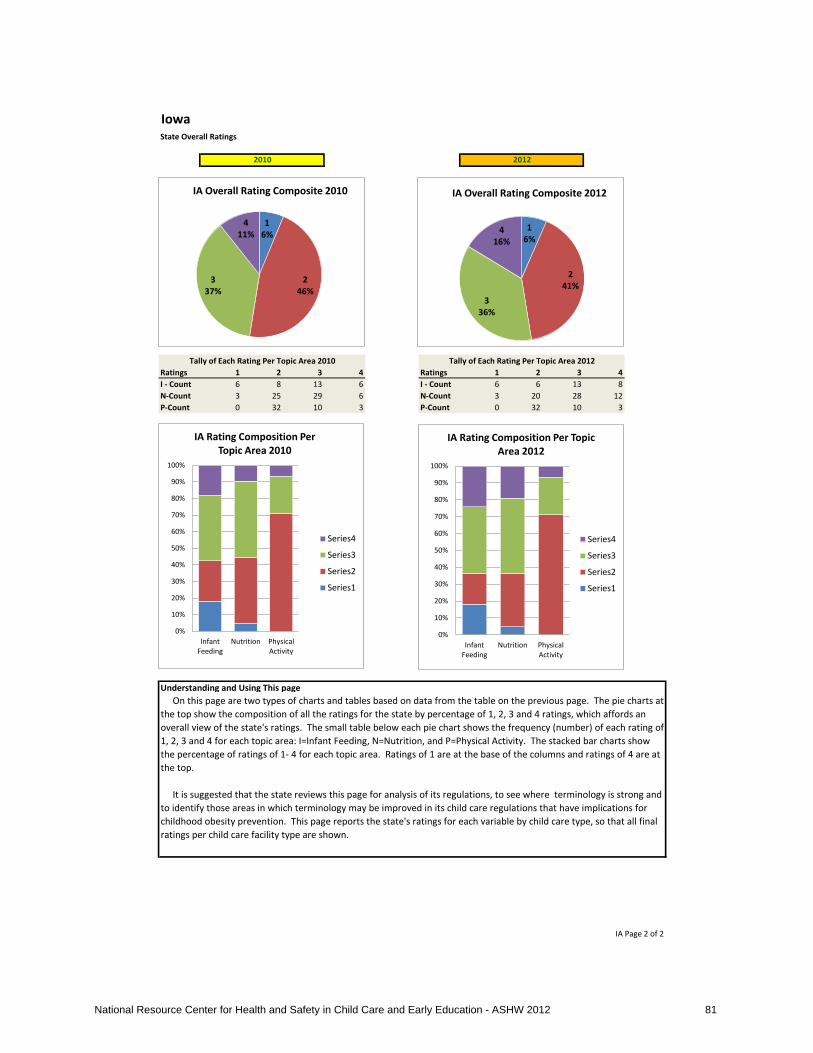
IowaState Overall Ratings
Ratings 1 2 3 4 Ratings 1 2 3 4I - Count 6 8 13 6 I - Count 6 6 13 8N-Count 3 25 29 6 N-Count 3 20 28 12P-Count 0 32 10 3 P-Count 0 32 10 3
Understanding and Using This page
IA Page 2 of 2
Tally of Each Rating Per Topic Area 2010 Tally of Each Rating Per Topic Area 2012
On this page are two types of charts and tables based on data from the table on the previous page. The pie charts at the top show the composition of all the ratings for the state by percentage of 1, 2, 3 and 4 ratings, which affords an overall view of the state's ratings. The small table below each pie chart shows the frequency (number) of each rating of 1, 2, 3 and 4 for each topic area: I=Infant Feeding, N=Nutrition, and P=Physical Activity. The stacked bar charts show the percentage of ratings of 1- 4 for each topic area. Ratings of 1 are at the base of the columns and ratings of 4 are at the top. It is suggested that the state reviews this page for analysis of its regulations, to see where terminology is strong and to identify those areas in which terminology may be improved in its child care regulations that have implications for childhood obesity prevention. This page reports the state's ratings for each variable by child care type, so that all final ratings per child care facility type are shown.
2010 2012
1 6%
2 46%
3 37%
4 11%
IA Overall Rating Composite 2010
0%
10%
20%
30%
40%
50%
60%
70%
80%
90%
100%
Infant Feeding
Nutrition Physical Activity
IA Rating Composition Per Topic Area 2010
Series4
Series3
Series2
Series1
1 6%
2 41%
3 36%
4 16%
IA Overall Rating Composite 2012
0%
10%
20%
30%
40%
50%
60%
70%
80%
90%
100%
Infant Feeding
Nutrition Physical Activity
IA Rating Composition Per Topic Area 2012
Series4
Series3
Series2
Series1
National Resource Center for Health and Safety in Child Care and Early Education - ASHW 2012 81

KansasState Overall Ratings Key to Changes
Assessment Year
Components by Topic AreaChild Care
Center
Large Family
Child Care Home
Small Family
Child Care Home
Child Care Center
Large Family
Child Care Home
Small Family
Child Care Home
Infant Feeding IA1 Support breastfeeding 2 2 2 2 2 2IA2 No cow’s milk < 1yr 2 2 2 2 2 2IB1 Feed infants on cue 2 2 2 2 2 2IB2 Stop feed @ satiety 2 2 2 2 2 2IB3 Hold infant to feed 3 3 3 3 3 3IC1 Plan solid introduction 3 3 3 3 3 3IC2 Intro solids @ 4-6 mo 2 2 2 2 2 2IC3 Iron-Fort @ 4-6 mo 2 2 2 2 2 2ID1 Don’t mix formula 2 2 2 2 2 2ID2 Whole fruit 7 m-1 yr 2 2 2 2 2 2ID3 No juice < 12 mo 2 2 2 2 2 2Average Rating Per CC Type 2.18 2.18 2.18 2.18 2.18 2.18NutritionNA1 Limit oils/fats 2 2 2 2 2 2NA2 Low fat meat/proteins 3 3 3 3 3 3NA3 Low fat milk equivalents 3 3 3 3 3 3NA4 Whole milk 1-2 y/o 2 2 2 2 2 2NA5 Low fat milk > 2 y/o 2 2 2 2 4 4NB1 Whole grains 2 2 2 2 2 2NB2 Variety of vegetables 3 3 3 3 3 3NB3 Variety of whole fruit 3 3 3 3 3 3NC1 100% juice 4 4 4 4 4 4NC2 Juice only @ meals 2 2 2 2 2 2NC3 Juice 4-6 oz. 1-6 y/o 2 2 2 2 2 2NC4 Juice 8-12 oz. 7+ y/o 2 2 2 2 2 2ND1 Make water available 4 2 2 4 3 3NE1 Teach portion sizes 2 2 2 2 2 2NE2 Eat with children 2 2 2 2 2 2NF1 Appropriate servings 2 2 2 2 2 2NF2 Healthy seconds 1 1 1 1 1 1NG1 Limit salt 2 2 2 2 2 2NG2 Avoid sugary foods 2 2 2 2 2 2NH1 Food no force/bribe 3 2 2 3 2 2NH2 Food no reward/punish 3 2 2 3 2 2Average Rating Per CC Type 2.43 2.24 2.24 2.43 2.38 2.38Physical ActivityPA1 Space for active play 4 3 3 4 3 3PA2 Training on activities 2 2 2 2 2 2PA3 Write activity policies 2 2 2 2 2 2PA4 Play with children 2 2 2 2 2 2PA5 Don’t withhold play 2 2 2 2 2 2PB1 No screen time < 2 yr 3 3 3 3 3 3PB2 Screen time 30 min/wk 2 2 2 2 2 2PB3 Screen time purpose 2 2 2 2 2 2PB4 No TV w/meals 2 2 2 2 2 2PC1 Outdoor play occasions 3 3 3 3 3 3PC2 Toddler play time 3 3 3 3 4 4PC3 Preschool play time 3 3 3 3 3 3PD1 Structured play 3 2 2 3 2 2PE1 Tummy time often 2 2 2 2 2 2PE2 Limit time infant equip. 3 2 2 3 2 2Average Rating Per CC Type 2.53 2.33 2.33 2.53 2.40 2.40
What Ratings Mean
1 Regulation contradicts the standard
2 Regulation does not mention the content of standard
3 Regulation partially meets standard
4 Regulation fully meets standard KS Page 1 of 2
2010
Improved Rating
Lowered Rating
2012
National Resource Center for Health and Safety in Child Care and Early Education - ASHW 2012 82

KansasState Overall Ratings
Ratings 1 2 3 4 Ratings 1 2 3 4I - Count 0 27 6 0 I - Count 0 27 6 0N-Count 3 42 14 4 N-Count 3 38 16 6P-Count 0 28 16 1 P-Count 0 28 14 3
Understanding and Using This page
KS Page 2 of 2
Tally of Each Rating Per Topic Area 2010 Tally of Each Rating Per Topic Area 2012
On this page are two types of charts and tables based on data from the table on the previous page. The pie charts at the top show the composition of all the ratings for the state by percentage of 1, 2, 3 and 4 ratings, which affords an overall view of the state's ratings. The small table below each pie chart shows the frequency (number) of each rating of 1, 2, 3 and 4 for each topic area: I=Infant Feeding, N=Nutrition, and P=Physical Activity. The stacked bar charts show the percentage of ratings of 1- 4 for each topic area. Ratings of 1 are at the base of the columns and ratings of 4 are at the top. It is suggested that the state reviews this page for analysis of its regulations, to see where terminology is strong and to identify those areas in which terminology may be improved in its child care regulations that have implications for childhood obesity prevention. This page reports the state's ratings for each variable by child care type, so that all final ratings per child care facility type are shown.
2010 2012
1 2%
2 69%
3 26%
4 4%
KS Overall Rating Composite 2010
0%
10%
20%
30%
40%
50%
60%
70%
80%
90%
100%
Infant Feeding
Nutrition Physical Activity
KS Rating Composition Per Topic Area 2010
Series4
Series3
Series2
Series1
1 2%
2 66%
3 26%
4 6%
KS Overall Rating Composite 2012
0%
10%
20%
30%
40%
50%
60%
70%
80%
90%
100%
Infant Feeding
Nutrition Physical Activity
KS Rating Composition Per Topic Area 2012
Series4
Series3
Series2
Series1
National Resource Center for Health and Safety in Child Care and Early Education - ASHW 2012 83

KentuckyState Overall Ratings
Components by Topic AreaChild Care
Center
Large Family
Child Care Home
Small Family
Child Care Home
Average Rating Per
ComponentInfant Feeding IA1 Appropriate fluids 2 2 2 2.00IA2 2 2 2 2.00IB1 How to feed fluids 2 2 2 2.00IB2 3 3 3 3.00IB3 4 4 4 4.00IC1 Introducing solids 2 2 3 2.33IC2 2 2 3 2.33IC3 2 2 2 2.00ID1 Appropriate complementary foods 2 2 2 2.00ID2 2 2 2 2.00ID3 2 2 2 2.00 Ratings 1 2 3 4Average Rating Per CC Type 2.27 2.27 2.45 2.33 I - Count 0 25 5 3Nutrition N-Count 2 45 10 6NA1 Limit dietary fats 2 2 2 2.00 P-Count 0 31 12 2NA2 2 2 2 2.00NA3 2 2 2 2.00NA4 2 2 2 2.00NA5 2 2 2 2.00NB1 Serve nutrient-dense whole foods 2 2 2 2.00NB2 3 3 3 3.00NB3 3 3 3 3.00NC1 Wholeness & quantity of juice 4 4 4 4.00NC2 2 2 2 2.00NC3 2 2 2 2.00NC4 2 2 2 2.00ND1 Water availability 3 3 2 2.67NE1 Nutrition instruction by word & example 2 2 2 2.00NE2 2 2 2 2.00NF1 Age and individual nutritional requirements 4 4 4 4.00NF2 1 1 2 1.33NG1 Limit sugar and salt 2 2 2 2.00NG2 2 2 2 2.00NH1 Misuse of food 2 2 2 2.00NH2 3 3 2 2.67Average Rating Per CC Type 2.33 2.33 2.29 2.32Physical ActivityPA1 General promotion of activity 4 4 3 3.67PA2 2 2 2 2.00PA3 2 2 2 2.00PA4 2 2 2 2.00PA5 2 2 2 2.00PB1 Screen time 2 2 3 2.33PB2 2 2 3 2.33PB3 2 2 2 2.00PB4 2 2 2 2.00PC1 Age-specific activity 3 3 3 3.00PC2 3 3 3 3.00PC3 3 3 3 3.00PD1 Caregiver/teacher involvement 2 2 2 2.00PE1 Infant-specific activity 2 2 2 2.00PE2 2 2 2 2.00Average Rating Per CC Type 2.33 2.33 2.40 2.36Grand Average for Care Types & Components 2.32 2.32 2.36 2.33
What Ratings Mean
1 Regulation contradicts the standard
2 Regulation does not mention the content of standard
3 Regulation partially meets standard
4 Regulation fully meets standard
Tally of Each Rating Per Topic Area
1 1%
2 72%
3 19%
4 8%
KY Overall Rating Composite
0%
10%
20%
30%
40%
50%
60%
70%
80%
90%
100%
Infant Feeding
Nutrition Physical Activity
KY Rating Composition Per Topic Area
4 Ratings
3 Ratings
2 Ratings
1 Ratings
National Resource Center for Health and Safety in Child Care and Early Education - ASHW 2012 84

LouisianaState Overall Ratings Key to Changes
Assessment Year
Components by Topic AreaChild Care
Center
Large Family
Child Care Home
Small Family
Child Care Home
Child Care Center
Large Family
Child Care Home
Small Family
Child Care Home
Infant Feeding IA1 Support breastfeeding 3 N/A N/A 3 N/A N/AIA2 No cow’s milk < 1yr 1 N/A N/A 1 N/A N/AIB1 Feed infants on cue 4 N/A N/A 4 N/A N/AIB2 Stop feed @ satiety 3 N/A N/A 3 N/A N/AIB3 Hold infant to feed 4 N/A N/A 4 N/A N/AIC1 Plan solid introduction 3 N/A N/A 3 N/A N/AIC2 Intro solids @ 4-6 mo 3 N/A N/A 3 N/A N/AIC3 Iron-Fort @ 4-6 mo 3 N/A N/A 3 N/A N/AID1 Don’t mix formula 2 N/A N/A 2 N/A N/AID2 Whole fruit 7 m-1 yr 1 N/A N/A 1 N/A N/AID3 No juice < 12 mo 1 N/A N/A 1 N/A N/AAverage Rating Per CC Type 2.55 N/A N/A 2.55 N/A N/ANutritionNA1 Limit oils/fats 2 N/A N/A 2 N/A N/ANA2 Low fat meat/proteins 3 N/A N/A 3 N/A N/ANA3 Low fat milk equivalents 3 N/A N/A 3 N/A N/ANA4 Whole milk 1-2 y/o 2 N/A N/A 2 N/A N/ANA5 Low fat milk > 2 y/o 2 N/A N/A 4 N/A N/ANB1 Whole grains 3 N/A N/A 3 N/A N/ANB2 Variety of vegetables 3 N/A N/A 3 N/A N/ANB3 Variety of whole fruit 4 N/A N/A 4 N/A N/ANC1 100% juice 4 N/A N/A 4 N/A N/ANC2 Juice only @ meals 2 N/A N/A 2 N/A N/ANC3 Juice 4-6 oz. 1-6 y/o 3 N/A N/A 3 N/A N/ANC4 Juice 8-12 oz. 7+ y/o 3 N/A N/A 3 N/A N/AND1 Make water available 4 N/A N/A 4 N/A N/ANE1 Teach portion sizes 2 N/A N/A 2 N/A N/ANE2 Eat with children 2 N/A N/A 2 N/A N/ANF1 Appropriate servings 4 N/A N/A 4 N/A N/ANF2 Healthy seconds 1 N/A N/A 1 N/A N/ANG1 Limit salt 2 N/A N/A 2 N/A N/ANG2 Avoid sugary foods 1 N/A N/A 1 N/A N/ANH1 Food no force/bribe 2 N/A N/A 2 N/A N/ANH2 Food no reward/punish 3 N/A N/A 3 N/A N/AAverage Rating Per CC Type 2.62 N/A N/A 2.71 N/A N/APhysical ActivityPA1 Space for active play 4 N/A N/A 4 N/A N/APA2 Training on activities 2 N/A N/A 2 N/A N/APA3 Write activity policies 2 N/A N/A 2 N/A N/APA4 Play with children 2 N/A N/A 2 N/A N/APA5 Don’t withhold play 3 N/A N/A 3 N/A N/APB1 No screen time < 2 yr 2 N/A N/A 2 N/A N/APB2 Screen time 30 min/wk 2 N/A N/A 2 N/A N/APB3 Screen time purpose 2 N/A N/A 2 N/A N/APB4 No TV w/meals 2 N/A N/A 2 N/A N/APC1 Outdoor play occasions 3 N/A N/A 3 N/A N/APC2 Toddler play time 3 N/A N/A 3 N/A N/APC3 Preschool play time 3 N/A N/A 3 N/A N/APD1 Structured play 2 N/A N/A 2 N/A N/APE1 Tummy time often 2 N/A N/A 2 N/A N/APE2 Limit time infant equip. 3 N/A N/A 3 N/A N/AAverage Rating Per CC Type 2.47 N/A N/A 2.47 N/A N/A
What Ratings Mean
1 Regulation contradicts the standard
2 Regulation does not mention the content of standard
3 Regulation partially meets standard
4 Regulation fully meets standard LA Page 1 of 2
2010
Improved Rating
Lowered Rating
2012
National Resource Center for Health and Safety in Child Care and Early Education - ASHW 2012 85
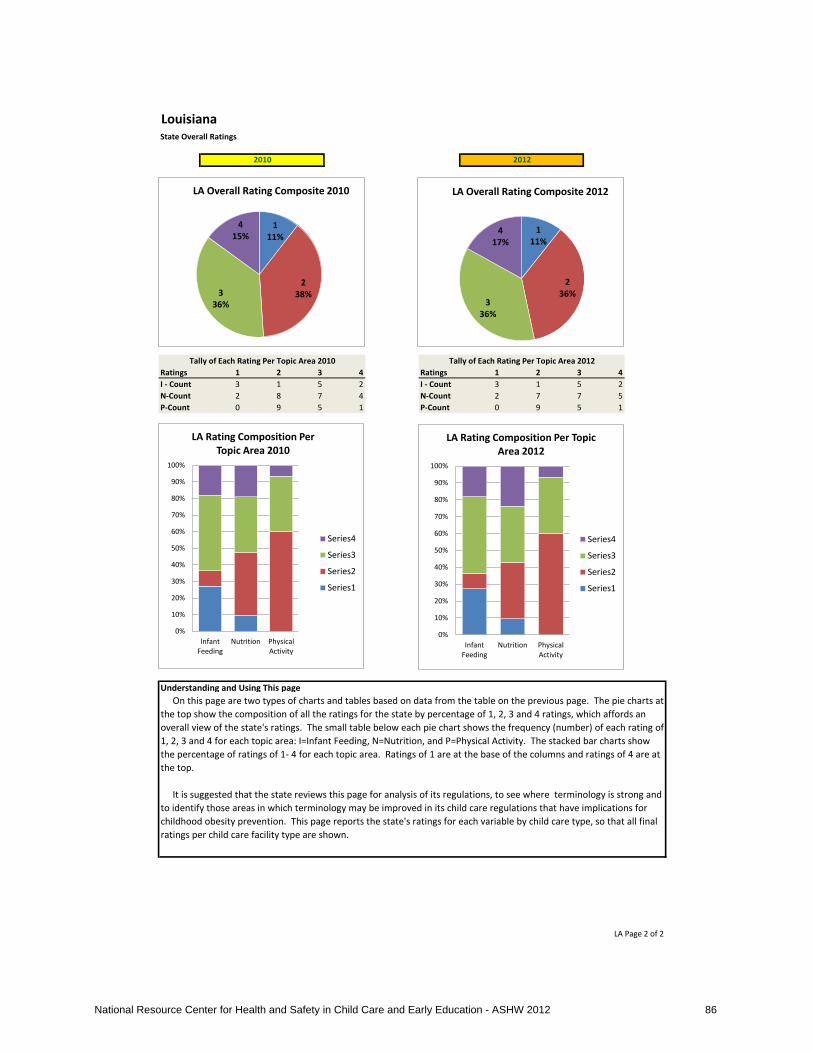
LouisianaState Overall Ratings
Ratings 1 2 3 4 Ratings 1 2 3 4I - Count 3 1 5 2 I - Count 3 1 5 2N-Count 2 8 7 4 N-Count 2 7 7 5P-Count 0 9 5 1 P-Count 0 9 5 1
Understanding and Using This page
LA Page 2 of 2
Tally of Each Rating Per Topic Area 2010 Tally of Each Rating Per Topic Area 2012
On this page are two types of charts and tables based on data from the table on the previous page. The pie charts at the top show the composition of all the ratings for the state by percentage of 1, 2, 3 and 4 ratings, which affords an overall view of the state's ratings. The small table below each pie chart shows the frequency (number) of each rating of 1, 2, 3 and 4 for each topic area: I=Infant Feeding, N=Nutrition, and P=Physical Activity. The stacked bar charts show the percentage of ratings of 1- 4 for each topic area. Ratings of 1 are at the base of the columns and ratings of 4 are at the top. It is suggested that the state reviews this page for analysis of its regulations, to see where terminology is strong and to identify those areas in which terminology may be improved in its child care regulations that have implications for childhood obesity prevention. This page reports the state's ratings for each variable by child care type, so that all final ratings per child care facility type are shown.
2010 2012
1 11%
2 38% 3
36%
4 15%
LA Overall Rating Composite 2010
0%
10%
20%
30%
40%
50%
60%
70%
80%
90%
100%
Infant Feeding
Nutrition Physical Activity
LA Rating Composition Per Topic Area 2010
Series4
Series3
Series2
Series1
1 11%
2 36%
3 36%
4 17%
LA Overall Rating Composite 2012
0%
10%
20%
30%
40%
50%
60%
70%
80%
90%
100%
Infant Feeding
Nutrition Physical Activity
LA Rating Composition Per Topic Area 2012
Series4
Series3
Series2
Series1
National Resource Center for Health and Safety in Child Care and Early Education - ASHW 2012 86

MaineState Overall Ratings Key to Changes
Assessment Year
Components by Topic AreaChild Care
Center
Large Family
Child Care Home
Small Family
Child Care Home
Child Care Center
Large Family
Child Care Home
Small Family
Child Care Home
Infant Feeding IA1 Support breastfeeding 2 2 2 2 2 2IA2 No cow’s milk < 1yr 2 2 2 2 2 2IB1 Feed infants on cue 4 4 4 4 4 4IB2 Stop feed @ satiety 2 2 2 2 2 2IB3 Hold infant to feed 4 4 3 4 4 3IC1 Plan solid introduction 2 2 2 2 2 2IC2 Intro solids @ 4-6 mo 2 2 2 2 2 2IC3 Iron-Fort @ 4-6 mo 2 2 2 2 2 2ID1 Don’t mix formula 2 2 2 2 2 2ID2 Whole fruit 7 m-1 yr 2 2 2 2 2 2ID3 No juice < 12 mo 2 2 2 2 2 2Average Rating Per CC Type 2.36 2.36 2.27 2.36 2.36 2.27NutritionNA1 Limit oils/fats 2 2 2 2 2 2NA2 Low fat meat/proteins 3 3 2 3 3 2NA3 Low fat milk equivalents 3 3 2 3 3 2NA4 Whole milk 1-2 y/o 2 2 2 2 2 2NA5 Low fat milk > 2 y/o 2 2 2 4 4 4NB1 Whole grains 2 2 2 2 2 2NB2 Variety of vegetables 3 3 2 3 3 2NB3 Variety of whole fruit 3 3 2 3 3 2NC1 100% juice 2 2 2 2 2 2NC2 Juice only @ meals 2 2 2 2 2 2NC3 Juice 4-6 oz. 1-6 y/o 2 2 2 2 2 2NC4 Juice 8-12 oz. 7+ y/o 2 2 2 2 2 2ND1 Make water available 3 3 2 4 4 4NE1 Teach portion sizes 2 2 2 2 2 2NE2 Eat with children 2 2 2 2 2 2NF1 Appropriate servings 3 3 2 3 3 2NF2 Healthy seconds 2 2 2 2 2 2NG1 Limit salt 2 2 2 2 2 2NG2 Avoid sugary foods 2 2 2 2 2 2NH1 Food no force/bribe 3 3 3 3 3 3NH2 Food no reward/punish 3 3 3 3 3 3Average Rating Per CC Type 2.38 2.38 2.10 2.52 2.52 2.29Physical ActivityPA1 Space for active play 4 4 4 4 4 4PA2 Training on activities 2 2 2 2 2 2PA3 Write activity policies 2 2 2 2 2 2PA4 Play with children 2 2 2 2 2 2PA5 Don’t withhold play 2 2 2 2 2 2PB1 No screen time < 2 yr 3 3 3 3 3 3PB2 Screen time 30 min/wk 3 3 2 3 3 2PB3 Screen time purpose 4 4 4 4 4 4PB4 No TV w/meals 2 2 2 2 2 2PC1 Outdoor play occasions 4 4 4 4 4 4PC2 Toddler play time 3 3 3 3 3 3PC3 Preschool play time 3 3 3 3 3 3PD1 Structured play 2 2 2 2 2 2PE1 Tummy time often 2 2 2 2 2 2PE2 Limit time infant equip. 2 2 2 2 2 2Average Rating Per CC Type 2.67 2.67 2.60 2.67 2.67 2.60
What Ratings Mean
1 Regulation contradicts the standard
2 Regulation does not mention the content of standard
3 Regulation partially meets standard
4 Regulation fully meets standard ME Page 1 of 2
2010
Improved Rating
Lowered Rating
2012
National Resource Center for Health and Safety in Child Care and Early Education - ASHW 2012 87

MaineState Overall Ratings
Ratings 1 2 3 4 Ratings 1 2 3 4I - Count 0 27 1 5 I - Count 0 27 1 5N-Count 0 45 18 0 N-Count 0 41 16 6P-Count 0 25 11 9 P-Count 0 25 11 9
Understanding and Using This page
ME Page 2 of 2
On this page are two types of charts and tables based on data from the table on the previous page. The pie charts at the top show the composition of all the ratings for the state by percentage of 1, 2, 3 and 4 ratings, which affords an overall view of the state's ratings. The small table below each pie chart shows the frequency (number) of each rating of 1, 2, 3 and 4 for each topic area: I=Infant Feeding, N=Nutrition, and P=Physical Activity. The stacked bar charts show the percentage of ratings of 1- 4 for each topic area. Ratings of 1 are at the base of the columns and ratings of 4 are at the top. It is suggested that the state reviews this page for analysis of its regulations, to see where terminology is strong and to identify those areas in which terminology may be improved in its child care regulations that have implications for childhood obesity prevention. This page reports the state's ratings for each variable by child care type, so that all final ratings per child care facility type are shown.
2010 2012
Tally of Each Rating Per Topic Area 2010 Tally of Each Rating Per Topic Area 2012
1 0%
2 69%
3 21%
4 10%
ME Overall Rating Composite 2010
0%
10%
20%
30%
40%
50%
60%
70%
80%
90%
100%
Infant Feeding
Nutrition Physical Activity
ME Rating Composition Per Topic Area 2010
Series4
Series3
Series2
Series1
1 0%
2 66%
3 20%
4 14%
ME Overall Rating Composite 2012
0%
10%
20%
30%
40%
50%
60%
70%
80%
90%
100%
Infant Feeding
Nutrition Physical Activity
ME Rating Composition Per Topic Area 2012
Series4
Series3
Series2
Series1
National Resource Center for Health and Safety in Child Care and Early Education - ASHW 2012 88

MarylandState Overall Ratings Key to Changes
Assessment Year
Components by Topic AreaChild Care
Center
Large Family
Child Care Home
Small Family
Child Care Home
Child Care Center
Large Family
Child Care Home
Small Family
Child Care Home
Infant Feeding IA1 Support breastfeeding 3 3 3 3 3 3IA2 No cow’s milk < 1yr 4 4 4 4 4 4IB1 Feed infants on cue 4 4 4 4 4 4IB2 Stop feed @ satiety 3 3 3 3 3 3IB3 Hold infant to feed 3 3 2 3 3 2IC1 Plan solid introduction 3 3 3 3 4 3IC2 Intro solids @ 4-6 mo 3 3 3 3 3 3IC3 Iron-Fort @ 4-6 mo 3 3 3 3 3 3ID1 Don’t mix formula 2 2 2 2 2 2ID2 Whole fruit 7 m-1 yr 1 1 1 1 1 1ID3 No juice < 12 mo 1 1 1 1 1 1Average Rating Per CC Type 2.73 2.73 2.64 2.73 2.82 2.64NutritionNA1 Limit oils/fats 2 2 2 2 2 2NA2 Low fat meat/proteins 3 3 3 3 3 3NA3 Low fat milk equivalents 3 3 3 3 3 3NA4 Whole milk 1-2 y/o 2 2 2 2 4 2NA5 Low fat milk > 2 y/o 2 2 2 4 4 4NB1 Whole grains 3 3 3 3 3 3NB2 Variety of vegetables 3 3 3 3 3 3NB3 Variety of whole fruit 3 3 3 3 3 3NC1 100% juice 4 4 4 4 4 4NC2 Juice only @ meals 2 2 2 2 2 2NC3 Juice 4-6 oz. 1-6 y/o 3 3 3 3 3 3NC4 Juice 8-12 oz. 7+ y/o 3 3 3 3 3 3ND1 Make water available 3 3 2 4 4 4NE1 Teach portion sizes 2 2 2 2 2 2NE2 Eat with children 2 2 2 2 2 2NF1 Appropriate servings 4 4 3 4 4 3NF2 Healthy seconds 3 3 3 3 3 3NG1 Limit salt 2 2 2 2 2 2NG2 Avoid sugary foods 1 1 1 1 1 1NH1 Food no force/bribe 3 3 3 3 3 3NH2 Food no reward/punish 3 3 3 3 3 3Average Rating Per CC Type 2.67 2.67 2.57 2.81 2.90 2.76Physical ActivityPA1 Space for active play 4 4 4 4 4 4PA2 Training on activities 2 2 2 2 2 2PA3 Write activity policies 2 2 2 2 2 2PA4 Play with children 2 2 2 2 2 2PA5 Don’t withhold play 2 2 2 2 2 2PB1 No screen time < 2 yr 2 2 2 2 2 2PB2 Screen time 30 min/wk 2 2 2 2 2 2PB3 Screen time purpose 2 2 2 2 2 2PB4 No TV w/meals 2 2 2 2 2 2PC1 Outdoor play occasions 4 4 4 4 4 4PC2 Toddler play time 3 3 3 3 3 3PC3 Preschool play time 3 3 3 3 3 3PD1 Structured play 3 3 3 3 3 3PE1 Tummy time often 2 2 2 2 2 2PE2 Limit time infant equip. 2 2 2 2 2 2Average Rating Per CC Type 2.47 2.47 2.47 2.47 2.47 2.47
What Ratings Mean
1 Regulation contradicts the standard
2 Regulation does not mention the content of standard
3 Regulation partially meets standard
4 Regulation fully meets standard MD Page 1 of 2
2010
Improved Rating
Lowered Rating
2012
National Resource Center for Health and Safety in Child Care and Early Education - ASHW 2012 89

MarylandState Overall Ratings
Ratings 1 2 3 4 Ratings 1 2 3 4I - Count 6 4 17 6 I - Count 6 4 16 7N-Count 3 22 33 5 N-Count 3 17 31 12P-Count 0 30 9 6 P-Count 0 30 9 6
Understanding and Using This page
MD Page 2 of 2
Tally of Each Rating Per Topic Area 2010 Tally of Each Rating Per Topic Area 2012
On this page are two types of charts and tables based on data from the table on the previous page. The pie charts at the top show the composition of all the ratings for the state by percentage of 1, 2, 3 and 4 ratings, which affords an overall view of the state's ratings. The small table below each pie chart shows the frequency (number) of each rating of 1, 2, 3 and 4 for each topic area: I=Infant Feeding, N=Nutrition, and P=Physical Activity. The stacked bar charts show the percentage of ratings of 1- 4 for each topic area. Ratings of 1 are at the base of the columns and ratings of 4 are at the top. It is suggested that the state reviews this page for analysis of its regulations, to see where terminology is strong and to identify those areas in which terminology may be improved in its child care regulations that have implications for childhood obesity prevention. This page reports the state's ratings for each variable by child care type, so that all final ratings per child care facility type are shown.
2010 2012
1 6%
2 40%
3 42%
4 12%
MD Overall Rating Composite 2010
0%
10%
20%
30%
40%
50%
60%
70%
80%
90%
100%
Infant Feeding
Nutrition Physical Activity
MD Rating Composition Per Topic Area 2010
Series4
Series3
Series2
Series1
1 6%
2 36%
3 40%
4 18%
MD Overall Rating Composite 2012
0%
10%
20%
30%
40%
50%
60%
70%
80%
90%
100%
Infant Feeding
Nutrition Physical Activity
MD Rating Composition Per Topic Area 2012
Series4
Series3
Series2
Series1
National Resource Center for Health and Safety in Child Care and Early Education - ASHW 2012 90

MassachusettsState Overall Ratings Key to Changes
Assessment Year
Components by Topic AreaChild Care
Center
Large Family
Child Care Home
Small Family
Child Care Home
Child Care Center
Large Family
Child Care Home
Small Family
Child Care Home
Infant Feeding IA1 Support breastfeeding 3 3 3 3 3 3IA2 No cow’s milk < 1yr 4 4 4 4 4 4IB1 Feed infants on cue 4 4 4 4 4 4IB2 Stop feed @ satiety 3 3 3 3 3 3IB3 Hold infant to feed 4 4 4 4 4 4IC1 Plan solid introduction 3 3 3 3 3 3IC2 Intro solids @ 4-6 mo 3 3 3 3 3 3IC3 Iron-Fort @ 4-6 mo 3 3 3 3 3 3ID1 Don’t mix formula 2 2 2 2 2 2ID2 Whole fruit 7 m-1 yr 3 3 3 3 3 3ID3 No juice < 12 mo 1 1 1 1 1 1Average Rating Per CC Type 3.00 3.00 3.00 3.00 3.00 3.00NutritionNA1 Limit oils/fats 2 2 2 2 2 2NA2 Low fat meat/proteins 3 3 3 3 3 3NA3 Low fat milk equivalents 3 3 3 3 3 3NA4 Whole milk 1-2 y/o 2 2 2 2 2 2NA5 Low fat milk > 2 y/o 2 2 2 4 4 4NB1 Whole grains 3 3 3 3 3 3NB2 Variety of vegetables 3 3 3 3 3 3NB3 Variety of whole fruit 3 3 3 3 3 3NC1 100% juice 4 4 4 4 4 4NC2 Juice only @ meals 2 2 2 2 2 2NC3 Juice 4-6 oz. 1-6 y/o 3 3 3 3 3 3NC4 Juice 8-12 oz. 7+ y/o 3 3 3 3 3 3ND1 Make water available 3 3 3 4 4 4NE1 Teach portion sizes 2 2 2 2 2 2NE2 Eat with children 2 2 2 2 2 2NF1 Appropriate servings 4 4 4 4 4 4NF2 Healthy seconds 3 3 3 3 3 3NG1 Limit salt 2 2 2 2 2 2NG2 Avoid sugary foods 1 1 1 1 1 1NH1 Food no force/bribe 3 3 3 3 3 3NH2 Food no reward/punish 3 3 3 3 3 3Average Rating Per CC Type 2.67 2.67 2.67 2.81 2.81 2.81Physical ActivityPA1 Space for active play 4 4 4 4 4 4PA2 Training on activities 2 2 2 2 2 2PA3 Write activity policies 2 2 2 2 2 2PA4 Play with children 2 2 2 2 2 2PA5 Don’t withhold play 3 3 3 3 3 3PB1 No screen time < 2 yr 2 2 2 2 2 2PB2 Screen time 30 min/wk 2 2 2 2 2 2PB3 Screen time purpose 2 2 2 2 2 2PB4 No TV w/meals 2 2 2 2 2 2PC1 Outdoor play occasions 3 3 3 3 3 3PC2 Toddler play time 3 3 3 3 3 3PC3 Preschool play time 3 3 3 3 3 3PD1 Structured play 2 2 2 2 2 2PE1 Tummy time often 2 2 2 2 2 2PE2 Limit time infant equip. 3 3 3 3 3 3Average Rating Per CC Type 2.47 2.47 2.47 2.47 2.47 2.47
What Ratings Mean
1 Regulation contradicts the standard
2 Regulation does not mention the content of standard
3 Regulation partially meets standard
4 Regulation fully meets standard MA Page 1 of 2
2010
Improved Rating
Lowered Rating
2012
National Resource Center for Health and Safety in Child Care and Early Education - ASHW 2012 91

MassachusettsState Overall Ratings
Ratings 1 2 3 4 Ratings 1 2 3 4I - Count 3 3 18 9 I - Count 3 3 18 9N-Count 3 21 33 6 N-Count 3 18 30 12P-Count 0 27 15 3 P-Count 0 27 15 3
Understanding and Using This page
MA Page 2 of 2
Tally of Each Rating Per Topic Area 2010 Tally of Each Rating Per Topic Area 2012
On this page are two types of charts and tables based on data from the table on the previous page. The pie charts at the top show the composition of all the ratings for the state by percentage of 1, 2, 3 and 4 ratings, which affords an overall view of the state's ratings. The small table below each pie chart shows the frequency (number) of each rating of 1, 2, 3 and 4 for each topic area: I=Infant Feeding, N=Nutrition, and P=Physical Activity. The stacked bar charts show the percentage of ratings of 1- 4 for each topic area. Ratings of 1 are at the base of the columns and ratings of 4 are at the top. It is suggested that the state reviews this page for analysis of its regulations, to see where terminology is strong and to identify those areas in which terminology may be improved in its child care regulations that have implications for childhood obesity prevention. This page reports the state's ratings for each variable by child care type, so that all final ratings per child care facility type are shown.
2010 2012
1 4%
2 36%
3 47%
4 13%
MA Overall Rating Composite 2010
0%
10%
20%
30%
40%
50%
60%
70%
80%
90%
100%
Infant Feeding
Nutrition Physical Activity
MA Rating Composition Per Topic Area 2010
Series4
Series3
Series2
Series1
1 4%
2 34%
3 45%
4 17%
MA Overall Rating Composite 2012
0%
10%
20%
30%
40%
50%
60%
70%
80%
90%
100%
Infant Feeding
Nutrition Physical Activity
MA Rating Composition Per Topic Area 2012
Series4
Series3
Series2
Series1
National Resource Center for Health and Safety in Child Care and Early Education - ASHW 2012 92

MichiganState Overall Ratings Key to Changes
Assessment Year
Components by Topic AreaChild Care
Center
Large Family
Child Care Home
Small Family
Child Care Home
Child Care Center
Large Family
Child Care Home
Small Family
Child Care Home
Infant Feeding IA1 Support breastfeeding 4 3 3 4 3 3IA2 No cow’s milk < 1yr 4 4 4 4 4 4IB1 Feed infants on cue 4 4 4 4 4 4IB2 Stop feed @ satiety 3 3 3 3 3 3IB3 Hold infant to feed 3 2 2 3 2 2IC1 Plan solid introduction 3 3 3 3 3 3IC2 Intro solids @ 4-6 mo 3 3 3 3 3 3IC3 Iron-Fort @ 4-6 mo 3 3 3 3 3 3ID1 Don’t mix formula 4 2 2 4 2 2ID2 Whole fruit 7 m-1 yr 1 1 1 1 1 1ID3 No juice < 12 mo 1 1 1 1 1 1Average Rating Per CC Type 3.00 2.64 2.64 3.00 2.64 2.64NutritionNA1 Limit oils/fats 2 2 2 2 2 2NA2 Low fat meat/proteins 3 3 3 3 3 3NA3 Low fat milk equivalents 3 3 3 3 3 3NA4 Whole milk 1-2 y/o 2 2 2 2 2 2NA5 Low fat milk > 2 y/o 2 2 2 4 4 4NB1 Whole grains 3 3 3 3 3 3NB2 Variety of vegetables 3 3 3 3 3 3NB3 Variety of whole fruit 3 3 3 3 3 3NC1 100% juice 4 4 4 4 4 4NC2 Juice only @ meals 2 2 2 2 2 2NC3 Juice 4-6 oz. 1-6 y/o 3 3 3 3 3 3NC4 Juice 8-12 oz. 7+ y/o 3 3 3 3 3 3ND1 Make water available 2 4 4 4 4 4NE1 Teach portion sizes 2 2 2 2 2 2NE2 Eat with children 2 2 2 2 2 2NF1 Appropriate servings 4 4 4 4 4 4NF2 Healthy seconds 3 3 3 3 3 3NG1 Limit salt 2 2 2 2 2 2NG2 Avoid sugary foods 1 1 1 1 1 1NH1 Food no force/bribe 2 2 2 2 2 2NH2 Food no reward/punish 3 3 3 3 3 3Average Rating Per CC Type 2.57 2.67 2.67 2.76 2.76 2.76Physical ActivityPA1 Space for active play 4 4 4 4 4 4PA2 Training on activities 2 2 2 2 2 2PA3 Write activity policies 2 2 2 2 2 2PA4 Play with children 2 2 2 2 2 2PA5 Don’t withhold play 2 2 2 2 2 2PB1 No screen time < 2 yr 3 3 3 3 3 3PB2 Screen time 30 min/wk 3 3 3 3 3 3PB3 Screen time purpose 3 3 3 3 3 3PB4 No TV w/meals 2 2 2 2 2 2PC1 Outdoor play occasions 3 3 3 3 3 3PC2 Toddler play time 3 3 3 3 3 3PC3 Preschool play time 3 3 3 3 3 3PD1 Structured play 2 2 2 2 2 2PE1 Tummy time often 2 2 2 2 2 2PE2 Limit time infant equip. 2 2 2 2 2 2Average Rating Per CC Type 2.53 2.53 2.53 2.53 2.53 2.53
What Ratings Mean
1 Regulation contradicts the standard
2 Regulation does not mention the content of standard
3 Regulation partially meets standard
4 Regulation fully meets standard MI Page 1 of 2
2010
Improved Rating
Lowered Rating
2012
National Resource Center for Health and Safety in Child Care and Early Education - ASHW 2012 93

MichiganState Overall Ratings
Ratings 1 2 3 4 Ratings 1 2 3 4I - Count 6 4 15 8 I - Count 6 4 15 8N-Count 3 25 27 8 N-Count 3 21 27 12P-Count 0 24 18 3 P-Count 0 24 18 3
Understanding and Using This page
MI Page 2 of 2
Tally of Each Rating Per Topic Area 2010 Tally of Each Rating Per Topic Area 2012
On this page are two types of charts and tables based on data from the table on the previous page. The pie charts at the top show the composition of all the ratings for the state by percentage of 1, 2, 3 and 4 ratings, which affords an overall view of the state's ratings. The small table below each pie chart shows the frequency (number) of each rating of 1, 2, 3 and 4 for each topic area: I=Infant Feeding, N=Nutrition, and P=Physical Activity. The stacked bar charts show the percentage of ratings of 1- 4 for each topic area. Ratings of 1 are at the base of the columns and ratings of 4 are at the top. It is suggested that the state reviews this page for analysis of its regulations, to see where terminology is strong and to identify those areas in which terminology may be improved in its child care regulations that have implications for childhood obesity prevention. This page reports the state's ratings for each variable by child care type, so that all final ratings per child care facility type are shown.
2010 2012
1 6%
2 38%
3 43%
4 13%
MI Overall Rating Composite 2010
0%
10%
20%
30%
40%
50%
60%
70%
80%
90%
100%
Infant Feeding
Nutrition Physical Activity
MI Rating Composition Per Topic Area 2010
Series4
Series3
Series2
Series1
1 6%
2 35%
3 43%
4 16%
MI Overall Rating Composite 2012
0%
10%
20%
30%
40%
50%
60%
70%
80%
90%
100%
Infant Feeding
Nutrition Physical Activity
MI Rating Composition Per Topic Area 2012
Series4
Series3
Series2
Series1
National Resource Center for Health and Safety in Child Care and Early Education - ASHW 2012 94

MinnesottaState Overall Ratings Key to Changes
Assessment Year
Components by Topic AreaChild Care
Center
Large Family
Child Care Home
Small Family
Child Care Home
Child Care Center
Large Family
Child Care Home
Small Family
Child Care Home
Infant Feeding IA1 Support breastfeeding 2 2 2 2 2 2IA2 No cow’s milk < 1yr 3 4 4 3 4 4IB1 Feed infants on cue 3 4 4 3 4 4IB2 Stop feed @ satiety 3 3 3 3 3 3IB3 Hold infant to feed 2 3 3 2 3 3IC1 Plan solid introduction 3 3 3 3 3 3IC2 Intro solids @ 4-6 mo 3 3 3 3 3 3IC3 Iron-Fort @ 4-6 mo 3 3 3 3 3 3ID1 Don’t mix formula 2 2 2 2 2 2ID2 Whole fruit 7 m-1 yr 1 1 1 1 1 1ID3 No juice < 12 mo 1 1 1 1 1 1Average Rating Per CC Type 2.36 2.64 2.64 2.36 2.64 2.64NutritionNA1 Limit oils/fats 2 2 2 2 2 2NA2 Low fat meat/proteins 3 3 3 3 3 3NA3 Low fat milk equivalents 3 3 3 3 3 3NA4 Whole milk 1-2 y/o 2 2 2 2 2 2NA5 Low fat milk > 2 y/o 2 2 2 4 4 4NB1 Whole grains 3 3 3 3 3 3NB2 Variety of vegetables 3 3 3 3 3 3NB3 Variety of whole fruit 3 3 3 3 3 3NC1 100% juice 4 4 4 4 4 4NC2 Juice only @ meals 2 2 2 2 2 2NC3 Juice 4-6 oz. 1-6 y/o 3 3 3 3 3 3NC4 Juice 8-12 oz. 7+ y/o 3 3 3 3 3 3ND1 Make water available 3 3 3 4 4 4NE1 Teach portion sizes 2 2 2 2 2 2NE2 Eat with children 2 2 2 2 2 2NF1 Appropriate servings 4 4 4 4 4 4NF2 Healthy seconds 3 3 3 3 3 3NG1 Limit salt 2 2 2 2 2 2NG2 Avoid sugary foods 1 1 1 1 1 1NH1 Food no force/bribe 2 2 2 2 2 2NH2 Food no reward/punish 3 3 3 3 3 3Average Rating Per CC Type 2.62 2.62 2.62 2.76 2.76 2.76Physical ActivityPA1 Space for active play 4 4 4 4 4 4PA2 Training on activities 2 2 2 2 2 2PA3 Write activity policies 2 2 2 2 2 2PA4 Play with children 2 2 2 2 2 2PA5 Don’t withhold play 3 3 3 3 3 3PB1 No screen time < 2 yr 2 2 2 2 2 2PB2 Screen time 30 min/wk 2 2 2 2 2 2PB3 Screen time purpose 2 2 2 2 2 2PB4 No TV w/meals 2 2 2 2 2 2PC1 Outdoor play occasions 3 3 3 3 3 3PC2 Toddler play time 3 3 3 3 3 3PC3 Preschool play time 3 3 3 3 3 3PD1 Structured play 3 3 3 3 3 3PE1 Tummy time often 2 2 2 2 2 2PE2 Limit time infant equip. 3 2 2 3 2 2Average Rating Per CC Type 2.53 2.47 2.47 2.53 2.47 2.47
What Ratings Mean
1 Regulation contradicts the standard
2 Regulation does not mention the content of standard
3 Regulation partially meets standard
4 Regulation fully meets standard MN Page 1 of 2
2010
Improved Rating
Lowered Rating
2012
National Resource Center for Health and Safety in Child Care and Early Education - ASHW 2012 95
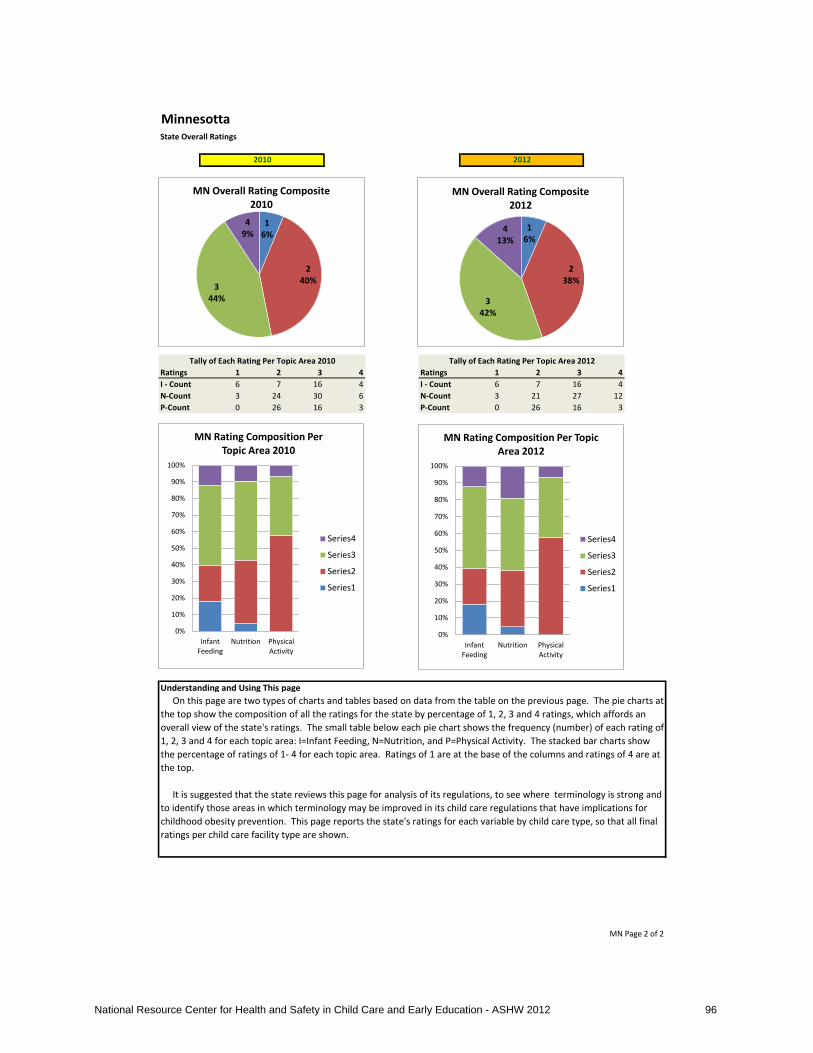
MinnesottaState Overall Ratings
Ratings 1 2 3 4 Ratings 1 2 3 4I - Count 6 7 16 4 I - Count 6 7 16 4N-Count 3 24 30 6 N-Count 3 21 27 12P-Count 0 26 16 3 P-Count 0 26 16 3
Understanding and Using This page
MN Page 2 of 2
Tally of Each Rating Per Topic Area 2010 Tally of Each Rating Per Topic Area 2012
On this page are two types of charts and tables based on data from the table on the previous page. The pie charts at the top show the composition of all the ratings for the state by percentage of 1, 2, 3 and 4 ratings, which affords an overall view of the state's ratings. The small table below each pie chart shows the frequency (number) of each rating of 1, 2, 3 and 4 for each topic area: I=Infant Feeding, N=Nutrition, and P=Physical Activity. The stacked bar charts show the percentage of ratings of 1- 4 for each topic area. Ratings of 1 are at the base of the columns and ratings of 4 are at the top. It is suggested that the state reviews this page for analysis of its regulations, to see where terminology is strong and to identify those areas in which terminology may be improved in its child care regulations that have implications for childhood obesity prevention. This page reports the state's ratings for each variable by child care type, so that all final ratings per child care facility type are shown.
2010 2012
1 6%
2 40%
3 44%
4 9%
MN Overall Rating Composite 2010
0%
10%
20%
30%
40%
50%
60%
70%
80%
90%
100%
Infant Feeding
Nutrition Physical Activity
MN Rating Composition Per Topic Area 2010
Series4
Series3
Series2
Series1
1 6%
2 38%
3 42%
4 13%
MN Overall Rating Composite 2012
0%
10%
20%
30%
40%
50%
60%
70%
80%
90%
100%
Infant Feeding
Nutrition Physical Activity
MN Rating Composition Per Topic Area 2012
Series4
Series3
Series2
Series1
National Resource Center for Health and Safety in Child Care and Early Education - ASHW 2012 96

MissisipppiState Overall Ratings Key to Changes
Assessment Year
Components by Topic AreaChild Care
Center
Large Family
Child Care Home
Small Family
Child Care Home
Child Care Center
Large Family
Child Care Home
Small Family
Child Care Home
Infant Feeding IA1 Support breastfeeding 4 4 4 4 4 4IA2 No cow’s milk < 1yr 4 4 4 4 4 4IB1 Feed infants on cue 4 4 4 4 4 4IB2 Stop feed @ satiety 3 2 2 3 2 2IB3 Hold infant to feed 4 4 4 4 4 4IC1 Plan solid introduction 3 3 3 3 3 3IC2 Intro solids @ 4-6 mo 3 3 3 3 3 3IC3 Iron-Fort @ 4-6 mo 3 3 3 3 3 3ID1 Don’t mix formula 2 2 2 2 2 2ID2 Whole fruit 7 m-1 yr 1 1 1 1 1 1ID3 No juice < 12 mo 3 3 3 3 3 3Average Rating Per CC Type 3.09 3.00 3.00 3.09 3.00 3.00NutritionNA1 Limit oils/fats 3 3 3 3 3 3NA2 Low fat meat/proteins 4 4 4 4 4 4NA3 Low fat milk equivalents 3 3 3 3 3 3NA4 Whole milk 1-2 y/o 3 3 3 3 3 3NA5 Low fat milk > 2 y/o 4 4 4 4 4 4NB1 Whole grains 4 4 4 4 4 4NB2 Variety of vegetables 4 4 4 4 4 4NB3 Variety of whole fruit 4 4 4 4 4 4NC1 100% juice 1 1 1 1 1 1NC2 Juice only @ meals 2 2 2 2 2 2NC3 Juice 4-6 oz. 1-6 y/o 3 3 3 3 3 3NC4 Juice 8-12 oz. 7+ y/o 3 3 3 3 3 3ND1 Make water available 3 3 3 4 4 4NE1 Teach portion sizes 2 2 2 2 2 2NE2 Eat with children 2 2 2 2 2 2NF1 Appropriate servings 4 4 4 4 4 4NF2 Healthy seconds 3 3 3 3 3 3NG1 Limit salt 4 4 4 4 4 4NG2 Avoid sugary foods 3 3 3 3 3 3NH1 Food no force/bribe 3 3 3 3 3 3NH2 Food no reward/punish 4 4 4 4 4 4Average Rating Per CC Type 3.14 3.14 3.14 3.19 3.19 3.19Physical ActivityPA1 Space for active play 4 4 4 4 4 4PA2 Training on activities 2 2 2 2 2 2PA3 Write activity policies 2 2 2 2 2 2PA4 Play with children 2 2 2 2 2 2PA5 Don’t withhold play 3 3 3 3 3 3PB1 No screen time < 2 yr 3 3 3 3 3 3PB2 Screen time 30 min/wk 3 3 3 3 3 3PB3 Screen time purpose 4 4 4 4 4 4PB4 No TV w/meals 2 2 2 2 2 2PC1 Outdoor play occasions 3 3 3 3 3 3PC2 Toddler play time 3 3 3 3 3 3PC3 Preschool play time 3 3 3 3 3 3PD1 Structured play 2 2 2 2 2 2PE1 Tummy time often 2 2 2 2 2 2PE2 Limit time infant equip. 2 2 2 2 2 2Average Rating Per CC Type 2.67 2.67 2.67 2.67 2.67 2.67
What Ratings Mean
1 Regulation contradicts the standard
2 Regulation does not mention the content of standard
3 Regulation partially meets standard
4 Regulation fully meets standard MS Page 1 of 2
2010
Improved Rating
Lowered Rating
2012
National Resource Center for Health and Safety in Child Care and Early Education - ASHW 2012 97

MissisipppiState Overall Ratings
Ratings 1 2 3 4 Ratings 1 2 3 4I - Count 3 5 13 12 I - Count 3 5 13 12N-Count 3 9 27 24 N-Count 3 9 24 27P-Count 0 21 18 6 P-Count 0 21 18 6
Understanding and Using This page
MS Page 2 of 2
Tally of Each Rating Per Topic Area 2010 Tally of Each Rating Per Topic Area 2012
On this page are two types of charts and tables based on data from the table on the previous page. The pie charts at the top show the composition of all the ratings for the state by percentage of 1, 2, 3 and 4 ratings, which affords an overall view of the state's ratings. The small table below each pie chart shows the frequency (number) of each rating of 1, 2, 3 and 4 for each topic area: I=Infant Feeding, N=Nutrition, and P=Physical Activity. The stacked bar charts show the percentage of ratings of 1- 4 for each topic area. Ratings of 1 are at the base of the columns and ratings of 4 are at the top. It is suggested that the state reviews this page for analysis of its regulations, to see where terminology is strong and to identify those areas in which terminology may be improved in its child care regulations that have implications for childhood obesity prevention. This page reports the state's ratings for each variable by child care type, so that all final ratings per child care facility type are shown.
2010 2012
1 4%
2 25%
3 41%
4 30%
MS Overall Rating Composite 2010
0%
10%
20%
30%
40%
50%
60%
70%
80%
90%
100%
Infant Feeding
Nutrition Physical Activity
MS Rating Composition Per Topic Area 2010
Series4
Series3
Series2
Series1
1 4%
2 25%
3 39%
4 32%
MS Overall Rating Composite 2012
0%
10%
20%
30%
40%
50%
60%
70%
80%
90%
100%
Infant Feeding
Nutrition Physical Activity
MS Rating Composition Per Topic Area 2012
Series4
Series3
Series2
Series1
National Resource Center for Health and Safety in Child Care and Early Education - ASHW 2012 98

MissouriState Overall Ratings
Components by Topic AreaChild Care
Center
Large Family
Child Care Home
Small Family
Child Care Home
Average Rating Per
ComponentInfant Feeding IA1 Appropriate fluids 2 2 2 2.00IA2 2 2 2 2.00IB1 How to feed fluids 3 3 2 2.67IB2 2 2 2 2.00IB3 3 3 3 3.00IC1 Introducing solids 3 3 3 3.00IC2 2 2 2 2.00IC3 2 2 2 2.00ID1 Appropriate complementary foods 2 2 2 2.00ID2 2 2 2 2.00ID3 2 2 2 2.00 Ratings 1 2 3 4Average Rating Per CC Type 2.27 2.27 2.18 2.24 I - Count 0 25 8 0Nutrition N-Count 0 33 21 9NA1 Limit dietary fats 2 2 2 2.00 P-Count 0 27 12 6NA2 3 3 3 3.00NA3 3 3 3 3.00NA4 2 2 2 2.00NA5 2 2 2 2.00NB1 Serve nutrient-dense whole foods 2 2 2 2.00NB2 2 2 2 2.00NB3 4 4 4 4.00NC1 Wholeness & quantity of juice 4 4 4 4.00NC2 2 2 2 2.00NC3 3 3 3 3.00NC4 3 3 3 3.00ND1 Water availability 3 3 3 3.00NE1 Nutrition instruction by word & example 2 2 2 2.00NE2 2 2 2 2.00NF1 Age and individual nutritional requirements 4 4 4 4.00NF2 2 2 2 2.00NG1 Limit sugar and salt 2 2 2 2.00NG2 2 2 2 2.00NH1 Misuse of food 3 3 3 3.00NH2 3 3 3 3.00Average Rating Per CC Type 2.62 2.62 2.62 2.62Physical ActivityPA1 General promotion of activity 4 4 4 4.00PA2 2 2 2 2.00PA3 2 2 2 2.00PA4 2 2 2 2.00PA5 4 4 4 4.00PB1 Screen time 2 2 2 2.00PB2 2 2 2 2.00PB3 2 2 2 2.00PB4 2 2 2 2.00PC1 Age-specific activity 3 3 3 3.00PC2 3 3 3 3.00PC3 3 3 3 3.00PD1 Caregiver/teacher involvement 2 2 2 2.00PE1 Infant-specific activity 2 2 2 2.00PE2 3 3 3 3.00Average Rating Per CC Type 2.53 2.53 2.53 2.53Grand Average for Care Types & Components 2.51 2.51 2.49 2.50
What Ratings Mean
1 Regulation contradicts the standard
2 Regulation does not mention the content of standard
3 Regulation partially meets standard
4 Regulation fully meets standard
Tally of Each Rating Per Topic Area
2 60%
3 29%
4 11%
MO Overall Rating Composite
0%
10%
20%
30%
40%
50%
60%
70%
80%
90%
100%
Infant Feeding
Nutrition Physical Activity
MO Rating Composition Per Topic Area
4 Ratings
3 Ratings
2 Ratings
1 Ratings
National Resource Center for Health and Safety in Child Care and Early Education - ASHW 2012 99

MontanaState Overall Ratings Key to Changes
Assessment Year
Components by Topic AreaChild Care
Center
Large Family
Child Care Home
Small Family
Child Care Home
Child Care Center
Large Family
Child Care Home
Small Family
Child Care Home
Infant Feeding IA1 Support breastfeeding 3 3 3 3 3 3IA2 No cow’s milk < 1yr 4 4 4 4 4 4IB1 Feed infants on cue 4 4 4 4 4 4IB2 Stop feed @ satiety 3 3 3 3 3 3IB3 Hold infant to feed 3 3 3 3 3 3IC1 Plan solid introduction 3 3 3 3 3 3IC2 Intro solids @ 4-6 mo 3 3 3 3 3 3IC3 Iron-Fort @ 4-6 mo 3 3 3 3 3 3ID1 Don’t mix formula 2 2 2 2 2 2ID2 Whole fruit 7 m-1 yr 1 1 1 1 1 1ID3 No juice < 12 mo 1 1 1 1 1 1Average Rating Per CC Type 2.73 2.73 2.73 2.73 2.73 2.73NutritionNA1 Limit oils/fats 2 2 2 2 2 2NA2 Low fat meat/proteins 3 3 3 3 3 3NA3 Low fat milk equivalents 3 3 3 3 3 3NA4 Whole milk 1-2 y/o 2 2 2 2 2 2NA5 Low fat milk > 2 y/o 2 2 2 4 4 4NB1 Whole grains 3 3 3 3 3 3NB2 Variety of vegetables 3 3 3 3 3 3NB3 Variety of whole fruit 3 3 3 3 3 3NC1 100% juice 4 4 4 4 4 4NC2 Juice only @ meals 4 2 2 4 2 2NC3 Juice 4-6 oz. 1-6 y/o 3 3 3 3 3 3NC4 Juice 8-12 oz. 7+ y/o 3 3 3 3 3 3ND1 Make water available 3 3 3 4 4 4NE1 Teach portion sizes 2 2 2 2 2 2NE2 Eat with children 2 2 2 2 2 2NF1 Appropriate servings 4 4 4 4 4 4NF2 Healthy seconds 3 3 3 3 3 3NG1 Limit salt 2 2 2 2 2 2NG2 Avoid sugary foods 1 1 1 1 1 1NH1 Food no force/bribe 2 2 2 2 2 2NH2 Food no reward/punish 2 2 2 2 2 2Average Rating Per CC Type 2.67 2.57 2.57 2.81 2.71 2.71Physical ActivityPA1 Space for active play 4 4 4 4 4 4PA2 Training on activities 2 2 2 2 2 2PA3 Write activity policies 2 2 2 2 2 2PA4 Play with children 2 2 2 2 2 2PA5 Don’t withhold play 2 2 2 2 2 2PB1 No screen time < 2 yr 2 3 3 2 3 3PB2 Screen time 30 min/wk 2 3 3 2 3 3PB3 Screen time purpose 2 2 2 2 2 2PB4 No TV w/meals 2 2 2 2 2 2PC1 Outdoor play occasions 2 3 3 2 3 3PC2 Toddler play time 2 2 2 2 2 2PC3 Preschool play time 2 2 2 2 2 2PD1 Structured play 2 2 2 2 2 2PE1 Tummy time often 2 2 2 2 2 2PE2 Limit time infant equip. 3 3 3 3 3 3Average Rating Per CC Type 2.20 2.40 2.40 2.20 2.40 2.40
What Ratings Mean
1 Regulation contradicts the standard
2 Regulation does not mention the content of standard
3 Regulation partially meets standard
4 Regulation fully meets standard MT Page 1 of 2
2010
Improved Rating
Lowered Rating
2012
National Resource Center for Health and Safety in Child Care and Early Education - ASHW 2012 100
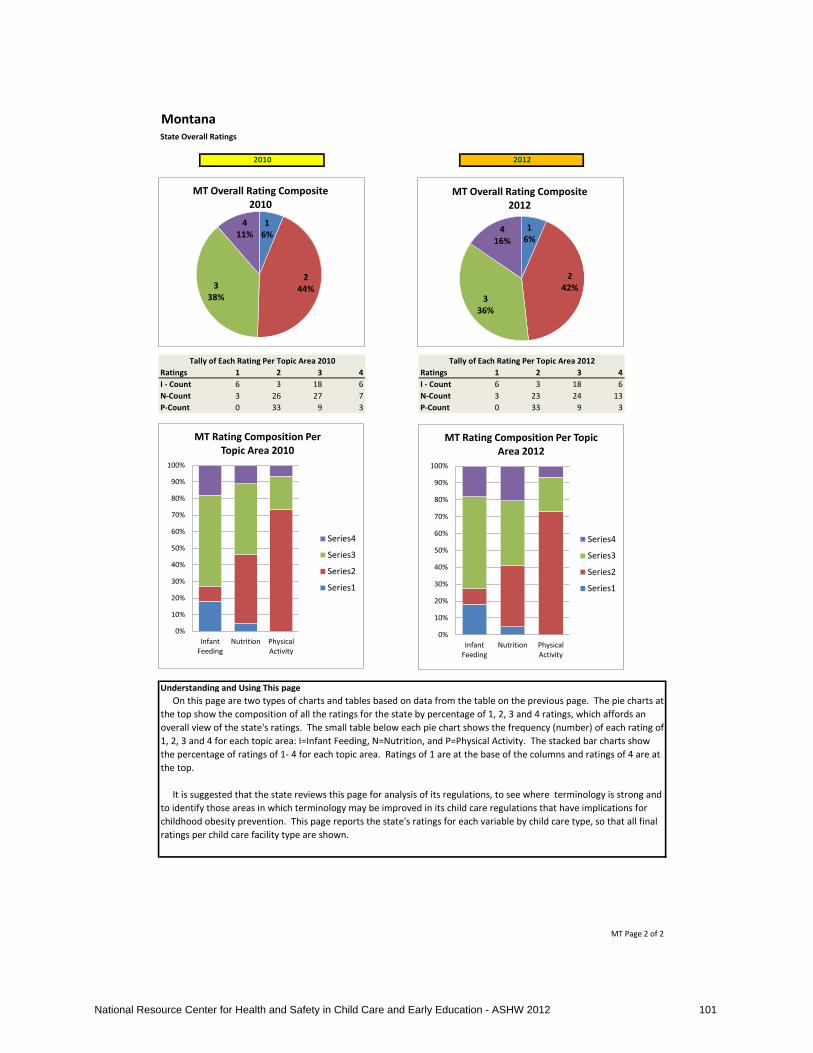
MontanaState Overall Ratings
Ratings 1 2 3 4 Ratings 1 2 3 4I - Count 6 3 18 6 I - Count 6 3 18 6N-Count 3 26 27 7 N-Count 3 23 24 13P-Count 0 33 9 3 P-Count 0 33 9 3
Understanding and Using This page
MT Page 2 of 2
Tally of Each Rating Per Topic Area 2010 Tally of Each Rating Per Topic Area 2012
On this page are two types of charts and tables based on data from the table on the previous page. The pie charts at the top show the composition of all the ratings for the state by percentage of 1, 2, 3 and 4 ratings, which affords an overall view of the state's ratings. The small table below each pie chart shows the frequency (number) of each rating of 1, 2, 3 and 4 for each topic area: I=Infant Feeding, N=Nutrition, and P=Physical Activity. The stacked bar charts show the percentage of ratings of 1- 4 for each topic area. Ratings of 1 are at the base of the columns and ratings of 4 are at the top. It is suggested that the state reviews this page for analysis of its regulations, to see where terminology is strong and to identify those areas in which terminology may be improved in its child care regulations that have implications for childhood obesity prevention. This page reports the state's ratings for each variable by child care type, so that all final ratings per child care facility type are shown.
2010 2012
1 6%
2 44% 3
38%
4 11%
MT Overall Rating Composite 2010
0%
10%
20%
30%
40%
50%
60%
70%
80%
90%
100%
Infant Feeding
Nutrition Physical Activity
MT Rating Composition Per Topic Area 2010
Series4
Series3
Series2
Series1
1 6%
2 42%
3 36%
4 16%
MT Overall Rating Composite 2012
0%
10%
20%
30%
40%
50%
60%
70%
80%
90%
100%
Infant Feeding
Nutrition Physical Activity
MT Rating Composition Per Topic Area 2012
Series4
Series3
Series2
Series1
National Resource Center for Health and Safety in Child Care and Early Education - ASHW 2012 101
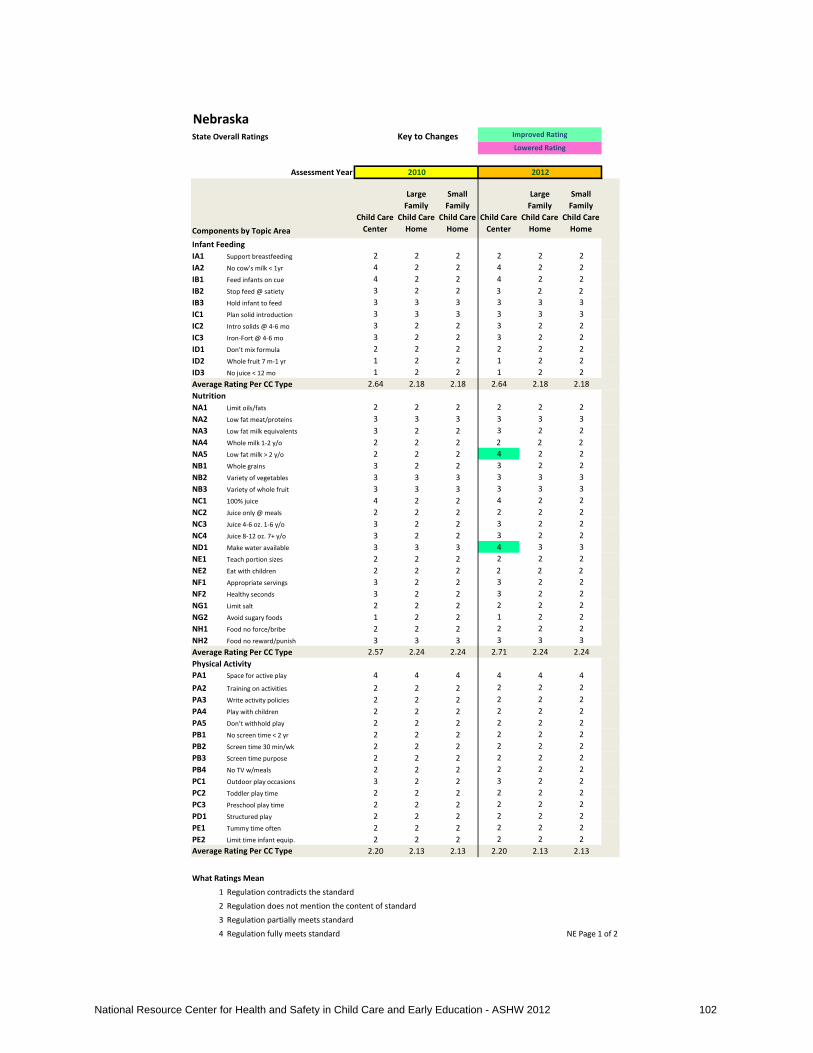
NebraskaState Overall Ratings Key to Changes
Assessment Year
Components by Topic AreaChild Care
Center
Large Family
Child Care Home
Small Family
Child Care Home
Child Care Center
Large Family
Child Care Home
Small Family
Child Care Home
Infant Feeding IA1 Support breastfeeding 2 2 2 2 2 2IA2 No cow’s milk < 1yr 4 2 2 4 2 2IB1 Feed infants on cue 4 2 2 4 2 2IB2 Stop feed @ satiety 3 2 2 3 2 2IB3 Hold infant to feed 3 3 3 3 3 3IC1 Plan solid introduction 3 3 3 3 3 3IC2 Intro solids @ 4-6 mo 3 2 2 3 2 2IC3 Iron-Fort @ 4-6 mo 3 2 2 3 2 2ID1 Don’t mix formula 2 2 2 2 2 2ID2 Whole fruit 7 m-1 yr 1 2 2 1 2 2ID3 No juice < 12 mo 1 2 2 1 2 2Average Rating Per CC Type 2.64 2.18 2.18 2.64 2.18 2.18NutritionNA1 Limit oils/fats 2 2 2 2 2 2NA2 Low fat meat/proteins 3 3 3 3 3 3NA3 Low fat milk equivalents 3 2 2 3 2 2NA4 Whole milk 1-2 y/o 2 2 2 2 2 2NA5 Low fat milk > 2 y/o 2 2 2 4 2 2NB1 Whole grains 3 2 2 3 2 2NB2 Variety of vegetables 3 3 3 3 3 3NB3 Variety of whole fruit 3 3 3 3 3 3NC1 100% juice 4 2 2 4 2 2NC2 Juice only @ meals 2 2 2 2 2 2NC3 Juice 4-6 oz. 1-6 y/o 3 2 2 3 2 2NC4 Juice 8-12 oz. 7+ y/o 3 2 2 3 2 2ND1 Make water available 3 3 3 4 3 3NE1 Teach portion sizes 2 2 2 2 2 2NE2 Eat with children 2 2 2 2 2 2NF1 Appropriate servings 3 2 2 3 2 2NF2 Healthy seconds 3 2 2 3 2 2NG1 Limit salt 2 2 2 2 2 2NG2 Avoid sugary foods 1 2 2 1 2 2NH1 Food no force/bribe 2 2 2 2 2 2NH2 Food no reward/punish 3 3 3 3 3 3Average Rating Per CC Type 2.57 2.24 2.24 2.71 2.24 2.24Physical ActivityPA1 Space for active play 4 4 4 4 4 4PA2 Training on activities 2 2 2 2 2 2PA3 Write activity policies 2 2 2 2 2 2PA4 Play with children 2 2 2 2 2 2PA5 Don’t withhold play 2 2 2 2 2 2PB1 No screen time < 2 yr 2 2 2 2 2 2PB2 Screen time 30 min/wk 2 2 2 2 2 2PB3 Screen time purpose 2 2 2 2 2 2PB4 No TV w/meals 2 2 2 2 2 2PC1 Outdoor play occasions 3 2 2 3 2 2PC2 Toddler play time 2 2 2 2 2 2PC3 Preschool play time 2 2 2 2 2 2PD1 Structured play 2 2 2 2 2 2PE1 Tummy time often 2 2 2 2 2 2PE2 Limit time infant equip. 2 2 2 2 2 2Average Rating Per CC Type 2.20 2.13 2.13 2.20 2.13 2.13
What Ratings Mean
1 Regulation contradicts the standard
2 Regulation does not mention the content of standard
3 Regulation partially meets standard
4 Regulation fully meets standard NE Page 1 of 2
2010
Improved Rating
Lowered Rating
2012
National Resource Center for Health and Safety in Child Care and Early Education - ASHW 2012 102

NebraskaState Overall Ratings
Ratings 1 2 3 4 Ratings 1 2 3 4I - Count 2 20 9 2 I - Count 2 20 9 2N-Count 1 40 21 1 N-Count 1 39 20 3P-Count 0 41 1 3 P-Count 0 41 1 3
Understanding and Using This page
NE Page 2 of 2
Tally of Each Rating Per Topic Area 2010 Tally of Each Rating Per Topic Area 2012
On this page are two types of charts and tables based on data from the table on the previous page. The pie charts at the top show the composition of all the ratings for the state by percentage of 1, 2, 3 and 4 ratings, which affords an overall view of the state's ratings. The small table below each pie chart shows the frequency (number) of each rating of 1, 2, 3 and 4 for each topic area: I=Infant Feeding, N=Nutrition, and P=Physical Activity. The stacked bar charts show the percentage of ratings of 1- 4 for each topic area. Ratings of 1 are at the base of the columns and ratings of 4 are at the top. It is suggested that the state reviews this page for analysis of its regulations, to see where terminology is strong and to identify those areas in which terminology may be improved in its child care regulations that have implications for childhood obesity prevention. This page reports the state's ratings for each variable by child care type, so that all final ratings per child care facility type are shown.
2010 2012
1 2%
2 72%
3 22%
4 4%
NE Overall Rating Composite 2010
0%
10%
20%
30%
40%
50%
60%
70%
80%
90%
100%
Infant Feeding
Nutrition Physical Activity
NE Rating Composition Per Topic Area 2010
Series4
Series3
Series2
Series1
1 2%
2 71%
3 21%
4 6%
NE Overall Rating Composite 2012
0%
10%
20%
30%
40%
50%
60%
70%
80%
90%
100%
Infant Feeding
Nutrition Physical Activity
NE Rating Composition Per Topic Area 2012
Series4
Series3
Series2
Series1
National Resource Center for Health and Safety in Child Care and Early Education - ASHW 2012 103

NevadaState Overall Ratings Key to Changes
Assessment Year
Components by Topic AreaChild Care
Center
Large Family
Child Care Home
Small Family
Child Care Home
Child Care Center
Large Family
Child Care Home
Small Family
Child Care Home
Infant Feeding IA1 Support breastfeeding 2 2 2 3 3 3IA2 No cow’s milk < 1yr 2 2 2 2 2 2IB1 Feed infants on cue 2 2 2 1 1 1IB2 Stop feed @ satiety 2 2 2 2 2 2IB3 Hold infant to feed 3 3 3 1 1 1IC1 Plan solid introduction 3 3 3 3 3 3IC2 Intro solids @ 4-6 mo 2 2 2 2 2 2IC3 Iron-Fort @ 4-6 mo 2 2 2 2 2 2ID1 Don’t mix formula 2 2 2 2 2 2ID2 Whole fruit 7 m-1 yr 2 2 2 2 2 2ID3 No juice < 12 mo 2 2 2 2 2 2Average Rating Per CC Type 2.18 2.18 2.18 2.00 2.00 2.00NutritionNA1 Limit oils/fats 2 2 2 2 2 2NA2 Low fat meat/proteins 2 2 2 2 2 2NA3 Low fat milk equivalents 2 2 2 2 2 2NA4 Whole milk 1-2 y/o 2 2 2 2 2 2NA5 Low fat milk > 2 y/o 2 2 2 2 2 2NB1 Whole grains 2 2 2 2 2 2NB2 Variety of vegetables 2 2 2 2 2 2NB3 Variety of whole fruit 2 2 2 2 2 2NC1 100% juice 2 2 2 2 2 2NC2 Juice only @ meals 2 2 2 2 2 2NC3 Juice 4-6 oz. 1-6 y/o 2 2 2 2 2 2NC4 Juice 8-12 oz. 7+ y/o 2 2 2 2 2 2ND1 Make water available 4 4 4 4 4 4NE1 Teach portion sizes 2 2 2 2 2 2NE2 Eat with children 2 2 2 3 3 3NF1 Appropriate servings 3 3 3 3 3 3NF2 Healthy seconds 3 3 3 2 2 2NG1 Limit salt 2 2 2 2 2 2NG2 Avoid sugary foods 1 1 1 3 3 3NH1 Food no force/bribe 3 3 3 3 3 3NH2 Food no reward/punish 4 4 4 4 4 4Average Rating Per CC Type 2.29 2.29 2.29 2.38 2.38 2.38Physical ActivityPA1 Space for active play 4 4 4 4 4 4PA2 Training on activities 2 2 2 2 2 2PA3 Write activity policies 2 2 2 2 2 2PA4 Play with children 2 2 2 2 2 2PA5 Don’t withhold play 3 3 3 3 3 3PB1 No screen time < 2 yr 2 2 2 2 2 2PB2 Screen time 30 min/wk 2 2 2 2 2 2PB3 Screen time purpose 2 2 2 2 2 2PB4 No TV w/meals 2 2 2 2 2 2PC1 Outdoor play occasions 3 3 3 3 3 3PC2 Toddler play time 3 3 3 3 3 3PC3 Preschool play time 2 2 2 3 3 3PD1 Structured play 2 2 2 2 2 2PE1 Tummy time often 2 2 2 2 2 2PE2 Limit time infant equip. 3 3 3 3 3 3Average Rating Per CC Type 2.40 2.40 2.40 2.47 2.47 2.47
What Ratings Mean
1 Regulation contradicts the standard
2 Regulation does not mention the content of standard
3 Regulation partially meets standard
4 Regulation fully meets standard NV Page 1 of 2
2010
Improved Rating
Lowered Rating
2012
National Resource Center for Health and Safety in Child Care and Early Education - ASHW 2012 104
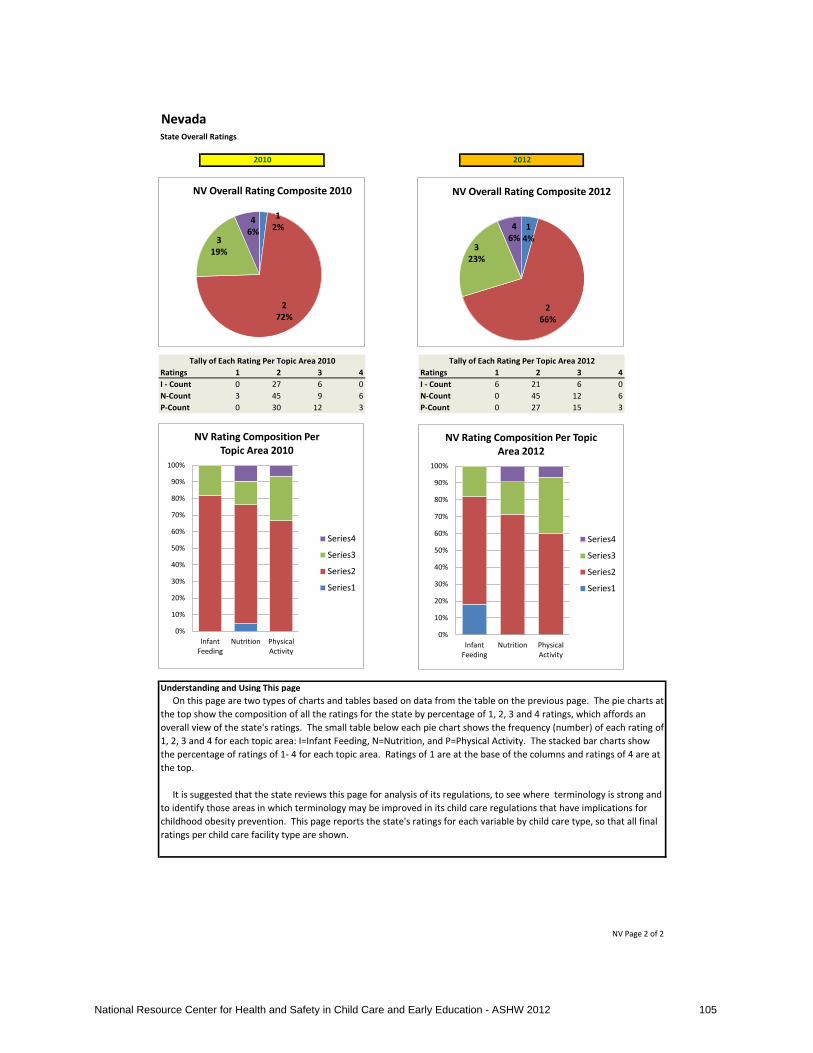
NevadaState Overall Ratings
Ratings 1 2 3 4 Ratings 1 2 3 4I - Count 0 27 6 0 I - Count 6 21 6 0N-Count 3 45 9 6 N-Count 0 45 12 6P-Count 0 30 12 3 P-Count 0 27 15 3
Understanding and Using This page
NV Page 2 of 2
Tally of Each Rating Per Topic Area 2010 Tally of Each Rating Per Topic Area 2012
On this page are two types of charts and tables based on data from the table on the previous page. The pie charts at the top show the composition of all the ratings for the state by percentage of 1, 2, 3 and 4 ratings, which affords an overall view of the state's ratings. The small table below each pie chart shows the frequency (number) of each rating of 1, 2, 3 and 4 for each topic area: I=Infant Feeding, N=Nutrition, and P=Physical Activity. The stacked bar charts show the percentage of ratings of 1- 4 for each topic area. Ratings of 1 are at the base of the columns and ratings of 4 are at the top. It is suggested that the state reviews this page for analysis of its regulations, to see where terminology is strong and to identify those areas in which terminology may be improved in its child care regulations that have implications for childhood obesity prevention. This page reports the state's ratings for each variable by child care type, so that all final ratings per child care facility type are shown.
2010 2012
1 2%
2 72%
3 19%
4 6%
NV Overall Rating Composite 2010
0%
10%
20%
30%
40%
50%
60%
70%
80%
90%
100%
Infant Feeding
Nutrition Physical Activity
NV Rating Composition Per Topic Area 2010
Series4
Series3
Series2
Series1
1 4%
2 66%
3 23%
4 6%
NV Overall Rating Composite 2012
0%
10%
20%
30%
40%
50%
60%
70%
80%
90%
100%
Infant Feeding
Nutrition Physical Activity
NV Rating Composition Per Topic Area 2012
Series4
Series3
Series2
Series1
National Resource Center for Health and Safety in Child Care and Early Education - ASHW 2012 105
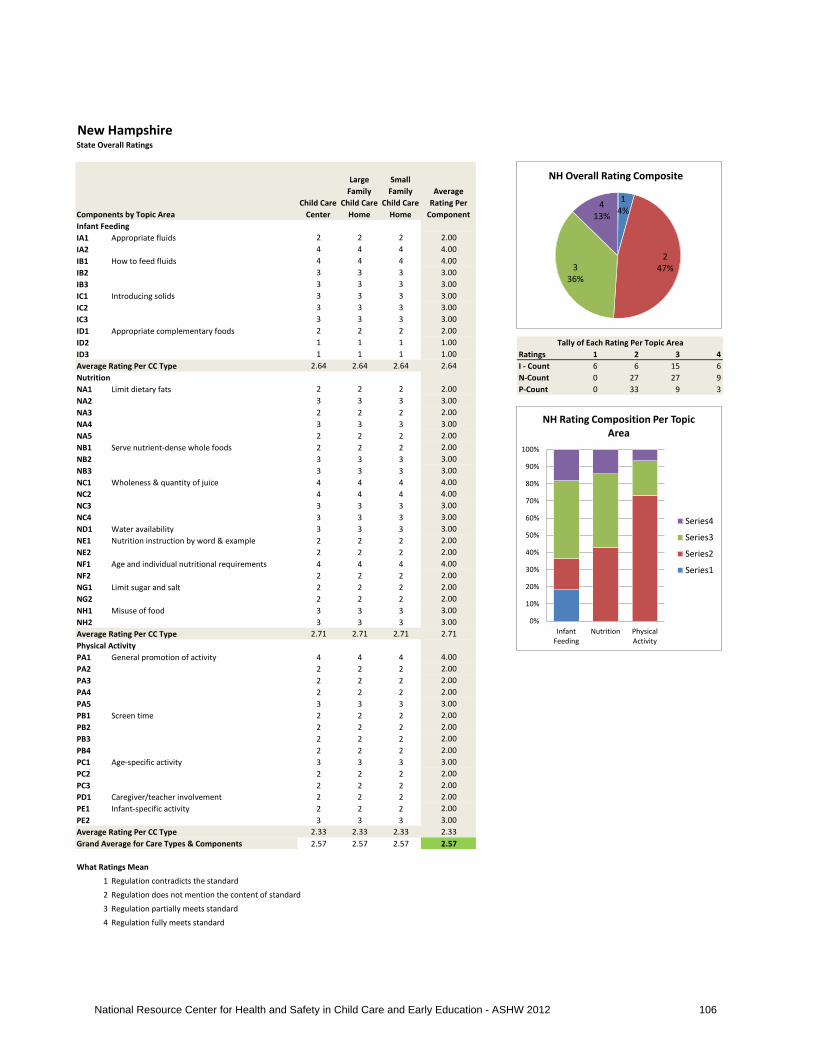
New HampshireState Overall Ratings
Components by Topic AreaChild Care
Center
Large Family
Child Care Home
Small Family
Child Care Home
Average Rating Per
ComponentInfant Feeding IA1 Appropriate fluids 2 2 2 2.00IA2 4 4 4 4.00IB1 How to feed fluids 4 4 4 4.00IB2 3 3 3 3.00IB3 3 3 3 3.00IC1 Introducing solids 3 3 3 3.00IC2 3 3 3 3.00IC3 3 3 3 3.00ID1 Appropriate complementary foods 2 2 2 2.00ID2 1 1 1 1.00ID3 1 1 1 1.00 Ratings 1 2 3 4Average Rating Per CC Type 2.64 2.64 2.64 2.64 I - Count 6 6 15 6Nutrition N-Count 0 27 27 9NA1 Limit dietary fats 2 2 2 2.00 P-Count 0 33 9 3NA2 3 3 3 3.00NA3 2 2 2 2.00NA4 3 3 3 3.00NA5 2 2 2 2.00NB1 Serve nutrient-dense whole foods 2 2 2 2.00NB2 3 3 3 3.00NB3 3 3 3 3.00NC1 Wholeness & quantity of juice 4 4 4 4.00NC2 4 4 4 4.00NC3 3 3 3 3.00NC4 3 3 3 3.00ND1 Water availability 3 3 3 3.00NE1 Nutrition instruction by word & example 2 2 2 2.00NE2 2 2 2 2.00NF1 Age and individual nutritional requirements 4 4 4 4.00NF2 2 2 2 2.00NG1 Limit sugar and salt 2 2 2 2.00NG2 2 2 2 2.00NH1 Misuse of food 3 3 3 3.00NH2 3 3 3 3.00Average Rating Per CC Type 2.71 2.71 2.71 2.71Physical ActivityPA1 General promotion of activity 4 4 4 4.00PA2 2 2 2 2.00PA3 2 2 2 2.00PA4 2 2 2 2.00PA5 3 3 3 3.00PB1 Screen time 2 2 2 2.00PB2 2 2 2 2.00PB3 2 2 2 2.00PB4 2 2 2 2.00PC1 Age-specific activity 3 3 3 3.00PC2 2 2 2 2.00PC3 2 2 2 2.00PD1 Caregiver/teacher involvement 2 2 2 2.00PE1 Infant-specific activity 2 2 2 2.00PE2 3 3 3 3.00Average Rating Per CC Type 2.33 2.33 2.33 2.33Grand Average for Care Types & Components 2.57 2.57 2.57 2.57
What Ratings Mean
1 Regulation contradicts the standard
2 Regulation does not mention the content of standard
3 Regulation partially meets standard
4 Regulation fully meets standard
Tally of Each Rating Per Topic Area
1 4%
2 47% 3
36%
4 13%
NH Overall Rating Composite
0%
10%
20%
30%
40%
50%
60%
70%
80%
90%
100%
Infant Feeding
Nutrition Physical Activity
NH Rating Composition Per Topic Area
Series4
Series3
Series2
Series1
National Resource Center for Health and Safety in Child Care and Early Education - ASHW 2012 106

New JerseyState Overall Ratings
Components by Topic AreaChild Care
Center
Large Family
Child Care Home
Small Family
Child Care Home
Average Rating Per
ComponentInfant Feeding IA1 Appropriate fluids 2 2 2 2.00IA2 2 2 2 2.00IB1 How to feed fluids 2 2 2 2.00IB2 2 2 2 2.00IB3 3 3 2 2.67IC1 Introducing solids 3 3 2 2.67IC2 2 2 3 2.33IC3 2 2 2 2.00ID1 Appropriate complementary foods 2 2 2 2.00ID2 2 2 2 2.00ID3 2 2 2 2.00 Ratings 1 2 3 4Average Rating Per CC Type 2.18 2.18 2.09 2.15 I - Count 0 28 5 0Nutrition N-Count 0 38 24 1NA1 Limit dietary fats 2 2 2 2.00 P-Count 0 29 13 3NA2 3 3 2 2.67NA3 2 2 2 2.00NA4 2 2 2 2.00NA5 2 2 2 2.00NB1 Serve nutrient-dense whole foods 3 3 2 2.67NB2 3 3 2 2.67NB3 3 3 2 2.67NC1 Wholeness & quantity of juice 3 3 2 2.67NC2 2 2 2 2.00NC3 2 2 2 2.00NC4 2 2 2 2.00ND1 Water availability 3 3 4 3.33NE1 Nutrition instruction by word & example 2 2 2 2.00NE2 2 2 2 2.00NF1 Age and individual nutritional requirements 3 3 3 3.00NF2 3 3 3 3.00NG1 Limit sugar and salt 2 2 2 2.00NG2 2 2 2 2.00NH1 Misuse of food 3 3 3 3.00NH2 3 3 3 3.00Average Rating Per CC Type 2.48 2.48 2.29 2.41Physical ActivityPA1 General promotion of activity 4 4 4 4.00PA2 2 2 2 2.00PA3 2 2 2 2.00PA4 2 2 2 2.00PA5 3 3 2 2.67PB1 Screen time 2 2 3 2.33PB2 2 2 3 2.33PB3 2 2 2 2.00PB4 2 2 2 2.00PC1 Age-specific activity 3 3 2 2.67PC2 3 3 3 3.00PC3 3 3 3 3.00PD1 Caregiver/teacher involvement 2 2 2 2.00PE1 Infant-specific activity 2 2 2 2.00PE2 2 2 3 2.33Average Rating Per CC Type 2.40 2.40 2.47 2.42Grand Average for Care Types & Components 2.38 2.38 2.30 2.35
What Ratings Mean
1 Regulation contradicts the standard
2 Regulation does not mention the content of standard
3 Regulation partially meets standard
4 Regulation fully meets standard
Tally of Each Rating Per Topic Area
2 67%
3 30%
4 3%
NJ Overall Rating Composite
0%
10%
20%
30%
40%
50%
60%
70%
80%
90%
100%
Infant Feeding
Nutrition Physical Activity
NJ Rating Composition Per Topic Area
4 Ratings
3 Ratings
2 Ratings
1 Ratings
National Resource Center for Health and Safety in Child Care and Early Education - ASHW 2012 107

New MexicoState Overall Ratings Key to Changes
Assessment Year
Components by Topic AreaChild Care
Center
Large Family
Child Care Home
Small Family
Child Care Home
Child Care Center
Large Family
Child Care Home
Small Family
Child Care Home
Infant Feeding IA1 Support breastfeeding 3 3 3 3 3 3IA2 No cow’s milk < 1yr 4 4 4 4 4 4IB1 Feed infants on cue 4 4 4 4 4 4IB2 Stop feed @ satiety 3 3 3 3 3 3IB3 Hold infant to feed 3 3 3 3 3 3IC1 Plan solid introduction 3 3 3 3 3 3IC2 Intro solids @ 4-6 mo 3 3 3 3 3 3IC3 Iron-Fort @ 4-6 mo 3 3 3 3 3 3ID1 Don’t mix formula 2 2 2 2 2 2ID2 Whole fruit 7 m-1 yr 1 1 1 1 1 1ID3 No juice < 12 mo 1 1 1 1 1 1Average Rating Per CC Type 2.73 2.73 2.73 2.73 2.73 2.73NutritionNA1 Limit oils/fats 2 2 2 2 2 2NA2 Low fat meat/proteins 3 3 3 3 3 3NA3 Low fat milk equivalents 3 3 3 3 3 3NA4 Whole milk 1-2 y/o 3 3 3 3 3 3NA5 Low fat milk > 2 y/o 3 3 3 4 4 4NB1 Whole grains 3 3 3 3 3 3NB2 Variety of vegetables 3 3 3 3 3 3NB3 Variety of whole fruit 4 4 4 4 4 4NC1 100% juice 3 3 3 3 3 3NC2 Juice only @ meals 2 2 2 2 2 2NC3 Juice 4-6 oz. 1-6 y/o 3 3 3 3 3 3NC4 Juice 8-12 oz. 7+ y/o 3 3 3 3 3 3ND1 Make water available 3 3 3 4 4 4NE1 Teach portion sizes 3 3 3 3 3 3NE2 Eat with children 2 2 2 2 2 2NF1 Appropriate servings 4 4 4 4 4 4NF2 Healthy seconds 4 4 4 4 4 4NG1 Limit salt 2 2 2 2 2 2NG2 Avoid sugary foods 1 1 1 1 1 1NH1 Food no force/bribe 2 2 2 2 2 2NH2 Food no reward/punish 3 3 3 3 3 3Average Rating Per CC Type 2.81 2.81 2.81 2.90 2.90 2.90Physical ActivityPA1 Space for active play 4 4 4 4 4 4PA2 Training on activities 2 2 2 2 2 2PA3 Write activity policies 2 2 2 2 2 2PA4 Play with children 2 2 2 2 2 2PA5 Don’t withhold play 2 2 2 2 2 2PB1 No screen time < 2 yr 3 3 3 4 4 4PB2 Screen time 30 min/wk 3 3 3 3 3 3PB3 Screen time purpose 2 2 2 2 2 2PB4 No TV w/meals 2 2 2 2 2 2PC1 Outdoor play occasions 3 3 3 3 3 3PC2 Toddler play time 3 3 3 3 3 3PC3 Preschool play time 3 3 3 3 3 3PD1 Structured play 2 2 2 2 2 2PE1 Tummy time often 2 2 2 2 2 2PE2 Limit time infant equip. 2 2 2 2 2 2Average Rating Per CC Type 2.47 2.47 2.47 2.53 2.53 2.53
What Ratings Mean
1 Regulation contradicts the standard
2 Regulation does not mention the content of standard
3 Regulation partially meets standard
4 Regulation fully meets standard NM Page 1 of 2
2010
Improved Rating
Lowered Rating
2012
National Resource Center for Health and Safety in Child Care and Early Education - ASHW 2012 108

New MexicoState Overall Ratings
Ratings 1 2 3 4 Ratings 1 2 3 4I - Count 6 3 18 6 I - Count 6 3 18 6N-Count 3 15 36 9 N-Count 3 15 30 15P-Count 0 27 15 3 P-Count 0 27 12 6
Understanding and Using This page
NM Page 2 of 2
Tally of Each Rating Per Topic Area 2010 Tally of Each Rating Per Topic Area 2012
On this page are two types of charts and tables based on data from the table on the previous page. The pie charts at the top show the composition of all the ratings for the state by percentage of 1, 2, 3 and 4 ratings, which affords an overall view of the state's ratings. The small table below each pie chart shows the frequency (number) of each rating of 1, 2, 3 and 4 for each topic area: I=Infant Feeding, N=Nutrition, and P=Physical Activity. The stacked bar charts show the percentage of ratings of 1- 4 for each topic area. Ratings of 1 are at the base of the columns and ratings of 4 are at the top. It is suggested that the state reviews this page for analysis of its regulations, to see where terminology is strong and to identify those areas in which terminology may be improved in its child care regulations that have implications for childhood obesity prevention. This page reports the state's ratings for each variable by child care type, so that all final ratings per child care facility type are shown.
2010 2012
1 6%
2 32%
3 49%
4 13%
NM Overall Rating Composite 2010
0%
10%
20%
30%
40%
50%
60%
70%
80%
90%
100%
Infant Feeding
Nutrition Physical Activity
NM Rating Composition Per Topic Area 2010
Series4
Series3
Series2
Series1
1 6%
2 32%
3 43%
4 19%
NM Overall Rating Composite 2012
0%
10%
20%
30%
40%
50%
60%
70%
80%
90%
100%
Infant Feeding
Nutrition Physical Activity
NM Rating Composition Per Topic Area 2012
Series4
Series3
Series2
Series1
National Resource Center for Health and Safety in Child Care and Early Education - ASHW 2012 109

New YorkState Overall Ratings
Components by Topic AreaChild Care
Center
Large Family
Child Care Home
Small Family
Child Care Home
Average Rating Per
ComponentInfant Feeding IA1 Appropriate fluids 3 2 3 2.67IA2 2 2 2 2.00IB1 How to feed fluids 2 2 2 2.00IB2 2 2 2 2.00IB3 4 3 3 3.33IC1 Introducing solids 2 2 2 2.00IC2 2 2 2 2.00IC3 2 2 2 2.00ID1 Appropriate complementary foods 2 2 2 2.00ID2 2 2 2 2.00ID3 2 2 2 2.00 Ratings 1 2 3 4Average Rating Per CC Type 2.27 2.09 2.18 2.18 I - Count 0 28 4 1Nutrition N-Count 0 42 12 9NA1 Limit dietary fats 2 2 2 2.00 P-Count 0 33 9 3NA2 2 2 2 2.00NA3 2 2 2 2.00NA4 2 2 2 2.00NA5 2 2 2 2.00NB1 Serve nutrient-dense whole foods 2 2 2 2.00NB2 2 2 2 2.00NB3 2 2 2 2.00NC1 Wholeness & quantity of juice 2 2 2 2.00NC2 2 2 2 2.00NC3 3 3 3 3.00NC4 3 3 3 3.00ND1 Water availability 4 4 4 4.00NE1 Nutrition instruction by word & example 2 2 2 2.00NE2 2 2 2 2.00NF1 Age and individual nutritional requirements 4 4 4 4.00NF2 4 4 4 4.00NG1 Limit sugar and salt 2 2 2 2.00NG2 2 2 2 2.00NH1 Misuse of food 3 3 3 3.00NH2 3 3 3 3.00Average Rating Per CC Type 2.48 2.48 2.48 2.48Physical ActivityPA1 General promotion of activity 4 4 4 4.00PA2 2 2 2 2.00PA3 2 2 2 2.00PA4 2 2 2 2.00PA5 3 3 3 3.00PB1 Screen time 2 2 2 2.00PB2 2 2 2 2.00PB3 2 2 2 2.00PB4 2 2 2 2.00PC1 Age-specific activity 3 3 3 3.00PC2 2 2 2 2.00PC3 2 2 2 2.00PD1 Caregiver/teacher involvement 2 2 2 2.00PE1 Infant-specific activity 2 2 2 2.00PE2 3 3 3 3.00Average Rating Per CC Type 2.33 2.33 2.33 2.33Grand Average for Care Types & Components 2.38 2.34 2.36 2.36
What Ratings Mean
1 Regulation contradicts the standard
2 Regulation does not mention the content of standard
3 Regulation partially meets standard
4 Regulation fully meets standard
Tally of Each Rating Per Topic Area
2 73%
3 18%
4 9%
NY Overall Rating Composite
0%
10%
20%
30%
40%
50%
60%
70%
80%
90%
100%
Infant Feeding
Nutrition Physical Activity
NY Rating Composition Per Topic Area
4 Ratings
3 Ratings
2 Ratings
1 Ratings
National Resource Center for Health and Safety in Child Care and Early Education - ASHW 2012 110

North CarolinaState Overall Ratings Key to Changes
Assessment Year
Components by Topic AreaChild Care
Center
Large Family
Child Care Home
Small Family
Child Care Home
Child Care Center
Large Family
Child Care Home
Small Family
Child Care Home
Infant Feeding IA1 Support breastfeeding 4 4 4 4 4 4IA2 No cow’s milk < 1yr 4 4 4 4 4 4IB1 Feed infants on cue 4 4 4 4 4 4IB2 Stop feed @ satiety 3 3 3 3 3 3IB3 Hold infant to feed 3 3 3 3 3 3IC1 Plan solid introduction 3 3 3 3 3 3IC2 Intro solids @ 4-6 mo 3 3 3 3 3 3IC3 Iron-Fort @ 4-6 mo 3 3 3 3 3 3ID1 Don’t mix formula 2 2 2 2 2 2ID2 Whole fruit 7 m-1 yr 1 1 1 1 1 1ID3 No juice < 12 mo 1 1 1 1 1 1Average Rating Per CC Type 2.82 2.82 2.82 2.82 2.82 2.82NutritionNA1 Limit oils/fats 2 2 2 2 2 2NA2 Low fat meat/proteins 3 3 3 3 3 3NA3 Low fat milk equivalents 3 3 3 3 3 3NA4 Whole milk 1-2 y/o 2 2 2 2 2 2NA5 Low fat milk > 2 y/o 2 2 2 4 4 4NB1 Whole grains 3 3 3 3 3 3NB2 Variety of vegetables 3 3 3 3 3 3NB3 Variety of whole fruit 3 3 3 3 3 3NC1 100% juice 4 4 4 4 4 4NC2 Juice only @ meals 2 2 2 2 2 2NC3 Juice 4-6 oz. 1-6 y/o 3 3 3 4 4 4NC4 Juice 8-12 oz. 7+ y/o 3 3 3 3 3 3ND1 Make water available 3 3 3 4 4 4NE1 Teach portion sizes 2 2 2 2 2 2NE2 Eat with children 2 2 2 2 2 2NF1 Appropriate servings 4 4 4 4 4 4NF2 Healthy seconds 3 3 3 3 3 3NG1 Limit salt 2 2 2 2 2 2NG2 Avoid sugary foods 3 1 1 3 1 1NH1 Food no force/bribe 2 2 2 2 2 2NH2 Food no reward/punish 3 3 3 3 3 3Average Rating Per CC Type 2.71 2.62 2.62 2.90 2.81 2.81Physical ActivityPA1 Space for active play 4 4 4 4 4 4PA2 Training on activities 2 2 2 2 2 2PA3 Write activity policies 2 2 2 2 2 2PA4 Play with children 2 2 2 2 3 3PA5 Don’t withhold play 2 2 2 2 2 2PB1 No screen time < 2 yr 4 4 4 4 4 4PB2 Screen time 30 min/wk 3 3 3 3 3 3PB3 Screen time purpose 2 2 2 2 2 2PB4 No TV w/meals 2 2 2 2 2 2PC1 Outdoor play occasions 3 3 3 3 3 3PC2 Toddler play time 3 3 3 3 4 4PC3 Preschool play time 3 3 3 3 3 3PD1 Structured play 2 2 2 2 2 2PE1 Tummy time often 4 4 4 4 4 4PE2 Limit time infant equip. 2 2 2 2 2 2Average Rating Per CC Type 2.67 2.67 2.67 2.67 2.80 2.80
What Ratings Mean
1 Regulation contradicts the standard
2 Regulation does not mention the content of standard
3 Regulation partially meets standard
4 Regulation fully meets standard NC Page 1 of 2
2010
Improved Rating
Lowered Rating
2012
National Resource Center for Health and Safety in Child Care and Early Education - ASHW 2012 111

North CarolinaState Overall Ratings
Ratings 1 2 3 4 Ratings 1 2 3 4I - Count 6 3 15 9 I - Count 6 3 15 9N-Count 2 24 31 6 N-Count 2 21 25 15P-Count 0 24 12 9 P-Count 0 22 12 11
Understanding and Using This page
NC Page 2 of 2
Tally of Each Rating Per Topic Area 2010 Tally of Each Rating Per Topic Area 2012
On this page are two types of charts and tables based on data from the table on the previous page. The pie charts at the top show the composition of all the ratings for the state by percentage of 1, 2, 3 and 4 ratings, which affords an overall view of the state's ratings. The small table below each pie chart shows the frequency (number) of each rating of 1, 2, 3 and 4 for each topic area: I=Infant Feeding, N=Nutrition, and P=Physical Activity. The stacked bar charts show the percentage of ratings of 1- 4 for each topic area. Ratings of 1 are at the base of the columns and ratings of 4 are at the top. It is suggested that the state reviews this page for analysis of its regulations, to see where terminology is strong and to identify those areas in which terminology may be improved in its child care regulations that have implications for childhood obesity prevention. This page reports the state's ratings for each variable by child care type, so that all final ratings per child care facility type are shown.
2010 2012
1 6%
2 36%
3 41%
4 17%
NC Overall Rating Composite 2010
0%
10%
20%
30%
40%
50%
60%
70%
80%
90%
100%
Infant Feeding
Nutrition Physical Activity
NC Rating Composition Per Topic Area 2010
Series4
Series3
Series2
Series1
1 6%
2 33%
3 37%
4 25%
NC Overall Rating Composite 2012
0%
10%
20%
30%
40%
50%
60%
70%
80%
90%
100%
Infant Feeding
Nutrition Physical Activity
NC Rating Composition Per Topic Area 2012
Series4
Series3
Series2
Series1
National Resource Center for Health and Safety in Child Care and Early Education - ASHW 2012 112

North DakotaState Overall Ratings Key to Changes
Assessment Year
Components by Topic AreaChild Care
Center
Large Family
Child Care Home
Small Family
Child Care Home
Child Care Center
Large Family
Child Care Home
Small Family
Child Care Home
Infant Feeding IA1 Support breastfeeding 2 2 2 2 2 2IA2 No cow’s milk < 1yr 3 4 1 3 3 3IB1 Feed infants on cue 4 4 2 4 4 4IB2 Stop feed @ satiety 3 3 2 4 4 4IB3 Hold infant to feed 3 2 3 3 3 3IC1 Plan solid introduction 3 3 2 3 3 3IC2 Intro solids @ 4-6 mo 3 3 2 4 4 4IC3 Iron-Fort @ 4-6 mo 3 3 2 3 3 3ID1 Don’t mix formula 3 3 2 4 4 4ID2 Whole fruit 7 m-1 yr 1 1 2 1 1 1ID3 No juice < 12 mo 1 1 2 1 1 1Average Rating Per CC Type 2.64 2.64 2.00NutritionNA1 Limit oils/fats 2 2 2 2 2 2NA2 Low fat meat/proteins 3 3 2 3 3 3NA3 Low fat milk equivalents 3 3 2 3 3 3NA4 Whole milk 1-2 y/o 2 2 2 2 2 2NA5 Low fat milk > 2 y/o 2 2 2 4 4 4NB1 Whole grains 3 3 2 3 3 3NB2 Variety of vegetables 3 3 2 3 3 3NB3 Variety of whole fruit 3 3 2 3 3 3NC1 100% juice 4 4 2 4 4 4NC2 Juice only @ meals 2 2 2 2 2 2NC3 Juice 4-6 oz. 1-6 y/o 3 3 2 3 3 3NC4 Juice 8-12 oz. 7+ y/o 3 3 2 3 3 3ND1 Make water available 3 2 2 4 4 4NE1 Teach portion sizes 3 3 2 3 3 3NE2 Eat with children 2 2 2 2 2 2NF1 Appropriate servings 4 4 2 4 4 4NF2 Healthy seconds 3 3 2 3 3 3NG1 Limit salt 2 2 2 2 2 2NG2 Avoid sugary foods 1 1 2 1 1 1NH1 Food no force/bribe 3 3 3 3 3 3NH2 Food no reward/punish 3 3 3 3 3 3Average Rating Per CC Type 2.71 2.67 2.10Physical ActivityPA1 Space for active play 4 4 4 4 4 4PA2 Training on activities 2 2 2 2 2 2PA3 Write activity policies 2 2 2 3 3 3PA4 Play with children 2 2 2 3 3 2PA5 Don’t withhold play 3 3 3 4 4 4PB1 No screen time < 2 yr 2 2 2 2 2 2PB2 Screen time 30 min/wk 2 2 2 2 2 2PB3 Screen time purpose 2 2 2 2 2 2PB4 No TV w/meals 2 2 2 2 2 2PC1 Outdoor play occasions 2 3 3 3 3 3PC2 Toddler play time 2 2 2 2 2 2PC3 Preschool play time 2 2 2 2 2 2PD1 Structured play 2 2 2 2 2 2PE1 Tummy time often 2 2 2 2 2 2PE2 Limit time infant equip. 2 2 2 2 2 2Average Rating Per CC Type 2.20 2.27 2.27
What Ratings Mean
1 Regulation contradicts the standard
2 Regulation does not mention the content of standard
3 Regulation partially meets standard
4 Regulation fully meets standard ND Page 1 of2
2011
Improved Rating
Lowered Rating
2012
National Resource Center for Health and Safety in Child Care and Early Education - ASHW 2012 113
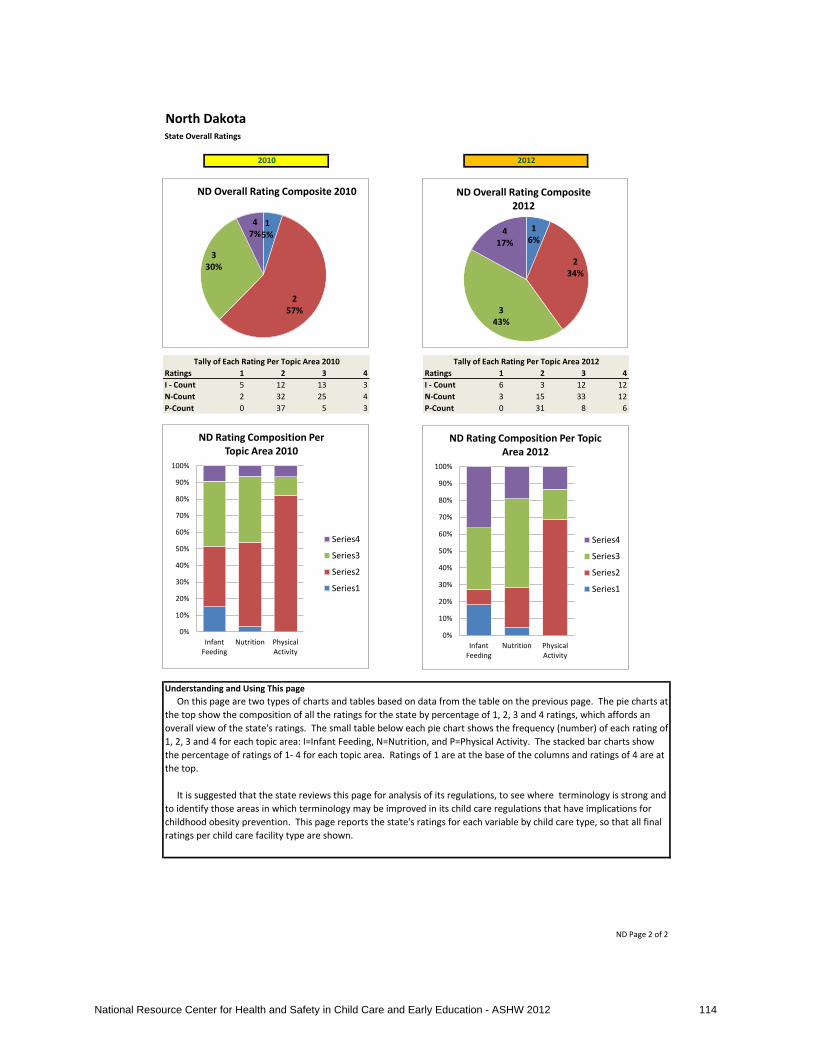
North DakotaState Overall Ratings
Ratings 1 2 3 4 Ratings 1 2 3 4I - Count 5 12 13 3 I - Count 6 3 12 12N-Count 2 32 25 4 N-Count 3 15 33 12P-Count 0 37 5 3 P-Count 0 31 8 6
Understanding and Using This page
ND Page 2 of 2
On this page are two types of charts and tables based on data from the table on the previous page. The pie charts at the top show the composition of all the ratings for the state by percentage of 1, 2, 3 and 4 ratings, which affords an overall view of the state's ratings. The small table below each pie chart shows the frequency (number) of each rating of 1, 2, 3 and 4 for each topic area: I=Infant Feeding, N=Nutrition, and P=Physical Activity. The stacked bar charts show the percentage of ratings of 1- 4 for each topic area. Ratings of 1 are at the base of the columns and ratings of 4 are at the top. It is suggested that the state reviews this page for analysis of its regulations, to see where terminology is strong and to identify those areas in which terminology may be improved in its child care regulations that have implications for childhood obesity prevention. This page reports the state's ratings for each variable by child care type, so that all final ratings per child care facility type are shown.
2010 2012
Tally of Each Rating Per Topic Area 2010 Tally of Each Rating Per Topic Area 2012
1 5%
2 57%
3 30%
4 7%
ND Overall Rating Composite 2010
0%
10%
20%
30%
40%
50%
60%
70%
80%
90%
100%
Infant Feeding
Nutrition Physical Activity
ND Rating Composition Per Topic Area 2010
Series4
Series3
Series2
Series1
1 6%
2 34%
3 43%
4 17%
ND Overall Rating Composite 2012
0%
10%
20%
30%
40%
50%
60%
70%
80%
90%
100%
Infant Feeding
Nutrition Physical Activity
ND Rating Composition Per Topic Area 2012
Series4
Series3
Series2
Series1
National Resource Center for Health and Safety in Child Care and Early Education - ASHW 2012 114

OhioState Overall Ratings Key to Changes
Assessment Year
Components by Topic AreaChild Care
Center
Large Family
Child Care Home
Small Family
Child Care Home
Child Care Center
Large Family
Child Care Home
Small Family
Child Care Home
Infant Feeding IA1 Support breastfeeding 3 3 3 3 3 3IA2 No cow’s milk < 1yr 4 4 4 4 4 4IB1 Feed infants on cue 4 4 4 4 4 4IB2 Stop feed @ satiety 3 3 3 3 3 3IB3 Hold infant to feed 3 3 3 3 3 3IC1 Plan solid introduction 4 3 3 4 3 3IC2 Intro solids @ 4-6 mo 3 3 3 3 3 3IC3 Iron-Fort @ 4-6 mo 3 3 3 3 3 3ID1 Don’t mix formula 2 2 2 2 2 2ID2 Whole fruit 7 m-1 yr 1 1 1 1 1 1ID3 No juice < 12 mo 1 1 1 1 1 1Average Rating Per CC Type 2.82 2.73 2.73 2.82 2.73 2.73NutritionNA1 Limit oils/fats 2 2 2 2 2 2NA2 Low fat meat/proteins 3 3 3 3 3 3NA3 Low fat milk equivalents 3 3 3 3 3 3NA4 Whole milk 1-2 y/o 3 3 3 3 3 3NA5 Low fat milk > 2 y/o 2 2 2 4 4 4NB1 Whole grains 4 4 4 4 4 4NB2 Variety of vegetables 3 3 3 3 3 3NB3 Variety of whole fruit 3 3 3 3 3 3NC1 100% juice 4 4 4 4 4 4NC2 Juice only @ meals 2 2 2 2 2 2NC3 Juice 4-6 oz. 1-6 y/o 3 3 3 3 3 3NC4 Juice 8-12 oz. 7+ y/o 3 3 3 3 3 3ND1 Make water available 4 4 4 4 4 4NE1 Teach portion sizes 3 3 2 3 3 2NE2 Eat with children 2 2 2 2 2 2NF1 Appropriate servings 4 4 3 4 4 3NF2 Healthy seconds 3 3 3 3 3 3NG1 Limit salt 2 2 2 2 2 2NG2 Avoid sugary foods 1 1 1 1 1 1NH1 Food no force/bribe 2 2 2 2 2 2NH2 Food no reward/punish 3 3 3 3 3 3Average Rating Per CC Type 2.81 2.81 2.71 2.90 2.90 2.81Physical ActivityPA1 Space for active play 4 4 4 4 4 4PA2 Training on activities 2 2 2 2 2 2PA3 Write activity policies 2 2 2 2 2 2PA4 Play with children 2 2 2 2 2 2PA5 Don’t withhold play 3 2 3 3 2 3PB1 No screen time < 2 yr 2 2 2 2 2 2PB2 Screen time 30 min/wk 2 2 2 2 2 2PB3 Screen time purpose 2 2 2 2 2 2PB4 No TV w/meals 2 2 2 2 2 2PC1 Outdoor play occasions 3 3 3 3 3 3PC2 Toddler play time 2 2 2 2 2 2PC3 Preschool play time 2 2 2 2 2 2PD1 Structured play 2 2 2 2 2 2PE1 Tummy time often 2 2 2 2 2 2PE2 Limit time infant equip. 2 2 2 2 2 2Average Rating Per CC Type 2.27 2.20 2.27 2.27 2.20 2.27
What Ratings Mean
1 Regulation contradicts the standard
2 Regulation does not mention the content of standard
3 Regulation partially meets standard
4 Regulation fully meets standard OH Page 1 of 2
2010
Improved Rating
Lowered Rating
2012
National Resource Center for Health and Safety in Child Care and Early Education - ASHW 2012 115

OhioState Overall Ratings
Ratings 1 2 3 4 Ratings 1 2 3 4I - Count 6 3 17 7 I - Count 6 3 17 7N-Count 3 19 30 11 N-Count 3 16 30 14P-Count 0 37 5 3 P-Count 0 37 5 3
Understanding and Using This page
OH Page 2 of 2
Tally of Each Rating Per Topic Area 2010 Tally of Each Rating Per Topic Area 2012
On this page are two types of charts and tables based on data from the table on the previous page. The pie charts at the top show the composition of all the ratings for the state by percentage of 1, 2, 3 and 4 ratings, which affords an overall view of the state's ratings. The small table below each pie chart shows the frequency (number) of each rating of 1, 2, 3 and 4 for each topic area: I=Infant Feeding, N=Nutrition, and P=Physical Activity. The stacked bar charts show the percentage of ratings of 1- 4 for each topic area. Ratings of 1 are at the base of the columns and ratings of 4 are at the top. It is suggested that the state reviews this page for analysis of its regulations, to see where terminology is strong and to identify those areas in which terminology may be improved in its child care regulations that have implications for childhood obesity prevention. This page reports the state's ratings for each variable by child care type, so that all final ratings per child care facility type are shown.
2010 2012
1 6%
2 42%
3 37%
4 15%
OH Overall Rating Composite 2010
0%
10%
20%
30%
40%
50%
60%
70%
80%
90%
100%
Infant Feeding
Nutrition Physical Activity
OH Rating Composition Per Topic Area 2010
Series4
Series3
Series2
Series1
1 6%
2 40%
3 37%
4 17%
OH Overall Rating Composite 2012
0%
10%
20%
30%
40%
50%
60%
70%
80%
90%
100%
Infant Feeding
Nutrition Physical Activity
OH Rating Composition Per Topic Area 2012
Series4
Series3
Series2
Series1
National Resource Center for Health and Safety in Child Care and Early Education - ASHW 2012 116
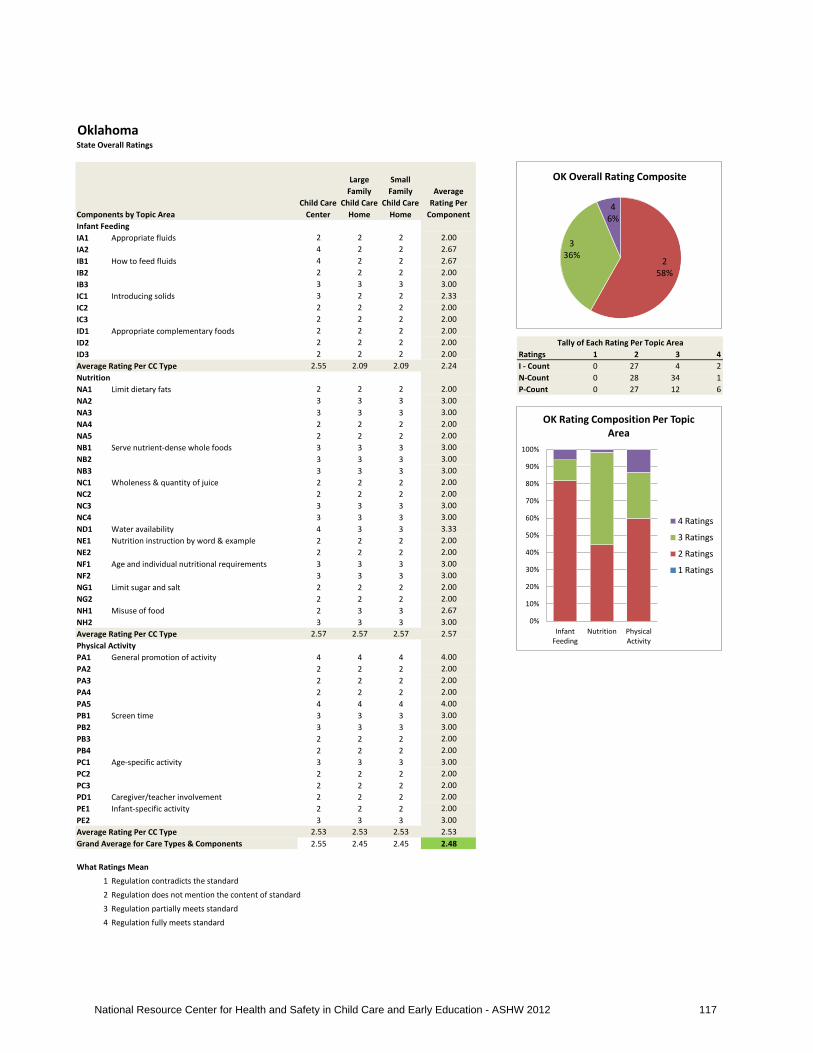
OklahomaState Overall Ratings
Components by Topic AreaChild Care
Center
Large Family
Child Care Home
Small Family
Child Care Home
Average Rating Per
ComponentInfant Feeding IA1 Appropriate fluids 2 2 2 2.00IA2 4 2 2 2.67IB1 How to feed fluids 4 2 2 2.67IB2 2 2 2 2.00IB3 3 3 3 3.00IC1 Introducing solids 3 2 2 2.33IC2 2 2 2 2.00IC3 2 2 2 2.00ID1 Appropriate complementary foods 2 2 2 2.00ID2 2 2 2 2.00ID3 2 2 2 2.00 Ratings 1 2 3 4Average Rating Per CC Type 2.55 2.09 2.09 2.24 I - Count 0 27 4 2Nutrition N-Count 0 28 34 1NA1 Limit dietary fats 2 2 2 2.00 P-Count 0 27 12 6NA2 3 3 3 3.00NA3 3 3 3 3.00NA4 2 2 2 2.00NA5 2 2 2 2.00NB1 Serve nutrient-dense whole foods 3 3 3 3.00NB2 3 3 3 3.00NB3 3 3 3 3.00NC1 Wholeness & quantity of juice 2 2 2 2.00NC2 2 2 2 2.00NC3 3 3 3 3.00NC4 3 3 3 3.00ND1 Water availability 4 3 3 3.33NE1 Nutrition instruction by word & example 2 2 2 2.00NE2 2 2 2 2.00NF1 Age and individual nutritional requirements 3 3 3 3.00NF2 3 3 3 3.00NG1 Limit sugar and salt 2 2 2 2.00NG2 2 2 2 2.00NH1 Misuse of food 2 3 3 2.67NH2 3 3 3 3.00Average Rating Per CC Type 2.57 2.57 2.57 2.57Physical ActivityPA1 General promotion of activity 4 4 4 4.00PA2 2 2 2 2.00PA3 2 2 2 2.00PA4 2 2 2 2.00PA5 4 4 4 4.00PB1 Screen time 3 3 3 3.00PB2 3 3 3 3.00PB3 2 2 2 2.00PB4 2 2 2 2.00PC1 Age-specific activity 3 3 3 3.00PC2 2 2 2 2.00PC3 2 2 2 2.00PD1 Caregiver/teacher involvement 2 2 2 2.00PE1 Infant-specific activity 2 2 2 2.00PE2 3 3 3 3.00Average Rating Per CC Type 2.53 2.53 2.53 2.53Grand Average for Care Types & Components 2.55 2.45 2.45 2.48
What Ratings Mean
1 Regulation contradicts the standard
2 Regulation does not mention the content of standard
3 Regulation partially meets standard
4 Regulation fully meets standard
Tally of Each Rating Per Topic Area
2 58%
3 36%
4 6%
OK Overall Rating Composite
0%
10%
20%
30%
40%
50%
60%
70%
80%
90%
100%
Infant Feeding
Nutrition Physical Activity
OK Rating Composition Per Topic Area
4 Ratings
3 Ratings
2 Ratings
1 Ratings
National Resource Center for Health and Safety in Child Care and Early Education - ASHW 2012 117

OregonState Overall Ratings Key to Changes
Assessment Year
Components by Topic AreaChild Care
Center
Large Family
Child Care Home
Small Family
Child Care Home
Child Care Center
Large Family
Child Care Home
Small Family
Child Care Home
Infant Feeding IA1 Support breastfeeding 2 3 3 2 3 3IA2 No cow’s milk < 1yr 4 4 4 4 4 4IB1 Feed infants on cue 4 4 4 4 4 4IB2 Stop feed @ satiety 3 3 3 3 3 3IB3 Hold infant to feed 3 3 3 3 3 3IC1 Plan solid introduction 3 3 3 3 3 3IC2 Intro solids @ 4-6 mo 1 1 3 1 1 3IC3 Iron-Fort @ 4-6 mo 3 3 3 3 3 3ID1 Don’t mix formula 2 2 2 2 2 2ID2 Whole fruit 7 m-1 yr 1 1 1 1 1 1ID3 No juice < 12 mo 1 1 1 1 1 1Average Rating Per CC Type 2.45 2.55 2.73 2.45 2.55 2.73NutritionNA1 Limit oils/fats 2 2 2 2 2 2NA2 Low fat meat/proteins 3 3 3 3 3 3NA3 Low fat milk equivalents 3 3 3 3 3 3NA4 Whole milk 1-2 y/o 2 2 2 2 2 2NA5 Low fat milk > 2 y/o 2 2 2 4 4 4NB1 Whole grains 3 3 3 3 3 3NB2 Variety of vegetables 3 3 3 3 3 3NB3 Variety of whole fruit 3 3 3 3 3 3NC1 100% juice 4 4 4 4 4 4NC2 Juice only @ meals 2 2 2 2 2 2NC3 Juice 4-6 oz. 1-6 y/o 3 3 3 3 3 3NC4 Juice 8-12 oz. 7+ y/o 3 3 3 3 3 3ND1 Make water available 3 3 2 4 4 4NE1 Teach portion sizes 2 2 2 2 2 2NE2 Eat with children 2 2 2 2 2 2NF1 Appropriate servings 4 4 4 4 4 4NF2 Healthy seconds 3 3 3 3 3 3NG1 Limit salt 3 3 2 3 3 2NG2 Avoid sugary foods 3 3 1 3 3 1NH1 Food no force/bribe 3 3 2 3 3 2NH2 Food no reward/punish 3 3 3 3 3 3Average Rating Per CC Type 2.81 2.81 2.57 2.95 2.95 2.76Physical ActivityPA1 Space for active play 4 4 2 4 4 2PA2 Training on activities 2 2 2 2 2 2PA3 Write activity policies 2 2 2 2 2 2PA4 Play with children 2 2 2 2 2 2PA5 Don’t withhold play 2 2 2 2 2 2PB1 No screen time < 2 yr 2 3 3 2 3 3PB2 Screen time 30 min/wk 2 3 3 2 3 3PB3 Screen time purpose 2 2 2 2 2 2PB4 No TV w/meals 2 2 2 2 2 2PC1 Outdoor play occasions 3 3 3 3 3 3PC2 Toddler play time 3 3 2 3 3 2PC3 Preschool play time 3 3 2 3 3 2PD1 Structured play 2 2 2 2 2 2PE1 Tummy time often 2 2 2 2 2 2PE2 Limit time infant equip. 2 2 2 2 2 2Average Rating Per CC Type 2.33 2.47 2.20 2.33 2.47 2.20
What Ratings Mean
1 Regulation contradicts the standard
2 Regulation does not mention the content of standard
3 Regulation partially meets standard
4 Regulation fully meets standard OR Page 1 of 2
2010
Improved Rating
Lowered Rating
2012
National Resource Center for Health and Safety in Child Care and Early Education - ASHW 2012 118

OregonState Overall Ratings
Ratings 1 2 3 4 Ratings 1 2 3 4I - Count 8 4 15 6 I - Count 8 4 15 6N-Count 1 21 35 6 N-Count 1 17 33 12P-Count 0 32 11 2 P-Count 0 32 11 2
Understanding and Using This page
OR Page 2 of 2
Tally of Each Rating Per Topic Area 2010 Tally of Each Rating Per Topic Area 2012
On this page are two types of charts and tables based on data from the table on the previous page. The pie charts at the top show the composition of all the ratings for the state by percentage of 1, 2, 3 and 4 ratings, which affords an overall view of the state's ratings. The small table below each pie chart shows the frequency (number) of each rating of 1, 2, 3 and 4 for each topic area: I=Infant Feeding, N=Nutrition, and P=Physical Activity. The stacked bar charts show the percentage of ratings of 1- 4 for each topic area. Ratings of 1 are at the base of the columns and ratings of 4 are at the top. It is suggested that the state reviews this page for analysis of its regulations, to see where terminology is strong and to identify those areas in which terminology may be improved in its child care regulations that have implications for childhood obesity prevention. This page reports the state's ratings for each variable by child care type, so that all final ratings per child care facility type are shown.
2010 2012
1 6%
2 40%
3 43%
4 10%
OR Overall Rating Composite 2010
0%
10%
20%
30%
40%
50%
60%
70%
80%
90%
100%
Infant Feeding
Nutrition Physical Activity
OR Rating Composition Per Topic Area 2010
Series4
Series3
Series2
Series1
1 6%
2 38%
3 42%
4 14%
OR Overall Rating Composite 2012
0%
10%
20%
30%
40%
50%
60%
70%
80%
90%
100%
Infant Feeding
Nutrition Physical Activity
OR Rating Composition Per Topic Area 2012
Series4
Series3
Series2
Series1
National Resource Center for Health and Safety in Child Care and Early Education - ASHW 2012 119
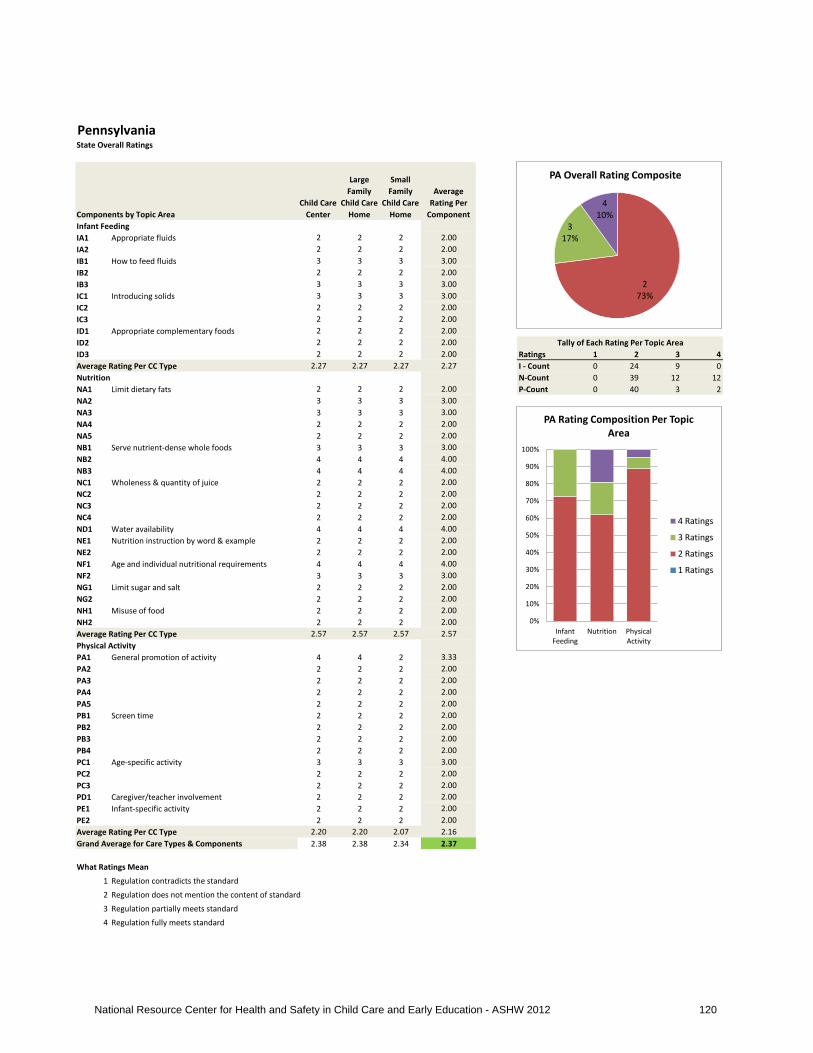
PennsylvaniaState Overall Ratings
Components by Topic AreaChild Care
Center
Large Family
Child Care Home
Small Family
Child Care Home
Average Rating Per
ComponentInfant Feeding IA1 Appropriate fluids 2 2 2 2.00IA2 2 2 2 2.00IB1 How to feed fluids 3 3 3 3.00IB2 2 2 2 2.00IB3 3 3 3 3.00IC1 Introducing solids 3 3 3 3.00IC2 2 2 2 2.00IC3 2 2 2 2.00ID1 Appropriate complementary foods 2 2 2 2.00ID2 2 2 2 2.00ID3 2 2 2 2.00 Ratings 1 2 3 4Average Rating Per CC Type 2.27 2.27 2.27 2.27 I - Count 0 24 9 0Nutrition N-Count 0 39 12 12NA1 Limit dietary fats 2 2 2 2.00 P-Count 0 40 3 2NA2 3 3 3 3.00NA3 3 3 3 3.00NA4 2 2 2 2.00NA5 2 2 2 2.00NB1 Serve nutrient-dense whole foods 3 3 3 3.00NB2 4 4 4 4.00NB3 4 4 4 4.00NC1 Wholeness & quantity of juice 2 2 2 2.00NC2 2 2 2 2.00NC3 2 2 2 2.00NC4 2 2 2 2.00ND1 Water availability 4 4 4 4.00NE1 Nutrition instruction by word & example 2 2 2 2.00NE2 2 2 2 2.00NF1 Age and individual nutritional requirements 4 4 4 4.00NF2 3 3 3 3.00NG1 Limit sugar and salt 2 2 2 2.00NG2 2 2 2 2.00NH1 Misuse of food 2 2 2 2.00NH2 2 2 2 2.00Average Rating Per CC Type 2.57 2.57 2.57 2.57Physical ActivityPA1 General promotion of activity 4 4 2 3.33PA2 2 2 2 2.00PA3 2 2 2 2.00PA4 2 2 2 2.00PA5 2 2 2 2.00PB1 Screen time 2 2 2 2.00PB2 2 2 2 2.00PB3 2 2 2 2.00PB4 2 2 2 2.00PC1 Age-specific activity 3 3 3 3.00PC2 2 2 2 2.00PC3 2 2 2 2.00PD1 Caregiver/teacher involvement 2 2 2 2.00PE1 Infant-specific activity 2 2 2 2.00PE2 2 2 2 2.00Average Rating Per CC Type 2.20 2.20 2.07 2.16Grand Average for Care Types & Components 2.38 2.38 2.34 2.37
What Ratings Mean
1 Regulation contradicts the standard
2 Regulation does not mention the content of standard
3 Regulation partially meets standard
4 Regulation fully meets standard
Tally of Each Rating Per Topic Area
2 73%
3 17%
4 10%
PA Overall Rating Composite
0%
10%
20%
30%
40%
50%
60%
70%
80%
90%
100%
Infant Feeding
Nutrition Physical Activity
PA Rating Composition Per Topic Area
4 Ratings
3 Ratings
2 Ratings
1 Ratings
National Resource Center for Health and Safety in Child Care and Early Education - ASHW 2012 120

Rhode IslandState Overall Ratings Key to Changes
Assessment Year
Components by Topic AreaChild Care
Center
Large Family
Child Care Home
Small Family
Child Care Home
Child Care Center
Large Family
Child Care Home
Small Family
Child Care Home
Infant Feeding IA1 Support breastfeeding 2 3 3 2 3 3IA2 No cow’s milk < 1yr 3 4 4 3 4 4IB1 Feed infants on cue 3 4 4 3 4 4IB2 Stop feed @ satiety 2 3 3 2 3 3IB3 Hold infant to feed 3 2 2 3 2 2IC1 Plan solid introduction 3 3 3 3 3 3IC2 Intro solids @ 4-6 mo 2 3 3 2 3 3IC3 Iron-Fort @ 4-6 mo 2 3 3 2 3 3ID1 Don’t mix formula 2 2 2 2 2 2ID2 Whole fruit 7 m-1 yr 2 1 1 2 1 1ID3 No juice < 12 mo 2 1 1 2 1 1Average Rating Per CC Type 2.36 2.64 2.64 2.36 2.64 2.64NutritionNA1 Limit oils/fats 2 2 2 2 2 2NA2 Low fat meat/proteins 2 3 3 2 3 3NA3 Low fat milk equivalents 2 3 3 2 3 3NA4 Whole milk 1-2 y/o 2 3 3 2 3 3NA5 Low fat milk > 2 y/o 2 3 3 2 4 4NB1 Whole grains 2 3 3 2 3 3NB2 Variety of vegetables 2 3 3 2 3 3NB3 Variety of whole fruit 2 3 3 2 3 3NC1 100% juice 2 4 4 2 4 4NC2 Juice only @ meals 2 4 4 2 4 4NC3 Juice 4-6 oz. 1-6 y/o 2 4 4 2 4 4NC4 Juice 8-12 oz. 7+ y/o 2 4 4 2 4 4ND1 Make water available 4 4 4 4 4 4NE1 Teach portion sizes 2 2 2 2 2 2NE2 Eat with children 2 2 2 2 2 2NF1 Appropriate servings 2 4 4 2 4 4NF2 Healthy seconds 2 3 3 2 3 3NG1 Limit salt 2 2 2 2 2 2NG2 Avoid sugary foods 2 3 3 2 3 3NH1 Food no force/bribe 2 2 2 2 2 2NH2 Food no reward/punish 3 3 3 3 3 3Average Rating Per CC Type 2.14 3.05 3.05 2.14 3.10 3.10Physical ActivityPA1 Space for active play 4 4 4 4 4 4PA2 Training on activities 2 2 2 2 2 2PA3 Write activity policies 2 2 2 2 2 2PA4 Play with children 2 2 2 2 2 2PA5 Don’t withhold play 2 4 4 2 4 4PB1 No screen time < 2 yr 2 3 3 2 3 3PB2 Screen time 30 min/wk 2 3 3 2 3 3PB3 Screen time purpose 2 2 2 2 2 2PB4 No TV w/meals 2 2 2 2 2 2PC1 Outdoor play occasions 2 3 3 2 3 3PC2 Toddler play time 3 3 3 3 3 3PC3 Preschool play time 3 3 3 3 3 3PD1 Structured play 2 2 2 2 2 2PE1 Tummy time often 2 2 2 2 2 2PE2 Limit time infant equip. 2 2 2 2 2 2Average Rating Per CC Type 2.27 2.60 2.60 2.27 2.60 2.60
What Ratings Mean
1 Regulation contradicts the standard
2 Regulation does not mention the content of standard
3 Regulation partially meets standard
4 Regulation fully meets standard RI Page 1 of 2
2010
Improved Rating
Lowered Rating
2012
National Resource Center for Health and Safety in Child Care and Early Education - ASHW 2012 121

Rhode IslandState Overall Ratings
Ratings 1 2 3 4 Ratings 1 2 3 4I - Count 4 11 14 4 I - Count 4 11 14 4N-Count 0 29 21 13 N-Count 0 29 19 15P-Count 0 28 12 5 P-Count 0 28 12 5
Understanding and Using This page
RI Page 2 of 2
Tally of Each Rating Per Topic Area 2010 Tally of Each Rating Per Topic Area 2012
On this page are two types of charts and tables based on data from the table on the previous page. The pie charts at the top show the composition of all the ratings for the state by percentage of 1, 2, 3 and 4 ratings, which affords an overall view of the state's ratings. The small table below each pie chart shows the frequency (number) of each rating of 1, 2, 3 and 4 for each topic area: I=Infant Feeding, N=Nutrition, and P=Physical Activity. The stacked bar charts show the percentage of ratings of 1- 4 for each topic area. Ratings of 1 are at the base of the columns and ratings of 4 are at the top. It is suggested that the state reviews this page for analysis of its regulations, to see where terminology is strong and to identify those areas in which terminology may be improved in its child care regulations that have implications for childhood obesity prevention. This page reports the state's ratings for each variable by child care type, so that all final ratings per child care facility type are shown.
2010 2012
1 3%
2 48% 3
33%
4 16%
RI Overall Rating Composite 2010
0%
10%
20%
30%
40%
50%
60%
70%
80%
90%
100%
Infant Feeding
Nutrition Physical Activity
RI Rating Composition Per Topic Area 2010
Series4
Series3
Series2
Series1
1 3%
2 48%
3 32%
4 17%
RI Overall Rating Composite 2012
0%
10%
20%
30%
40%
50%
60%
70%
80%
90%
100%
Infant Feeding
Nutrition Physical Activity
RI Rating Composition Per Topic Area 2012
Series4
Series3
Series2
Series1
National Resource Center for Health and Safety in Child Care and Early Education - ASHW 2012 122
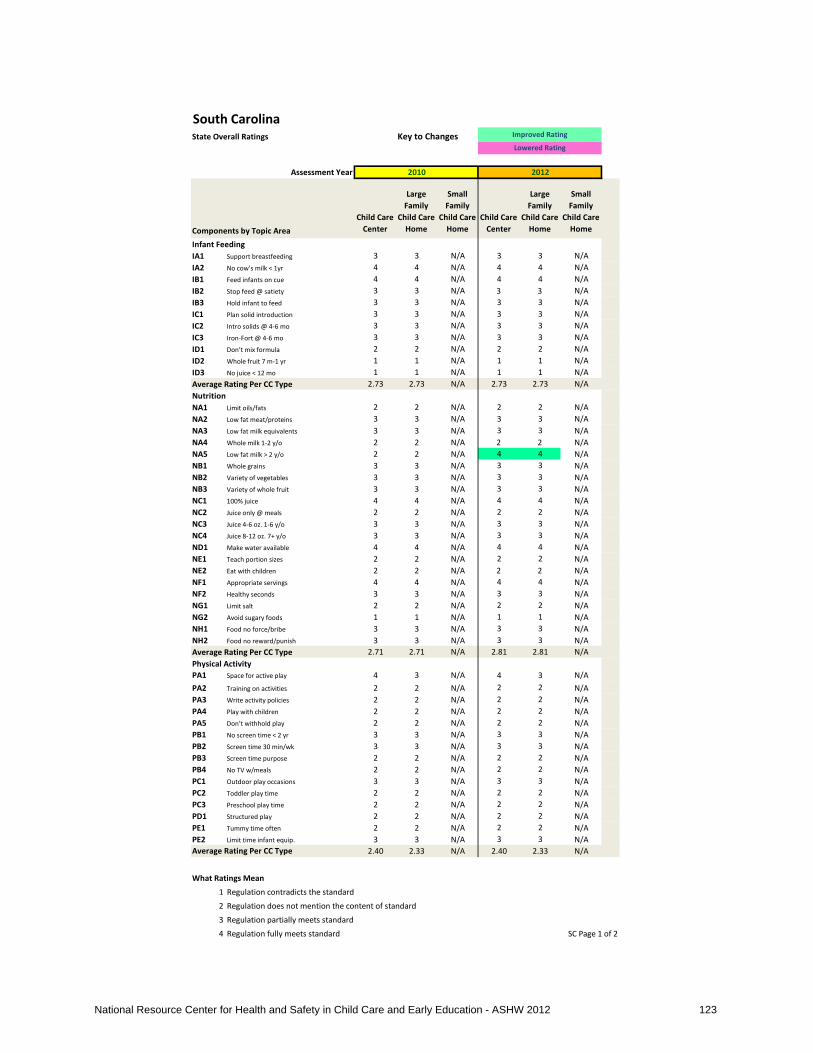
South CarolinaState Overall Ratings Key to Changes
Assessment Year
Components by Topic AreaChild Care
Center
Large Family
Child Care Home
Small Family
Child Care Home
Child Care Center
Large Family
Child Care Home
Small Family
Child Care Home
Infant Feeding IA1 Support breastfeeding 3 3 N/A 3 3 N/AIA2 No cow’s milk < 1yr 4 4 N/A 4 4 N/AIB1 Feed infants on cue 4 4 N/A 4 4 N/AIB2 Stop feed @ satiety 3 3 N/A 3 3 N/AIB3 Hold infant to feed 3 3 N/A 3 3 N/AIC1 Plan solid introduction 3 3 N/A 3 3 N/AIC2 Intro solids @ 4-6 mo 3 3 N/A 3 3 N/AIC3 Iron-Fort @ 4-6 mo 3 3 N/A 3 3 N/AID1 Don’t mix formula 2 2 N/A 2 2 N/AID2 Whole fruit 7 m-1 yr 1 1 N/A 1 1 N/AID3 No juice < 12 mo 1 1 N/A 1 1 N/AAverage Rating Per CC Type 2.73 2.73 N/A 2.73 2.73 N/ANutritionNA1 Limit oils/fats 2 2 N/A 2 2 N/ANA2 Low fat meat/proteins 3 3 N/A 3 3 N/ANA3 Low fat milk equivalents 3 3 N/A 3 3 N/ANA4 Whole milk 1-2 y/o 2 2 N/A 2 2 N/ANA5 Low fat milk > 2 y/o 2 2 N/A 4 4 N/ANB1 Whole grains 3 3 N/A 3 3 N/ANB2 Variety of vegetables 3 3 N/A 3 3 N/ANB3 Variety of whole fruit 3 3 N/A 3 3 N/ANC1 100% juice 4 4 N/A 4 4 N/ANC2 Juice only @ meals 2 2 N/A 2 2 N/ANC3 Juice 4-6 oz. 1-6 y/o 3 3 N/A 3 3 N/ANC4 Juice 8-12 oz. 7+ y/o 3 3 N/A 3 3 N/AND1 Make water available 4 4 N/A 4 4 N/ANE1 Teach portion sizes 2 2 N/A 2 2 N/ANE2 Eat with children 2 2 N/A 2 2 N/ANF1 Appropriate servings 4 4 N/A 4 4 N/ANF2 Healthy seconds 3 3 N/A 3 3 N/ANG1 Limit salt 2 2 N/A 2 2 N/ANG2 Avoid sugary foods 1 1 N/A 1 1 N/ANH1 Food no force/bribe 3 3 N/A 3 3 N/ANH2 Food no reward/punish 3 3 N/A 3 3 N/AAverage Rating Per CC Type 2.71 2.71 N/A 2.81 2.81 N/APhysical ActivityPA1 Space for active play 4 3 N/A 4 3 N/APA2 Training on activities 2 2 N/A 2 2 N/APA3 Write activity policies 2 2 N/A 2 2 N/APA4 Play with children 2 2 N/A 2 2 N/APA5 Don’t withhold play 2 2 N/A 2 2 N/APB1 No screen time < 2 yr 3 3 N/A 3 3 N/APB2 Screen time 30 min/wk 3 3 N/A 3 3 N/APB3 Screen time purpose 2 2 N/A 2 2 N/APB4 No TV w/meals 2 2 N/A 2 2 N/APC1 Outdoor play occasions 3 3 N/A 3 3 N/APC2 Toddler play time 2 2 N/A 2 2 N/APC3 Preschool play time 2 2 N/A 2 2 N/APD1 Structured play 2 2 N/A 2 2 N/APE1 Tummy time often 2 2 N/A 2 2 N/APE2 Limit time infant equip. 3 3 N/A 3 3 N/AAverage Rating Per CC Type 2.40 2.33 N/A 2.40 2.33 N/A
What Ratings Mean
1 Regulation contradicts the standard
2 Regulation does not mention the content of standard
3 Regulation partially meets standard
4 Regulation fully meets standard SC Page 1 of 2
2010
Improved Rating
Lowered Rating
2012
National Resource Center for Health and Safety in Child Care and Early Education - ASHW 2012 123

South CarolinaState Overall Ratings
Ratings 1 2 3 4 Ratings 1 2 3 4I - Count 4 2 12 4 I - Count 4 2 12 4N-Count 2 14 20 6 N-Count 2 12 20 8P-Count 0 20 9 1 P-Count 0 20 9 1
Understanding and Using This page
SC Page 2 of 2
Tally of Each Rating Per Topic Area 2010 Tally of Each Rating Per Topic Area 2012
On this page are two types of charts and tables based on data from the table on the previous page. The pie charts at the top show the composition of all the ratings for the state by percentage of 1, 2, 3 and 4 ratings, which affords an overall view of the state's ratings. The small table below each pie chart shows the frequency (number) of each rating of 1, 2, 3 and 4 for each topic area: I=Infant Feeding, N=Nutrition, and P=Physical Activity. The stacked bar charts show the percentage of ratings of 1- 4 for each topic area. Ratings of 1 are at the base of the columns and ratings of 4 are at the top. It is suggested that the state reviews this page for analysis of its regulations, to see where terminology is strong and to identify those areas in which terminology may be improved in its child care regulations that have implications for childhood obesity prevention. This page reports the state's ratings for each variable by child care type, so that all final ratings per child care facility type are shown.
2010 2012
1 6%
2 38%
3 44%
4 12%
SC Overall Rating Composite 2010
0%
10%
20%
30%
40%
50%
60%
70%
80%
90%
100%
Infant Feeding
Nutrition Physical Activity
SC Rating Composition Per Topic Area 2010
Series4
Series3
Series2
Series1
1 6%
2 36%
3 44%
4 14%
SC Overall Rating Composite 2012
0%
10%
20%
30%
40%
50%
60%
70%
80%
90%
100%
Infant Feeding
Nutrition Physical Activity
SC Rating Composition Per Topic Area 2012
Series4
Series3
Series2
Series1
National Resource Center for Health and Safety in Child Care and Early Education - ASHW 2012 124
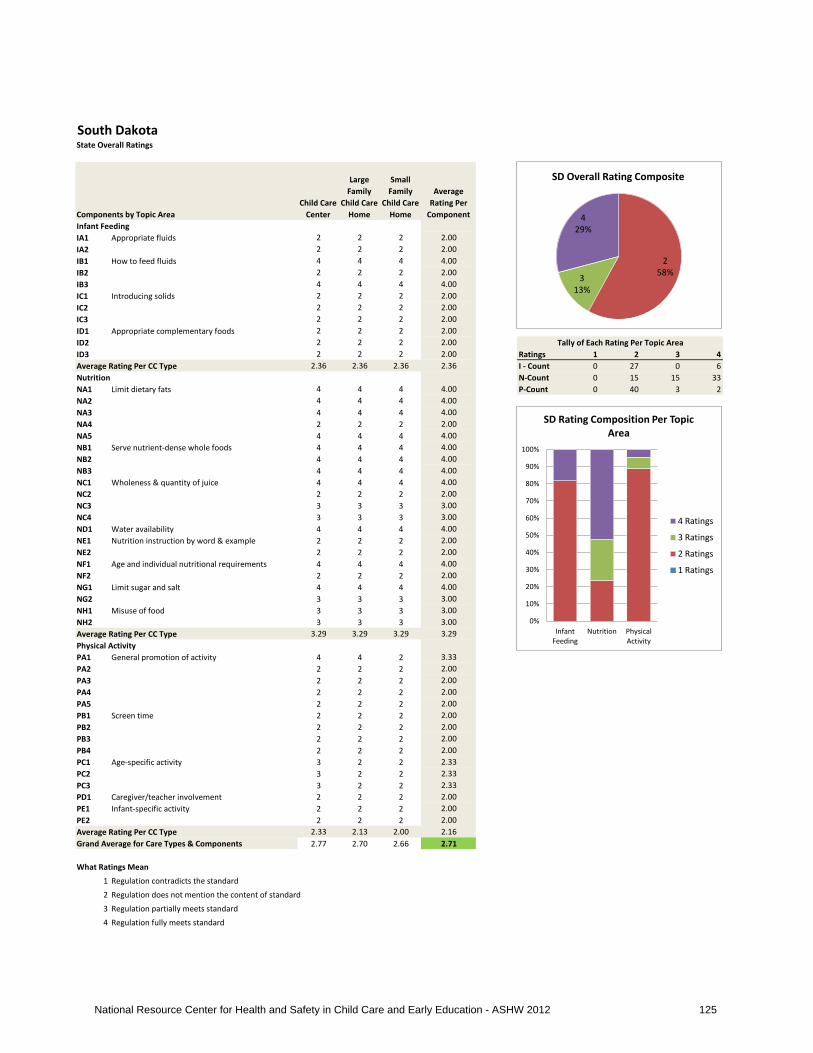
South DakotaState Overall Ratings
Components by Topic AreaChild Care
Center
Large Family
Child Care Home
Small Family
Child Care Home
Average Rating Per
ComponentInfant Feeding IA1 Appropriate fluids 2 2 2 2.00IA2 2 2 2 2.00IB1 How to feed fluids 4 4 4 4.00IB2 2 2 2 2.00IB3 4 4 4 4.00IC1 Introducing solids 2 2 2 2.00IC2 2 2 2 2.00IC3 2 2 2 2.00ID1 Appropriate complementary foods 2 2 2 2.00ID2 2 2 2 2.00ID3 2 2 2 2.00 Ratings 1 2 3 4Average Rating Per CC Type 2.36 2.36 2.36 2.36 I - Count 0 27 0 6Nutrition N-Count 0 15 15 33NA1 Limit dietary fats 4 4 4 4.00 P-Count 0 40 3 2NA2 4 4 4 4.00NA3 4 4 4 4.00NA4 2 2 2 2.00NA5 4 4 4 4.00NB1 Serve nutrient-dense whole foods 4 4 4 4.00NB2 4 4 4 4.00NB3 4 4 4 4.00NC1 Wholeness & quantity of juice 4 4 4 4.00NC2 2 2 2 2.00NC3 3 3 3 3.00NC4 3 3 3 3.00ND1 Water availability 4 4 4 4.00NE1 Nutrition instruction by word & example 2 2 2 2.00NE2 2 2 2 2.00NF1 Age and individual nutritional requirements 4 4 4 4.00NF2 2 2 2 2.00NG1 Limit sugar and salt 4 4 4 4.00NG2 3 3 3 3.00NH1 Misuse of food 3 3 3 3.00NH2 3 3 3 3.00Average Rating Per CC Type 3.29 3.29 3.29 3.29Physical ActivityPA1 General promotion of activity 4 4 2 3.33PA2 2 2 2 2.00PA3 2 2 2 2.00PA4 2 2 2 2.00PA5 2 2 2 2.00PB1 Screen time 2 2 2 2.00PB2 2 2 2 2.00PB3 2 2 2 2.00PB4 2 2 2 2.00PC1 Age-specific activity 3 2 2 2.33PC2 3 2 2 2.33PC3 3 2 2 2.33PD1 Caregiver/teacher involvement 2 2 2 2.00PE1 Infant-specific activity 2 2 2 2.00PE2 2 2 2 2.00Average Rating Per CC Type 2.33 2.13 2.00 2.16Grand Average for Care Types & Components 2.77 2.70 2.66 2.71
What Ratings Mean
1 Regulation contradicts the standard
2 Regulation does not mention the content of standard
3 Regulation partially meets standard
4 Regulation fully meets standard
Tally of Each Rating Per Topic Area
2 58% 3
13%
4 29%
SD Overall Rating Composite
0%
10%
20%
30%
40%
50%
60%
70%
80%
90%
100%
Infant Feeding
Nutrition Physical Activity
SD Rating Composition Per Topic Area
4 Ratings
3 Ratings
2 Ratings
1 Ratings
National Resource Center for Health and Safety in Child Care and Early Education - ASHW 2012 125
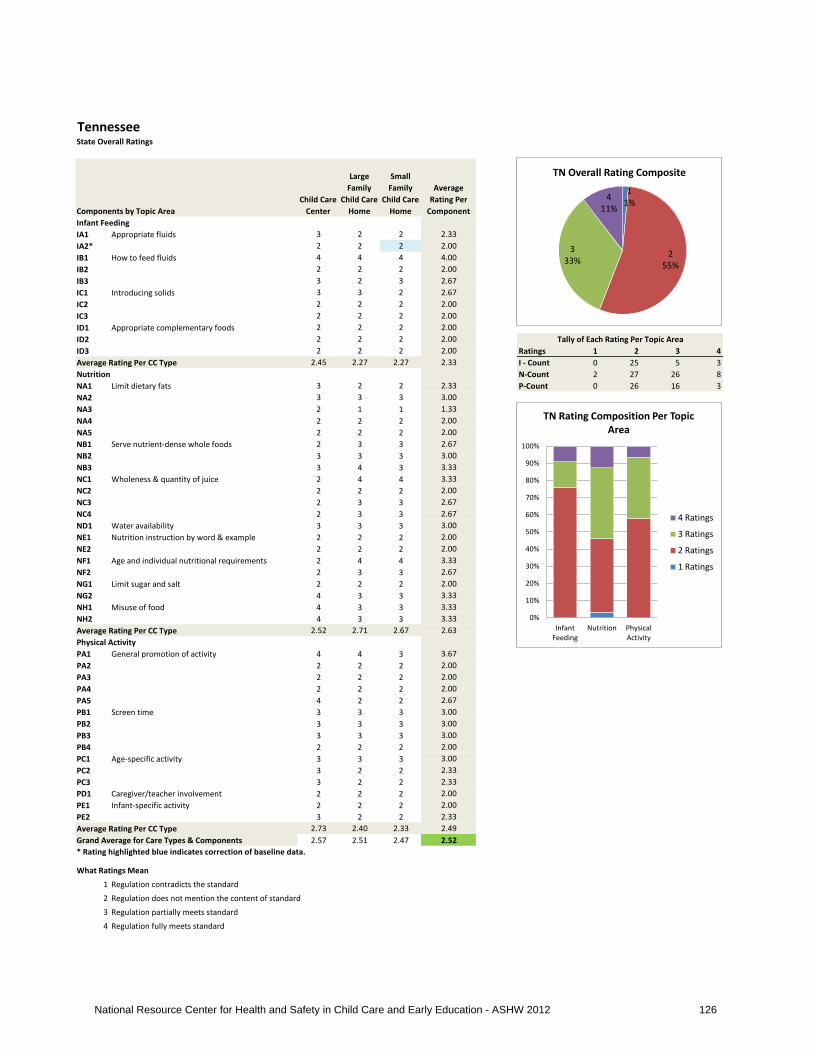
TennesseeState Overall Ratings
Components by Topic AreaChild Care
Center
Large Family
Child Care Home
Small Family
Child Care Home
Average Rating Per
ComponentInfant Feeding IA1 Appropriate fluids 3 2 2 2.33IA2* 2 2 2 2.00IB1 How to feed fluids 4 4 4 4.00IB2 2 2 2 2.00IB3 3 2 3 2.67IC1 Introducing solids 3 3 2 2.67IC2 2 2 2 2.00IC3 2 2 2 2.00ID1 Appropriate complementary foods 2 2 2 2.00ID2 2 2 2 2.00ID3 2 2 2 2.00 Ratings 1 2 3 4Average Rating Per CC Type 2.45 2.27 2.27 2.33 I - Count 0 25 5 3Nutrition N-Count 2 27 26 8NA1 Limit dietary fats 3 2 2 2.33 P-Count 0 26 16 3NA2 3 3 3 3.00NA3 2 1 1 1.33NA4 2 2 2 2.00NA5 2 2 2 2.00NB1 Serve nutrient-dense whole foods 2 3 3 2.67NB2 3 3 3 3.00NB3 3 4 3 3.33NC1 Wholeness & quantity of juice 2 4 4 3.33NC2 2 2 2 2.00NC3 2 3 3 2.67NC4 2 3 3 2.67ND1 Water availability 3 3 3 3.00NE1 Nutrition instruction by word & example 2 2 2 2.00NE2 2 2 2 2.00NF1 Age and individual nutritional requirements 2 4 4 3.33NF2 2 3 3 2.67NG1 Limit sugar and salt 2 2 2 2.00NG2 4 3 3 3.33NH1 Misuse of food 4 3 3 3.33NH2 4 3 3 3.33Average Rating Per CC Type 2.52 2.71 2.67 2.63Physical ActivityPA1 General promotion of activity 4 4 3 3.67PA2 2 2 2 2.00PA3 2 2 2 2.00PA4 2 2 2 2.00PA5 4 2 2 2.67PB1 Screen time 3 3 3 3.00PB2 3 3 3 3.00PB3 3 3 3 3.00PB4 2 2 2 2.00PC1 Age-specific activity 3 3 3 3.00PC2 3 2 2 2.33PC3 3 2 2 2.33PD1 Caregiver/teacher involvement 2 2 2 2.00PE1 Infant-specific activity 2 2 2 2.00PE2 3 2 2 2.33Average Rating Per CC Type 2.73 2.40 2.33 2.49Grand Average for Care Types & Components 2.57 2.51 2.47 2.52* Rating highlighted blue indicates correction of baseline data.
What Ratings Mean
1 Regulation contradicts the standard
2 Regulation does not mention the content of standard
3 Regulation partially meets standard
4 Regulation fully meets standard
Tally of Each Rating Per Topic Area
1 1%
2 55%
3 33%
4 11%
TN Overall Rating Composite
0%
10%
20%
30%
40%
50%
60%
70%
80%
90%
100%
Infant Feeding
Nutrition Physical Activity
TN Rating Composition Per Topic Area
4 Ratings
3 Ratings
2 Ratings
1 Ratings
National Resource Center for Health and Safety in Child Care and Early Education - ASHW 2012 126

TexasState Overall Ratings Key to Changes
Assessment Year
Components by Topic AreaChild Care
Center
Large Family
Child Care Home
Small Family
Child Care Home
Child Care Center
Large Family
Child Care Home
Small Family
Child Care Home
Infant Feeding IA1 Support breastfeeding 2 2 2 4 4 4IA2 No cow’s milk < 1yr 2 2 2 2 2 2IB1 Feed infants on cue 3 3 3 3 3 3IB2 Stop feed @ satiety 2 2 2 2 2 2IB3 Hold infant to feed 3 3 3 3 3 3IC1 Plan solid introduction 2 2 2 2 2 2IC2 Intro solids @ 4-6 mo 2 2 2 2 2 2IC3 Iron-Fort @ 4-6 mo 2 2 2 2 2 2ID1 Don’t mix formula 2 2 2 2 2 2ID2 Whole fruit 7 m-1 yr 2 2 2 2 2 2ID3 No juice < 12 mo 2 2 2 2 2 2Average Rating Per CC Type 2.18 2.18 2.18 2.36 2.36 2.36NutritionNA1 Limit oils/fats 2 2 2 2 2 2NA2 Low fat meat/proteins 3 3 3 3 3 3NA3 Low fat milk equivalents 2 2 2 2 2 2NA4 Whole milk 1-2 y/o 2 2 2 2 2 2NA5 Low fat milk > 2 y/o 2 2 2 2 2 2NB1 Whole grains 3 3 3 3 3 3NB2 Variety of vegetables 3 3 3 3 3 3NB3 Variety of whole fruit 3 3 3 3 3 3NC1 100% juice 4 4 4 4 4 4NC2 Juice only @ meals 3 3 3 3 3 3NC3 Juice 4-6 oz. 1-6 y/o 3 3 3 3 3 3NC4 Juice 8-12 oz. 7+ y/o 3 3 3 3 3 3ND1 Make water available 4 4 4 4 4 4NE1 Teach portion sizes 2 2 2 2 2 2NE2 Eat with children 2 2 2 2 2 2NF1 Appropriate servings 4 4 4 4 4 4NF2 Healthy seconds 3 3 3 3 3 3NG1 Limit salt 2 2 2 2 2 2NG2 Avoid sugary foods 2 2 2 2 2 2NH1 Food no force/bribe 3 3 3 3 3 3NH2 Food no reward/punish 4 4 4 4 4 4Average Rating Per CC Type 2.81 2.81 2.81 2.81 2.81 2.81Physical ActivityPA1 Space for active play 4 4 4 4 4 4PA2 Training on activities 2 2 2 2 2 2PA3 Write activity policies 2 2 2 2 2 2PA4 Play with children 2 2 2 2 2 2PA5 Don’t withhold play 4 4 4 4 4 4PB1 No screen time < 2 yr 3 3 3 3 3 3PB2 Screen time 30 min/wk 3 3 3 3 3 3PB3 Screen time purpose 2 2 2 2 2 2PB4 No TV w/meals 2 2 2 2 2 2PC1 Outdoor play occasions 3 3 3 3 3 3PC2 Toddler play time 3 3 3 3 3 3PC3 Preschool play time 3 3 3 3 3 3PD1 Structured play 2 2 2 2 2 2PE1 Tummy time often 4 4 4 4 4 4PE2 Limit time infant equip. 3 3 3 3 3 3Average Rating Per CC Type 2.80 2.80 2.80 2.80 2.80 2.80
What Ratings Mean
1 Regulation contradicts the standard
2 Regulation does not mention the content of standard
3 Regulation partially meets standard
4 Regulation fully meets standard TX Page 1 of 2
2010
Improved Rating
Lowered Rating
2012
National Resource Center for Health and Safety in Child Care and Early Education - ASHW 2012 127

TexasState Overall Ratings
Ratings 1 2 3 4 Ratings 1 2 3 4I - Count 0 27 6 0 I - Count 0 24 6 3N-Count 0 24 27 12 N-Count 0 24 27 12P-Count 0 18 18 9 P-Count 0 18 18 9
Understanding and Using This page
TX Page 2 of 2
Tally of Each Rating Per Topic Area 2010 Tally of Each Rating Per Topic Area 2012
On this page are two types of charts and tables based on data from the table on the previous page. The pie charts at the top show the composition of all the ratings for the state by percentage of 1, 2, 3 and 4 ratings, which affords an overall view of the state's ratings. The small table below each pie chart shows the frequency (number) of each rating of 1, 2, 3 and 4 for each topic area: I=Infant Feeding, N=Nutrition, and P=Physical Activity. The stacked bar charts show the percentage of ratings of 1- 4 for each topic area. Ratings of 1 are at the base of the columns and ratings of 4 are at the top. It is suggested that the state reviews this page for analysis of its regulations, to see where terminology is strong and to identify those areas in which terminology may be improved in its child care regulations that have implications for childhood obesity prevention. This page reports the state's ratings for each variable by child care type, so that all final ratings per child care facility type are shown.
2010 2012
1 0%
2 49%
3 36%
4 15%
TX Overall Rating Composite 2010
0%
10%
20%
30%
40%
50%
60%
70%
80%
90%
100%
Infant Feeding
Nutrition Physical Activity
TX Rating Composition Per Topic Area 2010
Series4
Series3
Series2
Series1
1 0%
2 47%
3 36%
4 17%
TX Overall Rating Composite 2012
0%
10%
20%
30%
40%
50%
60%
70%
80%
90%
100%
Infant Feeding
Nutrition Physical Activity
TX Rating Composition Per Topic Area 2012
Series4
Series3
Series2
Series1
National Resource Center for Health and Safety in Child Care and Early Education - ASHW 2012 128

UtahState Overall Ratings Key to Changes
Assessment Year
Components by Topic AreaChild Care
Center
Large Family
Child Care Home
Small Family
Child Care Home
Child Care Center
Large Family
Child Care Home
Small Family
Child Care Home
Infant Feeding IA1 Support breastfeeding 3 3 2 3 3 2IA2 No cow’s milk < 1yr 4 4 3 4 4 3IB1 Feed infants on cue 4 4 2 4 4 2IB2 Stop feed @ satiety 3 3 2 3 3 2IB3 Hold infant to feed 3 3 3 3 3 3IC1 Plan solid introduction 3 3 2 3 3 2IC2 Intro solids @ 4-6 mo 3 3 2 3 3 2IC3 Iron-Fort @ 4-6 mo 3 3 2 3 3 2ID1 Don’t mix formula 2 2 2 2 2 2ID2 Whole fruit 7 m-1 yr 1 1 2 1 1 2ID3 No juice < 12 mo 1 1 2 1 1 2Average Rating Per CC Type 2.73 2.73 2.18 2.73 2.73 2.18NutritionNA1 Limit oils/fats 2 2 2 2 2 2NA2 Low fat meat/proteins 3 3 2 3 3 2NA3 Low fat milk equivalents 3 3 2 3 3 2NA4 Whole milk 1-2 y/o 2 2 2 2 2 2NA5 Low fat milk > 2 y/o 2 2 2 4 4 2NB1 Whole grains 2 2 2 2 2 2NB2 Variety of vegetables 3 3 2 3 3 2NB3 Variety of whole fruit 3 3 2 3 3 2NC1 100% juice 4 4 2 4 4 2NC2 Juice only @ meals 3 3 2 3 3 2NC3 Juice 4-6 oz. 1-6 y/o 3 3 2 3 3 2NC4 Juice 8-12 oz. 7+ y/o 3 3 2 3 3 2ND1 Make water available 3 3 3 4 4 3NE1 Teach portion sizes 2 2 2 2 2 2NE2 Eat with children 2 2 2 2 2 2NF1 Appropriate servings 4 4 2 4 4 2NF2 Healthy seconds 3 3 2 3 3 2NG1 Limit salt 2 2 2 2 2 2NG2 Avoid sugary foods 1 1 2 1 1 2NH1 Food no force/bribe 3 3 3 3 3 3NH2 Food no reward/punish 3 3 3 3 3 3Average Rating Per CC Type 2.67 2.67 2.14 2.81 2.81 2.14Physical ActivityPA1 Space for active play 4 2 2 4 2 2PA2 Training on activities 2 2 2 2 2 2PA3 Write activity policies 2 2 2 2 2 2PA4 Play with children 2 2 2 2 2 2PA5 Don’t withhold play 2 2 2 2 2 2PB1 No screen time < 2 yr 2 2 2 2 2 2PB2 Screen time 30 min/wk 2 2 2 2 2 2PB3 Screen time purpose 2 2 2 2 2 2PB4 No TV w/meals 2 2 2 2 2 2PC1 Outdoor play occasions 3 2 2 3 2 2PC2 Toddler play time 2 2 3 2 2 3PC3 Preschool play time 2 2 2 2 2 2PD1 Structured play 2 2 2 2 2 2PE1 Tummy time often 2 2 2 2 2 2PE2 Limit time infant equip. 3 2 2 3 2 2Average Rating Per CC Type 2.27 2.00 2.07 2.27 2.00 2.07
What Ratings Mean
1 Regulation contradicts the standard
2 Regulation does not mention the content of standard
3 Regulation partially meets standard
4 Regulation fully meets standard UT Page 1 of 2
2010
Improved Rating
Lowered Rating
2012
National Resource Center for Health and Safety in Child Care and Early Education - ASHW 2012 129

UtahState Overall Ratings
Ratings 1 2 3 4 Ratings 1 2 3 4I - Count 4 11 14 4 I - Count 4 11 14 4N-Count 2 32 25 4 N-Count 2 30 23 8P-Count 0 41 3 1 P-Count 0 41 3 1
Understanding and Using This page
UT Page 2 of 2
Tally of Each Rating Per Topic Area 2010 Tally of Each Rating Per Topic Area 2012
On this page are two types of charts and tables based on data from the table on the previous page. The pie charts at the top show the composition of all the ratings for the state by percentage of 1, 2, 3 and 4 ratings, which affords an overall view of the state's ratings. The small table below each pie chart shows the frequency (number) of each rating of 1, 2, 3 and 4 for each topic area: I=Infant Feeding, N=Nutrition, and P=Physical Activity. The stacked bar charts show the percentage of ratings of 1- 4 for each topic area. Ratings of 1 are at the base of the columns and ratings of 4 are at the top. It is suggested that the state reviews this page for analysis of its regulations, to see where terminology is strong and to identify those areas in which terminology may be improved in its child care regulations that have implications for childhood obesity prevention. This page reports the state's ratings for each variable by child care type, so that all final ratings per child care facility type are shown.
2010 2012
1 4%
2 60%
3 30%
4 6%
UT Overall Rating Composite 2010
0%
10%
20%
30%
40%
50%
60%
70%
80%
90%
100%
Infant Feeding
Nutrition Physical Activity
UT Rating Composition Per Topic Area 2010
Series4
Series3
Series2
Series1
1 4%
2 58%
3 28%
4 9%
UT Overall Rating Composite 2012
0%
10%
20%
30%
40%
50%
60%
70%
80%
90%
100%
Infant Feeding
Nutrition Physical Activity
UT Rating Composition Per Topic Area 2012
Series4
Series3
Series2
Series1
National Resource Center for Health and Safety in Child Care and Early Education - ASHW 2012 130

VermontState Overall Ratings
Components by Topic AreaChild Care
Center
Large Family
Child Care Home
Small Family
Child Care Home
Average Rating Per
ComponentInfant Feeding IA1 Appropriate fluids 4 4 4 4.00IA2 3 3 3 3.00IB1 How to feed fluids 4 4 4 4.00IB2 2 2 2 2.00IB3 3 3 3 3.00IC1 Introducing solids 2 2 2 2.00IC2 3 2 2 2.33IC3 2 2 2 2.00ID1 Appropriate complementary foods 2 2 2 2.00ID2 2 2 2 2.00ID3 3 2 2 2.33 Ratings 1 2 3 4Average Rating Per CC Type 2.73 2.55 2.55 2.61 I - Count 0 19 8 6Nutrition N-Count 0 49 13 1NA1 Limit dietary fats 2 2 2 2.00 P-Count 0 26 12 7NA2 2 2 2 2.00NA3 2 2 2 2.00NA4 2 2 2 2.00NA5 2 2 2 2.00NB1 Serve nutrient-dense whole foods 2 2 2 2.00NB2 2 2 2 2.00NB3 3 3 3 3.00NC1 Wholeness & quantity of juice 2 2 2 2.00NC2 2 2 2 2.00NC3 2 2 2 2.00NC4 2 2 2 2.00ND1 Water availability 3 3 3 3.00NE1 Nutrition instruction by word & example 2 2 2 2.00NE2 2 2 2 2.00NF1 Age and individual nutritional requirements 2 2 2 2.00NF2 2 2 2 2.00NG1 Limit sugar and salt 2 2 4 2.67NG2 2 2 3 2.33NH1 Misuse of food 3 3 3 3.00NH2 3 3 3 3.00Average Rating Per CC Type 2.19 2.19 2.33 2.24Physical ActivityPA1 General promotion of activity 4 2 3 3.00PA2 2 2 2 2.00PA3 4 4 4 4.00PA4 2 2 2 2.00PA5 2 2 2 2.00PB1 Screen time 3 3 3 3.00PB2 3 3 3 3.00PB3 4 4 4 4.00PB4 2 2 2 2.00PC1 Age-specific activity 3 2 3 2.67PC2 3 2 2 2.33PC3 3 2 2 2.33PD1 Caregiver/teacher involvement 2 2 2 2.00PE1 Infant-specific activity 2 2 2 2.00PE2 3 2 2 2.33Average Rating Per CC Type 2.80 2.40 2.53 2.58Grand Average for Care Types & Components 2.51 2.34 2.45 2.43
What Ratings Mean
1 Regulation contradicts the standard
2 Regulation does not mention the content of standard
3 Regulation partially meets standard
4 Regulation fully meets standard
Tally of Each Rating Per Topic Area
2 67%
3 23%
4 10%
VT Overall Rating Composite
0%
10%
20%
30%
40%
50%
60%
70%
80%
90%
100%
Infant Feeding
Nutrition Physical Activity
VT Rating Composition Per Topic Area
4 Ratings
3 Ratings
2 Ratings
1 Ratings
National Resource Center for Health and Safety in Child Care and Early Education - ASHW 2012 131

VirginiaState Overall Ratings Key to Changes
Assessment Year
Components by Topic AreaChild Care
Center
Large Family
Child Care Home
Small Family
Child Care Home
Child Care Center
Large Family
Child Care Home
Small Family
Child Care Home
Infant Feeding IA1 Support breastfeeding 3 3 3 3 3 3IA2 No cow’s milk < 1yr 4 4 4 4 4 4IB1 Feed infants on cue 4 4 4 4 4 4IB2 Stop feed @ satiety 2 4 4 2 4 4IB3 Hold infant to feed 3 3 3 3 3 3IC1 Plan solid introduction 3 3 3 3 3 3IC2** Intro solids @ 4-6 mo 3 4 4 3 4 4IC3 Iron-Fort @ 4-6 mo 3 3 3 3 3 3ID1 Don’t mix formula 2 2 2 2 2 2ID2 Whole fruit 7 m-1 yr 1 1 1 1 1 1ID3 No juice < 12 mo 1 1 1 1 1 1Average Rating Per CC Type 2.64 2.91 2.91 2.64 2.91 2.91NutritionNA1 Limit oils/fats 2 2 2 2 2 2NA2 Low fat meat/proteins 3 3 3 3 3 3NA3 Low fat milk equivalents 3 3 3 3 3 3NA4 Whole milk 1-2 y/o 2 4 4 2 4 4NA5 Low fat milk > 2 y/o 2 2 2 4 4 4NB1 Whole grains 3 3 3 3 3 3NB2 Variety of vegetables 3 3 3 3 3 3NB3 Variety of whole fruit 3 3 3 3 3 3NC1 100% juice 4 4 4 4 4 4NC2 Juice only @ meals 2 2 2 2 2 2NC3 Juice 4-6 oz. 1-6 y/o 3 3 3 3 3 3NC4 Juice 8-12 oz. 7+ y/o 3 3 3 3 3 3ND1 Make water available 4 3 3 4 4 4NE1 Teach portion sizes 3 2 2 3 2 2NE2 Eat with children 2 2 2 2 2 2NF1 Appropriate servings 4 4 4 4 4 4NF2 Healthy seconds 3 3 3 3 3 3NG1 Limit salt 2 2 2 2 2 2NG2 Avoid sugary foods 1 1 1 1 1 1NH1 Food no force/bribe 3 3 3 3 3 3NH2 Food no reward/punish 3 3 3 3 3 3Average Rating Per CC Type 2.76 2.76 2.76 2.86 2.90 2.90Physical ActivityPA1 Space for active play 4 4 4 4 4 4PA2 Training on activities 2 2 2 2 2 2PA3 Write activity policies 2 2 2 2 2 2PA4 Play with children 2 2 2 2 2 2PA5 Don’t withhold play 2 4 4 2 4 4PB1 No screen time < 2 yr 2 3 3 2 3 3PB2 Screen time 30 min/wk 2 3 3 2 3 3PB3 Screen time purpose 2 2 2 2 2 2PB4 No TV w/meals 2 2 2 2 2 2PC1 Outdoor play occasions 3 4 4 3 4 4PC2 Toddler play time 2 3 3 2 3 3PC3 Preschool play time 2 3 3 2 3 3PD1 Structured play 2 4 4 2 4 4PE1 Tummy time often 4 3 3 4 3 3PE2 Limit time infant equip. 2 3 3 2 3 3Average Rating Per CC Type 2.33 2.93 2.93 2.33 2.93 2.93
1 Regulation contradicts the standard
2 Regulation does not mention the content of standard
3 Regulation partially meets standard
4 Regulation fully meets standardVA Page 1 of 2
2010 (corrected in 2011)*
*Virginia's document regulating family child care was rated with the 2011 documents, and those ratings were added to the previoius 2010 ratings for centers.**Ratings highlighted in blue indicate corrected ratings from previous year.
2012
Improved RatingLowered Rating
National Resource Center for Health and Safety in Child Care and Early Education - ASHW 2012 132

VirginiaState Overall Ratings
Ratings 1 2 3 4 Ratings 1 2 3 4I - Count 6 4 13 10 I - Count 6 4 13 10N-Count 3 18 33 9 N-Count 3 15 31 14P-Count 0 22 13 10 P-Count 0 22 13 10
Understanding and Using This page
VA Page 2 of 2
Tally of Each Rating Per Topic Area 2012
On this page are two types of charts and tables based on data from the table on the previous page. The pie charts at the top show the composition of all the ratings for the state by percentage of 1, 2, 3 and 4 ratings, which affords an overall view of the state's ratings. The small table below each pie chart shows the frequency (number) of each rating of 1, 2, 3 and 4 for each topic area: I=Infant Feeding, N=Nutrition, and P=Physical Activity. The stacked bar charts show the percentage of ratings of 1- 4 for each topic area. Ratings of 1 are at the base of the columns and ratings of 4 are at the top. It is suggested that the state reviews this page for analysis of its regulations, to see where terminology is strong and to identify those areas in which terminology may be improved in its child care regulations that have implications for childhood obesity prevention. This page reports the state's ratings for each variable by child care type, so that all final ratings per child care facility type are shown.
Tally of Each Rating Per Topic Area 2010
2010 2012
1 6%
2 31%
3 42%
4 21%
VA Overall Rating Composite 2010
0%
10%
20%
30%
40%
50%
60%
70%
80%
90%
100%
Infant Feeding
Nutrition Physical Activity
VA Rating Composition Per Topic Area 2010
Series4
Series3
Series2
Series1
1 6%
2 29%
3 40%
4 24%
VA Overall Rating Composite 2012
0%
10%
20%
30%
40%
50%
60%
70%
80%
90%
100%
Infant Feeding
Nutrition Physical Activity
VA Rating Composition Per Topic Area 2012
Series4
Series3
Series2
Series1
National Resource Center for Health and Safety in Child Care and Early Education - ASHW 2012 133
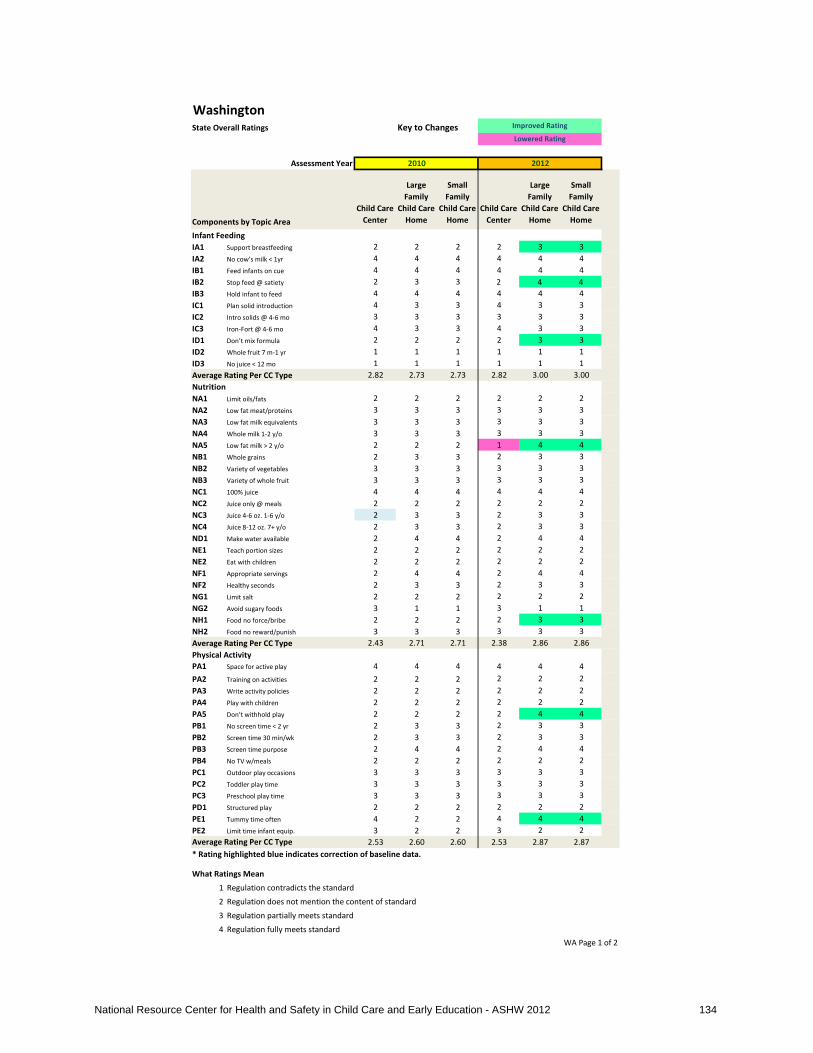
WashingtonState Overall Ratings Key to Changes
Assessment Year
Components by Topic AreaChild Care
Center
Large Family
Child Care Home
Small Family
Child Care Home
Child Care Center
Large Family
Child Care Home
Small Family
Child Care Home
Infant Feeding IA1 Support breastfeeding 2 2 2 2 3 3IA2 No cow’s milk < 1yr 4 4 4 4 4 4IB1 Feed infants on cue 4 4 4 4 4 4IB2 Stop feed @ satiety 2 3 3 2 4 4IB3 Hold infant to feed 4 4 4 4 4 4IC1 Plan solid introduction 4 3 3 4 3 3IC2 Intro solids @ 4-6 mo 3 3 3 3 3 3IC3 Iron-Fort @ 4-6 mo 4 3 3 4 3 3ID1 Don’t mix formula 2 2 2 2 3 3ID2 Whole fruit 7 m-1 yr 1 1 1 1 1 1ID3 No juice < 12 mo 1 1 1 1 1 1Average Rating Per CC Type 2.82 2.73 2.73 2.82 3.00 3.00NutritionNA1 Limit oils/fats 2 2 2 2 2 2NA2 Low fat meat/proteins 3 3 3 3 3 3NA3 Low fat milk equivalents 3 3 3 3 3 3NA4 Whole milk 1-2 y/o 3 3 3 3 3 3NA5 Low fat milk > 2 y/o 2 2 2 1 4 4NB1 Whole grains 2 3 3 2 3 3NB2 Variety of vegetables 3 3 3 3 3 3NB3 Variety of whole fruit 3 3 3 3 3 3NC1 100% juice 4 4 4 4 4 4NC2 Juice only @ meals 2 2 2 2 2 2NC3 Juice 4-6 oz. 1-6 y/o 2 3 3 2 3 3NC4 Juice 8-12 oz. 7+ y/o 2 3 3 2 3 3ND1 Make water available 2 4 4 2 4 4NE1 Teach portion sizes 2 2 2 2 2 2NE2 Eat with children 2 2 2 2 2 2NF1 Appropriate servings 2 4 4 2 4 4NF2 Healthy seconds 2 3 3 2 3 3NG1 Limit salt 2 2 2 2 2 2NG2 Avoid sugary foods 3 1 1 3 1 1NH1 Food no force/bribe 2 2 2 2 3 3NH2 Food no reward/punish 3 3 3 3 3 3Average Rating Per CC Type 2.43 2.71 2.71 2.38 2.86 2.86Physical ActivityPA1 Space for active play 4 4 4 4 4 4PA2 Training on activities 2 2 2 2 2 2PA3 Write activity policies 2 2 2 2 2 2PA4 Play with children 2 2 2 2 2 2PA5 Don’t withhold play 2 2 2 2 4 4PB1 No screen time < 2 yr 2 3 3 2 3 3PB2 Screen time 30 min/wk 2 3 3 2 3 3PB3 Screen time purpose 2 4 4 2 4 4PB4 No TV w/meals 2 2 2 2 2 2PC1 Outdoor play occasions 3 3 3 3 3 3PC2 Toddler play time 3 3 3 3 3 3PC3 Preschool play time 3 3 3 3 3 3PD1 Structured play 2 2 2 2 2 2PE1 Tummy time often 4 2 2 4 4 4PE2 Limit time infant equip. 3 2 2 3 2 2Average Rating Per CC Type 2.53 2.60 2.60 2.53 2.87 2.87* Rating highlighted blue indicates correction of baseline data.
What Ratings Mean
1 Regulation contradicts the standard
2 Regulation does not mention the content of standard
3 Regulation partially meets standard
4 Regulation fully meets standardWA Page 1 of 2
2010
Improved Rating
Lowered Rating
2012
National Resource Center for Health and Safety in Child Care and Early Education - ASHW 2012 134

WashingtonState Overall Ratings
Ratings 1 2 3 4 Ratings 1 2 3 4I - Count 6 7 9 11 I - Count 6 3 11 13N-Count 2 27 27 7 N-Count 3 22 29 9P-Count 0 25 14 6 P-Count 0 21 14 10
Understanding and Using This page
WA Page 2 of 2
Tally of Each Rating Per Topic Area 2010 Tally of Each Rating Per Topic Area 2012
On this page are two types of charts and tables based on data from the table on the previous page. The pie charts at the top show the composition of all the ratings for the state by percentage of 1, 2, 3 and 4 ratings, which affords an overall view of the state's ratings. The small table below each pie chart shows the frequency (number) of each rating of 1, 2, 3 and 4 for each topic area: I=Infant Feeding, N=Nutrition, and P=Physical Activity. The stacked bar charts show the percentage of ratings of 1- 4 for each topic area. Ratings of 1 are at the base of the columns and ratings of 4 are at the top. It is suggested that the state reviews this page for analysis of its regulations, to see where terminology is strong and to identify those areas in which terminology may be improved in its child care regulations that have implications for childhood obesity prevention. This page reports the state's ratings for each variable by child care type, so that all final ratings per child care facility type are shown.
2010 2012
1 6%
2 42%
3 35%
4 17%
WA Overall Rating Composite 2010
0%
10%
20%
30%
40%
50%
60%
70%
80%
90%
100%
Infant Feeding
Nutrition Physical Activity
WA Rating Composition Per Topic Area 2010
Series4
Series3
Series2
Series1
1 6%
2 33%
3 38%
4 23%
WA Overall Rating Composite 2012
0%
10%
20%
30%
40%
50%
60%
70%
80%
90%
100%
Infant Feeding
Nutrition Physical Activity
WA Rating Composition Per Topic Area 2012
Series4
Series3
Series2
Series1
National Resource Center for Health and Safety in Child Care and Early Education - ASHW 2012 135

West VirginiaState Overall Ratings Key to Changes
Assessment Year
Components by Topic AreaChild Care
Center
Large Family
Child Care Home
Small Family
Child Care Home
Child Care Center
Large Family
Child Care Home
Small Family
Child Care Home
Infant Feeding IA1 Support breastfeeding 2 2 2 2 2 2IA2 No cow’s milk < 1yr 3 3 4 3 3 4IB1 Feed infants on cue 4 2 4 4 2 4IB2 Stop feed @ satiety 3 3 3 3 3 3IB3 Hold infant to feed 3 3 3 3 3 3IC1 Plan solid introduction 4 3 3 4 3 3IC2 Intro solids @ 4-6 mo 3 3 3 3 3 3IC3 Iron-Fort @ 4-6 mo 3 3 3 3 3 3ID1 Don’t mix formula 2 2 2 2 2 2ID2 Whole fruit 7 m-1 yr 1 1 1 1 1 1ID3 No juice < 12 mo 1 1 1 1 1 1Average Rating Per CC Type 2.64 2.36 2.64 2.64 2.36 2.64NutritionNA1 Limit oils/fats 2 2 2 2 2 2NA2 Low fat meat/proteins 3 3 3 3 3 3NA3 Low fat milk equivalents 3 3 3 3 3 3NA4 Whole milk 1-2 y/o 2 2 2 2 2 2NA5 Low fat milk > 2 y/o 2 2 2 4 3 4NB1 Whole grains 3 3 3 3 3 3NB2 Variety of vegetables 3 3 3 3 3 3NB3 Variety of whole fruit 3 3 3 3 3 3NC1 100% juice 4 4 4 4 4 4NC2 Juice only @ meals 3 3 3 3 3 3NC3 Juice 4-6 oz. 1-6 y/o 3 3 3 3 3 3NC4 Juice 8-12 oz. 7+ y/o 3 3 3 3 3 3ND1 Make water available 4 2 4 4 3 4NE1 Teach portion sizes 2 2 2 2 2 2NE2 Eat with children 4 2 2 4 2 2NF1 Appropriate servings 4 4 4 4 4 4NF2 Healthy seconds 3 3 3 3 3 3NG1 Limit salt 2 4 2 2 4 2NG2 Avoid sugary foods 1 4 1 1 4 1NH1 Food no force/bribe 3 3 3 3 3 3NH2 Food no reward/punish 3 3 3 3 3 3Average Rating Per CC Type 2.86 2.90 2.76 2.95 3.00 2.86Physical ActivityPA1 Space for active play 4 4 4 4 4 4PA2 Training on activities 2 2 2 2 2 2PA3 Write activity policies 2 2 2 2 2 2PA4 Play with children 2 2 2 2 2 2PA5 Don’t withhold play 4 4 4 4 4 4PB1 No screen time < 2 yr 3 3 2 3 3 2PB2 Screen time 30 min/wk 3 3 2 3 3 2PB3 Screen time purpose 2 2 2 2 2 2PB4 No TV w/meals 2 2 2 2 2 2PC1 Outdoor play occasions 3 3 3 3 3 3PC2 Toddler play time 3 3 3 3 3 3PC3 Preschool play time 3 3 3 3 3 3PD1 Structured play 2 2 2 2 2 2PE1 Tummy time often 2 2 2 2 2 2PE2 Limit time infant equip. 2 1 2 2 1 2Average Rating Per CC Type 2.60 2.53 2.47 2.60 2.53 2.47
What Ratings Mean
1 Regulation contradicts the standard
2 Regulation does not mention the content of standard
3 Regulation partially meets standard
4 Regulation fully meets standard WV Page 1 of 2
2010
Improved Rating
Lowered Rating
2012
National Resource Center for Health and Safety in Child Care and Early Education - ASHW 2012 136

West VirginiaState Overall Ratings
Ratings 1 2 3 4 Ratings 1 2 3 4I - Count 6 7 16 4 I - Count 6 7 16 4N-Count 2 17 33 11 N-Count 2 13 35 13P-Count 1 25 13 6 P-Count 1 25 13 6
Understanding and Using This page
WV Page 2 of 2
Tally of Each Rating Per Topic Area 2010 Tally of Each Rating Per Topic Area 2012
On this page are two types of charts and tables based on data from the table on the previous page. The pie charts at the top show the composition of all the ratings for the state by percentage of 1, 2, 3 and 4 ratings, which affords an overall view of the state's ratings. The small table below each pie chart shows the frequency (number) of each rating of 1, 2, 3 and 4 for each topic area: I=Infant Feeding, N=Nutrition, and P=Physical Activity. The stacked bar charts show the percentage of ratings of 1- 4 for each topic area. Ratings of 1 are at the base of the columns and ratings of 4 are at the top. It is suggested that the state reviews this page for analysis of its regulations, to see where terminology is strong and to identify those areas in which terminology may be improved in its child care regulations that have implications for childhood obesity prevention. This page reports the state's ratings for each variable by child care type, so that all final ratings per child care facility type are shown.
2010 2012
1 6%
2 35%
3 44%
4 15%
WV Overall Rating Composite 2010
0%
10%
20%
30%
40%
50%
60%
70%
80%
90%
100%
Infant Feeding
Nutrition Physical Activity
WV Rating Composition Per Topic Area 2010
Series4
Series3
Series2
Series1
1 6%
2 32%
3 45%
4 16%
WV Overall Rating Composite 2012
0%
10%
20%
30%
40%
50%
60%
70%
80%
90%
100%
Infant Feeding
Nutrition Physical Activity
WV Rating Composition Per Topic Area 2012
Series4
Series3
Series2
Series1
National Resource Center for Health and Safety in Child Care and Early Education - ASHW 2012 137

Wisconsin
State Overall Ratings Key to Changes
Assessment Year
Components by Topic AreaChild Care
Center
Large Family
Child Care Home
Small Family
Child Care Home
Child Care Center
Large Family
Child Care Home
Small Family
Child Care Home
Infant Feeding IA1 Support breastfeeding 3 3 3 3 3 3IA2 No cow’s milk < 1yr 4 4 4 4 4 4IB1 Feed infants on cue 4 4 4 4 4 4IB2 Stop feed @ satiety 3 3 3 3 3 3IB3 Hold infant to feed 3 3 3 3 3 3IC1 Plan solid introduction 3 3 3 3 3 3IC2 Intro solids @ 4-6 mo 3 3 3 3 3 3IC3 Iron-Fort @ 4-6 mo 3 3 3 3 3 3ID1 Don’t mix formula 2 2 2 2 2 2ID2 Whole fruit 7 m-1 yr 1 1 1 1 1 1ID3 No juice < 12 mo 1 1 1 1 1 1Average Rating Per CC Type 2.73 2.73 2.73 2.73 2.73 2.73NutritionNA1 Limit oils/fats 2 2 2 2 2 2NA2 Low fat meat/proteins 3 3 3 3 3 3NA3 Low fat milk equivalents 3 3 3 3 3 3NA4 Whole milk 1-2 y/o 2 2 2 2 2 2NA5 Low fat milk > 2 y/o 2 2 2 2 4 4NB1 Whole grains 3 3 3 3 3 3NB2 Variety of vegetables 3 3 3 3 3 3NB3 Variety of whole fruit 3 3 4 3 3 4NC1 100% juice 4 4 4 4 4 4NC2 Juice only @ meals 2 2 2 2 2 2NC3 Juice 4-6 oz. 1-6 y/o 3 3 3 3 3 3NC4 Juice 8-12 oz. 7+ y/o 3 3 3 3 3 3ND1 Make water available 4 4 2 4 4 4NE1 Teach portion sizes 2 2 2 2 2 2NE2 Eat with children 2 2 2 2 2 2NF1 Appropriate servings 4 4 4 4 4 4NF2 Healthy seconds 3 3 3 3 3 3NG1 Limit salt 2 2 2 2 2 2NG2 Avoid sugary foods 1 1 1 1 1 1NH1 Food no force/bribe 3 3 3 3 3 3NH2 Food no reward/punish 3 3 3 3 3 3Average Rating Per CC Type 2.71 2.71 2.67 2.71 2.81 2.86Physical ActivityPA1 Space for active play 4 4 4 4 4 4PA2 Training on activities 2 2 2 2 2 2PA3 Write activity policies 2 2 2 2 2 2PA4 Play with children 2 2 2 2 2 2PA5 Don’t withhold play 4 4 4 4 4 4PB1 No screen time < 2 yr 3 3 3 3 3 3PB2 Screen time 30 min/wk 3 3 3 3 3 3PB3 Screen time purpose 2 2 2 2 2 2PB4 No TV w/meals 2 2 2 2 2 2PC1 Outdoor play occasions 3 3 3 3 3 3PC2 Toddler play time 3 3 3 3 3 3PC3 Preschool play time 3 3 3 3 3 3PD1 Structured play 2 2 2 2 2 2PE1 Tummy time often 4 4 4 4 4 4PE2 Limit time infant equip. 2 2 2 2 2 2Average Rating Per CC Type 2.73 2.73 2.73 2.73 2.73 2.73
What Ratings Mean
1 Regulation contradicts the standard
2 Regulation does not mention the content of standard
3 Regulation partially meets standard
4 Regulation fully meets standard WI Page 1 of 2
2010
Improved Rating
Lowered Rating
2012
National Resource Center for Health and Safety in Child Care and Early Education - ASHW 2012 138

WisconsinState Overall Ratings
Ratings 1 2 3 4 Ratings 1 2 3 4I - Count 6 3 18 6 I - Count 6 3 18 6N-Count 3 22 29 9 N-Count 3 19 29 12P-Count 0 21 15 9 P-Count 0 21 15 9
Understanding and Using This page
WI Page 2 of 2
Tally of Each Rating Per Topic Area 2010 Tally of Each Rating Per Topic Area 2012
On this page are two types of charts and tables based on data from the table on the previous page. The pie charts at the top show the composition of all the ratings for the state by percentage of 1, 2, 3 and 4 ratings, which affords an overall view of the state's ratings. The small table below each pie chart shows the frequency (number) of each rating of 1, 2, 3 and 4 for each topic area: I=Infant Feeding, N=Nutrition, and P=Physical Activity. The stacked bar charts show the percentage of ratings of 1- 4 for each topic area. Ratings of 1 are at the base of the columns and ratings of 4 are at the top. It is suggested that the state reviews this page for analysis of its regulations, to see where terminology is strong and to identify those areas in which terminology may be improved in its child care regulations that have implications for childhood obesity prevention. This page reports the state's ratings for each variable by child care type, so that all final ratings per child care facility type are shown.
2010 2012
1 6%
2 33%
3 44%
4 17%
WI Overall Rating Composite 2010
0%
10%
20%
30%
40%
50%
60%
70%
80%
90%
100%
Infant Feeding
Nutrition Physical Activity
WI Rating Composition Per Topic Area 2010
Series4
Series3
Series2
Series1
1 6%
2 30%
3 44%
4 19%
WI Overall Rating Composite 2012
0%
10%
20%
30%
40%
50%
60%
70%
80%
90%
100%
Infant Feeding
Nutrition Physical Activity
WI Rating Composition Per Topic Area 2012
Series4
Series3
Series2
Series1
National Resource Center for Health and Safety in Child Care and Early Education - ASHW 2012 139

Wyoming
State Overall Ratings Key to Changes
Assessment Year
Components by Topic AreaChild Care
Center
Large Family
Child Care Home
Small Family
Child Care Home
Child Care Center
Large Family
Child Care Home
Small Family
Child Care Home
Infant Feeding IA1 Support breastfeeding 2 2 2 2 2 2IA2 No cow’s milk < 1yr 2 2 2 2 2 2IB1 Feed infants on cue 4 4 4 4 4 4IB2 Stop feed @ satiety 2 2 2 2 2 2IB3 Hold infant to feed 2 2 2 3 3 3IC1 Plan solid introduction 3 3 3 3 3 3IC2 Intro solids @ 4-6 mo 2 2 2 2 2 2IC3 Iron-Fort @ 4-6 mo 2 2 2 2 2 2ID1 Don’t mix formula 2 2 2 2 2 2ID2 Whole fruit 7 m-1 yr 2 2 2 2 2 2ID3 No juice < 12 mo 2 2 2 2 2 2Average Rating Per CC Type 2.27 2.27 2.27 2.36 2.36 2.36NutritionNA1 Limit oils/fats 2 2 2 2 2 2NA2 Low fat meat/proteins 2 2 2 2 2 2NA3 Low fat milk equivalents 2 2 2 2 2 2NA4 Whole milk 1-2 y/o 2 2 2 2 2 2NA5 Low fat milk > 2 y/o 2 2 2 2 2 2NB1 Whole grains 2 2 2 2 2 2NB2 Variety of vegetables 2 2 2 2 2 2NB3 Variety of whole fruit 2 2 2 2 2 2NC1 100% juice 2 2 2 2 2 2NC2 Juice only @ meals 2 2 2 2 2 2NC3 Juice 4-6 oz. 1-6 y/o 2 2 2 2 2 2NC4 Juice 8-12 oz. 7+ y/o 2 2 2 2 2 2ND1 Make water available 2 2 2 2 2 2NE1 Teach portion sizes 2 2 2 3 3 3NE2 Eat with children 2 2 2 2 2 2NF1 Appropriate servings 2 2 2 2 2 2NF2 Healthy seconds 2 2 2 3 3 3NG1 Limit salt 2 2 2 2 2 2NG2 Avoid sugary foods 2 2 2 2 2 2NH1 Food no force/bribe 4 4 4 3 3 3NH2 Food no reward/punish 3 3 3 3 3 3Average Rating Per CC Type 2.14 2.14 2.14 2.19 2.19 2.19Physical ActivityPA1 Space for active play 4 4 4 4 4 4PA2 Training on activities 3 3 3 3 3 3PA3 Write activity policies 2 2 2 2 2 2PA4 Play with children 2 2 2 2 2 2PA5 Don’t withhold play 3 3 3 3 3 3PB1 No screen time < 2 yr 2 2 2 2 2 2PB2 Screen time 30 min/wk 2 2 2 2 2 2PB3 Screen time purpose 2 2 2 2 2 2PB4 No TV w/meals 2 2 2 2 2 2PC1 Outdoor play occasions 2 2 2 3 3 3PC2 Toddler play time 2 2 2 2 2 2PC3 Preschool play time 2 2 2 2 2 2PD1 Structured play 2 2 2 2 2 2PE1 Tummy time often 2 2 2 2 2 2PE2 Limit time infant equip. 3 3 3 3 3 3Average Rating Per CC Type 2.33 2.33 2.33 2.40 2.40 2.40
What Ratings Mean
1 Regulation contradicts the standard
2 Regulation does not mention the content of standard
3 Regulation partially meets standard
4 Regulation fully meets standard WY Page 1 of 2
2010
Improved Rating
Lowered Rating
2012
National Resource Center for Health and Safety in Child Care and Early Education - ASHW 2012 140

WyomingState Overall Ratings
Ratings 1 2 3 4 Ratings 1 2 3 4I - Count 0 27 3 3 I - Count 0 24 6 3N-Count 0 57 3 3 N-Count 0 51 12 0P-Count 0 33 9 3 P-Count 0 30 12 3
Understanding and Using This page
WY Page 2 of 2
Tally of Each Rating Per Topic Area 2010 Tally of Each Rating Per Topic Area 2012
On this page are two types of charts and tables based on data from the table on the previous page. The pie charts at the top show the composition of all the ratings for the state by percentage of 1, 2, 3 and 4 ratings, which affords an overall view of the state's ratings. The small table below each pie chart shows the frequency (number) of each rating of 1, 2, 3 and 4 for each topic area: I=Infant Feeding, N=Nutrition, and P=Physical Activity. The stacked bar charts show the percentage of ratings of 1- 4 for each topic area. Ratings of 1 are at the base of the columns and ratings of 4 are at the top. It is suggested that the state reviews this page for analysis of its regulations, to see where terminology is strong and to identify those areas in which terminology may be improved in its child care regulations that have implications for childhood obesity prevention. This page reports the state's ratings for each variable by child care type, so that all final ratings per child care facility type are shown.
2010 2012
1 0%
2 83%
3 11%
4 6%
WY Overall Rating Composite 2010
0%
10%
20%
30%
40%
50%
60%
70%
80%
90%
100%
Infant Feeding
Nutrition Physical Activity
WY Rating Composition Per Topic Area 2010
Series4
Series3
Series2
Series1
1 0%
2 74%
3 21%
4 4%
WY Overall Rating Composite 2012
0%
10%
20%
30%
40%
50%
60%
70%
80%
90%
100%
Infant Feeding
Nutrition Physical Activity
WY Rating Composition Per Topic Area 2012
Series4
Series3
Series2
Series1
National Resource Center for Health and Safety in Child Care and Early Education - ASHW 2012 141

Appendix G. Degree to Which States Address Variables: By State This table shows the number of variables for which the state’s best rating for any child care type was a fully met standard (rating=4), partially meeting standard (rating=3), not addressing standard (rating=2), and contradicting standard (rating=1). (Other types of child care may have scored lower, but at least one child care type earned the score.) For example, the state of Alaska:
• For 10 of the 47 variables the state met the standard • For 20 of the 47 variables the standards were partially met • For 14 of the variables there was no rule content relevant to the standards • 3 of the 47 variables were contradicted by the state’s rules
(The mode is highlighted for each state)
State # Variables Highest
Score = 4 (fully meets standard)
# Variables Highest Score = 3 (partially
meets standard)
# Variables Highest Score = 2 (standard
not addressed)
# Variables Highest Score = 1
(contradicts standard) ALABAMA 10 18 16 3 ALASKA 10 20 14 3 ARIZONA 17 19 11 0 ARKANSAS 10 21 13 3 CALIFORNIA 9 17 18 3 COLORADO 11 21 15 0 CONNECTICUT 8 16 23 0 DELAWARE 18 18 9 2 DISTRICT OF COLUMBIA 2 2 43 0 FLORIDA 14 15 16 2 GEORGIA 9 20 18 0 HAWAII 9 17 18 3 IDAHO 1 1 45 0 ILLINOIS 12 19 13 3 INDIANA 8 11 28 0 IOWA 8 19 17 3 KANSAS 5 13 28 1 KENTUCKY 4 12 31 0 LOUISIANA 8 17 17 5 MAINE 7 11 29 0 MARYLAND 10 18 16 3 MASSACHUSETTS 8 21 16 2 MICHIGAN 9 20 15 3 MINNESOTA 7 20 17 3 MISSISSIPPI 15 19 11 2 MISSOURI 5 14 28 0 MONTANA 8 18 18 3 NEBRASKA 6 16 25 0 NEVADA 3 11 31 2 NEW HAMPSHIRE 6 17 22 2 NEW JERSEY 2 19 26 0 NEW MEXICO 9 20 15 3 NEW YORK 5 8 34 0 NORTH CAROLINA 12 18 15 2 NORTH DAKOTA 10 18 16 3 OHIO 9 17 18 3 OKLAHOMA 5 17 25 0 OREGON 7 23 15 2 PENNSYLVANIA 5 8 34 0 RHODE ISLAND 11 20 16 0 SOUTH CAROLINA 7 20 17 3
National Resource Center for Health and Safety in Child Care and Early Education - ASHW 2012 142

State # Variables Highest
Score = 4 (fully meets standard)
# Variables Highest Score = 3 (partially
meets standard)
# Variables Highest Score = 2 (standard
not addressed)
# Variables Highest Score = 1
(contradicts standard) SOUTH DAKOTA 14 8 25 0 TENNESSEE 9 18 20 0 TEXAS 8 17 22 0 UTAH 7 19 21 0 VERMONT 6 15 26 0 VIRGINIA 14 20 10 3 WASHINGTON 14 21 10 2 WEST VIRGINIA 12 20 13 2 WISCONSIN 10 20 14 3 WYOMING 2 10 35 0
National Resource Center for Health and Safety in Child Care and Early Education - ASHW 2012 143

Appendix H. Ranking of All States by All Variables and by Topic Areas All Variables: 3-4 High Score (n=47 variables)
State Number Variables
High Rating = 4 Number Variables
High Rating = 3 Sum of
3 & 4 Ratings Rank**
% of Variables at Least Partially
Meeting Standards ARIZONA 17 19 36
1.5 77% DELAWARE 18 18 36 WASHINGTON 14 21 35 3 74% MISSISSIPPI 15 19 34
4.5 72% VIRGINIA 14 20 34 COLORADO 11 21 32
6.5 68% WEST VIRGINIA 12 20 32 ARKANSAS 10 21 31
9 66% ILLINOIS 12 19 31 RHODE ISLAND 11 20 31 ALASKA 10 20 30
12.5 64% NORTH CAROLINA 12 18 30 OREGON 7 23 30 WISCONSIN 10 20 30 FLORIDA 14 15 29
17 62% GEORGIA 9 20 29 MASSACHUSETTS 8 21 29 MICHIGAN 9 20 29 NEW MEXICO 9 20 29 ALABAMA 10 18 28
21 60% MARYLAND 10 18 28 NORTH DAKOTA 10 18 28 IOWA 8 19 27
24.5 57% MINNESOTA 7 20 27 SOUTH CAROLINA 7 20 27 TENNESSEE 9 18 27 CALIFORNIA 9 17 26
29 55% HAWAII 9 17 26 MONTANA 8 18 26 OHIO 9 17 26 UTAH 7 19 26 LOUISIANA 8 17 25
32.5 53% TEXAS 8 17 25 CONNECTICUT 8 16 24 34 51% NEW HAMPSHIRE 6 17 23 35 49% NEBRASKA 6 16 22
37 47% OKLAHOMA 5 17 22 SOUTH DAKOTA 14 8 22 NEW JERSEY 2 19 21
39.5 45% VERMONT 6 15 21 INDIANA 8 11 19
41.5 40% MISSOURI 5 14 19 KANSAS 5 13 18
43.5 38% MAINE 7 11 18 KENTUCKY 4 12 16 45 34% NEVADA 3 11 14 46 30% NEW YORK 5 8 13 47.5 28% PENNSYLVANIA 5 8 13 WYOMING 2 10 12 49 26% DISTRICT OF COLUMBIA 2 2 4 50 9% IDAHO 1 1 2 51 4% * Number of variables across child care types in each state receiving highest scores of fully meeting standard (rating = 4) and/or
partially meeting standard (rating = 3). The percentages were calculated by dividing the sum of 3 & 4 ratings by 47, the number of variables.
**Where two or more states had the same sum for 3 & 4 ratings (center column), an average rank was computed and assigned to those states.
National Resource Center for Health and Safety in Child Care and Early Education - ASHW 2012 144
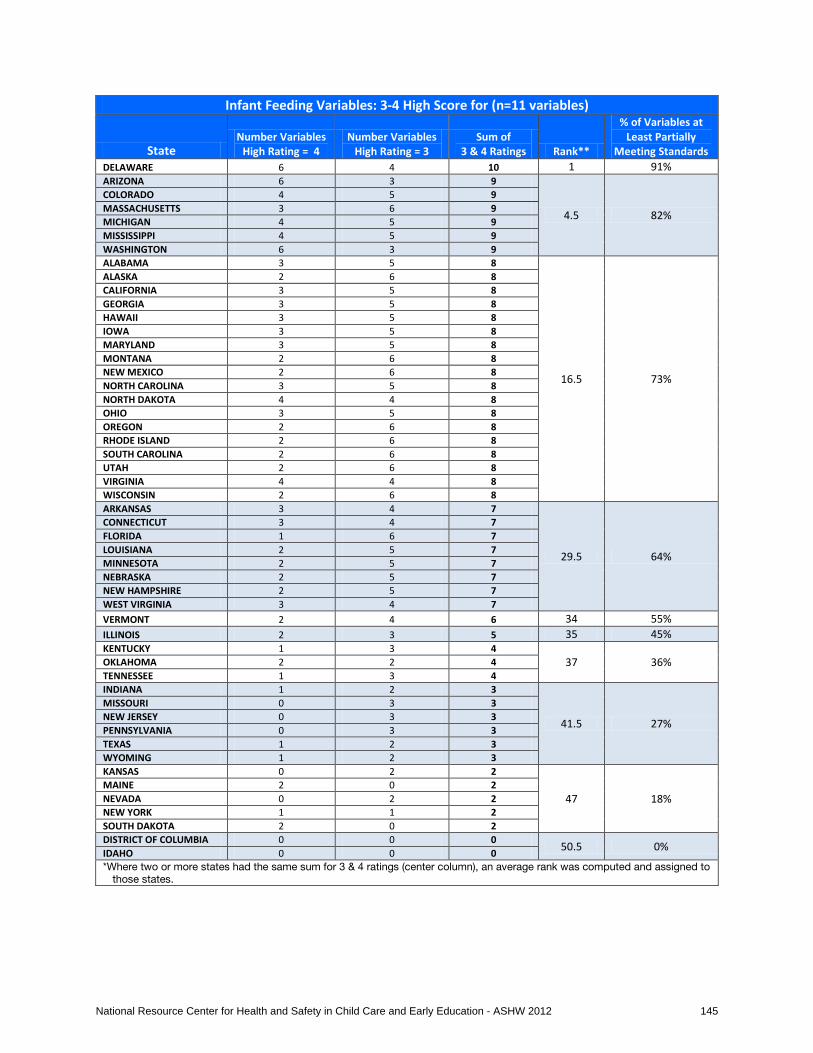
Infant Feeding Variables: 3-4 High Score for (n=11 variables)
State Number Variables
High Rating = 4 Number Variables
High Rating = 3 Sum of
3 & 4 Ratings Rank**
% of Variables at Least Partially
Meeting Standards DELAWARE 6 4 10 1 91% ARIZONA 6 3 9
4.5 82%
COLORADO 4 5 9 MASSACHUSETTS 3 6 9 MICHIGAN 4 5 9 MISSISSIPPI 4 5 9 WASHINGTON 6 3 9 ALABAMA 3 5 8
16.5 73%
ALASKA 2 6 8 CALIFORNIA 3 5 8 GEORGIA 3 5 8 HAWAII 3 5 8 IOWA 3 5 8 MARYLAND 3 5 8 MONTANA 2 6 8 NEW MEXICO 2 6 8 NORTH CAROLINA 3 5 8 NORTH DAKOTA 4 4 8 OHIO 3 5 8 OREGON 2 6 8 RHODE ISLAND 2 6 8 SOUTH CAROLINA 2 6 8 UTAH 2 6 8 VIRGINIA 4 4 8 WISCONSIN 2 6 8 ARKANSAS 3 4 7
29.5 64%
CONNECTICUT 3 4 7 FLORIDA 1 6 7 LOUISIANA 2 5 7 MINNESOTA 2 5 7 NEBRASKA 2 5 7 NEW HAMPSHIRE 2 5 7 WEST VIRGINIA 3 4 7 VERMONT 2 4 6 34 55% ILLINOIS 2 3 5 35 45% KENTUCKY 1 3 4
37 36% OKLAHOMA 2 2 4 TENNESSEE 1 3 4 INDIANA 1 2 3
41.5 27%
MISSOURI 0 3 3 NEW JERSEY 0 3 3 PENNSYLVANIA 0 3 3 TEXAS 1 2 3 WYOMING 1 2 3 KANSAS 0 2 2
47 18% MAINE 2 0 2 NEVADA 0 2 2 NEW YORK 1 1 2 SOUTH DAKOTA 2 0 2 DISTRICT OF COLUMBIA 0 0 0 50.5 0% IDAHO 0 0 0 *Where two or more states had the same sum for 3 & 4 ratings (center column), an average rank was computed and assigned to
those states.
National Resource Center for Health and Safety in Child Care and Early Education - ASHW 2012 145

Nutrition Variables: 3-4 High Score for (n=11 variables)
State Number Variables
High Rating = 4 Number Variables
High Rating = 3 Sum of
3 & 4 Ratings Rank**
% of Variables at Least Partially
Meeting Standards ARIZONA 8 10 18
1.5 86% WEST VIRGINIA 7 11 18 ILLINOIS 8 9 17
3.5 81% MISSISSIPPI 9 8 17 COLORADO 6 10 16
8.5 76%
DELAWARE 6 10 16 FLORIDA 11 5 16 OREGON 4 12 16 RHODE ISLAND 7 9 16 SOUTH DAKOTA 11 5 16 VIRGINIA 5 11 16 WASHINGTON 4 12 16 GEORGIA 5 10 15
15 71% MARYLAND 5 10 15 NEW MEXICO 5 10 15 NORTH DAKOTA 4 11 15 OHIO 5 10 15 ALABAMA 5 9 14
22.5 67%
ARKANSAS 3 11 14 HAWAII 5 9 14 IOWA 4 10 14 MASSACHUSETTS 4 10 14 NORTH CAROLINA 5 9 14 SOUTH CAROLINA 4 10 14 TENNESSEE 6 8 14 UTAH 4 10 14 WISCONSIN 5 9 14 ALASKA 4 9 13
31 62%
CALIFORNIA 5 8 13 MICHIGAN 4 9 13 MINNESOTA 4 9 13 MONTANA 5 8 13 NEBRASKA 3 10 13 TEXAS 4 9 13 CONNECTICUT 4 8 12
36.5 57% LOUISIANA 5 7 12 NEW HAMPSHIRE 3 9 12 OKLAHOMA 1 11 12 MISSOURI 3 7 10
39.5 48% NEW JERSEY 1 9 10 KANSAS 3 6 9
41.5 43% MAINE 2 7 9 PENNSYLVANIA 4 4 8 43 38% INDIANA 4 3 7
44.5 33% NEW YORK 3 4 7 KENTUCKY 2 4 6
47 29% NEVADA 2 4 6 VERMONT 1 5 6 WYOMING 0 4 4 49 19% DISTRICT OF COLUMBIA 0 0 0
50.5 0% IDAHO 0 0 0 *Where two or more states had the same sum for 3 & 4 ratings (center column), an average rank was computed and assigned to
those states.
National Resource Center for Health and Safety in Child Care and Early Education - ASHW 2012 146

Physical Activity/Screen Time Variables: 3-4 High Score for (n=15 variables)
State Number Variables
High Rating = 4 Number Variables
High Rating = 3 Sum of
3 & 4 Ratings Rank**
% of Variables at Least Partially
Meeting Standards ARKANSAS 4 6 10
2.5 67% DELAWARE 6 4 10 VIRGINIA 5 5 10 WASHINGTON 4 6 10 ALASKA 4 5 9
8 60%
ARIZONA 3 6 9 ILLINOIS 2 7 9 INDIANA 3 6 9 TENNESSEE 2 7 9 TEXAS 3 6 9 VERMONT 3 6 9 MISSISSIPPI 2 6 8
13.5 53% NEW JERSEY 1 7 8 NORTH CAROLINA 4 4 8 WISCONSIN 3 5 8 COLORADO 1 6 7
19 47%
KANSAS 2 5 7 MAINE 3 4 7 MICHIGAN 1 6 7 MINNESOTA 1 6 7 RHODE ISLAND 2 5 7 WEST VIRGINIA 2 5 7 ALABAMA 2 4 6
28 40%
FLORIDA 2 4 6 GEORGIA 1 5 6 KENTUCKY 1 5 6 LOUISIANA 1 5 6 MASSACHUSETTS 1 5 6 MISSOURI 2 4 6 NEVADA 1 5 6 NEW MEXICO 2 4 6 OKLAHOMA 2 4 6 OREGON 1 5 6 CALIFORNIA 1 4 5
37.5 33%
CONNECTICUT 1 4 5 IOWA 1 4 5 MARYLAND 2 3 5 MONTANA 1 4 5 NORTH DAKOTA 2 3 5 SOUTH CAROLINA 1 4 5 WYOMING 1 4 5 DISTRICT OF COLUMBIA 2 2 4
44.5 27%
HAWAII 1 3 4 NEW HAMPSHIRE 1 3 4 NEW YORK 1 3 4 SOUTH DAKOTA 1 3 4 UTAH 1 3 4 OHIO 1 2 3 48 20% IDAHO 1 1 2
50.5 13% NEBRASKA 1 1 2 PENNSYLVANIA 1 1 2 *Where two or more states had the same sum for 3 & 4 ratings (center column), an average rank was computed and assigned to those states.
National Resource Center for Health and Safety in Child Care and Early Education - ASHW 2012 147

Appendix I. Degree to Which States Address Variables: By Variable This table shows the number of states for which the variable’s best rating for any child care type was a fully met standard (rating=4), partially meeting standard (rating=3), not addressing standard (rating=2), and contradicting standard (rating=1). For example, the state of IA1, Support breastfeeding:
• 10 of the 51 states fully met the standard • 22 of the 51 states partially met the standard • 19 of the 51 states had no regulations relevant to the standard • 0 of the 51 states contradicted the standard
(The mode is highlighted for each variable)
Number of States With Highest Ratings of Variables Across Child Care Types Variable Description Best*=4 Best*=3 Best*=2 Best=1
IA1 Support breastfeeding 10 22 19 0 IA2 No cow’s milk < 1yr 31 2 16 2 IB1 Feed infants on cue 40 4 6 1 IB2 Stop feed @ satiety 6 28 17 0 IB3 Hold infant to feed 14 34 2 1 IC1 Plan solid introduction 6 37 8 0 IC2 Intro solids @ 4-6 mo 4 33 14 0 IC3 Iron-Fort @ 4-6 mo 1 33 17 0 ID1 Don’t mix formula 3 3 45 0 ID2 Whole fruit 7 m-1 yr 0 1 24 26 ID3 No juice < 12 mo 0 3 23 25 NA1 Limit oils/fats 2 4 45 0 NA2 Low fat meat/proteins 3 40 8 0 NA3 Low fat milk equivalents 2 37 12 0 NA4 Whole milk 1-2 y/o 2 11 38 0 NA5 Low fat milk > 2 y/o 34 1 16 0 NB1 Whole grains 4 34 13 0 NB2 Variety of vegetables 7 36 8 0 NB3 Variety of whole fruit 13 32 6 0 NC1 100% juice 39 2 9 1 NC2 Juice only @ meals 3 3 45 0 NC3 Juice 4-6 oz. 1-6 y/o 5 35 11 0 NC4 Juice 8-12 oz. 7+ y/o 4 36 11 0 ND1 Make water available 42 6 3 0 NE1 Teach portion sizes 0 8 43 0 NE2 Eat with children 1 3 47 0 NF1 Appropriate servings 41 5 5 0 NF2 Healthy seconds 2 37 10 2
National Resource Center for Health and Safety in Child Care and Early Education - ASHW 2012 148

Variable Description Best*=4 Best*=3 Best*=2 Best=1 NG1 Limit salt 5 1 45 0 NG2 Avoid sugary foods 2 14 16 19 NH1 Food no force/bribe 2 31 18 0 NH2 Food no reward/punish 9 36 6 0 PA1 Space for active play 51 0 0 0 PA2 Training on activities 0 2 49 0 PA3 Write activity policies 2 4 45 0 PA4 Play with children 1 2 48 0 PA5 Don’t withhold play 13 14 24 0 PB1 No screen time < 2 yr 4 23 24 0 PB2 Screen time 30 min/wk 0 24 27 0 PB3 Screen time purpose 7 2 42 0 PB4 No TV w/meals 0 0 51 0 PC1 Outdoor play occasions 6 44 1 0 PC2 Toddler play time 2 38 11 0 PC3 Preschool play time 0 39 12 0 PD1 Structured play 3 8 40 0 PE1 Tummy time often 8 1 42 0 PE2 Limit time infant equip. 1 24 26 0
*Other types of child care may have scored lower, but at least one child care type earned the score.
National Resource Center for Health and Safety in Child Care and Early Education - ASHW 2012 149