national report: poland -...
TRANSCRIPT

Work Package 5 – the national arena for combating poverty
National report: Poland
Wiesława Kozek, Marianna Zieleńska, Julia Kubisa Institute of Sociology, University of Warsaw
Deliverable D5.4
FP7 project ‘Combating Poverty in Europe: Re-organising Active Inclusion through
Participatory and Integrated Modes of Multilevel Governance’
Grant Agreement no. 290488
Coordinating Organisation: Carl von Ossietzky Universität Oldenburg (CETRO)
This project is funded by the European Union under the 7th
Framework Programme

2
Contents
Figures........................................................................................................................................ 3 Tables ......................................................................................................................................... 3 Abbreviations ............................................................................................................................. 4
Foreword .................................................................................................................................... 5 Introduction ................................................................................................................................ 6 1. The changing demand for minimum income since 1990 ................................................... 8
1.1. Structural drivers of increasing demand for minimum income protection ................. 8 1.1.1. The protective capacity of unemployment insurance .......................................... 8
1.1.2. The protective capacity of employment ............................................................. 12
1.1.3. The protective capacity of the family ................................................................ 17
1.2. The impact of the economic crisis since 2007 .......................................................... 21 2. Institutional and Policy Legacies in National Anti-Poverty Policy ................................. 23
2.1. The minimum income protection architecture in the mid-2000s .............................. 23
2.1.1. The development of the role of means-tested provision in the national social
protection system since 1945 ........................................................................................... 23
2.1.2. The structure of minimum income provisions for working-age people ............ 24
2.2. The extent and structure of ALMP in the mid-2000s................................................ 33
2.3. The extent and structure of other services of potential relevance to working-age
minimum income claimants in the mid-2000s ..................................................................... 35
2.3.1. General childcare provisions and specialised support services for single parents
35
2.3.2. General employment retention and advancement support and specialised
support services for the working poor ............................................................................. 37
2.4. Governance of minimum income provision and related services in the mid-2000s . 37
2.4.1. Administration and policy making..................................................................... 37
2.4.2. Delivery.............................................................................................................. 40
3. The Dynamics of Active Inclusion Reform ..................................................................... 42
3.1. The political construction of the reform agenda ....................................................... 42
3.1.1. Political debate and its key actors ...................................................................... 44
3.1.2. Influence on the reforms .................................................................................... 46
3.2. Policy legacies and feedbacks ................................................................................... 47 3.3. Institutional constraints and opportunities ................................................................ 48
3.4. The EU’s influence on national-level policy development ....................................... 51 3.4.1. Influence of the EU accession............................................................................ 51
3.4.2. Post-accession period ......................................................................................... 52
4. The National Policy Framework for Active Inclusion ..................................................... 54 4.1. The structure of minimum income rights .................................................................. 54
4.1.1. Institutionalisation.............................................................................................. 54
4.1.2. Benefit structure and generosity ........................................................................ 57
4.1.3. Benefit administration ........................................................................................ 60
4.2. The activation of minimum income claimants .......................................................... 61 4.2.1. Personalisation ................................................................................................... 61
4.2.2. Conditionality .................................................................................................... 64
4.2.3. Service provision ............................................................................................... 66
4.3. The organisation of active inclusion delivery systems ............................................. 72 4.3.1. Structure and operation of lead agencies ........................................................... 72
4.3.2. Inter-agency coordination .................................................................................. 73
4.3.3. Marketisation ..................................................................................................... 78

3
5. Assessment ....................................................................................................................... 79
5.1. A national strategy? ................................................................................................... 79 5.2. A strategy for all working-age groups? ..................................................................... 81 5.3. A multi-dimensional approach to working age poverty? .......................................... 82
Conclusion ............................................................................................................................... 84
References ................................................................................................................................ 85
Figures
Figure No. 1: Employment in Poland in 1995 (November), 2000 -2010 (IV quarter) ............ 12
Figure No. 2: Temporary employment in Poland, 1997-2011 ................................................. 14 Figure No. 3: Part-time job in Poland, 1997-2011................................................................... 14 Figure No. 4: Minimum wages as a part of the median wage in Poland ................................. 15 Figure No. 5: Minimum wage and GDP in Poland. ................................................................. 15
Figure No. 6: Main reasons for granting social assistance in years 1991-2001 ...................... 29 Figure No. 7: Number of families benefiting from social assistance in years 1991-2001 ....... 29 Figure No. 8: Share of expenditures on social assistance and other social policy tasks in total
expenditures from the central budget in years 2005-2009 (%). ............................................... 49 Figure No. 9: Local governments’ expenditures on social assistance and benefits in years
2003-2009 in millions PLN. .................................................................................................... 50 Figure No. 10: State’s and gminas’ expenditures on temporary allowance in years 2004-2011
.................................................................................................................................................. 55 Figure No. 11: Total expenditures on temporary allowance and expenditures on temporary
allowance with unemployment as an additional criterion ........................................................ 55
Figure No. 12: Number of families receiving temporary allowance in total and because of
unemployment (as a second criterion) in years 2004-2011 ..................................................... 56
Figure No. 13: Which training offers do companies and local PES choose? .......................... 68 Figure No. 14: Programmes co-financed from EU funds in the framework of which joint
projects with SASI institutions were implemented (respondents from LMI) .......................... 75 Figure No. 15: Programmes co-financed from EU funds in the framework of which joint
projects with LMI were implemented (respondents from SASI institutions). ......................... 76
Tables
Table No. 1: Unemployment in Poland in years 1995, 2000 - 2012 (IV quarter) ..................... 8
Table No. 2: Long-term unemployment rate by gender ............................................................ 8 Table No. 3: Labour Fund expenses (2005- 2011) .................................................................... 9 Table No. 4: Gross unemployment benefits and registered unemployed persons (years 1995,
2000, 2005, 2009) .................................................................................................................... 10 Table No. 5: Average unemployment benefit as % of average pay: ....................................... 11
Table No. 6: In-work at-risk-of-poverty rate by economic activity......................................... 13
Table No. 7: The share of employees with salaries below the statutory minimum and below
67% of average wage among all employees ............................................................................ 16 Table No. 8: Families with dependent children up to age the of 24 ........................................ 17 Table No. 9: Poverty in families in 2005 and 2009 ................................................................. 18 Table No. 10: Unemployment and long–term unemployment in 2008 ................................... 19 Table No. 11: Indicators of poverty risk in households without and with children in years
2010-2011 ................................................................................................................................ 20
4
Table No. 12: Consolidated public expenditures on social assistance in Poland .................... 25
Table No. 13: Types of benefits defined in social assistance act from 1990 with further
amendments ............................................................................................................................. 27 Table No. 14: Summary of the most important reforms .......................................................... 32 Table No. 15: ALMP expenses from Labour Fund ................................................................. 34
Table No. 16: Structure of ALMP spending (2005-2011 together) ......................................... 34 Table No. 17: Income criteria in the period of 2004-2012. ..................................................... 58 Table No. 18: Number of inhabitants and families per 1 social worker from local social
assistance office in 2010. ......................................................................................................... 62 Table No. 19: Number of unemployed per local PES officer in 2011. .................................... 63
Table No. 20: Main ALMP instruments delivered by local PES ............................................. 67 Table No. 21: ALMP instruments implemented in cooperation between local PES and local
SAO.......................................................................................................................................... 77
Abbreviations
Minimum Income Protection (MIP): For the purpose of this report framework, MIP refers
to cash benefits/transfers that can essentially be characterised as benefits of last resort,
with the aim to alleviate poverty or social exclusion. Eligibility to MIP is determined by
means- testing. MIP typically includes Social Assistance schemes or similar provision
with a broad scope (i.e. for all legal residents of a country), but can also include more
targeted provision for specific subgroups of the working age population (e.g. for single
parents or unemployed people). However, schemes targeting only incapacitated
working age persons are NOT within the scope of this study. Within the context of this
study, the focus should be on MIP in relation to working-age recipients. MIP can also
include the provision of means-tested benefits for working age people who are IN
WORK, including tax credits or other types of benefit paid as a top up for low wages.
Single Parents (SP): Single parents are those who live alone with their dependent children.
Dependent children are considered to be aged less than 16.
Long Term Unemployed (LTU): Persons unemployed for longer than 12 months Working Poor (WP): Workers whose equivalised household income is less than 60% of the
national median income Active Inclusion (AI): For the purpose of this report framework, AI refers to a policy that
seeks to promote the economic and social integration of poor people through Minimum
Income Protection that maintains incentives to work and gives beneficiaries access to
training and job support and enabling social support. Tripartite Commission for Social and Economic Issues (TC): The social dialogue body
operating at the central level, responsible – among other things – for negotiating
minimum wage, labour market policy, and social policy.
Polish New (PLN): Polish currency after denomination in 1995 (new Polish zloty).
Public Employment Services (PES): A term referring to the public employment offices:
local and regional (LAU I and NUTS II).
(Quasi) Guaranteed Minimum Income (GMI): introduced in a form of temporary
allowance from social assistance in 2004. Guaranteed if a person fulfils income
criterion and an additional criterion from the list defined by the law. Before in a
selective form.
State Labour Inspectorate (SLI) – state agency responsible for controlling work safety and
working conditions (Państwowa Inspekcja Pracy – PIP).

5
Foreword
Reducing poverty and social exclusion is one of the main challenges for ensuring social
cohesion in Europe. The research project COPE – Combating Poverty in Europe: Re-
organising Active Inclusion through Participatory and Integrated Modes of Multilevel
Governance’ – analyses trends in poverty and social exclusion in Europe, and examines the
dynamics of minimum income protection policies that potentially help alleviate the risk of
poverty in Europe. A particular focus is on the situation of single parents, long-term
unemployed and the working poor, who face particular risks of poverty and social exclusion.
To what extent have minimum income policies functioned as last resort social security for
these three groups, and in what sense can ‘active inclusion’ policies credited with protecting
them from poverty and social exclusion?
Co-financed by the European Commission in the 7th Framework Programme, the COPE
project unites researchers and stakeholders from six European countries, the UK, Italy,
Poland, Sweden, and Norway. Having started in February 2012, COPE runs over a three-year
period. COPE’s method is comparative – analysing developments in five European countries
(Poland, Germany, UK, Sweden and Italy). Its focus is inherently multi-level, looking in turn
at developments at European, national and local level.
The present report is part of COPE’s effort to uncover the dynamics of national level policy
reforms in the area ‘active inclusion’, namely reforms affecting national policies that specify
the adequacy of minimum income benefits, the provision of employment services, as well as
the organisation of access to social services. It focuses particularly on the three groups; single
parents, long-term unemployed persons, as well as the working poor.
The present report is complemented by national case studies covering developments in the
other four countries. It feeds into a comparative report on similarities and differences in the
development of minimum income protection across Europe, to be published later in 2013.
6
Introduction
The socialist paradigm of combating poverty in Poland was based on the concept of full
employment. It was characterised by the low diversity of wages, the broad programme of
social security and the small scope of actual social assistance. The system in such shape
collapsed after 1989 due to the mass unemployment and the limited ability of state-owned
companies to fund social infrastructure (which had occurred already in the 1980s). The new
system of combating poverty developed under the influence of market forces and new
stakeholders (private employers and liberal and conservative political parties) – however the
impact of socialist heritage on its construction remained visible.
Before 1989 the problem of poverty concerned primarily two groups: poor pensioners and
large families. Poverty was also concentrated on the rural areas rather than urban (Beskid
1999). Under the new economy poverty began to be connected mainly to long-term
unemployment. Over time the phenomenon of working poor started to emerge, but it began to
be increasingly noticed by Polish scientist only in the 2000s (Kozek et.al. 2005; Duszczyk
2010).
The first measures against poverty were undertaken already in 1990. A generous
unemployment benefit system was applied at the beginning, which was expanded to all
unemployed. Then the right to receive these benefits has been gradually restricted. Above
that, in 1990s part of the labour force was shifted from economic activity to inactivity by
large program of early retirement and invalidity pensions to unburden the system of
unemployment benefits (Inglot 2008).
A more radical fight against poverty was implemented in the beginning of the twenty-first
century, in the context of the accession to the European Union. It consisted of two
components: increasing spending on ALMP and the establishing the right to social benefits
(temporary allowances) for specific groups on the basis of thresholds and additional
qualifying criteria. The European Social Fund has been used to finance ALMP, in order to
create new jobs and trainings.
The fight against poverty in Poland has a specific nature: on the one hand, it is open to
solutions developed at the level of the European Union (or in other members states), on the
other hand it holds the belief that some traditional Polish solutions should still be used (for
example: financial assistance set on securing biological needs rather than social, in-kind
benefits, the strong participation of trade unions and Catholic Church as stakeholders,
important role of the family in providing support).
The analysis is based on a broad document analysis and 18 semi-structured expert interviews:
three interviews with Members of Parliament, three interviews with representatives of the
social partners, seven interviews with a representatives of the Ministry of Labour and Social
Affairs1, one with the representative of other ministry, three interviews with NGO’s
representatives, one with manager of a local social assistance office.
1 The overrepresentation of ministry officials is connected to the highly fragmented structure of social policy
management.

7
The study shows that the system of combating poverty in Poland is fragmented and non-
transparent. The fight against poverty is still being "constructed": new ideas are tried, and
future changes discussed. In addition, the fight against poverty has neither been a strategic
political objective for at least a decade nor a theme for a serious public debate.
In the existing system, the unemployed can easily fall into poverty due to austerity of benefit
policy. Long-term unemployed are denied the right to unemployment benefits and are, thus,
often shifted into the social assistance system. Working poor have a limited access to the
active labour market policy and to social assistance. Single parents, especially taking care of
many children, are hardly benefiting from ALMP and face problems connected to the low
level of financial support and underdeveloped childcare system.

8
1. The changing demand for minimum income since 1990
1.1. Structural drivers of increasing demand for minimum income protection
1.1.1. The protective capacity of unemployment insurance
Poland belongs to the countries which allocate relatively small part of GDP to labour market
policy. In 2008, the largest resources for this purpose (more than 3% of national income)
were allocated in Belgium. Among the countries, which allocated 2.5% - 1.5% of the GDP
were: Denmark, the Netherlands, Finland, France, Ireland, Spain, Germany, Austria, and
Portugal. Poland – together with Sweden and Italy – was placed among countries disbursing
1% - 1.5% of national income to labour market policy (Hurley 2010:4). Meanwhile, there is a
serious need for extended labour market public policy due to the high level of unemployment
(Table No. 1) and the lasting problem of long term unemployment (Table No. 2). Although
unemployment rates declined after the accession to the UE, they still remained relatively
high.
Table No. 1: Unemployment in Poland in years 1995, 2000 - 2012 (IV quarter)
Unemployment
rate
1995 2000 2005 2009 2010 2011 2012
ILO rate 13.1 16.0 16.7 8.5 8.9 8.8 9.3
Registered in
local PES
14.9 15.1 17.6 12.1 12.4 12.5 13.4
Source: Statistical Yearbook of the Republic of Poland 1996, Table 3(189), and 2(206),Statistical Yearbook of
the Republic of Poland.2006, Table 18 (180), and Table 15 (177), Statistical Yearbook of the Republic of Poland.
2010, Table 18(165), 15 (162), data for ILO unemployment rate and registered unemployment rate 2010- 2012:
http://www.stat.gov.pl/gus/wskazniki_makroekon_PLK_HTML.htm
Unemployment benefits are financed from the Labour Fund, which is based on employers'
contributions (about 2.4% of the wage fund) and state subsidies. Employees do not pay
contributions for unemployment insurance from their salaries. In the years 2005-2011 the
Fund had a surplus and the government did not have to subsidize it2. In 2012 situation
changed and it became a necessity. Table No. 2: Long-term unemployment rate by gender
2000 2001 2002 2003 2004 2005 2006 2007 2008 2009 2010 2011
ILO long term
unemployment
total rate 7.4 9.2 10.9 11.0 10.3 10.3 7.8 4.9 2.4 2.5
3
3.6
Of which:
In men
population 6.0 7.8 9.8 10.4 9.6 9.3 7.1 4.6 2.0 2.2
2.9
3.3
In women
population 9.1 10.8 12.3 11.8 11.1 11.4 8.6 5.4 2.8 2.9
3.1
4.0 Source: http://www.stat.gov.pl/gus/wskazniki_makroekon_ENG_HTML.htm
2 http://www.mpips.gov.pl/praca/fundusz-pracy/zestawienie-przychodow-i-wydatkowfp-za-lata-2005-2011-i-
plan-2012/

9
Questions were raised in the interviews about the system of financing unemployment
benefits. For years trade unions have been opting for the introduction of individual
unemployment insurance, which – in their opinion – would protect better from the negative
effects of unemployment than the current system offering restricted access to relatively low
benefits (Interview 01, 012).Yet, this idea has not been accepted by any government –
although it was rooted in the Polish tradition of labour insurance (Inglot 2008). Whereas,
employers emphasize that the contributions to the Labour Fund should be lower and that the
money is not managed effectively (Interview 011).The government has indeed blocked the
spending from the Labour Fund in the past two years, under the banner of the need to
rationalize expenditure and cut public deficit (Interview 01, 012).
Table No. 3: Labour Fund expenses (2005- 2011)
Specification 2005 2006 2007 2008 2009 2010 2011
Dynamics of
Labour Fund
expense (year
2005=100%) 100% 99% 100% 104% 187% 203% 223%
Share of
unemployment
benefits in
Labour Fund
expenses
54% 51% 41% 33% 43% 45% 39%
Source: Own calculations: http://www.mpips.gov.pl/praca/fundusz-pracy/zestawienie-przychodow-i-wydatkowfp-za-lata-2005-2011-i-plan-2012/
Unemployment benefits are granted for 6 months if the unemployment rate in a given local
administrative unit (poviat, LAU 2) does not exceed 150% of the average unemployment rate
in the country; for 12 months, if the unemployment rate exceeds 150% of the average
unemployment rate in the country. Unemployment benefits are granted for 12 months also if
an unemployed person is over 50 years of age and has at least 20 years of documented work
record or has a dependent child aged up to 15 years, and his or her spouse is also unemployed
and has no right to benefits. Eligibility is also dependent on the documented work record: at
least 365 days of employment in the last 18 months, provided that the wage was at least equal
to minimum wage and social insurance contributions were covered by an employer.
In Poland, unemployed collect benefits for a relatively short period - especially in comparison
to countries such as Belgium, Sweden, Denmark, France, the Netherlands, Norway. It should
be considered an important background when analysing public policies aimed at combating
relatively high unemployment in Poland (Kozek 2013). There is also a visible need for
changes in benefit policy in order to take into account the flexible employment patterns in
contemporary economy.
Benefits are taken by the small part of the unemployed population. This is due to large share
of the unemployed who have insufficient work record to be granted a benefit (graduates,
people on atypical contracts) and the long-term unemployed (who lost the entitlement to
benefits). In 1990 80% of registered unemployed received benefits while in the critical year

10
of 20033 between13% and 14% (Szylko-Skoczny 2004:22), and in the end of year 2012 again
only 13%4. According to the interviews, trade unions perceive the decline of accessibility
(see Table No. 4) as a serious social issue, which should be modified (012,01).
Box 1: Unemployment benefits
Entitlement to benefits depends on:
Work record: documented 365 days of work, with all social insurance contributions covered
and at least minimum wage.
Duration: 6 months if unemployment in a given administrative unit (poviat) does not exceed
150% of the average unemployment rate in the country; 12 month if it exceeds 150% of the
average unemployment rate in the country;
Amount: Since 2010 the amount is higher for the first 3 months (PLN 717) and lower in the
following months (PLN 563)5. However, those who have worked for less than 5 years are
entitled only to 80% of the amount and those who have worked for over 20 years to 120% of
the amount.
Source: The Act on promotion of employment and labour market institutions from 2004 with amendments.
Table No. 4: Gross unemployment benefits and registered unemployed persons (years 1995, 2000, 2005, 2009)
Year Number of
registered
unemployed
(mln)
Amount of
unemployment
benefits (mln)
1995 2,628 1,34
2000 2,702 0,53
2005 2,773 0,37
2009 1,892 0,33 Source: Statistical Yearbook of the Republic of Poland, 2001 page 181, Statistical Yearbook of the Republic of Poland 2006, Table 17(179), and Table 11(209), Statistical Yearbook of the Republic of Poland 2010: Table 17(164) and Table 12 (195).
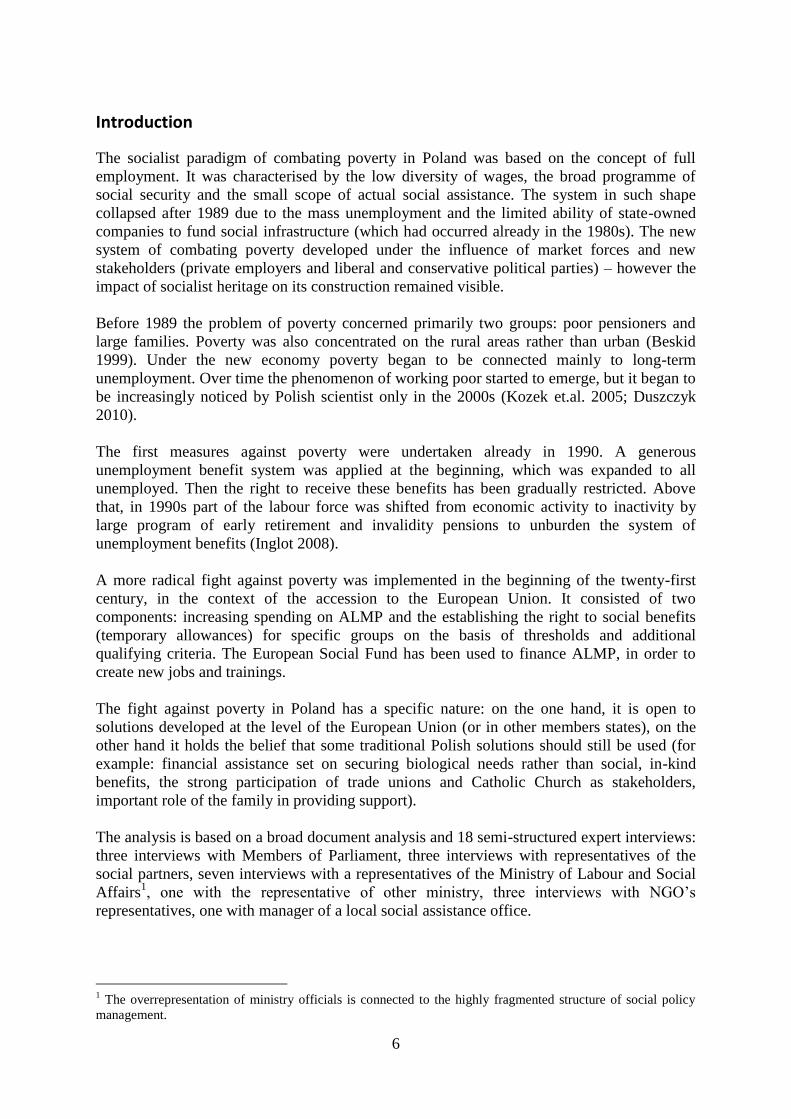
Also wage replacement rate of the unemployment benefit is currently assessed as low in
contrast to the mid-1990s. Replacement rate is calculated as the ratio of the average benefit
and the average salary. In 2009, it dropped to 18.3% (see: Table No. 5).
Generally speaking, the financial support for the unemployed is modest. Long-term
unemployed are in the most difficult position. They often become social assistance clients, or
are "pushed" into the shadow economy. According to estimates done by NGOs, up to 40% of
the unemployed work without any type of contract (Interview 016). Those people balance on
the edge of poverty, but seem not to collect social assistance benefits for the whole year to
3 Unemployment rate in Poland reached 20% in that year.
4 Data taken from : http://www.stat.gov.pl/gus/wskazniki_makroekon_PLK_HTML.htm
5 Previously the amount was constant. The new solution was introduced to provide incentive to find work.
11
avoid being caught by social workers on earning in shadow economy (Interviews 04, 03,
015).
Table No. 5: Average unemployment benefit as % of average pay:
Year Replacement rate
1995 32.4
1999 21.8
2000 21.9
2005 21.5
2009 18.3
Source: Statistical Yearbook of the Republic of Poland, 1997, Table 3(232), Statistical Yearbook of the Republic of Poland, 2010, Table 12 (195)
A major obstacle against transition from passive to active labour market policies has been the
practice of combining the registration as unemployed with work. Many of the unemployed –
also in the assessment public opinion – abuse the right to benefits by taking up short-term or
occasional employment in shadow economy. (Kozek 2013). Unemployment benefits are low
and insufficient for the survival of families, which motivates people to undertake such actions
(Interviews 01,012). Those people do not have free time to participate in ALMP measures
and use all available possibilities to avoid it (Interview 04).
However, it should be noted, that the present system of financing unemployment benefits,
which is not insurance based, should work in favour of activation (Clegg 2005 in: Bonoli
2010). The benefits are in the hands of the state and are highly conditional: everyone who
refuses to take part in ALMP or to start employment may be crossed out from the
unemployment register and lose benefits.
Box 2: Sanctions for refusing to take up employment or training
First refusal: losing the status of registered unemployed for 120 days.
Second refusal: losing the status of registered unemployed for 180 days.
Next consecutive refusal: losing the status of registered unemployed for 270 days.
Source: the Act on promotion of employment and labour market institutions from 2004 with amendments.
Another instrument of conditionality is the health insurance. Although access to free-of-
charge heath care is a constitutional right in Poland, people who are out of work have to
either cover the insurance by themselves (which is extremely difficult for people without
income) or register as unemployed in order to have it covered by the state6. This makes losing
the status of unemployed quite costly, since it result in losing health insurance coverage.
6 In some cases it is cover by social assistance.

12
1.1.2. The protective capacity of employment
Since the beginning of the transition period Poland has changed from the country with a
socialist workfare to the country that has lost jobs in the global competition. Pre-accession
crisis was associated with the increase of unemployment, post-accession period with decrease
in it. In years 2000 – 2009, the employment rate varied from slightly above 50% to
approximately 60% and had an increasing tendency. The last two years of slowdown in
economic growth resulted in a slowdown in employment (Figure No. 1). In 2011, the total
employment rate equalled 59.7%: 66.3% for males and 53.1% females. It is generally belied
that the level of employment is too low, and that measures should be taken to increase it.
Trade unions call for implementing industrial policy aimed at protecting jobs, whereas
employers for reducing costs of work.
Figure No. 1: Employment in Poland in 1995 (November), 2000 -2010 (IV quarter)
Source: Source: Statistical Yearbook of the Republic of Poland 1998, Table 1(146), http://www.stat.gov.pl/gus/wskazniki_makroekon_ENG_HTML.htm
Our study shows there is a very strong belief among the interviewed that work protects
against poverty, and even more so against social exclusion (Interviews No. 01,02,04,07,
011,012, 013, 014). The analysis of the at-risk of poverty indicators seems to confirm at least
the first conviction. In 2010, the unemployed people were at 5 times higher risk of poverty
than the working. Atypical forms of work provide less protection than standard ones, even if
it is self-employment. Permanent contract protects against poverty much better than a
temporary contract and work on full-time basis better than part-time work (Table No. 6).
Atypical forms of employment persist and develop (Figure No. 2, Figure No. 3). Employers
express the opinion that atypical employment will increasingly be used in the future because
of the changing modes of work (into more flexible) and the need to downsize costs of
employment (Interview 011).
Basically, there are no legal forms of employment, which would not be tight to some extent
to social insurance (there is one exception). However, only employment under a contract of
employment (temporary and permanent, full-time and part-time) provides the full social
insurance coverage. Self-employed have a free choice: they can insure themselves against the

13
total amount of income but may also underwrite insurance at a minimum level, which they
often do. Civil contracts allow paying less social insurance or even any. There are no serious
statistics on this forms of employment. However, non-standard employment has been used
extensively to increase the flexibility of the work system. Unfortunately, these forms produce
less protection connected to social insurance.
Table No. 6: In-work at-risk-of-poverty rate by economic activity
2005 2006 2007 2008 2009 2010
Employed persons 13.9 12.8 11.7 11.5 11.1 11.5
Employees : : : : 6.8 7.4
Employed persons except employees
(mostly different civil contract arrangement) : : : : 27.7 26.3
Unemployed persons/ from 18 to 64 years 74.1 70.1 63.6 59.3 58.3 60.1
Of which
Males 78.5 77.8 71.1 66.4 65.4 63.9
Females 70.1 64.0 58.2 54.0 52.7 56.5
Permanent contract 6.6 5.7 5.5 5.5 5.3 6.0
Males 7.8 6.5 6.4 6.6 6.5 7.2
Females 5.3 4.7 4.4 4.2 3.9 4.6
Temporary contract 12.5 12.9 11.2 11.9 12.5 12.9
Males 14.3 15.7 13.9 13.4 12.7 11.5
Females 12.9 10.2 10.6 12.2 9.6 12.3
Full time 12.6 11.4 10.7 10.5 10.0 10.5
Part-time 23.0 22.7 19.5 19.9 19.9 20.6 Source: Eurostat 2012/ SILC.
Furthermore, temporary employment has highly increased in the last decade, resulting in the
lower work protection. Temporary contract may be terminated with a two-week notice
period, or expires with the period for which it was concluded. A very large share of
temporary contracts in total employment has many negative consequences: widespread fear
of job loss, lower wage pressure and higher workers conformism.
In contrast to the above, part-time employment has not been extensively used from the
beginning of transformation and more women than men have been working part-time. Polish
employers do not consider part-time employment as a flexible form of employment.
Involuntary part time employment has increased since 2001 up to 25%, similarly for men and
women.

14
Figure No. 2: Temporary employment in Poland, 1997-2011
Source: LFS Eurostat 2012
Figure No. 3: Part-time job in Poland, 1997-2011
Source: LFS Eurostat 2012
The protective power of standard employment is based on the minimum wage mechanism.
The level of the minimum wage has been set in Poland from 1956. Until 1990 the
government has indicated the amount of the minimum wage. From 1990 to 2003 the Minister
of Labour and Social Policy has performed this task. Since 2003, the minimum monthly wage
could be determined through negotiations in the Tripartite Commission for Socio-Economic
Issues. If social partners are not able to agree on the minimum wage in Tripartite Commission
(TC) till July 15, the government takes the decision. In this case minimum wage cannot be
less than the sum proposed by the government as a basis for negotiations in TC. The
minimum wage amount proposed by the government should take into account the increase in
prices of goods and services (inflation rate). The minimum wage as a percentage of the
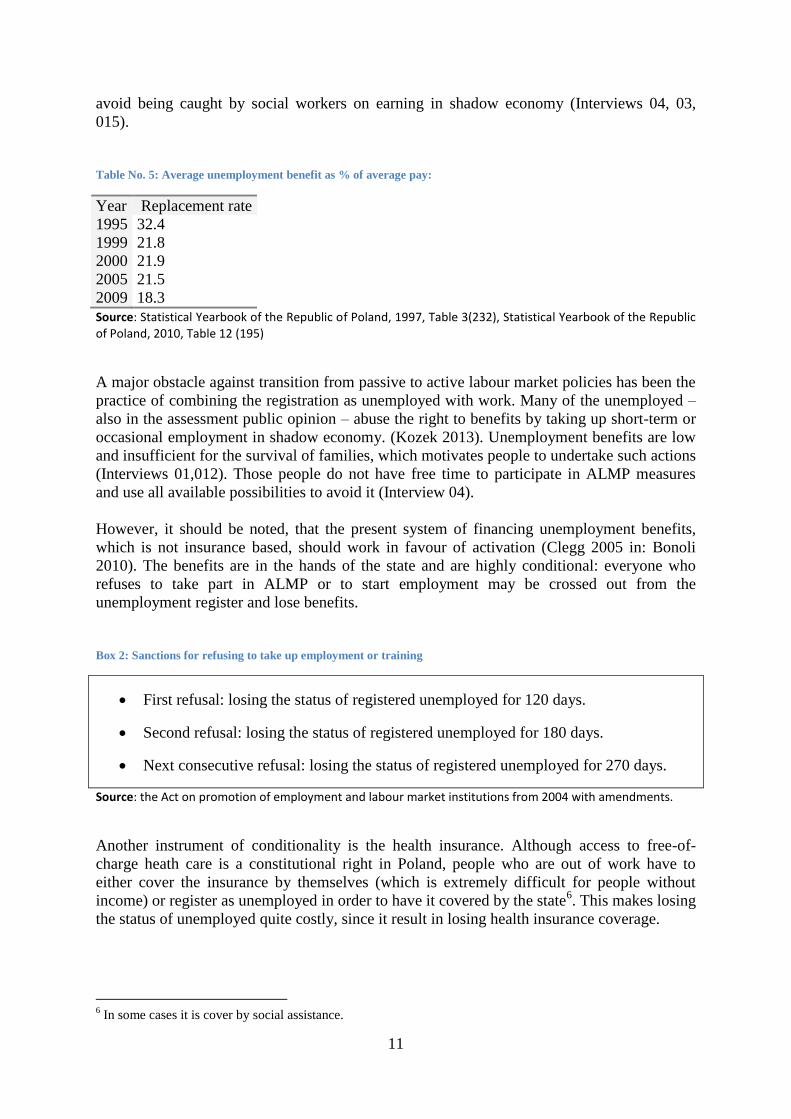
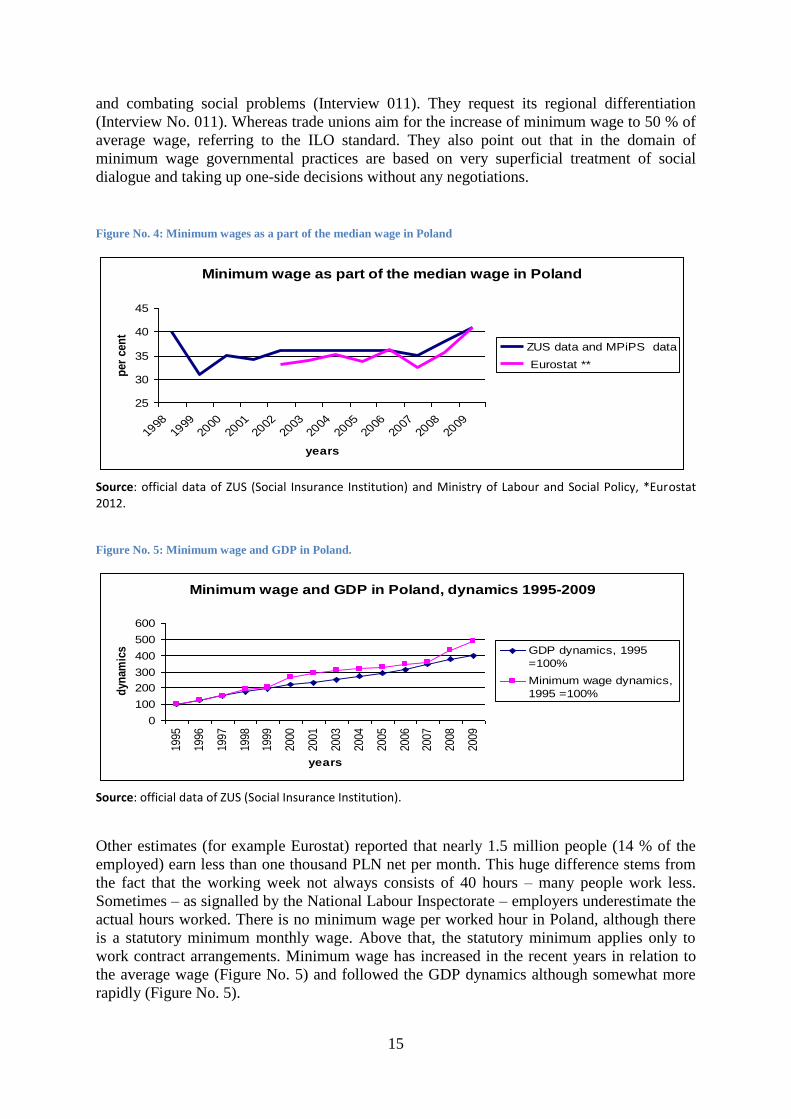
average wage in the years 1998 - 2009 ranged from 31% to 40%.
The minimum wage has been the subject of numerous debates, particularly in Tripartite
Commission. Employers are against using minimum wage as a tool for satisfying social needs
Temporary employment in Poland 1997-2011
0,0
5,0
10,0
15,0
20,0
25,0
30,0
1997
1998
1999
2000
2001
2002
2003
2004
2005
2006
2007
2008
2009
2010
2011
years
per
cen
t Total
Males
Females
Part - time job in Poland 1997- 2011
0,0
2,0
4,0
6,0
8,0
10,0
12,0
14,0
1997
1998
1999
2000
2001
2002
2003
2004
2005
2006
2007
2008
2009
2010
2011
years
per
cen
t Total
Males
Females
15
and combating social problems (Interview 011). They request its regional differentiation
(Interview No. 011). Whereas trade unions aim for the increase of minimum wage to 50 % of
average wage, referring to the ILO standard. They also point out that in the domain of
minimum wage governmental practices are based on very superficial treatment of social
dialogue and taking up one-side decisions without any negotiations.
Figure No. 4: Minimum wages as a part of the median wage in Poland
Source: official data of ZUS (Social Insurance Institution) and Ministry of Labour and Social Policy, *Eurostat 2012.
Figure No. 5: Minimum wage and GDP in Poland.
Source: official data of ZUS (Social Insurance Institution).
Other estimates (for example Eurostat) reported that nearly 1.5 million people (14 % of the
employed) earn less than one thousand PLN net per month. This huge difference stems from
the fact that the working week not always consists of 40 hours – many people work less.
Sometimes – as signalled by the National Labour Inspectorate – employers underestimate the
actual hours worked. There is no minimum wage per worked hour in Poland, although there
is a statutory minimum monthly wage. Above that, the statutory minimum applies only to
work contract arrangements. Minimum wage has increased in the recent years in relation to
the average wage (Figure No. 5) and followed the GDP dynamics although somewhat more
rapidly (Figure No. 5).
Minimum wage as part of the median wage in Poland
25
30
35
40
45
1998
1999
2000
2001
2002
2003
2004
2005
2006
2007
2008
2009
years
per
cen
t
ZUS data and MPiPS data
Eurostat **
Minimum wage and GDP in Poland, dynamics 1995-2009
0
100
200
300
400
500
600
1995
1996
1997
1998
1999
2000
2001
2003
2004
2005
2006
2007
2008
2009
years
dyn
amic
s GDP dynamics, 1995
=100%
Minimum wage dynamics,
1995 =100%

16
Table No. 7: The share of employees with salaries below the statutory minimum and below 67% of average wage
among all employees
Specification Total Public sector Private sector
Total Males Females Total Males Females Total Males Females
Per cent of the
employees
paid below
minimum
wage
(to 1317 PLN)
5.0 5.2 4.9 0.1 0.1 0.2 8.4 7.3 9.9
Per cent of the
employees
paid below
67% medium
wage
35.2 32.3 38.4 20.8 16.4 23.4 45.1 38.8 54.3
Source: Structure of wages and salaries by occupations in October 2010, Statistical Information and Elaborations, Warsaw 2012, CSO, Labour Division (GUS, Department of Labour, online: http://www.stat.gov.pl/cps/rde/xbcr/gus/pw_struktura_wynagr_wg_zawodow_10_2010.pdf Page 62. Caution: These figures do not include employees in companies with less than 9 employees, and those who have not worked in companies throughout the month.
Lack of affordable housing for the working poor begins to appear as a serious social problem.
NGOs report that the group of workers who cannot afford to maintain a flat and become
tenants of shelters for the homeless is increasing (Interview 013). Municipalities do not
provide housing with a modest rent, and the government does not have such a program. The
government generally supports those people who can afford the commercial mortgage.
Whereas local governments are required to provide cheap housing for the needy but they
have limited resources and many other priorities.
Avoidance and delay in payment of wages on the side of employers is a visible problem.
Complaints against irregularities in the payment for work and other financial benefits arising
from the employment relationship dominated among the complaints to the State Labour
Inspectorate (SLI) (37% of complaints) (Report 2010). SLI controls realised in 2010 showed
that 50% of the violations were a result of lack of financial means and 31% of disregard for
the law (ibid). It seems that at the moment non-payment of wages is associated with delays in
due payments between companies rather than the ill-will of employers (Interview No. 012).
The problem of working poor is not strongly present in the political debate. It is, however, a
part of the public debate related to the so called “junk jobs” (mostly civil contracts without
social insurance, bogus self-employment and job organised by temporary work agencies)
(Interview No. 015). This is a problem concerning especially the young generation. It is
estimated that 60% of young people are employed on civil contracts (Boni 2011). Above that,
the phenomenon of underemployment is also connected to in-work poverty: people, who do
not have full-time employment or work on hours have higher in-work poverty rates.
Employers believe that the working poor are the cost (by-product) of economic development,
i.e. diversity of incomes is a sign that the county is developing (Interview No. 011).
17
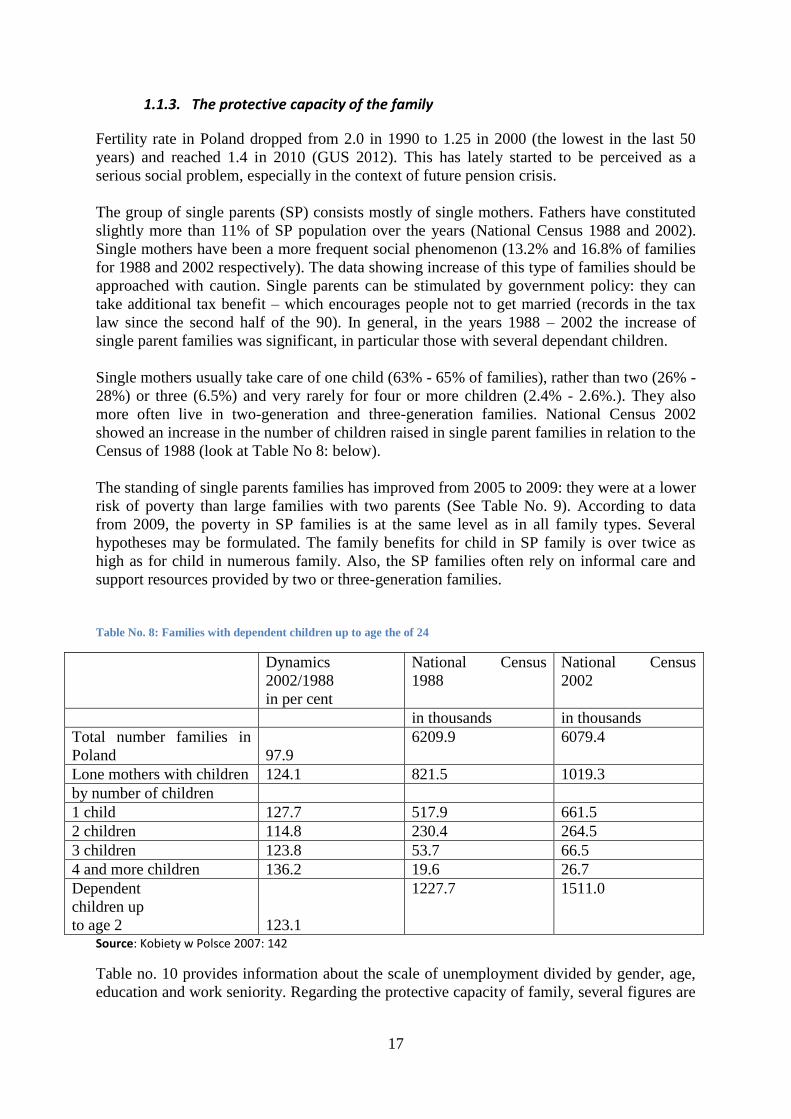
1.1.3. The protective capacity of the family
Fertility rate in Poland dropped from 2.0 in 1990 to 1.25 in 2000 (the lowest in the last 50
years) and reached 1.4 in 2010 (GUS 2012). This has lately started to be perceived as a
serious social problem, especially in the context of future pension crisis.
The group of single parents (SP) consists mostly of single mothers. Fathers have constituted
slightly more than 11% of SP population over the years (National Census 1988 and 2002).
Single mothers have been a more frequent social phenomenon (13.2% and 16.8% of families
for 1988 and 2002 respectively). The data showing increase of this type of families should be
approached with caution. Single parents can be stimulated by government policy: they can
take additional tax benefit – which encourages people not to get married (records in the tax
law since the second half of the 90). In general, in the years 1988 – 2002 the increase of
single parent families was significant, in particular those with several dependant children.
Single mothers usually take care of one child (63% - 65% of families), rather than two (26% -
28%) or three (6.5%) and very rarely for four or more children (2.4% - 2.6%.). They also
more often live in two-generation and three-generation families. National Census 2002
showed an increase in the number of children raised in single parent families in relation to the
Census of 1988 (look at Table No 8: below).
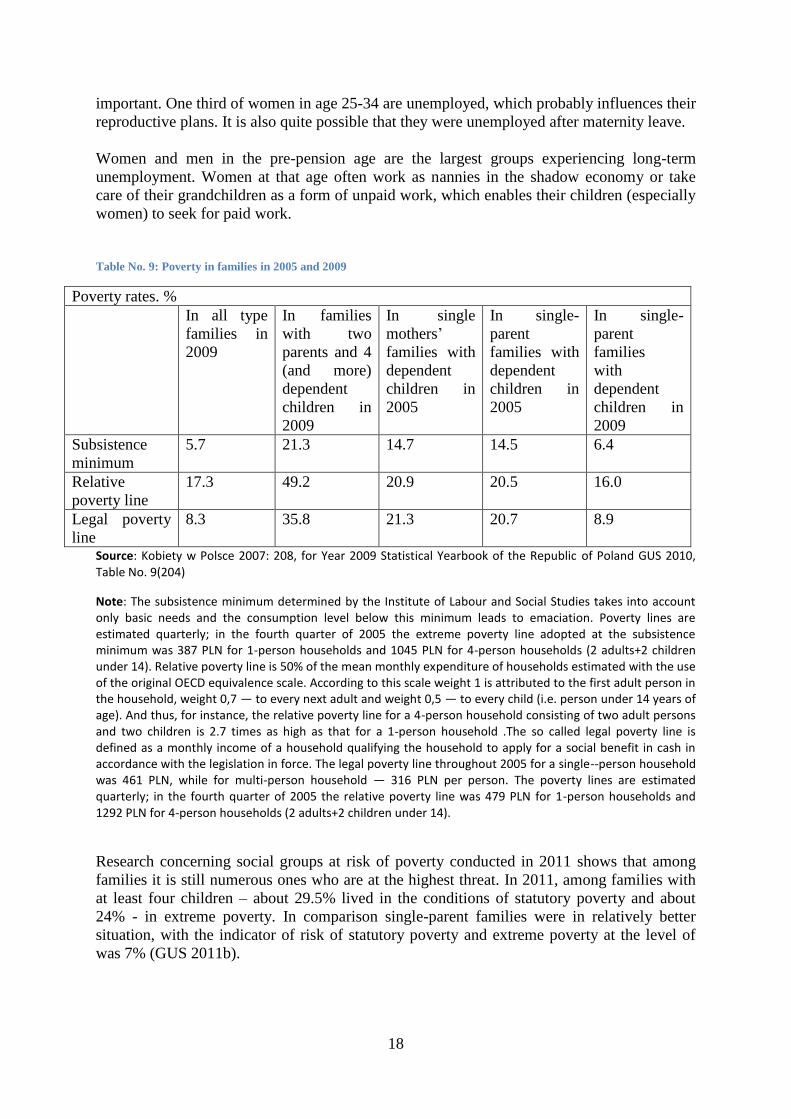
The standing of single parents families has improved from 2005 to 2009: they were at a lower
risk of poverty than large families with two parents (See Table No. 9). According to data
from 2009, the poverty in SP families is at the same level as in all family types. Several
hypotheses may be formulated. The family benefits for child in SP family is over twice as
high as for child in numerous family. Also, the SP families often rely on informal care and
support resources provided by two or three-generation families.
Table No. 8: Families with dependent children up to age the of 24
Dynamics
2002/1988
in per cent
National Census
1988
National Census
2002
in thousands in thousands
Total number families in
Poland 97.9 6209.9 6079.4
Lone mothers with children 124.1 821.5 1019.3 by number of children
1 child 127.7 517.9 661.5
2 children 114.8 230.4 264.5
3 children 123.8 53.7 66.5
4 and more children 136.2 19.6 26.7
Dependent
children up
to age 2 123.1
1227.7 1511.0
Source: Kobiety w Polsce 2007: 142
Table no. 10 provides information about the scale of unemployment divided by gender, age,
education and work seniority. Regarding the protective capacity of family, several figures are
18
important. One third of women in age 25-34 are unemployed, which probably influences their
reproductive plans. It is also quite possible that they were unemployed after maternity leave.
Women and men in the pre-pension age are the largest groups experiencing long-term
unemployment. Women at that age often work as nannies in the shadow economy or take
care of their grandchildren as a form of unpaid work, which enables their children (especially
women) to seek for paid work.
Table No. 9: Poverty in families in 2005 and 2009
Poverty rates. %
In all type
families in
2009
In families
with two
parents and 4
(and more)
dependent
children in
2009
In single
mothers’
families with
dependent
children in
2005
In single-
parent
families with
dependent
children in
2005
In single-
parent
families
with
dependent
children in
2009
Subsistence
minimum
5.7 21.3 14.7 14.5 6.4
Relative
poverty line
17.3 49.2 20.9 20.5 16.0
Legal poverty
line
8.3 35.8 21.3 20.7 8.9
Source: Kobiety w Polsce 2007: 208, for Year 2009 Statistical Yearbook of the Republic of Poland GUS 2010, Table No. 9(204)
Note: The subsistence minimum determined by the Institute of Labour and Social Studies takes into account only basic needs and the consumption level below this minimum leads to emaciation. Poverty lines are estimated quarterly; in the fourth quarter of 2005 the extreme poverty line adopted at the subsistence minimum was 387 PLN for 1-person households and 1045 PLN for 4-person households (2 adults+2 children under 14). Relative poverty line is 50% of the mean monthly expenditure of households estimated with the use of the original OECD equivalence scale. According to this scale weight 1 is attributed to the first adult person in the household, weight 0,7 — to every next adult and weight 0,5 — to every child (i.e. person under 14 years of age). And thus, for instance, the relative poverty line for a 4-person household consisting of two adult persons and two children is 2.7 times as high as that for a 1-person household .The so called legal poverty line is defined as a monthly income of a household qualifying the household to apply for a social benefit in cash in accordance with the legislation in force. The legal poverty line throughout 2005 for a single--person household was 461 PLN, while for multi-person household — 316 PLN per person. The poverty lines are estimated quarterly; in the fourth quarter of 2005 the relative poverty line was 479 PLN for 1-person households and 1292 PLN for 4-person households (2 adults+2 children under 14).
Research concerning social groups at risk of poverty conducted in 2011 shows that among
families it is still numerous ones who are at the highest threat. In 2011, among families with
at least four children – about 29.5% lived in the conditions of statutory poverty and about
24% - in extreme poverty. In comparison single-parent families were in relatively better
situation, with the indicator of risk of statutory poverty and extreme poverty at the level of
was 7% (GUS 2011b).

19
EU-SILC (GUS 2012) research in 2011 shows that 34% households “make ends meet with
difficulties or great difficulties”, whereas 30.1% “quite easily, easily, very easily”. Only
24.4% households can afford savings.
Table No. 10: Unemployment and long–term unemployment in 2008
Unemployed by months of
unemployment
(in the end of year 2008)
All unemployed
= 100 %
Unemployed
more than 12
months = 100%
Unemployed more
than 24 months
%
Specification
Total 100.0 100.0 34.0
By age 18-24 years 20.7 9.9 16.2
25-34 years 28.4 26.2 31.3
35-44 years 18.6 20.7 37.8
45-54 years 23.6 29.9 43.1
55-59 years 7.4 11.0 50.5
60-64 years 1.3 2.4 60.7
By education Higher education 8.5 5.8 23.5
Vocational secondary 22.3 21.3 32.4
General secondary 10.2 7.7 25.7
Basic occupational 28.6 30.2 35.9
Lower secondary and
less
30.4 35.0 39.2
By work
seniority
Less than 1 year 15.2 15.0 33.6
1-5 years 20.5 17.5 29.0
5-10 13.2 13.2 34.1
10-20 15.6 17.8 38.9
20-30 10.8 12.0 37.7
30 and more years 2.5 1.7 23.5
No work seniority 22.3 22.9 34.9
Female
Total
100.0 100.0 38.5
Female by
age
18-24 years 21.6 11.4 20.3
25-34 years 31.3 31.0 38.1
35-44 years 19.8 22.4 43.4
45-54 years 22.8 28.0 47.3
55-59 years 4.4 7.2 63.2
Female by
education
Higher education 10.0 6.3 24.1
Vocational secondary 25.5 24.4 36.9
General secondary 12.9 9.7 28.8
Basic occupational 24.9 27.9 43.2
Lower secondary and
less
26.8 31.8 45.8
Female by
seniority in
work
Less than 1 year 16.3 15.7 37.0
1-5 years 20.1 18.1 34.7
5-10 13.2 13.6 39.7
10-20 15.5 17.5 43.6
20-30 8.4 8.7 40.1
30 and more years 1.3 0.6 16.9
No work seniority 25.3 25.8 39.3

20
Unemployed by months of
unemployment
(in the end of year 2008)
All unemployed
= 100 %
Unemployed
more than 12
months = 100%
Unemployed more
than 24 months
%
Male
Total
100.0 100.0 28.2
Male by age 18-24 years 19.4 7.1 10.3
25-34 l years 24.6 17.5 20.1
35-44 l years 16.9 17.7 29.4
45-54 years 24.7 33.5 38.2
55-59 years 11.3 17.7 44.1
60-64 years 3.1 6.6 60.7
Male by
education
Higher education 6.5 5.1 22.1
Vocational secondary 18.2 15.7 24.3
General secondary 6.6 4.1 17.6
Basic occupational 33.5 34.3 28.8
Lower secondary and
less
35.2 40.8 32.6
Male by
work
seniority
Less than 1 year 13.7 13.7 28.2
1-5 years 21.1 16.4 21.9
5-10 13.2 12.5 26.7
10-20 15.7 18.3 32.7
20-30 13.9 17.7 35.9
30 and more years 4.0 3.7 26.2
No work seniority 18.4 17.7 27.1
Source: Ministry of Labour and Social Policy 2008.
Table No. 11: Indicators of poverty risk in households without and with children in years 2010-2011
Per cent of households at risk of poverty: expenses below
Specification Subsistence minimum Relative poverty line Legal poverty line
2010 2011 2010 2011 2010 2011
General 5.7 6.7 17.1 16.7 7.3 6.5
1 person
household
2.0 2.4 6.7 6.3 2.4 2.1
Marriage:
No children 1.6 1.7 6.1 5.5 1.0 0.8
With 1 child 1.9 2.3 7.4 6.7 1.9 1.6
With 2 children 3.7 4.8 14.7 13.8 5.4 4.7
With 3 children 9.8 10.4 27.5 25.8 14.1 12.2
With 4 and
more children
24.0 24.0 43.7 47.2 34.3 29.6
Single parent 7.8 7.2 18.4 19.2 10.5 6.9 Source: Bieńkuńska 2012
The impact of family structure on protective capacity
The quality of life of the families is determined by the ability to cover their consumption
needs. The EU-SILC 2011 research provides information about financial problems of Polish

21
families that prevent them from covering their needs, which are considered as standard in
other EU countries. The research reveals that over 50% households in Poland cannot pay for
unexpected expenses of 900 PLN.
The protective capacity of family is very much influenced by its structure. In Poland still the
biggest risk of poverty is connected to the unemployed status, especially when the
unemployed person was the head of the family. Numerous families are definitely most
threatened by poverty and the increase of that risk is striking. Single-parent households are
far less at risk and the percentage of mono-parental families endangered by poverty is slightly
higher than general statistics of all social groups. The case of numerous single-parent families
is not shown in the statistics however it may be presumed that those families are at even
higher risk of poverty.
In the view of key respondents (03 and 015), the numerous families with unemployed parents
may be relatively well protected by financial and in-kind support: family allowances and
different types of additional benefits – housing, school handbooks, school meals. The family
must be active in contacts with social assistance and school administration. In case of
temporary allowances the family must be diagnosed as dysfunctional, in addition to low
income.
The criterion of family dysfunction gained social interest recently when media reveal several
cases of children taken from their families to foster families. The social assistance officials
argued that the biological parents were too poor to provide good standard of living to their
children. However the costs of placing a child in foster family are higher than family
allowances, what makes the situation paradoxical. One of the new solutions, which is very
slowly implemented, is the position of family assistant, who is to support chosen families in
everyday life (house management, home budget etc). Finding suitable people for that job has
been a challenge so far (09).
Key respondents (03, 013, 016) point out that during the last 20 years a phenomenon of
intergenerational poverty has arisen and expanded. Social assistance offices are in contact
with three generations of beneficiaries. There are also examples of children of beneficiary
families who decided to choose occupation of social workers.
Although family does not have a strong protective capacity and the second, third child
increases the risk of poverty, the system of family policy and social assistance strongly relies
on family bonds. The issue of childcare, especially for children 0-3 years old was shifted to
families, with explanation basing on traditional notion of intergenerational support. The state
used to treat the unpaid intergenerational support provided by grandmothers as a resource that
enables to cut the public childcare costs. The trend started to change recently, with more
money put to public childcare. However social assistance still seems to perceive families as
the care resources that relieve the duty of public childcare provision.
1.2. The impact of the economic crisis since 2007
The economic crisis in Europe affects to some extent Polish economy but takes rather a form
of an economic downturn. Not without significance for ability to tackle the crisis is the inflow
of EU structural funds. It is estimated that in 2004-2006 about 37% of employment growth
might have been attributed to the impact of the EU Structural Funds (Raport Końcowy,
2007). Ministry of Regional Development reported that the number of employed increased in
22
2010 to 315 thousand thanks to cohesion policy funding (Evidence‐ based conclusions,
2011).
Politicians from the main governing party "Civic Platform" were eager to state that the Polish
economy is a “green island” of success in the combat against the crisis in Europe. Now the
rhetoric has changed into justifying limiting the social spending by the crisis (Interviews No.
01, 012). A good example of this approach is freezing the Labour Fund and arguing that there
is a need to prepare for the economic crisis and rising unemployment, which may cause
growing pressure on unemployment benefits. Apart from that, the government’s disagreement
to increase thresholds entitling to benefits in the years 2009 – 2012 because of the threat of
crisis has contributed to a reduction in the number of beneficiaries.
Employers express fear of the incoming crisis and do not employ new workers (Interview No.
011). This way the crisis influenced the re-emergence of “the employers’” labour market.
Polish economy is an example of increased productivity without increasing employment.
Unemployment remains a big problem in case of persons over 50 years of age and graduates
with no experience. Those categories of job-seeking are rejected by the employers during the
crisis.

23
2. Institutional and Policy Legacies in National Anti-Poverty Policy
2.1. The minimum income protection architecture in the mid-2000s
2.1.1. The development of the role of means-tested provision in the national social protection system since 1945
Poland - like other post-communist countries - has solved the problem of poverty in a
particular way before 1989. There has not been any developed social policy, because full
employment allowed the vast majority of working to earn a minimum income, sufficient to
support oneself and eliminate poverty, although the overall living level was low at that time.
A strong thesis is also formulated that Polish welfare state is rooted in the social insurance
system (Inglot 2008). One should note that a deviation from this model in the socialist period
was the abolition of unemployment insurance due to conviction that full employment policy
was the key remedy for all.
Security systems in the socialist period consisted of three components: benefits depend on
earnings, benefits for a more egalitarian redistribution of income (e.g. family benefits, and the
minimum and maximum amount of pensions) and benefits additional to wage provided by the
employer through the official trade unions (Inglot 2008: 51).
Wages and full employment were social in nature and the prices of many articles were
subsidized (Golinowska, Topińska 2002: 13). Companies (with the exception of a marginal
private sector) formed the so-called social fund and housing capital fund, and developed an
expenditure plan based on these funds (Morecka 2003: 294). It was accompanied by a
delivery system of social services based on a developed infrastructure (such as holiday
centres, nurseries, kindergartens cultural and sport centres, collective and family housing for
employees (ibid. 295).
The maintenance of this infrastructure became too costly for factories in the 1980s but the
public continued to accept this way of meeting needs and sustained the belief that state
employers should conduct this type of activity (ibid.: 295). Although there were variations in
the availability of benefits and services, their delivery was based on individual needs - the
recipients could not refer to the legal entitlements for assistance, but their needs, if they were
in a relatively disadvantaged position, were taken into account. For example, family holidays
for low-income workers have been funded at a higher level than for those with relatively
higher earnings.
Social assistance system was viewed as complementary to the social insurance system. In
years 1944 – 1989, the ‘medical’ character of the system was sustained. Social assistance was
not an independent institution but a part of centralised departmental structure (as part of
health care system) and territorial administration. It lacked own legal basis regarding rules of
benefits dissemination as well as organizational basis for activity (Szumlicz 1989).
The heritage of the former system was not adjusted to market economy – mainly because
people without work were excluded from it. This is crucial since the main cause of poverty in
Poland has from the very beginning of transformation been unemployment and economic
inactivity, or work in the shadow economy without access to social services in the workplace
and to the social security system. The unemployed and inactive persons in difficult situations
became clients of social welfare, or beneficiaries of the insurance benefits.

24
The system before 1989 may be characterised as socialist workfare: social insurance was
linked to work; working place played the main role both in income redistribution and social
assistance. The rest of people in need of help were treated as “medicalised” cases. The system
was deeply unprepared for the poverty caused by unemployment and lack of occupational
activity, which was an effect of market intimidation.
The basic difference between free market countries and countries of real socialism was that in
the first case, the social security and welfare of citizens were provided through intervention
into consumption sphere, whereas in the second case, more emphasis was put on the primary
distribution of GDP on the production level, which was achieved by method of full
employment. The sureness of work was the basis of social security system. The state also
surcharged to the prices of basic goods and services and to the almost universal access to free
or low-fee social services with additional system of social benefits, in case of random
circumstances. Regarding the dominant role of state in setting the level of wages, there was
no need for mechanisms correcting division of income by social benefits.
The economy transformation („Balcerowicz Plan”) introduced in 1990 – 1993 based on the
view that social policy is a burden to both state and local government budget, as it generates
social and administrative expenses. In result the social state expenses were successively cut
because of restrictive fiscal and budgetary policy (Rosati 1998; Kołodko 2008). Original
frames of real socialist welfare state were kept, with high level of centralisation of social
insurances management and concentration of decision process.
2.1.2. The structure of minimum income provisions for working-age people
The functioning of social assistance was regulated immediately after the systemic change, by
the social assistance act passed in 1990 (amended numerous times later on). The obligation to
organise and maintain social assistance was prescribed to the state and local government
(gmina), which were obliged to cooperate with social organisations, religious organizations,
charity organizations, foundations and private persons and volunteers. The role of local
government in providing social assistance was a consequence of local government act (1990)
in which gminas were obliged to organise social assistance issues, including social care
homes.
Access to most of the social assistance benefits has – from the beginning of transformation -
been based on two types of criteria, which should be fulfilled simultaneously. First is criteria
of low material status. Second, additional circumstances such as orphanage, homelessness,
protection of motherhood, unemployment, physical or mental disability, long-term illness,
helplessness in care and education issues and in running household (especially in case of
single parents or numerous families), problems with social inclusion after stay in prison,
ecologic and natural catastrophe.
The social assistance act introduced entitlement to benefits: money benefits, in kind benefits
as well as social work. It gave social workers relative freedom in making discretionary
decisions concerning the amount and period of time to disburse money allowances. Money
benefits, as well as social services were designed as one of the crucial instruments of social
work with clients and their families. The debate on social assistance benefits focused more on
clients than on ways of support. The problem of proper targeting of benefits was more
discussed which seemed understandable considering the great change of the social policy
paradigm – from universalistic to selective (Tomes 1995). The effects of social assistance

25
benefits were not so closely analysed – therefore the system lacked monitoring and
evaluation. Several available money benefits of different value were usually close to the
income threshold. Especially the temporary allowance raised controversies because of its
very low level. Most stabile allowances were offered to the disabled persons and their
families. The category of working poor was not presented explicitly however as social
workers admitted, the correlation between low incomes and additional criteria was very high
(Golinowska 2002).
The period of economic transformation influenced setting the range of issues for social
assistance. During the 1990s, more and more cases were transferred to social assistance
because of “rationalisation” processes (Golinowska 2002) in the functioning of public
institutions. It effected in transferring out the persons, who were not fitting in the institutional
schedule anymore: e.g. social problems of pupils were not a part of educational system, social
and assistance problems were not covered by health care system.
In 1990’s social assistance offices were transformed and their statues changed. First of all,
their legal status changed so that they could independently apply for funds and manage them.
Second of all, due to the fact that they were moved to the local government system, their
access to public funds was limited as the local governments struggled with lack of financial
stability. Services were provided in forms of social care homes, day care centres, care at
home for permanently sick, shelters, and warm lunches for school age children and support in
achieving economic independence. In case of social assistance social workers, nurses, NGO
animators became the main providers.
Expenses on social assistance in Poland have been relatively very low. Money transfers still
dominated, with the highest percentage of allowances for families of disabled persons. Low
percentage of expenses on services (nursing, treatment and care, care and education, therapy
and advisory) was one of the biggest problems in functioning of the system. The concept of
social assistance encountered serious problems in realisation. The insufficiency of public
means influenced the practice of social assistance. The broad range of facultative decisions in
distribution of allowances enabled to adjust expenses to limited financial means of state
budget and local governments. Insufficient number of social workers limited their work,
especially in regions with high unemployment. Among other problems, the lack of
cooperation between institutions of social assistance and other social institutions was quite
striking.
Table No. 12: Consolidated public expenditures on social assistance in Poland
Years 1990 1993 1997 2000
Percentage of GDP 0.2 0.6 0.4 0.4
Percentage of money transfers and in kind 99 90.5 91 90.2
Percentage of services 1 9.5 9 9.8
Source: Golinowska/Topińska 2001
The basic goals of the system were expressed in the act of social assistance in 1990: help for
persons and families who could not overcome their difficult situation, support in the process
of self-independence and social reintegration, counteracting the situations that are the cause
of problems. Social assistance should offer care and decent living conditions to persons who
are unable to function independently due to their state of health, age or dysfunctions. For

26
people who could be employed social assistance should offer support focused on social and
occupational reintegration. Social assistance was seen in political debate as the most effective
instrument of dealing with social problems, which is characteristic for the liberal model of
social policy. It is based on the idea that the state should limit its activity in social sphere to
the selective social programs (social assistance) and resign from general programs based on
mutual support. In 1990s the range of duties and obligations of social assistance was
consecutively broadened, introducing new benefits and programs. Lack of family policy,
limits in the pedagogical and social functions of schools, problems with health care system
and housing policy – were all transferred to social assistance domain. Social assistance act
was supported by other acts regarding the performance of social services. In the beginning of
‘90s the unemployment act was introduced, then unemployment and employment act, and
since mid -90s – act on employment and preventing unemployment. It obliged local PES to
run employment agencies, organise public works, intervention works, to offer credits for self-
employment, organize trainings and activate unemployed through special programs and job
clubs. However the activity of local PES was concentrated on two tasks: registering
unemployed, administrating the register and granting allowances and pre-pension benefits.
The shield activities, which consumed most of the financial means for the labour market
activity, were the basic instruments of labour market (Rybka 2006).
The means-tested poverty criterion raised many doubts and was viewed as insufficient
(Frieske 1996). Income criterion was described as parametric (unlike normative and empiric).
The income threshold was at first set in relation to minimum pension: income per person
could not be higher than 90%, and then 100% minimum pension. In 1996 a quota system of
setting income threshold was introduced. It was based on the level of minimum pension and
increased every year according to inflation rate. Introduction of consumption units based on
scales of OECD was some kind of a novelty. Income in the family was calculated with the
traditional equivalency scales of OECD: 1.0 for the first person, 0.7 for the second and
further over 15 years old, 0.5 for each child. For single person a Polish criterion: 1.1 was set.
In effect children’s needs were marginalised (Szukiejłoć-Bienkuńska 2002).
Family policy was included to the domain of social assistance since family allowances were
excluded from the social security system and benefits were income-tested. In the beginning
family benefits were supposed to be divided on the basis of „quality” of the family. Families
with dysfunctions were under the protection of social assistance system whereas general
family policy was under central administration (concept from 1997-2001). In 1999, an
institution Family Assistance Centres was created which evoked discussion if helping
children and families is the same issue as fighting poverty (Balcerzak-Paradowska 2004)
Family policy in the time of economic transformation had a selective character with a weak
recognition of the families’ problems in changing reality. It was mostly based on a notion of
parents’ right to raise and educate their children. In practice it made family responsible for
their fate and limited the responsibility of state institutions for family issues.
The state’s entitlement to social and family policy was decentralised regarding organization,
administration and financing of many social services: nurseries, kindergartens, elementary
schools, culture centres, sports and recreation. Those duties were transferred to local
governments, which had insufficient organizational and financial means. It effected in
decisions of closing the institutions or raising the fees.

27
Table No. 13: Types of benefits defined in social assistance act from 1990 with further amendments
Type of benefit Access criteria Reason and purpose Amount of money
Social disability pension No income threshold, Doctor’s opinion, for
persons who were born
disabled or became
disabled in the childhood
or adolescence. Its length
is described in doctor’s
opinion.
250 PLN
Permanent allowance Income threshold for
single person: 275 PLN,
for the first person in
family: 250 PLN, for
second and more (over
15 yrs old): 175 PLN, for
every person under 15
yrs old. 125 PLN
Granted in cases of being
out of employment
because of taking care of
child that need permanent
care, if the child is
entitled to care
allowance.
250 PLN
Permanent allowance –
equalizing
Income threshold For persons entirely
incapable to undertake
job who receive low
benefits.
Up to income threshold
Guaranteed temporary
allowance
Income threshold Granted after expiration
of unemployment benefit
if a person takes care of
child and is a single
parent or the
husband/wife are
unemployed.
Difference between
income threshold and
received income
Temporary allowance Income threshold Long-term illness,
disability, long-term
unemployment.
Granted on the basis of
social worker’s
assessment and
depending on possessed
means;
Earmarked allowance: Income threshold Cover purchasing of
medicines, medical
treatment, apartment
restoration, purchase of
fuel, clothing, child care
(nursery, kindergarten),
in case of accident or
ecological catastrophe,
for gaining economic
independence.
Granted facultatively,
depending on possessed
means, usually granted
once.
Declared principles and selective activities did not include situation of families that
experienced impoverishment and unemployment. On the one hand, the new social assistance
system was introduced to help poor families. On the other hand, the rule of universal family
allowances with no indexation of their level caused decrease of its real value.
The aim of family policy was to broaden the protection of families living in difficult
conditions. Family allowances were the dominant instrument granted on the basis of income
testing. Family policy in mid - 90s was based on rules of protecting poor families,
selectiveness of benefits granting, equality of benefits for women and men, supporting
demographic processes.

28
Family allowances
In 1989 system of family allowances was set on the universalistic rules with no income test
and level set parametrically. However only 3 years later quotas were introduces which
resulted in decrease of real value.
Rules of granting family allowances changed quite frequently. Introduced in 1947, were
supposed to help families with raising their children. The differences based on number of
children were a symptom of egalitarian role of the system. Since 1970 the level of allowance
depended on number of children and level of income per person in the family. The level of
allowance was set as a quota and the basic level was set in 1963 and not changed up to 1984.
In result of the increase of expenses this benefit lost its income-creating meaning.
The main reform of family allowance took place in mid - 90s with introduction of income
test. Family allowances became social benefits, financed by central budget (previously from
social security system). The level was set as a quota, dependant on the number of children
and was supposed to be valorised by the index of goods and services prices.
Housing benefits
In the beginning housing benefits were designed as social shield in the time of liberalization
of prices and tariffs, limiting subsidies. They are regulated by income-test and additional
criteria: apartment surface and the range of expenses. In 1995 housing allowances were
excluded from the social assistance system and controlled by Housing Office on central level
and on local level – they were controlled by gmina administration as gmina’s tasks.
Regarding lack of clear strategy in general housing policy, the housing allowances were
insufficient and did not protect poor people from evictions (which has not changed).
Financing of MIP
The first stage of decentralisation process introduced in the 1990 act was basically of
organisational and not financial character. The organisational tasks were prescribed to local
governments whereas financial means remained at the central level. The central government
granted donations and subventions to local governments from central budget. This
mechanism did not take into account regional differences in poverty and unemployment. The
local governments had tasks and competences (decisions) however there were no legal
paragraphs regulating financing local government budgets and functioning of their finances.
Local governments were legally independent and self-governing but in-fact materially
dependant on the central government administration. In consequence the local governments
had no instruments to create and implement strategies aimed at solving social problems and
influencing the development of local labour markets.
System of financing social assistance after 1990 was shaped by two tendencies (Rybka 2006).
The first was to increase the financial means for social assistance – which was due to the fact
that social assistance range of tasks was significantly broadened. The second tendency was
based on giving local governments more financial responsibility with lowering the level of
financial means transferred from the central budget. Therefore the participation of local
budgets in social assistance has been increasing gradually – to fulfil all the tasks described in
the social assistance act.

29
The majority of benefits were distributed on the level of gmina, as “ordered tasks” and “own
tasks”. Gmina’s own tasks were financed from gmina budget, subsidised in majority from
central budget. The local government institutions’ incomes consisted of own incomes,
earmarked subsidies for ordered tasks, additional financing and general subsidies. Local
government own incomes came from the shares in CIT and PIT. General subsidy covered
most expenses of the local government tasks. In case of social assistance majority of money
came from central subsidy. This subsidy served as a means to realise tasks formulated by the
state, according to state’s priorities.
Figure No. 6: Main reasons for granting social assistance in years 1991-2001
Source: Broda-Wysocki 2003: 312
Figure No. 7: Number of families benefiting from social assistance in years 1991-2001
Source: Broda-Wysocki 2003:312
Joint expenses for benefits in years 1991- 2001 increased systematically from 336,8 million
PLN to 3213,4 million PLN. The increase of expenses was not even, which was a result of

30
changes in range of obligations of social assistance and partly because of financial situation
of the state. The expenses of the local governments increased systematically, over a dozen per
cent each year. The tendency to increase the share of expenses of local budget in overall
expenses was visible: from 24.8% in 1991 to 38.7% in 2001.
In the decade of 90’s, the share of different expenditures in general social assistance
expenditures changed. The share of expenditures on poverty decreased from 40.3% to 29.1%.
The per cent of support for unemployed increased from 12.4% to 23.3%. The percentage of
benefits for numerous families decreased from 8.5% to 4.5%, whereas the support for single
parent families increased from 7.1% to 8.1% (Broda, Wysocki 2003:12). On the gmina level,
the expenses on social assistance benefits increased from 8 300 000 PLN in 19991 to 913 000
000 PLN in 2001 (Błędowski 2002).
MIP system reform in mid 2000s
In the beginning of 2000s first attempts were made to change the existing income criteria for
social and family benefits. The system of calculating them was considered not transparent
(even ad hoc) and too differentiated (Deniszuk, Kurowski, Stryc 2007). In 2002 two new
thresholds were established: the so-called Family Income Support Basket (Koszyk Wsparcia
Dochodowego Rodzin) and the Threshold for Social Intervention (Próg Interwencji
Socjalnej). The first was close to the social minimum – it was calculated with reference to the
real expenditure of families placed within the second quintile of income distribution. It
exceeded it slightly, because higher expenditures on culture and education have been
assumed. The main aim was to take into consideration the developmental needs of children
(Deniszuk, Kurowski, Stryc 2007). The second was close to the subsistence minimum
(absolute poverty line). It was calculated with a reference to the low-income households: first
a basket of services and commodities was constructed on the basis of minimum norms and
then it was compared to the expenditures of families from the first quintile of income
distribution. Both of the thresholds were planned as a reference point for indicating legal
income criteria entitling to benefits. However, it was only in 2004 when the legal framework
to implement this was established.
In 2004 significant legal changes in Minimum Income Protection were introduced7. Social
assistance benefits were separated from family benefits. The main reason behind this decision
was to “avoid unjustified accumulation of benefits covering similar functions and allowing
monitoring of the revenue-dependent benefits system as a whole” (Parliament, Vol,1555 cited
after Staręga, Wóycicka 2005). In consequence, the system of social assistance benefits was
simplified. In case of family benefits, one income criterion was indicated for all types of
allowances (instead of wide spectrum of different criteria). Also the system of financing was
reconstructed to adjust it to the reform of administrative structure, which entered into force in
19998.
Moreover, for the first time a quasi guaranteed minimum income was included in the legal
framework: temporary allowance became an obligatory payment (to a limited amount)
7 By two legal documents were introduced: Social Assistance Act and Family Benefits Act. Both became
binding from May 1, 2004. 8 Three levels of self-government were introduced: gminas – which existed from 1990 (communities, NUTS V
level), poviats (districts, NUTS IV), voivodships (regions, NUTS II); and the number of regions was reduced
from 49 to 16. This resulted in a completely new division of competences in most of the areas including social
policy.

31
provided that the income criterion and the additional criterion entitling to financial support
(from a legally defined list of criteria) was fulfilled. It was calculated as a part of the
individual income gap between the legal poverty line (income criterion) and the income of
family or person. In 2004 it was no less than 20% of the income gap for a single person
household and no less than 15% for a multi-person. It rose in 2005 to no less than 30% and
20% and in 2006-2007 to 35% and 25% respectively. From 2008 it equals 50% in both cases.
The guaranteed part of the individual income gap is financed from the central budget, but the
local governments may decide to supplement it from their own budgets.
New system of allowances
Since 2004 MIP consists of two core types of benefits: temporary allowance and earmarked
allowance. It is supplemented by other forms of social protection such as family benefits and
housing benefits (mostly in-kind). Most of them are means-tested9, but the income criteria for
granting them vary.
Means-testing and the poverty line
In case of benefits from social assistance the income criterion is set with a reference to the
Threshold of Social Intervention (TSI) discussed above. After calculating it by the experts the
legal poverty line is then negotiated during the proceedings of the Tripartite Commission for
Social and Economic Issues. If the Commission is unable to reach a consensus the
government makes the decision. In consequence of the negotiations the poverty line is almost
always slightly above the absolute poverty line (subsistence minimum).
This method of setting the income criterion is frequently criticized from several reasons (see
Wóycicka 2009). First of all it depicts the needs of people as limited to food and housing, not
taking into consideration wider spectrum, i.e. medicine, fuel, electricity, etc. Second of all,
the data according to which it is set are published with a large delay and are, thus, not
representative to the actual models of consumption of the households from lower quintile.
Finally, the regional differences are not reflected in the method – which is important provided
then there are significant discrepancies in the costs of living across Poland (op.cit.).
MIP reforms and AI
Some of the reformatory steps taken in the beginning of 2000s aimed at linking MIP with AI.
The Act on social services from 2004 included the possibility to sign the so called social
contracts. This meant that social workers could grant benefits and offer support conditionally:
e.g. the family would receive temporary allowance provided that the father regularly took
part in AA meetings or that the mother registered in employment office.
Also new forms of activation were offered to the most excluded groups. First of all, from
200410
local units and NGOs gained the possibility to establish Centres of Social Inclusion
and Clubs of Social Inclusion. The former were directed to people in the most difficult
situations – long term unemployed, alcohol or drugs addicts, mentally ill, disabled, homeless,
etc. They proposed more long-term and complex programmes than standard ALMP
instruments, including various types of counselling and support groups aiming at solving
personal problems and learning basic social and economic skills, individual support during
9 Not all types of family allowances are means-tested.
10 The Act on social employment entered into force.

32
vocational training, etc. The latter were at the first place addressed to people who signed
social contracts with social assistance and offered mainly assistance in job seeking and
various forms of counselling.
Table No. 14: Summary of the most important reforms
Year Type of reform Content
2003 Act on family allowances Introduction of new income criterion
for means-tested benefits, close to
social minimum.
2004 Act on social assistance
Introduction of new way of setting
the income criterion: computation of
the subsistence minimum;
negotiations in the Tripartite
Commission for Social and
Economic Issues resulting in
indication of legal poverty line
(income criterion for MIP
allowances); if consensus is not
reached, the legal poverty line is set
by the government (cannot be lower
than the initial proposal.
Introduction of guaranteed minimum
income equalling 50% of the income
gap between income of a person or a
family and the legal income
criterion.
Introduction of social contracts.
Act on social employment The possibility to establish Centres
and Clubs of Social Inclusion.
Amendment to the Act on cooperatives from
1982 and on the basis of the act on promotion of
employment and labour market institutions from
2004. In 2006 a separate Act on social
cooperatives came into force.
The possibility to create social
cooperatives.
2005 Amendment to the Act on promotion of
employment and labour market institutions from
2004.
Introduction to socially useful
works, directed to MIP beneficiaries
without the right to unemployment
benefits.

33
Second of all, a new form of employment was introduced – a social cooperative11
. It was
directed to the unemployed registered in local PES as well as people at risk of social
exclusion or socially excluded (homeless, drug and alcohol addicts, mentally ill, former
convicts, refugees, disabled) – 50% of members of social cooperative had to belong to those
groups. It was planned as an attractive form of economic activity because of fairly simple and
democratic structure of organisation and low costs of functioning in comparison with regular
companies. There was also a possibility to gain financial support from local PES for its
establishment. Nevertheless, the beginnings were difficult and many social cooperatives
collapsed shortly after their set up12
(Gawska, Jędrak, Gruntowski 2012).
Finally, in 2005 new form of employment was introduced, called socially useful works13
. It
was addressed to the unemployed without a right to unemployment benefits but taking social
assistance allowances. They were to be organised by communes (gminas, NUTS II) and take
no longer than 10 hour per week, with salary not less than 7.70 PLN gross per hour.
To sum up, the system implemented in mid - 2000s entailed crucial changes. Social
assistance benefits were separated from family benefits. In consequence, the system of social
assistance benefits was simplified. In the case of family benefits, one income criterion was
indicated for all types of allowances (instead of wide spectrum of different criteria).
Temporary allowance became an obligatory payment in particular situations.
2.2. The extent and structure of ALMP in the mid-2000s
Lisbon Strategy recommendations were the basis of at least 20% of spending on active labour
market programs. Situation has started to improve in Poland since 2004. The possibility to
benefit from the support of the European Social Fund and the decrease of the unemployment
rate helped to reinforce active labour market policies. In addition, the European Social Fund
was essentially allocated on ALMP. However, in recent years the share of the European
Social Fund in financing programs fluctuates significantly (less than 3% of spending in 2008,
compared with 12% in 2006 and 2007) (Hurley 2010: 9), and 11% in 201114
.
Spending on active labour market programs has been growing until 2009. The expenses
decreased between 2010 to 2012, at a time when unemployment started to rise again and the
need for active policies became greater.
Expenditure on active policies is difficult to characterise in terms of the well-known
typologies due to the lack of sufficiently reliable data. In years 2005-2010 there was no single
dominant strategy. As in the case of many other EU countries different strategies were
implemented in order to find remedies (Bonoli 2010). A large part of the expenditure in
2005-2010 was devoted mainly to three strategies highlighted by Bonoli (“employment
assistance”, "occupation/training for unemployed" and "human capital investment" with a
weaker focus on the "incentives strategy"). The "incentives" strategy (strengthen positive and
11
Introduced by the amendment to the Act on cooperatives from 1982 and on the basis of the act on promotion
of employment and labour market institutions from 2004. In 2006 a separate Act on social cooperatives came
into force. 12
Many of the social cooperatives were established in a framework of programmes financed from ESF and did
not last after it had finished. 13
It was introduced with the amendment to the Act on promotion of employment and labour market institutions
from 2004. 14
http://www.mpips.gov.pl/praca/fundusz-pracy/zestawienie-przychodow-i-wydatkowfp-za-lata-2005-2011-i-plan-2012/

34
negative work incentives for people on benefit) is ineffective because of the large shadow
economy and the impact of high unemployment.
Table No. 15: ALMP expenses from Labour Fund
Specifica
tion
2005 2006 2007 2008 2009 2010 2011
Share of
expenses
for
ALMP
(without
for young
workers
expense)
0.29 0.38 0.46 0.55 0.58 0.58 0.25
Source: Own accounting on: http://www.mpips.gov.pl/praca/fundusz-pracy/zestawienie-przychodow-i-wydatkowfp-za-lata-2005-2011-i-plan-2012/
Table No. 16: Structure of ALMP spending (2005-2011 together)
Specification % Sum
Job creation in private sector 6
37%
Job creation in public sector 7
Funds to start a business activity 9
Refund for employers the cost of compensation for young workers 5
Equipping workstations 10
Trainings 7
35% Initial trainings, internships, scholarships 16
Vocational education 8
Postgraduate internships of physicians and nurses 4
Source: Own accounting on: http://www.mpips.gov.pl/praca/fundusz-pracy/zestawienie-przychodow-i-wydatkowfp-za-lata-2005-2011-i-plan-2012/
Box 3: Vulnerable groups in 2004
Vulnerable groups:
Unemployed below 25 year of age,
Long-term unemployed,
Unemployed over 50 years of age,
Unemployed without vocational skills,
Unemployed single parents with at least one child under 7,
Unemployed disabled people.
Source: Act of employment promotion and labour market institutions from 2004.

35
In 2004, six vulnerable groups were introduced, which were given preferential access to
ALMP. The catalogue has been slightly expanded over the years (for details see section
4.2.3). Long-term unemployed as well as single parents with children in pre-school age were
included. Working poor remained a group completely ignored by the act.
2.3. The extent and structure of other services of potential relevance to working-age minimum income claimants in the mid-2000s
2.3.1. General childcare provisions and specialised support services for single parents
The lack of public funds for social services and limiting state responsibility for raising and
educating children under 6 years old led to increase the participation of parents in financing
social services. In effect, lower number of children have been attending to care institutions.
According to the Eurostat (2009) only 2% of children 0-2 attend nurseries and according to
Polish Ministry of Education, only 59% of children 3-5 attend kindergartens. In situation of
low supply of places in nurseries and kindergartens, local governments set additional criteria
for admission – the most common ones are employment of parents and being a single parent,
both groups are given the priority in the recruitment process. The attendance to a public
nursery is for fee and public kindergartens offer 5 hours of unpaid care (between 8-13) and
the rest hours are paid (the level depends on local government). Nurseries and kindergartens
offer several cold and warm meals for children, for low fee. Poor families may apply for
lower fees (day care and food) and each case is analysed individually.
Local PES support
Unemployed single parents with children under 7 may receive refund for childcare costs up to
half of the unemployment benefit. (PLN 358.5) per child in case if they: 1) take up job (or
subsidised employment), apprenticeship, on-the-job training, training; and 2) do not earn
more than a minimum wage.
Reduction of fees and priority in access to public day care facilities are the only instruments
focused on single parents and their ability to combine work and family. The problem is the
number of childcare facilities, which is still highly insufficient.
Family benefits
Since 2004 family allowances constitute a separate system of transfers. Not all of them are
means tested15
. However, family benefits – which work as a support for low-income families
with children – are granted with a reference to an income criterion. It is a bit higher than the
legal poverty line.
Non means-tested and financial support for the families – and alimony support
Families are entitled to several non-means tested benefits, such as birth allowance, maternity
and paternity allowance. Single parents are entitled to Alimony support in case their ex-
partner does not pay alimonies – the support is means-tested.
15
One-time benefit granted on account of childbirth (1000 PLN) and nursing allowance (520 PLN) do not have
an income criterion, but there are plans to introduce it.

36
Birth allowance: introduced in 1954 for women workers and wives of workers, as a once paid
allowance on the level of triple and then (since 1983) double family allowance. Birth
allowance was liquidated in 2002. However, families receiving family allowance have the
right to a one time birth allowance. In 2006 the state increased the financial support
connected with the birth of a child – by rising the amount of means-tested supplement to
family allowance due to childbirth (from 500 to 1000).
Single birth allowance (“baby bonus”) – allowance for parents or legal carers, regardless their
employment status and incomes. It is paid once for the birth of child, in the amount of 1000
PLN. It was introduced in 2006. In the beginning of 2013 an income threshold (no more
than1922 PLN per person in family monthly) was introduced to exclude families with higher
earnings. Local authorities may also grant additional “baby bonus”.
Maternity allowance: was introduced in 1970s. The length of maternity leave was prolonged
in 1999 (5 months for the first child) and reduced to previous length in 2001 (4 months), from
2010 it lasts 4,5 months with facultative 1,5 month. The maternity leave and period of
collecting allowance were extended, then shortened in 2002, and then extended again. It is
granted on the basis of childbirth and adoption of child up to 7 years old. It may be obtained
by persons entitled to sickness benefits, working on the basis of contract of employment,
agency contract, contract of mandate, self-employment. Maternity allowance is 100% of
wage. In case of unemployed with benefits, the period of payment is prolonged for a time of
regular maternity leave (Uścińska 2008; Balcerzak-Paradowska 2004).
Paternity allowance: introduced in 2010 for the father, regulated on the same basis as
maternity allowance, except that it lasts 2 weeks.
Alimony state support: It was created in 1975 to help families who could not execute
alimonies from persons obliged to pay them. The Social Insurance Institution (ZUS) managed
it. The first criterion was income per person in family and the level was increased
consequently. The level of benefits was set in quota and the upper limit was the level of
alimonies set in court. In 90s the income-test was cancelled, than introduced again, the
income criterion was set parametrically, than by quota, and with increased upper level of
benefit. In 2003 Alimony Fund was liquidated with the new family benefits act. Instead, an
alimony advance payment was introduced and widely criticised. It was beneficial for single
parents with children up to 7 years old, unemployed without benefits. Single families who
were entitled by court to obtain higher alimonies lost the chance to obtain higher allowances.
Liquidation of Alimony Fund weakened the responsibility of person obliged to alimentation –
previously the debt was owned to the state, now is owned to private person. The alimony
advance payment is granted and financed by local government. The alimony debtors may lose
driving licence as a form of punishment and since 2009 they are registered in national debtors
register, available for all banks and financial institutions – which means, that they cannot take
money credits. From October 2008 previous beneficiaries of benefits of alimony advanced
can receive benefit from the alimony fund (swiadczenie z funduszu alimentacyjnego). The
system provides benefits for families when alimony from the other parent is not executed.
The system was introduced on the 1st of October 2008. Most of the previous beneficiaries
from the Alimony Advance received the benefit from alimony fund. New regulations on
benefit from the alimony fund became enacted with Act of 17 September 2007 on support for
persons entitled to alimony. It is paid when the execution of alimony granted by the court is
ineffective. The fund is due, provided that the net monthly family income per capita (after the
37
deduction of tax and heath contributions) does not exceed PLN 725 for person. Persons
eligible for the alimony fund are: children up to 18 years old, or up to 25 years old, being a
school or university student, or disabled persons, without age criteria, if a person presents a
decision on considerable invalidity. The amount of the alimony fund is limited to the amount
of the alimony granted by the court and cannot exceed PLN 500 per person. This benefit is
paid also for children brought up in whole family.
2.3.2. General employment retention and advancement support and specialised support services for the working poor
Although, the issue of encouraging people to stay in-work recurs in the discourse, no
measures have been taken to provide incentives for that16
. The only form, which aims at
supporting employment, is the so-called activation allowance (dodatek aktywizacyjny). It is
reserved only to the unemployed receiving unemployment benefits and is granted in case of
taking up part-time job below minimum wage proposed by employment services or finding
job on one’s own. It is paid for half or whole time in which unemployment benefit is due and
equals maximally 50% of unemployment benefit.
There are no instruments in social assistance and social policy for working
poor. There is no thinking that working poor are actually a problem. They
vanish from the discussion because the discussion is focused on unemployed
and it is the long – term unemployed who are in the centre. The trainings
financed by EU funds are usually designed for long-term unemployed. What
happens later, if they really found a job, is not a matter of interest to anyone.
In Poland the most important indicators are the numbers of participants of the
trainings, how many participants, how many trainings. We do not know how
many of them actually found a job. Nobody counts how many persons
participate in several cycles of trainings. (04)
In mid - 2000s the idea of life-long learning was not connected to working poor. All the
efforts labour market policies and social assistance were focused on short-term and long-term
unemployed. The WP might theoretically ask for the support of local PES however in reality
the offers at employment office were usually low-paid and could only sustain WP status.
2.4. Governance of minimum income provision and related services in the mid-2000s
2.4.1. Administration and policy making
The administrative reform from 1999 and the new legal frameworks for labour market policy,
social assistance and family assistance introduced in years 2003-2004 laid the foundations for
the current system of governance of MIP and related policies. The system has been
functioning on those basis until today. The responsibilities were shared between the central
level and three territorial levels – regions (NUTSII), poviats (LAU1) and gminas (LAU 2).
Territorial governments have been from the beginning relatively independent from the central
government in shaping social policy, but – at the same time – limited by state’s financing in
the area of labour market policy and – to a smaller extent – social assistance, especially if
their own incomes were low (see 3.3).
16
Governmental strategy from 2009 - “Poland 2030” - included a recommendation suggesting that an in-work
benefit should be introduced to encourage people to stay in work, but no steps have been taken so far to
implement it.

38
The central administrative level
The main actors in the area of social policy at the central administrative level are the Council
of Ministers, the Minister of Labour and Social Policy and the State Council of Social
Assistance. The main central administrative body in this policy field is the Ministry of
Labour and Social Policy.
The Council of Ministers (CM) is the core executive body consisting of the Prime Minister
and all the government ministers. In social policy its role is limited to the design and
supervision of the budget. This is crucial as far as MIP is concerned, since state budget covers
the costs of the guaranteed part of temporary allowances. It also decides about financing of
the majority of supporting instruments such as ALMP and unemployment benefits (the
Labour Fund), family allowances and housing benefits. Moreover, CM decides also about the
financing of special governmental programmes such as currently implemented "State's Extra
Meal Programme" directed to children under 7 years of age and families and people not
exceeding 150% of legal income criterion for social assistance.
Another important task of the CM concerns determining the income criteria for MIP (and
family allowances). It is to be negotiated in the Tripartite Commission for Social and
Economic Issues. However, in the case when the compromise is not reached the CM makes
the final decision about the amounts (of the income criterion for MIP and family allowances).
The Minister of Labour and Social Policy performs programming and controlling functions in
the area of social assistance, family assistance and labour market policy, among others:
designing of legal framework, indicating standards of services and structure of social
assistance, Public Employment Services and other units engaged in provision of services,
organizing data collection, setting educational requirements for social workers and their
further specialisation, preparing the specimen of social contract and social interview and
indications for social interview, specifying control procedures and procedures concerning
granting, withdrawing and suspending allowances, etc. The Council of Social Assistance and
the Ministry of Labour and Social Policy support minister in performance of those tasks.
The Council of Social Assistance is an advisory body consisting of the representatives of self-
governments, social assistance institutions, trade unions and third sector organisations from
various (not necessarily all) regions. It is selected by the Minister of Labour and Social Policy
for a three year term. Among Council's main tasks are: providing opinions about draft legal
acts and proposing legal changes, preparing expert analyses on various subjects concerning
the area of social policy.
The Ministry of Labour and Social Policy performs tasks from three sections of public
administration17
: labour, family matters, social protection. It also gathers data from all
administrative levels. Social policy and labour market policy are managed by different
ministerial departments: the Department of Social Policy and Social Inclusion, the
Department of Family Policy and the Department of Labour Market. Their main tasks are
connected to realisation of each of the acts: respectively, on social assistance, on family
allowances and on promotion of employment. As representatives of central administration
they perform programming and some controlling functions: drawing up new policy
arrangements and proposals of legal changes, preparing diagnoses and analyses from their
fields, initiating research, verifying standards of social services, monitoring the performance
17
As defined by the Act on sections of public administration from 4th September 1997.
39
of social assistance tasks by self-government institutions and other units, preparation and
monitoring of implementation of government programmes, in some cases serving as the
instance of appeal etc. However, as far as the "Social" OMC is concerned there is a forth
department responsible for coordination – the Department of Economic Analyses and
Prognoses. It was appointed this task probably because of its specific place in the structure of
the Ministry – it is not assigned to a particular policy field. In general, this department is
responsible for conducting research, preparing expert reports, coordination of data gathering,
and supporting other departments in preparation of strategic documents.
Regions
Regions, called in Poland Voivodships, realise twofold functions: they serve as a
representation of the central administration and as local governments. The first is performed
by the governor (voivode), who is supported by the voivodship office. The second by the
regional council and the administration of voivodship, is headed by the marshal. The
governor carries out various controlling and supervising functions in the area social policy.
Among other things: supervision over performance of social assistance units from all levels
of local government, assessment of quality of services and implementation of standards of
services, etc.
Whereas, the local governments of voivodeship are responsible – among other things – for
preparation, implementation and actualisation of the regional strategies of social policy
(being a part of the strategies of regional development), as well as regional strategies for
solving social problems (to support poviats and gminas in this respect), diagnosing sources of
poverty and assessing needs in the area of social assistance, etc. Moreover, they are also
bound to establish and support financially regional social policy offices, responsible for
coordination of strategies and policies at the regional level. Finally, local governments of
voivodships are at the core of distributing and accounting for the resources from European
Social Fund implemented in the framework of Operational Programme the Development of
Human Capital (see Miś, Nóżka, Smagacz-Poziemska 2011).
Poviats, gminas and cities with the poviat status
The most important implementing functions are performed by local governments of poviats
and gminas. The former represent the middle level of local government (LAU 1). They are
responsible mainly for specialised services, such as care for the physically or mentally
disabled, support of people having problems with adjustment (especially young people
leaving children's homes and other facilities for youth), organisation of adoption matters,
support of foster families, management of specialised facilities (also homes for under-age
single mothers and pregnant women, sheltered flats, care facilities) and crisis intervention
centres, etc. Those tasks are performed by Poviat Family Assistance Centres. They are also
bound to prepare poviat strategies for solving social problems aiming at social inclusion of
people from vulnerable groups (the disabled, the long-term unemployed).
What is important, poviat is also the administrative level at which local public employment
services (local PES) operate. They are responsible for the delivery of employment services,
i.e. payment of unemployment benefits, provision of ALMP job agency (employment
consultancy, job seeking support, vocational trainings, apprenticeships, etc.).

40
Gminas (LAU 2) are responsible – among other things – for managing social, family and
housing policy at the local level. They are supervising local social assistance offices (local
SAO), which are the institutions responsible for the provision of MIP and social assistance
services such as social work, counselling, support groups, etc. They are often obliged by the
local authorities also to prepare local strategies for solving social problems and preparation of
needs assessment in the area of social policy. Moreover, they are often providers of family
benefits and sometimes housing benefit (depending on the system developed in a gmina).
There is also another institution operating at that level which should be mentioned – the
Local Commission for Solving Alcohol Problems. One of its aims is social inclusion of
people dependent on alcohol and drugs and enabling access to therapy.
Gminas finance also social assistance benefits (earmarked allowance, special earmarked
allowance, not obligatory part of temporary allowance) accept from the guaranteed part of the
temporary allowance and the permanent allowance (paid for people incapable to take up
work), which are covered by the earmarked grant.
There is also another type of local government called a city with poviat status. It applies to
the cities with over 100 000 inhabitants, former capitals of voivodships or cities in big
agglomerations. They combine administrative functions of gminas and poviats. In those units
poviat family assistance centres are amalgamated with local social assistance offices in an
institution named municipal family assistance office. It performs tasks of the former and the
latter.
Other institutions important in the governance of MIP
Important institutions in the system of governance of minimum income are Local
Government Boards of Appeal. Those bodies are a part of juridical system, not territorial
governments’ system. They role is to examine individual complaints on administrative
decisions made by institutions from each self-government level – among other things – issues
concerning denial or withdrawal of benefits.
2.4.2. Delivery
As mentioned above, the delivery system created in years 1999 – 2004 is based on two local
administrative levels – poviats and gminas. Main responsibilities in the area of labour market
policy were allocated in the former, whereas other policies – social assistance, family
assistance (with the exception of specialised care) and housing – were mandated to the latter.
This way issues connected to activation and financial transfers for the unemployed were
isolated from functions such as MIP and other forms of support for people with low income
(with some exception in case of cities with poviat status). Over the years, the problems of
coordination between those areas have not been overcome (for details see 4.3.2.).
The main role in delivery was given to public bodies, which were entrusted with managing all
transfers. However, private or third sector actors were included in the delivery of activation
services as well as some social services. The system of selecting partners was based on open
contests. Cost-efficiency – defined as the best quality for the lowest price – was the main
logic of selecting contractors and no outcome based payments were taken into consideration.
In general, the then established system of delivery in the area of social assistance as well as
labour market policy is managed by rules rather than by objectives. Although there are

41
legally defined standards in some areas and the issue of quality of services is the central
subject of control, the approach towards them is traditional-legalistic. The construction of
those standards is slightly different in the area of social assistance and labour market
institutions (Szarfenberg 2011). In case of the former, quality and standards refers to
measures such as providing appropriate living or dietary conditions in social assistance
houses or ensuring that there will be a sufficient number of social workers in comparison to
the number of beneficiaries. In case of the latter, standards are procedural – consecutive
actions demanded from employees are enumerated. In both cases, the process of delivering
services as well as expectations of clients are not taken into consideration. In result, following
the rules becomes a main driver of services' provision and control.
However, because of the high level of decentralisation the functioning of local institutions
depends on the approach of their direct superiors and the gmina and poviat authorities
(Koczur 2007). Therefore, there are cases of offices where management by objectives is
introduced – on the initiative of the former or the latter – in the form of ISO 9000s
(Krzyszkowski 2010). This is connected to the implementation of solutions used in private
sector, such as setting goals and measurable indicators of quality, assessing client
satisfaction, unifying procedures of service. However, ISO instruments are not always
introduced with a full success and may limit efficiency – especially in smaller units
(Krzyszkowski 2010).
42
3. The Dynamics of Active Inclusion Reform
3.1. The political construction of the reform agenda
The pressure on reforms in the areas connected to poverty and social exclusion from the
wider public is limited. Media debates are centred on issues, which are potentially
controversial or emotion-inducing. Poverty is often presented as connected to dysfunctions –
especially in the context of large families, which are often depicted as having alcohol
problems, violence or psychical problems, etc. Whereas, broadly conceived and informed
discussions are rare.
Negative connotations of poverty in the media massages are linked to the tendency to picture
it as individual’s fault, which is emphasised in the interviews:
I would say that it is an attractive subject for the media, but in a wrong sense -
to show that poverty is something bad and that the person probably deserved
it.(04).
MIP claimants are often depicted as abusing the system – collecting benefits instead of taking
up work. They are sometimes classified as having the mentality of a homo sovieticus – a
person socialised in the previous political system, having no own initiative and expecting that
the state will solve all the problems.
Unemployment seems to be a subject most often triggering the so called “blame discourse”.
The standpoint according to which there are many “false” unemployed, i.e. people who do
not want to work and prefer to live on social transfers or do not mind working illegally seems
prominent. A good example of it may be the Social Diagnosis – quantitative panel studies
prepared every two years, which are always broadly discussed in the media:
All the unemployed registered in employment offices may be divided into two
large groups: the real and the false; the false, in turn, may be divided into
those who are not interested in work (do not look for it or are not ready to take
it up) and those working illegally or gaining income in another way (...)
(Diagnoza Społeczna 2009, p. 320-321).
This way the problem is “individualised” and little consideration is given to possible systemic
sources of illegal work or unemployment (e.g. employers wanting to avoid labour costs and
thus forcing illegal work or insufficient number of kindergartens and crèches, etc.). At the
same time, the demand to tighten regulations on social transfers as well as make them more
conditional, so that only “deserving poor” could get it, is visible in the debate.
The subject which has recently been triggering more systemic reflection is ALMP. There
seems to be a consensus in the media, as well as among politicians and social partners, that
the money from Labour Fund and ESF are not being used properly: the quality of trainings
and their adjustment to the labour market demands is strongly criticised.
Moreover, some of alarming cases are used instrumentally in the political struggle between
the government and the opposition. As one of our interlocutors puts it:

43
(…) if they [the media] write about the issue of poverty they want to cause
sensations. So they show, for example, some family with mental health
problems and a lot of children, and these children are taken from them by some
institution, right.(…) Things like this are used to lay in one’s political
opponent. So, for example, in a pathological family - if state authorities or
social workers did not react in time and a child fell out of the window, or some
other tragedy happened – politicians start to bash one another as if the current
prime minister, and the current minister were to blame for this tragedy.(02).
Discussions concerning the most vulnerable groups concentrate on children. Most of the
press articles, interviews with experts and television news concerning that subject occur when
some alarming data showing that children and numerous families are at the highest risk of
poverty and social exclusion or that large number of children in Poland are hungry is
published (Tarkowska 2006; Pawłowska-Salińska 2012; Ćwiek 2013; Marczuk 2013b; Zubik
2013). The presence of this subject in the media is strongly emphasised in the interviews:
When poverty is discussed, the most popular subject of debates and media
massages are always the children. (04).
Sometimes children are pictured in opposition to pensioners, who have been long considered
as the most affected by the negative effects of transformation (Włodarski 2010; Marczuk
2013a). Meanwhile, according to the data children seem to be in much worse position.
However, as stated in some of the interviews pensioners with minimum pension, should also
be seen as a vulnerable group, since their struggle to support themselves is becoming more
and more visible – their pensions are barely sufficient to pay the rent18
:
“(…) in most of the cities with large number of communal buildings there is no
strategy for seniors. And those people – there are more and more examples of
retiring people, if its two people they are able to cope somehow. But when one
person dies, the other is not able to pay the rent. We had a number of such
situations, for example a women has been a nurse at the hospital for 35-37
years and here pension was sufficient just to cover the rent.” (014).
Moreover, as some of the respondents notice, the problem will soon become striking, since
people with new pension scheme19
will start retiring – and their pensions will be significantly
lower than this of “old scheme” pensioners. Similar “competition” for acknowledgment in the
discourse concerns single parents and numerous families. This may be connected to a broader
normative debate between the conservative (emphasizing the importance of traditional
catholic family) and more liberal media.
The only subject eliciting broader discussion in the media, engaging all political sides, the
President, trade unions and non-governmental organisations and translating into political
actions seems to be demographic decrease. In this context issues such as situation of young
people on the labour market and family policy are debated.
It has been emphasised that young people are subject to uncertain employment in the so
called “junk jobs” – the already discussed civil contracts, which do not give people the rights
18
Communal flats are often too large to qualify a person for housing benefit and there is rarely a possibility to
change it for smaller one. 19
Scheme based on the pension reform form 1999.

44
of employees (see 1.1.2). They are also facing high risk of unemployment and in-work
poverty. This is perceived as the main reason of their reluctance to form families and have
children. Alarming articles are being published enouncing that Polish women chose to give
birth in Great Britain or Ireland instead of their home county, because of the low level of
security offered by the state (Kałuczek 2012; Marczuk 2013c).
3.1.1. Political debate and its key actors
The overall picture of political (and policy) debate concerning poverty and social exclusion,
which emerges from the interviews is quite unequivocal. Interviewees representing different
political sides and organisations perceive it unanimously as extremely fragmented and
lacking fundamental discussions. However, they indicate different detailed aspects of the it as
crucial.
Both the representatives of trade unions and opposition parties criticise the government’s
(and especially the governing Civic Platform) approach towards social policy. They explain it
as the logic of giving fishing rod instead of a fish (07). This means, that all efforts should be
invested in improvement of the labour market situation and skills development, not in
financial transfers. Meanwhile, not everyone is capable of using such a fishing rod –
especially if their basic needs are not secured. The long not valorised poverty thresholds
(income criteria for allowances) are given as one of the most important examples of such
approach.
Poverty thresholds for one and multiple person households, which indicate incomes entitling
to temporary allowance, are to be revised every three years (see section 2.4.1.1.). They are
negotiated during the meetings of the Tripartite Commission for Social and Economic Issues
(TCSEI) with reference to the subsistence minimum. In 2010 (previous valorisation was in
2006) all sides of the social dialogue agreed to raise the thresholds, since it dropped below
the subsistence minimum – and a due resolution was issued and signed by the Minister of
Labour and the Deputy Prime Minister (both from the coalition Polish People’s Party).
However, its implementation was blocked by the Minister of Finance (from the governing
party) forcing the policy of austerity:
“Have you heard how rough it was in the Tripartite Commission with those
income thresholds? We fought, because we had this opportunity (…). There is
this regulation that when the thresholds drop below the subsistence minimum
Tripartite Commission may ask the Council of Ministers for correction. And we
issued this famous resolution number 37 [concerning the increase of
thresholds] and Deputy Prime Minister Pawlak signed it, Minister of Labour
Fedak signed it and Rostowski [the Minister of Finance] rejected it insolently.”
(012).
The Minister of Finance is identified by some of the interlocutors as the main impediment to
implementation of widely understood social policy. Another of his decisions– to freeze 7
billion PLN from the Labour Fund – is often indicated as an example of his disregard to
social policy. It was officially justified by the need to rationalise its spending, but according
to many voices the aim was also to reduce the budgetary deficit and thus bring Poland closer
to fulfilling the Maastricht criteria. As one of the interviewees notices, nothing has been done

45
so far to improve the system of distribution of this resources and the unemployment is
rising20
:
This 7 billion, which is frozen, and the Prime Minister promised to use them
better. I remember 1.5 years ago the Prime Minister said – I think it was his
expose – that too much went to trainings. That this policy has to be changed,
because some people are trained 10 times. And what – nothing happens. (…).
I’m surprised, because we have only two funds with no deficit and one of them
is the Labour Fund. During the crisis this allocations will be smaller, but it still
is in good shape. And we could make good use of this money now when we
need them” (014).
The government is believed by trade unions and opposition to have abused the argument of
crisis to prevent any additional spending on social policy. According to some voices, the
crisis is being used to justify government’s decisions in select areas:
“Problem of the economic crisis is sometimes present and sometimes not. I would say that it
is a slogan used instrumentally by employers and by the government when they want to
justify something.” (01).
Representatives of employers put emphasis on the aspect of motivation to work. They
perceive allowances from social assistance (especially temporary allowance) as well as
unemployment benefits as demotivating people to seek employment. They link it to the little
difference between the amount of those transfers and the amount of minimum wage. This is
considered an argument supporting the thesis that social transfers are in general too high in
Poland, not that the minimum wage is too low – which is a frequent cause for disputes with
the representatives of trade unions during TCSEI’s meetings. Above that, employers have
expressed a critical view not only about the transfers but also of the ALMP and put pressure
on the government to change it:
“This [the Labour Fund] is – in quotation marks – our money, we, employers,
put this money there. So we would like it to be effectively spent. This is our
contribution and we are monitoring the spending. And this money is to a large
extent – especially in rural areas – allocated to unemployment benefits…but
also to inclusion of the short and long-term unemployed into the labour
market. And we prepared in-depth analyses…yes, I can give it to you…they
show how ineffective this system is. That we indeed spend a lot of money – it is
billions – to no effect. So we are trying to do something to change this system
in the best interest of the economy, the unemployed, the future employees and I
hope also us – the employers. And we put pressure on the Ministry of Labour
and the Prime Minister so that the [local] PES stopped serving just as places
where unemployed are registered and one or two people find employment only
because some crazy employer decided to came to this institution with a job
offer.”(011).
According to the above, local PES are failing in their role of mediators between the
unemployed and the employers, which is a view expressed by most of the interviewed.
However, what strikes in this statement, is the sense of influence and ownership of the money
20
Poland is currently beginning to feel the consequence of the economic crisis, which is reflected in
unemployment statistics.
46
in the Labour Fund. The government is indeed planning a large reform of the system of
labour market institutions, which aims at more individualised job agency (partly based on the
private entities), more active search for job offers from the side of local PES and their closer
cooperation with employers. It is, however, difficult to determine to what extent the
employers influenced it.
Family policy was indicated as the only subject connected to AI, eliciting broader public
debate – engaging the media as well as different political and social actors and receiving
government’s attention. During the previous term of office of the government, the need to
increase the number of crèches and kindergartens was acknowledged as one of the keys to
support women’s integration with the labour market (especially that their employment rates
are lower than in case of men). Yet, other forms of support did not follow: similarly as in the
case of poverty thresholds, the government was reluctant to valorise the threshold for family
benefits – also using the argument of the crisis. The situation changed only recently, when the
negative demographic prognoses – the drastic decrease of fertility rate and aging of the
society – have been more directly emphasised by the government. As one of the respondents
notices, the first sign of it was the last year’s pensions reform increasing the retirement age:
“I think that this issue [family policy] has been always present, but the pension
reform from last year – extending the age of retirement – where one of the
arguments was that people live longer and it’s a matter of capacity of the
Social Insurance Fund since the number of births is dropping. I think that this
aspect strengthened the importance of family policy. (…). I think that this
demography and aging of society triggered those discussions about the
necessity to take actions in favour of the family and demography.”(08).
Indeed, the thresholds were raised in October 2012 and family policy was also one of the key
subjects of the Prime Minister’s expose after Civic Platform had won the second elections in
a row:
“We want to focus on the safety of family and we know very well – I will later
present concrete proposals – that we have to break with this partial and
ineffective actions. This is the only area for which I feel entitled to use the word
“revolution”, but such revolution in favour of fertility, in favour of mother’s
safety– who decides with a father to give birth – such revolution is needed in
Poland.” (Tusk 2013)
Despite the presence of family policy in government’s agenda, the representatives of
opposition parties as well as trade unions perceive this plans as too narrow. They also
indicate the ruling parties’ (especially Prime Minister’s) tendency to automatically reject all
proposals that do not come from the government’s side.
3.1.2. Influence on the reforms
Most of the interviewees perceive the government as dominant force – as if there was no
possibility to influence its decisions. The employers are an exception, as they seem to treat
the government as their ally in the fight against the economic crisis. The blame for deficits of
labour market policy is placed on the inefficient administration and its employees who yield
to the tyranny of the status quo (011). Thus the system of motivating employees of public
administration should be changed into an outcome-based instead of a rule-base one. At the

47
same time, there seems to be a sense of influence on the policy, which may be observed on
the basis of incoming changes in the system of labour market institutions.
The interviews disclose also the importance of institutionalisation of social dialogue. Thanks
to the fact that the Tripartite Commission for Social and Economic Issues is a legally
recognised entity, it is able to put at least some pressure on the government as opposed to
non-governmental organisations. NGOs’ role is reduced to consulting governmental projects
(programmes and legal acts) but without any guarantee to influence their shape, since the
remarks and propositions coming from organisations do not have to be taken into
consideration. Moreover, the rules regarding the membership in TCSEI are transparent and
legally binding. Whereas selection of the NGOs is often based on discretionary criteria – with
the exception of network organisations indicated by the European Commission (see BEKS
2011).
3.2. Policy legacies and feedbacks
Several policy legacies shaping changes in the area of AI may be identified. First of all, the
lack of discussion concerning the desirable model of social policy over the last 20 years has
resulted in a reactive and fragmented approach towards it. From the beginning of systemic
transformation it has been treated as a necessary budgetary cost to alleviate the most severe
social problems. At first this approach was dictated by the scale of problems and extremely
difficult economic situation. However, no attempts have been made over the years to change
this “emergency” pattern (see Inglot 2008) into a more preventive and holistic one. Apart
from that, the fact, that ministers of finance have had strong positions in most of the
democratic governments, made it prone to fiscal austerity regardless to the economic
situation.
The accession to the EU has been used to rescale social policy from passive to more active –
especially in the field of labour market. In the area of MIP a partly guaranteed minimum
income has been introduced together with stronger conditionality, which was to be
guaranteed by social contracts. Apart from that significant resources have been invested in
activation of the unemployed thanks to the ESF. Some discussion have been initiated in the
area of poverty and social exclusion, but their results have not been used to design a coherent
model of social policy (see next section).
Second of all, the legacy of a “sectorial” (or even “departmental”) state, which may be track
back to the period of state socialism, has not been fully overcome – at the central as well as at
the local level – despite many trials. Social policy is shaped by different ministries (Ministry
of Labour and Social Policy, Ministry of Heath, Ministry of Regional Development, Ministry
of Transportation, Construction and Maritime Economy, etc.) and different departments. The
cooperation between them is based on commenting strategic programmes, the proposals of
legal acts and their amendments or the urgent need to solve a pressing problem, but not
necessarily on the joint policy planning. In result, the influence of various arrangements from
one area of social policy to another is sometimes overlooked (04, 012). Although the
interdepartmental teams are formed more often than it used to be a few years ago, the
representatives of central public administration vary in their assessments of the fact. Some of
our respondents find it helpful and important (05, 010) others consuming time for real (i.e.
important for the department) work (06).
48
Moreover, the “ownership” of active inclusion as a concept is not shared across departments,
but rather treated as a domain of those units, which specialise in poverty and social exclusion.
As one of the interviewees from department of the Ministry of Labour and Social Policy not
directly connected to social assistance admits:
Interviewer: “Do you remember any discussions in your department or in the
ministry concerning the meaning of active inclusion? How to translate it into
Polish conditions?”
Respondent: “Well, I would say this is more a question to the Department of
Social Assistance and Social Inclusion. (…). But this active integration – it to
be discussed in this department – I haven’t heard…maybe at the ministerial
level there was…I saw some pieces of information on the website I think – but I
did not participate in anything.” (08).
The limited cooperation of the local PES and local SAO seems to be a side effect of the
above. Those institutions face a twofold problem: they belong to policy areas regulated by
two different legal acts and operate on various administrative levels (LAU 1 and LAU 2).
Despite steps taken to bring them together, their cooperation is still limited to sharing
information about specific cases (for details see 4.3.2).
Finally, the legacy of unemployment as a dominant social problem should be mentioned as a
factor preventing the inclusion of problems of the working into the policy agenda. Poland has
been struggling with mass unemployment from the very beginning of the transformation.
Even in years of economic growth the unemployment rate has been oscillating around 10%.
On the one hand, the labour market policy has been identified with combating
unemployment. On the other hand, the conviction that every work is better than none has
long prevailed in the discourse. In result, hardly any instruments are directed to groups such
as working poor or other people experiencing vulnerable employment. A good example of the
perception of those groups, is the statement of one of the employees of public administration
working in the area of labour market policy:
Interviewer: “We are especially interested in three groups: long-term
unemployed, single parents and working poor. Could you please compare the
policy instrument offered to them?”
Respondent: “Everything is offered to those three groups, right”?
Interviewer: “Also to working poor?”
Respondent: “No, not to working poor, we are not interested in working poor.
We are dealing with unemployment here.“(06)
According to the law, PES should be also taking care of employed searching for work, but no
one seems to be remembering about this function. Above that, such people may only count on
job advisory and job agency, but no forms of up-skilling are offered to them.
3.3. Institutional constraints and opportunities
The distribution of power and responsibilities among actors engaged in social policy changed
in 1999 with the introduction of decentralised administrative structure. The central level
retained competences in the areas of policy planning, budget planning and general
supervision. Local authorities were given freedom to shape those areas, which were not in the
competences of higher administrative levels. The idea was to better adjust social policy (and

49
other policy areas) to the local circumstances and demands. However, it triggered a cost-
avoidance strategy from both sides – the state and the local units, which has been limiting the
process of policy planning and implementation.
The share of expenditures on social assistance and other social policy tasks in total
expenditures from the central budget has dropped visibly in years 2005-2009 (see Figure 8).
The highest amount of money was in those years allocated on family benefits, alimony fund
benefits and social security contributions for persons collecting nursing benefits21
: it equalled
71.4% of state’s expenditures on social policy in 2005 and dropped to 65.6% in 2008 and
increased again to 68.1% in 2009 (GUS 2011a).
Figure No. 8: Share of expenditures on social assistance and other social policy tasks in total expenditures from the
central budget in years 2005-2009 (%).
Note: orange – expenditures on social assistance (expenditures on family benefits; alimony fund benefits; social security contributions; care and educational facilities; social assistance homes; allowances from social assistance, etc.); green – expenditures on other social policy tasks (teams for the adjudication of disability; state funds: The State Fund for Rehabilitation of Disabled Persons, The State Fund for Veterans; social pension, etc.).
Source: GUS 2011a.
Whereas, the expenditures of local governments on social assistance and benefits have
increased in years 2003-2009. Gminas have been the most burdened with social assistance
tasks, whereas poviats the least.
Gminas have been gaining more tasks over time. The large part of those tasks was financed
by the state in a form of earmarked grants. However, those grants were often lower than the
actual needs in the areas with the highest fixed costs such as education and social assistance
(GUS 2010). This revealed territorial inequalities, since units with higher own incomes22
21
Benefits paid to people resigning from work to take care for a disabled family member. Those people have
their social security contributions covered by the state. 22
Gminas’ own budgets are based on their share in local PIT and CIT. In 1998 (before the territorial reform) it
was 18% and 4% respectively, in years 1999-2003 27.6% and 5%, whereas from 2004 39.34% and 6.71%.

50
were able to better secure the needs of their citizens by supplementing more generously
transfers from the state (Herbst, Herczyński, Levits 2009; Zalewski 2005). Eventually, the
possibility to contribute to the guaranteed part of temporary allowance proved to be a rarely
used instrument of local social policy (for details see 4.1) available mostly to the richest
gminas (010). As one of our interlocutors emphasises – gminas became so afraid of growing
cost, that they hardly developed the ability to look at social policy as an investment, which
would bring returns in the future:
“(…) as we know, local governments are now oversensitive as far as new tasks
are concerned. They find it hard to look at activities as something which is
costly, but – if everyone makes an effort – it will bring returns for the gmina in
the overall settlement.” (015).
Meanwhile, poviats were given an ambivalent role in labour market policy by the reform. On
the one hand, they became the administrative level at which local PES (for details see section
3.2.1) – responsible for local employment policy – operate. On the other, the financing of the
latter as well as the legal framework in which they function was still in the hands of the
central government. Therefore, poviats had, in fact, limited competences in shaping labour
market policy. They could create special programmes addressed to employers or chosen
groups of the unemployed from their own resources – but those were rather low23
(Matela,
Piotrowski, Staręga-Piasek, Wóycicka 2006).
Figure No. 9: Local governments’ expenditures on social assistance and benefits in years 2003-2009 in millions PLN.
Note: Main expenditures of local units: 1) gminas: family benefits, alimony fund benefits, social security contributions for various types of beneficiaries, social assistance offices, social assistance allowances, housing benefits; 2) poviats: care and educational facilities, social assistance homes, foster families; 3) cities with poviat status: family benefits, alimony fund benefits, social security contributions for various types of beneficiaries, social assistance offices, social assistance allowances, social assistance homes.
Source: GUS 2010.
23
Unlike gminas their own incomes from 2004 equalled only 10.25 % of PIT and 1.4% of CIT
0
10000
20000
30000
40000
50000
60000
70000
80000
2003 2004 2005 2006 2007 2008 2009
36595 40942
45838
53180 56074
62893
70003
11450 12445 13891 15593 16070 18115 21156
28197 32137
36492 41237
45877 51172
56201
Gminas (LAU 2) Poviats (LAU 1) Cities with poviat status (LAU 1)

51
The dynamics of relations between the central and the local seems to be impeding
implementation of AI reforms and changes in social policy in general. No effective model of
cooperation between those levels has been developed over the years, which would allow joint
shaping of the policy. As some of our interlocutors suggest the Joint Commission of the
Government and the Local Governments – the main body, where those sides meet – is used to
discuss detailed legal arrangements not overall policy concepts. Above that a similar patterns
are being reproduced: local governments often concentrate on local – and thus particular
matters; they also express their fears of being burdened with new costs and, if the pressure
from their side is sufficient, particular instruments are included in legal acts as only optional.
Innovations are sometimes introduced in legal acts just as a possibility – and some of them
are later changed into obligations.
3.4. The EU’s influence on national-level policy development
Concepts developed or promoted at the EU level, such as “active inclusion” or “flexicurity”
do not seem to trigger any actual public or political debate (none of our interlocutors even
referred to it if not asked) and are used as slogans, rather than actual building blocks of social
policy. Yet, EU’s influence on national social policy should not be entirely disregarded,
because of relatively short presence of Poland in the EU and the significant amount of money
transferred from its funds.
3.4.1. Influence of the EU accession
Although social policy was not the area of strong pressure on the harmonisation of law in the
pre-accession period, some influence on national-level policy development might have been
identified. The then Minister of Economy and Labour – Jerzy Hausner24
– used the
perspective of future implementation of the open method of coordination (OMC) as an
occasion for broader discussion on poverty and social inclusion. National Social Inclusion
Strategy 2004-2010 (NSIS)25
– a strategic document – was prepared in 2003, engaging broad
scope of experts. Working groups consisting of officials from central administration and local
governments, experts in the field of social policy and statistics and third sector partners were
established. They developed various expert evaluations, which became the foundation for
indicating NSIS priorities to be realised until 2010. Except for dealing with definitional issues
(how to understand social exclusion, social cohesion and poverty) the strategy referred to
issues such as changes in family structure (especially situation of numerous families and
single parents), groups at greatest risk of poverty, educational inequalities (especially access
to preschool).
The more general function of NSIS was “Poland’s joining in the implementation of the
Lisbon Strategy as regards the modernisation of the European Social Model”26
(Hausner
2007). The strategy was at first used as a reference point in the monitoring of National
Strategy Reports (NSR) prepared in the framework of the “Social” OMC. But after some time
it lost its impact and at the end no evaluation or assessment of its realisation was prepared.
According to Golinowska (2008: 124-125), the new right-wing government led by Law and
24
Jerzy Hausner represented a left-wing party – Democratic Left Alliance. 25
Unlike Joint Inclusion Memorandum and National Action Plan for Social Inclusion it was a non-obligatory
document prepared in the framework of Social Agenda 2000. 26
According to the then minister of economy, labour and social policy from the Democratic Left Alliance Jerzy
Hausner, who initiated the works on NSIS.

52
Justice changed priorities of social policy (in National Development Plan 2003-2007) putting
support of people in post-productive age and vocational integration of migrants first. The
next, more liberal, government of Civic Platform did not come back to it at all. The
interviews confirm that the strategy lost its importance and is currently perceived by
representatives of public administration as one of the many which occurred in the past.
However, some of the respondents representing the social side express regret, that it “faded
away”.
Years 2003-2004 were also crucial because of the reforms from the area of social policy, and
labour market policy (see 2.1.2). However, EU accession’s influence on their construction is
not direct. It may be classified more as a window of opportunity used to make changes in
favour of active instruments, considering that Poland could count on significant support from
the ESF. Large investments in human capital were made thanks to those resources –
especially in the form of trainings for the unemployed and activation programmes for the
socially excluded. Yet, doubts have been raised whether the money was effectively spent.
Another important issue, which was to some extent influenced by the accession, was the
guaranteed minimum income (GMI) (Staręga-Piasek, Wóycicka 2009; Szarfenberg 2009).
The first plans to introduce it date back to the beginning of the 1990s but were subsequently
dropped. The subject came back in 1998 – in the context of the National Programme of
Preparation for the EU Membership in which implementation of the 92/441/EEC directive
(on common criteria concerning sufficient resources and social assistance in social protection
systems) was considered. The idea to establish GMI was soon rejected attributing the
decision to insufficient budgetary resources (see Szarfenberg 2009: 9). At the end, quasi
GMI27
was introduced with other legal changes in 2004. Some of the experts emphasise the
role of EU accession and the “Social” OMC as stimuli to do that (Staręga-Piasek, Wóycicka
2009).
3.4.2. Post-accession period
The initial mobilisation of the policy makers, experts and representatives of third sector to
prepare for the implementation of the OMC could be observed also on the example of the
first National Strategy Report (2004-2006), which had been prepared nearly simultaneously
to the already mentioned National Strategy for Social Inclusion 2004-2010. However, the
further this process went, the less political significance it had (see Wóycicka, Zieleńska
2009).
Introduction of the OMC had some influence on the distribution of power among national
actors. Despite the decreasing political importance of the OMC, the inclusion of various
partners (experts, third sector partners) became permanent at the national level – which was
an improvement in comparison to the previous years. Every time a National Strategy Report
was prepared, they were at least invited for consultation. But – what should be emphasised –
their influence on the National Strategy Reports’ content was limited to the possibility of
giving remarks. Whether their point of view was included in the document was up to officials
from the Ministry of Labour and Social Policy. Apart from that, they were not taking part in
the process of monitoring of its implementation (Wóycicka, Zieleńska 2009).
The employees of public administration point out the gradual and indirect positive influence
of the OMC (and other EU policies) on the learning process. It means that some reservoir of
27
Only 50% of the amount is guaranteed and criteria other than financial play a role.

53
knowledge about different systemic arrangements has been gathered as well as inspiration has
been taken from another counties in the area of policy planning:
There is no direct translation, but there are two ways. Some knowledge base is
cumulated and may be always used. When some programmes or strategies are
being prepared… when someone has been participating in some form of
sharing knowledge or OMC – I have seen it numerous times that some things
were included in those documents. (…). And we are facing a huge change in
employment policy (…). I will be a deep systemic change. And (…) most of the
principal elements of it were seen elsewhere. (05).
The new social agenda connected to Europe 2020 strategy has so far had an ambiguous
impact on the social sphere. On the one hand, the fact that reduction of poverty became one
of its goals influenced the content of National Reform Programme and its actualisations. In
result, combating poverty became a target linked to the economic development. Therefore,
strengthening of its position in comparison to the framework of the Lisbon Strategy and
against the background of other policies may be assumed. On the other hand, the social
dimension is addressed very narrowly in comparison to National Strategy Reports. Whereas
National Social Report does not play a role of a broader goal-setting strategy, what seems to
be disappointing especially for the respondents representing NGOs.

54
4. The National Policy Framework for Active Inclusion
4.1. The structure of minimum income rights
After the EU accession legal changes have been focused on modifying the already introduced
arrangements and no paradigm alterations have occurred. The details will be discussed below.
The most important direction of changes seems to be the increasing awareness of the key role
of childcare in the activation of women, even though the designed instruments are not
entirely functional.
Despite the introduction of the so called guaranteed part of the minimum income (for details
see next paragraph), its recognition as a social right – especially among social workers – is
low. The growing number of MIP claimants aware of their rights is noticed in social
assistance – which is not appreciated. Those, who make claims for MIP transfers using the
legal right to appeal, are classified as abusing the system. People who subdue to the decisions
of social service are appreciated as “good clients”. Such approach is definitely connected to a
wide range of MIP claimants, who are collecting financial support for years – and no
activation measures work in their cases.
Finally, it is important to mention, that there are reform plans in the area of labour market
policy and social assistance. In the first case, a change towards more market-based and
individualised system of activation and job agency, with more emphasis put on the
cooperation with the employers is to be introduced. In the second case, more conditionality
instruments for social assistance are to be designed and more space for contracting out is to
be given. The latter elicits concerns of the NGOs: they express doubts whether quality of
services is to be treated as the main criterion of selection, instead of a price – as it is now.
Moreover, there are also plans to change the system of setting the income criterion for MIP
into a yearly and based on inflation. However, it is still to be based on the subsistence
minimum, not the social minimum. Both reforms are in line with the government’s approach
to social policy – to make it more adjusted to the labour market demand and to give more
incentives to MIP clients to seek employment. The agenda for their implementation is not yet
known.
4.1.1. Institutionalisation
MIP consists of two basic types of benefits28
– temporary allowance and earmarked
allowance. Temporary allowance is a means-tested basic income support for people in
economically productive age. From 2004 part of it is guaranteed by the state provided that a
person fulfils income criterion and an additional criterion such as unemployment,
homelessness, disability, etc., entitling to benefits (see the list in the next section). It is
financed from the central budget to the level of 50% of an income gap: the money is
transferred to the local level (gmina) in the form of earmarked grant and paid by local SAO.
Local governments may decide to supplement it from their own resources – but the
opportunity is rarely used (see Figure 10).
28
There is also a third type of benefit, which is to some extent connected to MIP – a permanent allowance. It is
an obligatory benefit paid to people unable to work due to age or disability, whose incomes are below the legal
criterion. It will not be discussed in the report, because it is beyond the scope of this study.

55
Figure No. 10: State’s and gminas’ expenditures on temporary allowance in years 2004-2011
Source: Own calculations on the basis of MPiPS 03 reports (part 2B).
Figure No. 11: Total expenditures on temporary allowance and expenditures on temporary allowance with
unemployment as an additional criterion
Source: Own calculations on the basis of MPiPS 03 reports (part 2B).
The high increase of state’s expenditures between 2004 and 2005 was most probably
connected to two factors: on the one hand, the new law was introduced in 2004 obligating the
state to cover temporary allowances to the level of 20% and 15% of an income gap of –
respectively – one-person and multi-person household, but it was in force only from the
beginning of May (i.e. only 7 months of that year). On the other, the guaranteed level was
higher in 2005 (30% and 20% respectively). Similarly, the guaranteed level was increased in
years 2006-2007 to 35% and 25% respectively. Whereas the decrease in years 2006-2007
(when the guaranteed level was the same) was probably the effect of a visible decrease in
unemployment levels, since unemployment was the most common reason (additional to
income) for which temporary allowances were guaranteed (see Figure 11). The increase of

56
states’ expenditures and the decrease of gminas’ expenditures from their own budgets
beginning in 2007 was probably a result of increasing the amount of temporary allowance
guaranteed by the state to 50% of income for all households.
The respondents expressed doubts whether temporary allowance should be considered a
guaranteed minimum income. Two arguments were put forward. First of all, more than just
an income criterion must be met if a person is to receive it – and some criteria are
discretionary, i.e. the decision is reserved to a social worker (04, 07, 010). Thus, the right
seems not so obvious. Second of all, the guaranteed amount of it is so low, that it may hardly
be classified as an actual income support (04).
The number of families collecting temporary allowances decreased in years 2004-2011, with
a peak in 2005. The main reason for that was the improved economic situation –
unemployment rate dropped from 17.6% in 2005 to 9.5% in 2008. The gradual increase in
number of families collecting temporary allowance in years 2009-2010 was simultaneous
with the increase of unemployment rate to 12.1% in 2009 and 12.4% in 201029
. However, the
relatively slow rise in number of such families and a slow decrease between 2010 and 2011 is
most probably connected to the constant (not changed for six years) low income threshold,
which dropped in 2011 below the subsistence minimum.
Figure No. 12: Number of families receiving temporary allowance in total and because of unemployment (as a second
criterion) in years 2004-2011
Source: Own calculations on the basis of MPiPS 03 reports.
Earmarked allowance is a cash or in-kind benefit, which may but does not have to be granted
to a person or a family for a certain purpose. It has to be motivated by the existential need
(food, medicine, medical treatment, heating, etc.) or the need to support the self-sufficiency
(finance the cost of commuting to work, etc.). It may be used to enable a realisation of a
social contract. Earmarked allowances are financed by local governments and thus depend on
their financial situation and policy priorities.
29
Data from the Central Statistical Office: http://www.stat.gov.pl/gus/5840_677_PLK_HTML.htm
57
According to the law, from 2004 the income criterion for allowances is to be valorised every
three years. However, in 2009 the government decided not to increase it because of the
economic crisis. In result, the legal poverty threshold dropped below the subsistence
minimum, which limited the number of people eligible for social assistance benefits (GUS
2011b).
4.1.2. Benefit structure and generosity
Temporary allowance
Eligibility criteria
People and families are formally eligible for temporary allowance if they fulfil income
criterion and at least one additional criterion from those defined by law30
:
unemployment,
orphanage,
homelessness,
disability,
chronic illness,
domestic violence,
human trafficking,
need for the protection of maternity (and numerous families),
helplessness in the performance of up-bringing functions and in running a household
(especially in case of single-parent or numerous families),
problems of young people leaving childcare facilities with adjustment to everyday life
requirements,
need for inclusion of foreigners with refugee status or with right to supplementary
protection (ochrona uzupełniająca)31
,
adjustment problems after leaving prison, alcoholism and drug addiction,
random incident or crisis situation, natural or ecological disaster.
However, only in four of those cases payment is – in practice – obligatory: if someone is
unemployed, chronically ill, disabled or awaiting an administrative decision about some other
type of benefit (Wóycicka 2009; Szarfenberg 2009). It is probably connected to the fact that
those particular situations have administrative confirmation (from local PES, health care
services, commission certifying disability, or public administration). In other cases the
decision is left to the discretion of social services as it is based on social interview performed
by a social worker.
Amount
The amount of temporary allowance is computed on the basis of the difference between the
income criterion for single or multi-person household and the income of an actual person or
family. Income criterion from October 2012 equals 546 PLN for one person household and
456 PLN for multi-person household (see Table 17).
The guaranteed minimum payment in 2012 equals 50% of individual income gap, but no less
than 20 PLN and no more than 418 PLN – unless the local government decides to supplement
30
The act on social assistance from 2004. 31
It is granted to those people who were refused the refugee status, but coming back to their country of origin
could result in putting them in danger.

58
it from its own budget, which is hardly the case. The maximum transfer per person is, thus,
approximately seven times lover than the average wage and three times lover than the
minimum wage. In result, the larger family is and the lower income it has, the more
significant MIP becomes. For example four-persons family with no income, may potentially
be better off on temporary allowance than one-earner four-persons family on minimum wage
(see 3.1 and 3.2 – discussions over minimum pay and motivation to work).
Table No. 17: Income criteria in the period of 2004-2012.
Year in which defined One person household in
PLN
More than one person in a
household in PLN
2004 461 316
2006 477 351
2009 477 351
2012 (1st of October) 546 456
Sources: Act on social assistance form 2004; Regulation concerning verification of income criteria and cash benefits from social assistance from 2006, 2009 and 2012.
Manner and frequency with which benefit(s) is/are paid
Temporary allowance is paid monthly, in cash32
. The local SAO determines a period for
which it is granted on the basis of own evaluation of a particular situation. This makes the
process discretionary and dependent on the policy of this institution or/and local authorities.
As shown by the recent quantitative research conducted among social workers (Rymsza
2011), over 60% of those employed in local SAOs agree that the period for which the
benefits are granted should be limited to the time necessary to up-date or up-grade vocational
skills – which reveals strong up-skilling approach.
Earmarked allowance
Eligibility criteria
In general, the same eligibility criteria apply to earmarked allowance and to temporary
allowance – a person or a family cannot exceed the same income criterion. However, there is
also a possibility to grant an earmarked allowance to a person or a family which exceeds the
income criterion. If it is due to the disaster which results in losing possession it will not have
to be paid back; and if it is a result of temporally difficult situation it may be granted under
the condition of paying it back. Moreover, in case of more global natural disasters such as
floods, earmarked allowances are paid by the government and may be relatively high (even
20 000 – 30 000 PLN per family).
Amount
The amount depends on the situation. The minimum and maximum payment or value is not
set. Since the costs are – in most cases – covered by local authorities from the lowest
administrative unit (gmina) it depends on its own income and the approach to social policy.
Manner and frequency with which benefit(s) is/are paid
32
It is unclear whether it may be transferred into bank accounts.

59
The manner and the frequency in which the benefits are paid are not regulated. There are
probably different institutional practices concerning that.
Family benefits
As already mentioned, families with low income (closer to social than subsistence minimum)
may count also on receiving family allowance (2.3). It is granted to all families fulfilling the
due income criterion (no matter whether they are working, unemployed, MIP clients). The
income threshold was increased in November 2012 – from 504 to 539 PLN for regular
families and from 583 PLN to 623 PLN for families with the disable child. Whereas from
November 2014 it is projected at the level of 574 PLN and 664 PLN respectively.
Families receiving temporary allowance from social assistance are in general entitled to
family allowance, since the income criterion in this case is higher than the poverty threshold.
However, in some cases receiving family allowance may result in exceeding the income
criterion for temporary allowance33
.
Family allowances are paid for each child below 18 (or below 24 if he/she continues
education). The amounts vary with age and number of children and are higher in case of
disabled children.
Box 4: Family benefits
Family allowances:
77 PLN for a child under 5
106 PLN for a child between 5 and 18
115 PLN for a child between 18-24
There are also various kinds of benefits available to families entitled to family allowance
(i.e. fulfilling the income criterion):
Childcare leave benefit (400 PLN): supplement to family allowance paid during childcare
leave (an unpaid leave which may be taken after parental leave) in most of the cases for
maximum 24 months.
Single-parenting benefit (170 PLN or maximum 340 for all children)
Numerous families benefit (80 PLN for third child and next children)
School benefit: paid at the beginning of a school year (100 PLN per child) Source: http://www.mpips.gov.pl/wsparcie-dla-rodzin-z-dziecmi/swiadczenia-rodzinne/
The fact that the thresholds for family benefits have not been valorised for 8 year resulted in
immense reduction in number of families eligible for support. As emphasised in the
interviews – the time of economic growth was not used to rise the financial support:
33
For example one earner family with net income of 1700 PLN consisting of two adults and two children (under
5 and between 5 and 18) would be entitled to temporary allowance and family allowance. Yet, after receiving
family allowance it would lose the entitlement to temporary allowance, because of too high income. It is
important to emphasise that this would in practice mean losing approx. 60 PLN (15 per head), which is less than
family allowance for child under 5 (see box 4).

60
This period 2007-2008-2009 was good for the economy. The wage went up. But
income criteria did not go up. And the number of families eligible dropped
from approximately 5 million to approximately 2.5-2.6 million.(08).
Thus, the government’s approach towards support for low income families was similar to this
concerning social assistance support – in this case also the argument of the incoming crisis
was used.
Housing benefits
Housing benefits are means-tested benefits covering partly the costs of housing. They are
granted to persons and families below a certain income criterion (higher than the poverty
threshold): not more than 175% of the lowest pension for a single-person household and not
more than 125% of the lowest pension per head for the multi-person household34
. It is paid
provided that the floorage of the flat/house does not exceed the norm defined by law. The
level of allowance equals the difference between real costs of flat of certain surface and 10-
15% family income (depending on income per person). The temporary and earmarked
allowances from social assistance (for explanation see section 3.1.1) do not count as income
when housing benefits are decided. From 2005 they are financed by local units.
4.1.3. Benefit administration
Temporary and earmarked allowances are administered by local SAOs, which operate at the
level of gmina (LAU 2)35
. Every claimant is assigned to a case worker, who is responsible for
both – social work and assessment of eligibility for allowances on the basis of social
interview, but not always for making ultimate decision (sometimes other employees are
responsible for that). As mentioned above, the process is to some extent discretionary. First
of all, the procedure of counting income of a person or a family is not entirely transparent.
Generally, it comes down to the net payments received in the previous month (income minus
PIT, health insurance and social insurance) – reduced also by maintenance paid for someone,
if this is the case. Except from financial transfers and savings also financial situation in
general (e.g. valuable things and real estate) is assessed by a social worker – if he or she
decides that a person or a family may overcome their difficulties on their own thanks to their
resources, allowances may be denied to them. This provision is aimed at counteracting cases
in which people have unregistered incomes (e.g. from illegal work) and decide to apply for
allowances. However, it generates the risk of unequal and unjust treatment, which may be
difficult to act against because of lack of clear regulations. Second of all, some of the
additional criteria for allowances (see above) also leave space for arbitrary decisions.
Opinions of our respondents were divided in this case. On the one hand, especially those
representing public administration emphasised that the criteria are broad enough to include
every person fulfilling income criterion (03, 010). On the other hand, some of the respondents
considered it a field for manipulation: it gives authorities the opportunity to reduce number of
claimants (04, 07). Recommendations from the side of some politicians and social partners to
abolish the additional criteria have not been accepted so far. This may suggest the intention to
leave the “contingency plan” in case of too high number of claims.
34
The lowest pension in 2012 equals 799.18 PLN. 35
Other benefits are also administered by gminas, however, the organisational arrangements differ. Sometimes
all tasks are appointed to local social assistance offices.

61
Claimants have the possibility to appeal to the local government boards of appeal, if
allowances are not granted to them. According to a recent qualitative study of social
workers36
(Dudkiewicz 2011), this possibility has been used more often in recent years –
which indicates increasing awareness of social rights among clients. Social workers link it to
their changing profile – there are more often well-educated unemployed who lost good jobs.
What is striking, those clients who appeal are not evaluated positively – they are classified as
abusing the system. The worst group are those who do not want to agree to conditionality
(signing a social contract) and appeal – those are characterised as “crafty fellows”. The most
appreciated are the so called “silent clients”: modest, taking help with gratitude – which is
often the case with elderly and disabled people.
Case of long term unemployed
Unemployment is one of the reasons for granting temporary allowance to the guaranteed
level. LTU will probably fulfil also the income criterion, because they do not have the right to
unemployment benefit. However, if they live in a multi-person household, which has higher
incomes per capita then the income criterion, they will not be eligible for temporary
allowance.
Case of single parents
SP are more prone to the discretionary decisions of social assistance. Even if they fulfil the
income criterion, there still has to be a second reason for granting the benefit. Therefore, they
would have to be classified either as helpless in the performance of up-bringing functions or
in need of protection due to parenthood37
- which is indicated by law as the main reason why
allowances may be granted to SP – or some other reason from the mentioned above would
have to be acknowledged. That matter is settled by a social worker on the basis of social
interview. In addition, SP may count on a single-parenting benefit if they fulfil income
criterion for family allowance.
Case of working poor
WP are in the most disadvantages situation. Even though they may fulfil the income criterion,
the second reason for granting the allowance is not so obvious and depends on the situation of
particular person or family and the evaluation of social worker.
4.2. The activation of minimum income claimants
4.2.1. Personalisation
The main issues regarding personalisation are connected to the so-called “caseload” (i.e.
number of cases processed by one social worker). In the middle of 2000s a legally binding
standard was introduced indicating that the proportion of 1 social worker per 2000 inhabitants
of gminas should be kept38
. On the turn of the new decade this proportion was supplemented
with another one, namely 1 social worker should supervise no more than 50 cases of
families39
. It was probably connected to the fact that in some localities even if the first
proportion was retained, the number of families "processed" by one social worker was
36
6 Focus group interviews were conducted with lower and middle rank employees of local social assistance
offices. 37
It is striking that the Act on social assistance defines it as need of protection of maternity, which reflects
traditional vision of family depicted there. However, we may assume that also single father will be taken into
account, but this has to be verified during the interviews. 38
According to the Act on social assistance from 2004. 39
According to the amendment to the Act on social assistance from 2011 it is to be realised until 2015.

62
considered too high. The official statistics prepared by the Ministry of Labour and Social
Policy on the basis of reports from local SAO and poviat family assistance centres do not
include information concerning the fulfilment of those standards. However, it is possible to
follow it through on the regional level.
Proportions are not always fulfilled at the regional scale (see Table 18), with visible
discrepancies among regions (although, the situation may be diversified at the local level).
The largest number of inhabitants per social worker from local SAO is in Wielkopolskie -
2622 and the lowest in Warmińsko-Mazurskie – 1662. In the former there is also the second
largest number of social worker missing to fulfil the standard (405) and it is outdistanced
only by Mazowieckie with 455 social workers needed. Another indicator – which reflects the
actual caseload more precisely – is the number of families per social worker. Again,
Wielkopolskie is in the worst situation (105 families), whereas only Śląskie is close to the
standard.
Table No. 18: Number of inhabitants and families per 1 social worker from local social assistance office in 2010.
Regions (NUTS II)
Number of
inhabitants
per one
social
worker
Required
number
of social
workers
in local
social
assistance
offices
How
many
social
workers
are
missing to
fulfil the
standard?
Number
of families
per 1
social
worker
Dolnośląskie 2108 1439 74 61
Kujawsko –
pomorskie 1895 1035 87
Lubelskie 1 701 1 076 58
Lubuskie 2 115 506 28 98
Łódzkie 2 015 1 267 9 73
Małopolskie 2 018 1 655 15 60
Mazowieckie 2 421 2 621 455 75
Opolskie 2 491 514 101 82
Podkarpackie 1 905 1 052 78
Podlaskie 1 958 594 73
Pomorskie 2 082 1 120 44 74
Śląskie 1 926 2 318 51
Świętokrzyskie 1 793 633 78
Warmińsko-
mazurskie 1 662 714 87
Wielkopolskie 2 622 1 710 406 105
Zachodniopomorskie 1 826 847 73 Source: Hryniewicka 2010, p. 32.

63
Table No. 19: Number of unemployed per local PES officer in 2011.
Regions (NUTS II)
Number of
unemployed/
unemployme
nt rate
Number of
unemploye
d per one
employee
of local
PES
Number of
unemploye
d per one
job agent
Number of
unemploye
d per one
job advisor
Poland 1 982 676
(12.5%) 98
547 1 238
Dolnośląskie 143 575
(12.5%) 85 449 1 088
Kujawsko –
pomorskie
139 622
(16.9%) 112 618 1 183
Lubelskie 122 441
(13.3%) 103 517 1 212
Lubuskie 59 134
(15.4%) 89 414 1 207
Łódzkie 138 652
(12.7%) 90 504 1 146
Małopolskie 145 094
(10.5%) 102 567 1 307
Mazowieckie 246 739
(9.9%) 117 724 1 486
Opolskie 48 029
(13.3%) 87 480 1 232
Podkarpackie 146 208
(15.7%) 114 735 1 700
Podlaskie 65 920
(14.1%) 106 610 1 373
Pomorskie 106 667
(12.4%) 97 544 1 285
Śląskie 186 187
(10.1%) 84 474 1 029
Świętokrzyskie 83 217
(15.3%) 91
452 1 125
Warmińsko-
mazurskie
107 333
(20.1%) 105 574 1 376
Wielkopolskie 134 954
(9.2%) 87
505 1 080
Zachodniopomorskie 108 904
(17.5%) 108
570 1 224
Source: MPiPS 2012a, 2012b.

64
Personalisation may also be assessed on the basis of perceptions and opinions of employees
of local SAO40
. According to the quantitative research conducted in years 2009-2010 on the
population of 677 employees and 164 directors of the local social assistance offices 41
excessive caseload is not the biggest problem in this area: 49% of employees indicated that it
is as it should be, and 33.8% stated that they are overburdened. There was also a significant
number of employees having no opinion on that subject – 14.6%. However, lack of space in
the offices to guarantee privacy to the beneficiaries was considered the more severe obstacle
in every day’s work. A separate room to conduct talks and interviews is available only to
15.7% of the employees and 54.1% have at disposal only their own rooms where they have
co-workers. 40.9% from the latter group indicate they cannot guarantee the beneficiaries a
secure situation in which a good relation could be established.
The situation of local PES in terms of caseload is even worse with 98 unemployed per PES
officer, 547 per job agent and 1238 per job advisor on average (see Table 19). There are also
visible discrepancies between regions in this respect. There is no clear pattern behind that:
regions with higher and lower unemployment levels are among those with the highest
caseload. Though the lowest caseload may be found mostly among those with the lowest
levels of unemployment (with the exception of Lubuskie and Świętokrzyskie).
Local PES have the possibility to prepare individual action plans for unemployed persons. It
is obligatory for five groups: people under 25, over 50, without qualifications, without
experience and ex-convicts who did not take up work. In other cases it is only optional – no
priority is given here to minimum income claimants (although some of them may belong to
the mentioned groups). However, considering the fact, that caseload of job advisors and job
agents is very high it seems doubtful whether they have time to do much more than what they
are obliged to.
Finally, reform plans should be mentioned here. According to our interviewees (06), there is
an idea to introduce profiling of clients. Three general categories of clients will be created –
people active on the labour market (temporarily unemployed), people needing support in job
seeking, and people distant form the labour market (long-term unemployed). More
individualised approach is to be offered (better diagnosis of the case) and better targeting of
support – different range of instruments is to be offered to those groups. It is to be achieved
thanks to outsourcing part of these tasks to private job agencies. However, no details are yet
known about how this is to be realised42
.
4.2.2. Conditionality
Social contract is the main instrument of conditionality, which local social assistance offices
have at their disposal. The rules regarding its signature are not sharp. Every time the act on
social assistance mentions it, word "may" is used: social worker "may sign" a social contract
with a person or a family" or social contract "may be used" as a part of social work to
reinforce the activation process. The only specific case mentioned by law concerns
unemployed people directed by local PES to sign a social contract (for details see section
4.3.2.).
40
There is no research available in which the voice of beneficiaries would be included. 41
Olech A., Sobczak, K. Jakość i organizacja pracy w ośrodkach pomocy. Research conducted by the Institute
for the development of Social Services. 42
No official documents have been published yet and our interlocutors were reluctant to reveal the details.

65
In practice, the ways in which the contracts are applied differ among social workers (Rymsza
2011): over 80% of social workers use it in their work. 21.4 % of them consider it a good
standard tool to be used in all cases, 56.7% as a good tool to be used in particular case and
16.9% as generally bad tool. However, when asked how many contracts a year they actually
sing, most of them answer that between 1 and 4 (39.2%).
According to mentioned FGIs (Dudkiewicz 2011), social workers raise two problems
connected to social contracts. First of all, they are very formalised and their explanation to
beneficiaries as well as filling out is difficult and time-consuming. Second of all, it is often
difficult to find the “leverage”, which would make a person comply. Yet, it should be signed
only provided that conditionality may be executed (which proves especially difficult with the
addicted). The cases of overruling the offices’ decisions about withdrawing or not granting
allowances by territorial government boards of appeal are interpreted as taking an instrument
of conditionality from hands of social workers. Moreover, the supplementary part of
temporary allowance – which was planned by the legislators as an instrument of putting
pressure on claimants to fulfil social contracts – is rarely used, since most of the gminas do
not grant additional funds to that goal (012).
In cases, when a social worker decides that a person or a family should sign a social contract
it will most certainly concern also active job search: regular visits in local PES, participation
in workshops about job-search if available, etc. However, people who signed a social contract
are automatically crossed out from local PES registers, which excludes from those forms of
activation reserved for the registered unemployed (for details see next section). This solution
– which leads to reduction of official levels of unemployment (those people are no more in
statistics) – was questioned by employment officers as well as social assistance employees.
As shown in the report evaluating the cooperation between employment and social assistance
institutions, this regulation is – in some cases – perceived as obstacle towards activation (IBC
GROUP and SMG/KRC 2009).
Social contracts give not only obligations but also some privileges. In many cases taking up
employment may result in loosing benefits, e.g. if income of a person or a family starts to
exceed the income criterion. Yet, this does not necessarily apply if a person or a family
signed a social contract. In that case social services may decide to complete its payment
(regardless the current income) till the end of the period for which it was granted, but no
longer than for 2 months.
Box 5: Losing benefits
Lack of cooperation with a social worker,
Refusal to sign a social contract,
Breaking the social contract,
Unjustified refusal to take up employment,
Unjustified refusal to take up (or giving up) training, apprenticeship, vocational training,
intervention works, public works, socially useful works,
Unjustified refusal to undergo detox treatment. Source: Act on social assistance from 2004 with amendments.
The most drastic form of conditionality are sanctions such as reduction, suspension or
withdrawal of benefits. Some of the rules regarding it are not transparent and leave the

66
judgement to the discretion of a social worker: e.g. how to define unjustified refusal of
training or lack of cooperation with social worker (see Box 5).
Allowances may be suspended or withdrawn also if a social worker decides that they are
being wasted. However, if well-being of a person or a family was to be put at risk in-cash
allowance could be changed into in-kind. There is also a practice to ban a family member
responsible for waste (e.g. because of alcoholism or drug abuse) from taking.
4.2.3. Service provision
Employment services
Since 2004 the list of unemployed from the vulnerable groups was extended to MIP
beneficiaries who finished social contracts, mothers who did not take up employment after
childbirth, single parents with children up to 18 years of age (instead of 7), ex-convicts,
people without job experience and secondary education. Those groups gained privileged
access to ALMP instruments. In practice, it depends on the situation on local labour market,
places left in various activation forms and number of local programmes (e.g. possibilities of
social employment).
Box 6: Vulnerable groups
Vulnerable groups mentioned by the Act on employment and labour market institutions:
Unemployed below 25 year of age,
Long-term unemployed, unemployed who finished the social contract, women who did
not take up work after childbirth,
Unemployed over 50 years of age,
Unemployed without vocational skills, job experience or secondary education,
Unemployed single parents with at least one child under 18,
Unemployed ex-convicts
Unemployed disabled people
Source: Act on employment promotion and labour market institutions from 2004 with amendments.
As far as employment services are concerned MIP beneficiaries who are registered as
unemployed may take part in various ALMP programmes depending on whether they belong
to a vulnerable groups or not. The possibilities are presented in the table blow (Table No. 19).
Participation in ALMP – with the exception of job agency and counselling – is tight to
additional benefits. Their amounts vary from 20% to 120% of unemployment benefit.
Apart from the above, MIP beneficiaries – as well as all unemployed – may benefit from job
agency offered by local and regional PES (also in the framework of EURES) and job
advisory. There is also a possibility to apply for financial resources for starting up a business
– but the money for it is often scarce (it depends on the policy of a poviat).

67
Table No. 20: Main ALMP instruments delivered by local PES
Type of
measure
Name of a
measure
Target groups
On-the-
job
training
Apprenticeship Before 2009: young people (under 25 or aged between 25 and 27 and having
finished their tertiary education less than a year before)
After 2009: all the vulnerable groups
Vocational
preparation in
the workplace
(changed into
vocational
education of
adults in 2009)
Before 2009: all vulnerable groups of unemployed except the young people
After 2009: all unemployed and some additional groups (miners receiving special
benefits; participants of Social Integration Centres or individual integration
programmes; reserve soldiers; people receiving special training benefits)
Training Training Before 2009: all unemployed
After 2009: all unemployed and other groups (workers during notice period
dismissed for reasons relating to place of work; people employed in a bankrupt
company; miners receiving special benefits; participants of Social Integration
Centres or individual integration programmes; people receiving special training
benefits; farmers or reserve soldiers seeking for employment outside the
agriculture)
Others Co-financing
postgraduate
studies (up to
300% of
average salary)
After 2009: all unemployed and other groups (workers during notice period
dismissed for reasons relating to place of work; people employed in a bankrupt
company; miners receiving special benefits; participants of Social Integration
Centres or individual integration programmes; people receiving special training
benefits; farmers or reserve soldiers seeking for employment outside the
agriculture)
Loan for
covering
training costs
without
interests rate
(up to 400% of
average salary,
18 months for
pay back)
All unemployed
Scholarship
for continuing
education in a
upper-
secondary
school for
adults
The unemployed without qualifications.
Refunds of
partial costs of
training of
employees,
provided that
an employer
has established
a training fund
in a company.
Employees.
All unemployed: an unemployed hired in a replacement of employee
participating in training.
Note: Unemployed MIP clients who sign a social contract lose the status of a registered unemployed and have no access to any of the abovementioned instrument.
Source: Act on promotion of employment and labour market institutions from 2004, with the amendment from 2009; WP2 report, Localise.
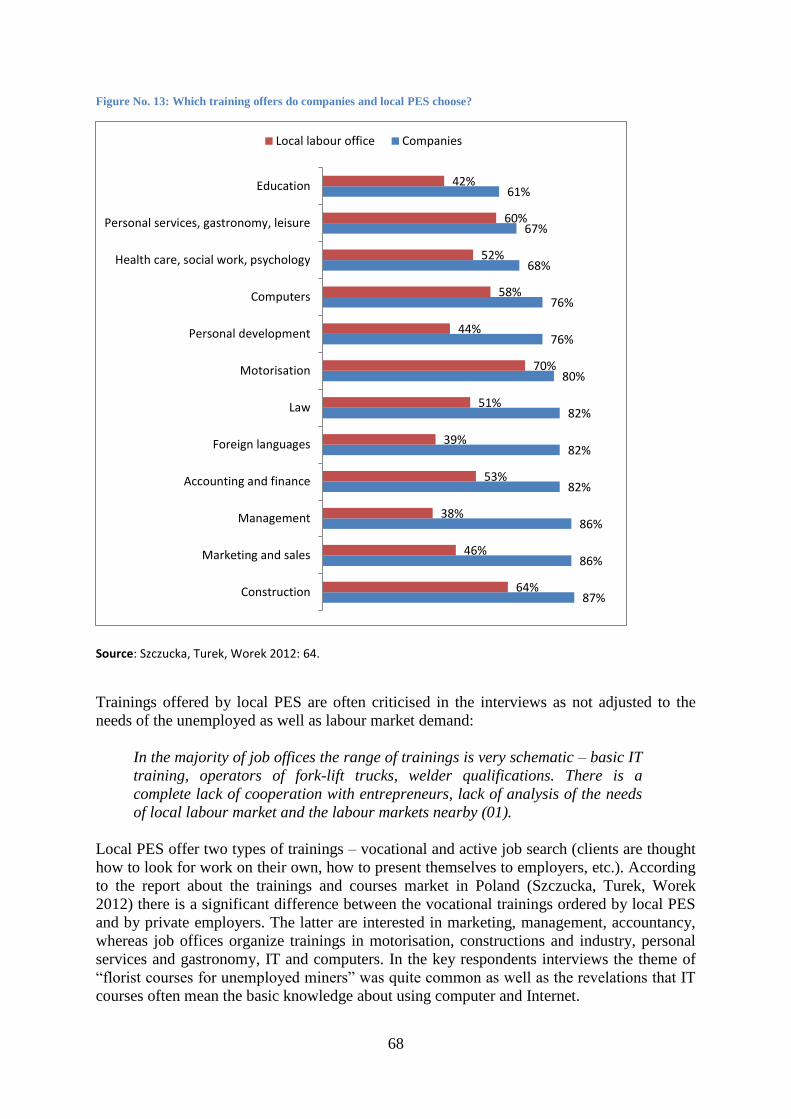
68
Figure No. 13: Which training offers do companies and local PES choose?
Source: Szczucka, Turek, Worek 2012: 64.
Trainings offered by local PES are often criticised in the interviews as not adjusted to the
needs of the unemployed as well as labour market demand:
In the majority of job offices the range of trainings is very schematic – basic IT
training, operators of fork-lift trucks, welder qualifications. There is a
complete lack of cooperation with entrepreneurs, lack of analysis of the needs
of local labour market and the labour markets nearby (01).
Local PES offer two types of trainings – vocational and active job search (clients are thought
how to look for work on their own, how to present themselves to employers, etc.). According
to the report about the trainings and courses market in Poland (Szczucka, Turek, Worek
2012) there is a significant difference between the vocational trainings ordered by local PES
and by private employers. The latter are interested in marketing, management, accountancy,
whereas job offices organize trainings in motorisation, constructions and industry, personal
services and gastronomy, IT and computers. In the key respondents interviews the theme of
“florist courses for unemployed miners” was quite common as well as the revelations that IT
courses often mean the basic knowledge about using computer and Internet.
87%
86%
86%
82%
82%
82%
80%
76%
76%
68%
67%
61%
64%
46%
38%
53%
39%
51%
70%
44%
58%
52%
60%
42%
Construction
Marketing and sales
Management
Accounting and finance
Foreign languages
Law
Motorisation
Personal development
Computers
Health care, social work, psychology
Personal services, gastronomy, leisure
Education
Local labour office Companies
69
Vocational trainings offered by local PES and financed from Labour Fund vary in terms of
number of participants, potential duration, types of credentials to be gained (either specialist,
such as license for fork-lift trucks, license of welder or general, such as certificate from the
Ministry of Labour and Social Policy confirming that a person has finished a particular
course) as well as the entry requirements43
. In general, trainings are not targeted to specific
vulnerable groups – entry requirements refer to the level of education (e.g. at least secondary,
vocational secondary, etc.), acquired licenses (e.g. driving license) and health (lack of
counter-indications for particular vocation). However, there are also more complex
vocational activation projects implemented in the framework of Operational Programme
Human Capital 2007-2013 by different institutions (e.g. local PES, local SAO, NGOs) which
are directed to particular vulnerable groups (long-term unemployed, mothers returning to
work after childbirth, unemployed over 50, etc.). They are often long-term and offer a variety
of activities – not only vocational training, but also psychological support, cultural activities,
medical check-ups, etc.
To sum up, most of the services are aimed at vocational activation – the wider understood
social inclusion is considered just as support to this primary goal. Because of the difficult
situation on many local labour markets (deficit of job offers) activation is set rather on up-
skilling than work first.
Single parents
Unemployed single parents belong to a vulnerable group and are entitled to all ALMP
instruments. The main impediment to their activation is maintaining the work-life balance,
i.e. securing access to childcare.
Long-term unemployed
Long-term unemployed are eligible for all forms of activation programmes directed to
vulnerable groups (see Table No. 20). Moreover, the percentage of LTU who participated in
projects financed from EFS has increased between 2007 and 2010 from 25% to 34.5%44
.
In practice, LTU are considered a difficult group to activate (06, 016). In 2007, the activity
directed to LTU (1.3) in the framework of the previous operational programme based on ESF
financing (Sectorial Operational Programme Development of Human Capital 2004-2006) was
realised only in approximately 50%. It was justified by the low motivation of the LTU to
participate in ALMP instruments and to complete it and the general reluctance of employers
to employ this group45. Officers of local PES sometimes refer to LTU as “difficult” clients –
their come back to labour market seems troublesome enough in time of economic prosperity,
not to mention bad economy. This problem is acknowledged also by NGOs.
43
There are no national data concerning trainings. However, on the basis of the plan of trainings for 2013 in
local PES in Wrocław we can say that: 1) the number of participants varies between 24 and 70 (150 for job
search trainings); 2) the number of hour varies between 40h (crane operator) and 624 (office management with
English classes and practices). 44
Data from:
http://www.efs.gov.pl/AnalizyRaportyPodsumowania/poziom/Documents/sprawozdaniePOKL2007r.pdf and
http://www.efs.gov.pl/AnalizyRaportyPodsumowania/poziom/Documents/Sprawozdanie_PO%20KL_2010.pdf. 45
Data from
http://www.mrr.gov.pl/aktualnosci/fundusze_europejskie_2004_2006/Documents/AIR2008_2005doc.pdf

70
Working poor
Working poor are not a group towards which any ALMP instruments from local PES are
targeted, which makes it difficult for them to find a chance for up-skilling:
Working poor have to show great initiative. Many of the courses are available
only for persons economically non-active (013).
Also the access of working poor to trainings is rather limited. Participation in life-long
learning of population aged 25-64 in Poland is below EU27 average - 4.7% compared to
9.5% (Commission of the European Communities, 2009). As for the trainings provided by
employers it is above the EU27 average – 26% compared to 28%(EWCS 2005). However,
most of the trainings are directed to the qualified and long-serving employees and are
provided by larger companies or public sector institutions (EWCS 2005; Kryńska 2009)46
.
Social services
In general, MIP beneficiaries do not have privileged access to any social services. They are
distributed according to the needs of people and families and depend on the decisions of
social workers. Apart from social work, which refers to all the support provided to clients in
order to help them stand on their feet, those services divide into counselling and assistance or
specialised care services. The former includes especially legal, psychological and family
advice. The latter are provided to people, who are not able to perform everyday life activities
by themselves (satisfy living needs, keep social interactions). Those who suffer from complex
illnesses or are disabled are offered specialised services (such as rehabilitation).
In practice, availability of those services depends on the resources of a particular local SAO
(or – in case of cities with poviat status – municipal family assistance centre). Units operating
in the larger cities47
are often able to deliver more services48
(see Szarfenberg 2011).
Social assistance units sometimes implement also the so called Centres of Local Activity49
.
This is a method of work with local community aimed at social inclusion and joint solving of
social problems. It comes down mainly to establishing a system of voluntary work and
organising various support groups and mutual assistance groups, which are directed not only
to those benefiting from social services but the whole neighbourhoods.
Integrated services
As mentioned in the section concerning reforms conducted in mid -2000s (section 2.1),
people in especially difficult situations may also take part in programmes offered by centres
of social inclusion or clubs of social inclusion – if such institutions are available in their
localities. Their programmes often combine services aiming at increasing vocational skills or
on-the-job trainings with various forms of counselling and group work. However, as shown
by the research, availability of those institutions is rather low50
(Rymsza 2011).
46
Cited after WP2 report, Localise. 47
Those are the cities with poviat status – realising the functions of two administrative levels (NUTS II and IV). 48
In 2011, the average number of services offered by local SAO (LAU 2) was approximately 10, whereas
municipal family assistance centres (LAU 1) approximately 31 (Szarfenberg 2011). 49
Its existence depends on the decision of a particular unit and the policy of local authorities. 50
According to the data of the Ministry of Labour and Social policy there are currently 70 Centres for Social
Inclusion.
71
Developments in family policy
Answering the social need, European Commission demands, as well as the outcomes of
control conducted by Highest Chamber of Control (NIK 2011), which underlined that the
childcare is strongly insufficient in Poland, the nursery act was introduced in 2011. In
governmental strategy “Poland 2030” presented in 2010 women’s activity on labour market
was viewed as unquestionable social phenomenon that should be answered with investments
in human capital. Therefore women should be supported, especially young working mothers
(however nothing was said about women and men taking care of their elderly parents).
Nursery act presents new or updated forms of childcare: public nurseries, day carer and
nanny. Establishment of new public nurseries was a crucial goal since most of the old public
nurseries were closed in 90s by local governments. According to the nursery act, the state co-
finances creating of new nurseries by a new program “Toddler”, with 40 million PLN in
2011, 60 mln in 2012 and 90 mln in 2013. The co-financing means that local government has
to participate with 50% of costs.
Day carer is an option designed for young mothers who want to take care of their own child
and several more children at home. Local government employs a person on the basis of
contract of mandate (not contract for employment), which is regulated by Civic Code and not
Labour Law. It may be viewed as a solution for single parents who have difficulties of
finding a job on labour market due to the lack of care offer for the very small children.
The main problem still lies in financing. Local governments have problems with fulfilling the
50% of financial contribution. The immediate effect of nursery act was visible in the level of
nursery fees – they increased for 160% (in Warsaw, from 189 PLN to 500 PLN. The local
governments ignored protests of parents despite the fact that those decisions make nursery a
luxury (worth noting that 6 thousand children wait for a place in public nursery in Warsaw).
During first 6 months only 25 persons in Poland applied for the job of day carer probably
because it was not advertised and popularised by local governments. Perhaps the problems
lies also in the form of contract that does not offer employees’ benefits like holiday leave or
sick leave.
In the opinions of key respondents, childcare is viewed as one of the most important barriers
for single parents and their opportunities on labour market. The lack of childcare facilities
near home or near place of work results in:
multidimensional discrimination, which is experienced by poor women who
have to combine hard work, time-consuming commuting with home and family
duties (016).
Moreover, an interesting preventive solution was introduced in 2011 called the family
assistant. It is a person hired by gmina51
to work on a daily basis with families experiencing
difficulties – especially those under threat of having their children taken from them and
placed in foster families. Assistant’s task is to help in management of family budget,
organisation of the day (or even cooking or shopping if needed). Those persons should either
have higher education (preferably in social work or psychology) or life experience making
51
Costs of family assistants are partly covered by the state.
72
them qualified for the job. However, in some areas there are still difficulties to find suitable
candidates.
As mentioned previously (3.1), the government announced further changes in family policy.
Two immediate changes were announced – extension of parental leave to a year and different
system of financing of crèches (lower contributions for local governments and subsidies for
private entities establishing it). Numerous families were to be given higher tax reliefs for
third and every next child. At the same time tax reliefs for families earning over 85 thousand
PLN were to be abolished. Questions are raised about the paternal leaves of young people
with atypical contracts, whether their situation is taken into consideration (currently they do
not have the right to it).
4.3. The organisation of active inclusion delivery systems
4.3.1. Structure and operation of lead agencies
Local SAO play the key role in the delivery of AI. As already mentioned, they are
responsible for both payment of allowances and social work (activation of clients). According
to the cited qualitative study concerning the situation of social workers in Poland
(Dudkiewicz 2011), organisation of work is differentiated – especially between smaller and
larger local units. In case of the former, employees perform more universal functions, i.e.
conduct social interviews, prepare all paperwork, make decisions about entitlement to
transfers, etc. In case of the latter, the structure is often more hierarchically organised and the
functions more specialised. Social workers participating in the study indicated minuses of
both situations. The first one often results in overburdening with work, the second with red
tape (waiting for the supervisor to sign every document). Moreover, excess formalisation of
social work – the obligation to fill in numerous forms and provide broad documentation of
every case – is often pointed out as one of the main problems in every-day work: it causes
frustration, is time-consuming and unnecessary.
Social workers are a modestly paid vocational group. According to the cited quantitative
research of social workers (Rymsza 2011), in 2011 the average net wage of a social worker
from local social assistance office equalled 1852.8352
PLN. Most of them were employed
full-time (97.7%) on permanent employment contracts (85.9%) or temporary contacts
(12.4%) and atypical forms of employment were marginal (0.2%). Stability of work was
emphasised as one of the strongest positive aspects of this work.
Local SAO are managed by gminas and the budget on wages depends on local policy,
whereas bonuses are in the hands of office directors. It is, thus, difficult to determine, how
pay is used to motivate employees. The level of wages is linked to several factors. Highest
earners live in a big city, are between 41 and 50 years of age, have over 21 years of seniority,
have occupational specialisation. This suggests that, in general, what counts is a period of
service and certified specialisation.
Another important institutions in the field of AI are local PES. Even though number of
employees varies immensely between small poviats and cities with poviat status, their
structure is quite similar everywhere: registration, job agency, job advisory, subsidies and
ESF programmes operate as separate units.
52
Net average pay for 2011 equaled approximately 2500 PLN.

73
Job agency and job advisory are regulated by detailed procedures (called standards),
enumerating different activities, which have to be undertaken (many of them concern filling
in documents). Also in case of employees of local PES paperwork seems to be consuming
great amount of time: in the survey conducted in 2007 in all local PES, it was declared that
they spent 44.3% of their time on administrative tasks (Piotrowski 2008).
Budgets of local PES lay in the hands of poviat authorities and depend on local policy.
Wages and bonuses are managed by directors of offices. No information on average wages is
available, but in cited the survey from 2007 56% of directors declared that they are not able
to conduct a rational wage policy, which suggest low amounts at their disposal. The levels of
bonuses for employees are indicated by law and vary between 500 to 700 PLN. Their
distribution is based on three very general criteria: 1) results achieved at work (it is not
defined how it should be measured), 2) punctuality in meeting deadlines, 3) good relations
with co-workers.
Both employees of local PES and social workers have many possibilities to participate in
trainings financed the ESF. However, no evaluation of those trainings is available. Above
that, social workers, job advisors and job agents have the possibility to gain higher degrees of
professional specialisation if they finish post-graduate specialised studies – what should
result in higher earnings.
4.3.2. Inter-agency coordination
Local PES (operating at the middle administrative level, LAU 1) and local SAO (operating at
the lowest administrative level, LAU 2) are not obliged to a broader cooperation and the
competences are strictly divided. In 2009 the increased information exchange was enforced
thanks to legal changes53
: it started to concern more groups of unemployed. New rule was
also introduced stating, that a person who was a registered unemployed for a period longer
than 6 months (or lost unemployment benefits more than 6 months ago) and was taking social
assistance allowances should sign a social contract with social assistance or take part in other
activation form available to social assistance54
, be presented with a job offer or be assigned to
some kind of ALMP instrument (training, apprenticeship, public or intervention works).
The latest legal change, introduced in 2011, strengthened the linkage between local PES and
local SAO in the area of sanctions. From that moment not only unjustified refusal to take up
work, but also rejecting or giving up training, apprenticeship, vocational training at work
place, intervention works, public works or socially useful works became a foundation for
withdrawal, suspension or refusal of cash allowances from social assistance.
Moreover, the construction of the common data base, which will enable the information
exchange between both agencies is nearly finished (010). Its Beta version is being tested. Our
interlocutors emphasised lack of that system as an immense impediment to coordination
because data gathered in local PES and local social assistance offices are incompatible and
tracking paths of clients across them is impossible (06, 010, 012).
Some of the local PES and local SAO use SEPI (Local government Information Platform) –
computer system, which facilitates information exchange between local institutions. Thanks
to it documents do not have to be exchanged personally or by post in the form of hard copies
53
Amendment to the Act on promotion of employment and labour market institutions from 19th
December 2008. 54
There may be other forms of activation at a disposal of social assistance such as placement in local
programme of social assistance implemented by local authorities or in programmes carried out by a Centre of
Social Inclusion.
74
and access to information about clients is quicker and less time consuming. However, the
system is available only in some offices and requires signing mutual agreements about
protection of personal data.
According to the quantitative research conducted in the framework of the evaluation of
cooperation between labour market institutions (LMI)55
and social assistance and social
integration institutions (SASI)56
(IBC GROUP and SMG/KRC 2009), the dominant forms of
cooperation are in both cases exchange of information (confirmed by 95% of LMI and 88%
of SASI); joint actions towards activation of socially excluded or people at risk of social
exclusion (confirmed by 89% of LMI and 88% of SASI); and activities aiming at information
and promotion of solutions for socially excluded or people at risk of social
exclusion(confirmed by 84% of LMI and 86% of SASI). It is not clear what kind of specific
activities are connected to those broad categories, but one may assume that the first two refer
to the mentioned legal obligation to exchange information about MIP clients registered in
local PES – especially those signing social contracts.
A rather critical view of the situation was expressed by some of the politicians and non-
governmental organisations (04, 07, 015). One of the respondents refers to the experience
from the current research of local PES and local SAO, indicating that cooperation is not
institutionalised (depends of informal contacts) and even the sharing of information fails in
some cases:
Everything is supposedly written in the law, but in practice there is no
cooperation. I’ ve been travelling across Poland with this project about local
PES and local social assistance offices and I heard that they had no idea who
from their clients is unemployed or who is a social assistance client. (…). For
example labour offices didn’t know that someone has signed a social contract.
(…) And everyone emphasised the same thing – that it depends on whether
Monika [from another institution] is my friend – not on the institutional
cooperation.(04).
The level of cooperation between institutions varies between local units – there are cases in
which a lot depends on informal contacts and power relations between key actors (e.g.
conflicts between authorities from gmina and poviat may be an impediment to cooperation
between local PES and local SAO). Also if the cooperation is imposed by the law it may fail
in practice because of the poor information exchange. In result, clients may be kept in the
dark about the possible forms of support: e.g. people registered in local PES may not be
informed about the possibility to take part in a club for social inclusion or apply for MIP
benefits, not to mention family allowances or help offered by third sector organisations.
Collecting those pieces of information on one’s own – although possible – is a task requiring
time, effort and skills.
The officials from the Ministry of Labour and Social Policy also emphasise that despite the
introduced legal changes the cooperation turns out differently in different places. The system
55
Labour Market Institutions refer mainly to local and regional PES, however other institutions were also
included: voluntary labour corps (institution directed to activation of young people often from difficult
backgrounds), vocational development centres (training firms often with very long tradition of educating). 56
Social assistance and social integration institutions refer to local SAO, poviat family assistance centres,
regional centres of social policy centres and clubs of social inclusion.

75
of financing is perceived as the main obstacle towards creating a more network model – but
chances are that it will change in the near future:
I think we are close to legal changes enabling the cooperation between
different administrative levels – from very basic reasons. This is a matter of
financial flows. Today (…) the whole financial construction does not allow for
much freedom. But if we work on the basis of project methods and engage all
the local institutions, we will build civil society based on networks (010).
The current system of financing does not allow for integrating different resources in order to
activate people: labour market instruments and social assistance instruments constitute two
separate areas in this respect. The idea behind the reform is to enable creation of activation
plans based on combination of different financing sources (Labour Fund and social assistance
budgets).
The incoming legal changes in the area of labour market policy and social assistance may
bring more incentives for the cooperation also thanks to increased personalisation (i.e. better
supervision of steps taken by clients). However, it is difficult to assess it at this stage, because
no official reform plan has been published yet.
Programmes financed from the ESF and other funds
Programmes financed by the EU seem to be an important stimuli for cooperation between
institution operating in the field of employment and in the field of social assistance:
according to the mentioned evaluative research 67% of LMI and 58% of SASI institutions
declared that cooperation was connected to realisation of or participation in such
programmes. Moreover, great many confirmed also participation of employees in common
trainings for LMI and SASI institutions (respectively 46% and 56%), which most probably
have also been financed from EU funds.
Figure No. 14: Programmes co-financed from EU funds in the framework of which joint projects with SASI
institutions were implemented (respondents from LMI)
Source: IBC GROUP Central Europe Holding S.A. and SMG/KRC POLAND MEDIA S.A., 2009: 107.
67%
38%
5%
3%
2%
2%
17%
OP Human Capital 2007-2013 (financed fromESF)
SOP Development of Human Resources 2004-2006 (financed from ESF)
EQUAL 2000-2008 (financed from ESF)
IOP Regional Development 2004-2006(programme financed from ERDF and ESF)
PHARE SGG 2002
Pre-accession programmes
I don't know/I don't remember

76
The importance of EU funds for cooperation has increased in the last decade. 67% of LMI
and 77% of SASI institutions declared that they carried out common project financed from
the EU funds (ESF) in the programming period 2007-2012. Whereas in previous periods the
percentages were significantly smaller (see figures 11 and 12)57
.
However, the scale of cooperation in the framework of EU funds seems not very large:
according to the declarations of PES LMI they have carried out 5 such projects on average
and SASI institutions 2 on average. Among the former most institutions have implemented 2
or 3 projects (13%) and among the latter project (43%).
Figure No. 15: Programmes co-financed from EU funds in the framework of which joint projects with LMI were
implemented (respondents from SASI institutions).
Source: IBC GROUP Central Europe Holding S.A. and SMG/KRC POLAND MEDIA S.A., 2009:109.
ALMP instruments delivered in cooperation
In general, the delivery of transfers and services from the areas of employment and social
assistance is not integrated, i.e. they are processed by different units. However, there are
ALMP instruments, which require cooperation between local social assistance offices (or
municipal family assistance centres) and local PES. Those ALMP instruments are presented
in the table below (Table 21).
57
Abbreviation used in the figures 10 and 11: Operational Programme Human Capital, Sectorial Operational
Programme Human Resources Development Integrated Operational Programme for Regional Development.
77%
10%
5%
16%
OP Human Capital 2007-2013 (financedfrom ESF)
SOP Development of Human Resources2004-2006 (financed from ESF)
EQUAL 2000-2008 (financed from ESF)
I don't know/I don't remember

77
Table No. 21: ALMP instruments implemented in cooperation between local PES and local SAO.
Type of
measure
Name of a
measure
Target groups Actors involved
Subsidised
employment
Public works
– subsidised
employment
in
communities,
municipalities
or non-
governmental
organisations.
All vulnerable groups of
unemployed and alimony debtors
Public, sub-national:
→ head of poviat
→ local PES (representing head of LAU
1)
→ also possibly gmina (lower local
territorial unit, LAU 2)
Others
→ also possibly NGO’s having as
statutory activities one of the
following: environmental protection,
culture, education, sport, tourism,
healthcare, unemployment, social
assistance
→ water companies
Socially
useful works
organised by
communities,
working time
up to 10
hours/week
The unemployed receiving
assistance from social assistance
and not entitled to unemployment
benefit
Public, sub-national:
→ head of poviat
→ local PES (representing head of LAU
1)
→ gmina also possibly local social
Assistance offices or other gmina’s
social assistance organisation (centres
of social inclusion or clubs of social
inclusion)
Others
→ also possibly NGO’s having charity
or activities for local community as
statutory activities
Source: WP2 report, Localise.
Centres of social inclusion
Cooperation is also necessary between local SAO and centres of social inclusion. It is to
some extent formally induced. First of all, local SAO may direct its client to the centre (with
this person’s consent). Second of all, centres and offices have to agree on the individual plan
of social employment of each of the centre’s participants. Finally, it is the office director who
decides whether a person is to participate in the centre’s activities after one month probation
period.
There are doubts concerning the quality of cooperation between local social assistance offices
and centres of social inclusion. In the already mentioned evaluation report, it is emphasised
that the competences of both bodies overlap, which causes competition instead of mutual
support (IBC GROUP and SMG/KRC 2009).

78
4.3.3. Marketisation
The dominant role of public bodies in the process of delivery has not changed over the years.
Local PES are responsible for registration of the unemployed, payment of benefits, granting
financial support for starting up business, job agency and job advisory. In the current legal
framework it is impossible to delegate those task to private bodies, although public-private
cooperation in the last two areas is an option – it may be based on projects financed from ESF
or everyday work with clients of local PES (private agencies may be acknowledged as a part
of local networks and clients may be referred to them by the offices). However, as the
research show this type of public - private cooperation has so far been limited (IBRKK 2008,
IBC GROUP and SMG/KRC 2009). Only trainings are based on contracting out. In general,
private bodies deliver most of the trainings for local PES, whereas NGOs realise more
complex and long term activation projects combining social and employment services and
focused on excluded groups (mostly financed from ESF).
The situation is reverse in the area of social assistance, where contracting out is
commissioned to non-profit organizations (organizacje pożytku publicznego)58
not to firms.
Thus, the role of third sector in the area of social assistance is primary to private sector. Three
types of services have to remain under the competence of due public institutions: 1) deciding
about the entitlements to allowances and conducting social interviews; 2) payment of social
and health insurance contributions; 3) payment of allowances. Other – especially care
services and specialised care services, management of care facilities may be contracted out
(Balcerzak-Paradowska, Golinowska 2009). The decision whether to delegate some tasks to
those organisations depends on the decision of local governments (it is optional) and its scale
is still limited (Nitecki 2012).
The financing of ESF has enable contracting out on a greater scale. The training market grew
immensely thanks to the EU funds, which were used as a contribution to the Labour Fund
(for details see 2.2) as well as source of financing of programmes such as the already
mentioned Sectorial Operational Programme Human Resources 2004-2006 and Operational
Programme Human Capital 2007-2013 focused on vocational activation, up-skilling, life-long
learning, challenges of the labour market, etc. In the survey conducted with training
companies in 2007, 82.7% of employers admitted that trainings they organised were financed
from the Labour Fund and 72.7% that the source of financing were the EU funds (IBRKK
2008). 41% of the existing training firms have been created in the period form 2006 -
2011(HRP 2011). However, the competition for funds between public and private or third
sector actors has been limited by the existence of the so-called systemic projects, i.e. projects
directed only to public institutions59
(PO KL 2007-2013). In other words, some financial
resources have been reserved for projects to be carried out by public institutions and granted
without open contests. This way – on the one hand – the role of non-public entities was
reduced; and – on the other – public entities were protected from losing in the competition.
This may suggest that there has been a general resistance towards too widespread
marketisation. It may change in favour of the latter which the incoming reforms in the area of
labour market policy and social assistance (see 4.1).
58
Non-profit organizations are defined not only as non-governmental organizations, churches and religious
associations, assciations of territorial governments, social cooperatives, sport associations, etc. 59
Systemic programmes divide into competitive (between public institutions) and non-competitive.

79
5. Assessment
5.1. A national strategy?
Measures to combat poverty and social exclusion are divided between many bodies, but the
central authority has the prerogative of defining legal frameworks in which they are
implemented and allocating the resources for majority of tasks. Local authorities must work
within this frameworks. Own incomes of local governments – which are often scarce – are
used in many cases to subsidise goals defined by the state. Although local governments are
entitled to make decisions about additional financial support, it is the government that
supervises and controls. An example of this approach is the discussion around the need for a
subsidy to the cost of electricity for poorer people. The government has estimated how much
can be spent on energy subsidies from the central budget and seeks for a solution that will be
optimal with respect to this assumption. When planning the change, the government carried
out a public consultation however the plan was to impose a single national system. Local
governments are to play the role of contractors. They will probably be allowed to supplement
the energy subsides by their own means.
In the process of implementation of the objectives concerning poverty and social exclusion
PES and social assistance cooperate intensively with the relevant structures at the central
level (mainly with the Ministry of Labour and Social Policy) even though they are
subordinated to local governments – which seems to be a legacy of the previous system. Even
the administrative reforms undertaken in 1990s did not manage to change it. In result, the
institutional fight against poverty in Poland is implemented in a paradigm shaped at the state,
which is complemented by a variety of local governments’ initiatives. Perhaps they would be
more diverse, if local governments had more resources for their own activities in combating
poverty.
The pressure to transform the paradigm into the national strategy to combat poverty is lower
than it could be due to number of factors. First of all, the deeply enrooted beliefs concerning
poverty come into play. From the beginning of the transformation poverty was associated
with unemployment. Only part of the stakeholders (trade unions, NGOs) recognised
unemployment as – to a large extent – structurally conditioned. Others have been considering
it as mostly dependent on the will to work. Active attitude is expected from the unemployed,
which is understood as being resourceful and self-sufficient. Shadow economy plays an
ambivalent role in this respect. On the one hand, it seems to be the most prominent symptom
of economic resourcefulness. On the other, it generates the problem of abusing the system
(e.g. people who work illegally and collect allowances or register as unemployed). For years
governments struggled with the grey economy in a very sluggish manner, assuming that it
creates a specific “safety valve” for unemployed, working-poor, and also for business.
These abovementioned beliefs or attitudes refer also to the other groups of the poor. The
famous categories of poor people as „foxes“ and “hedgehogs“, elaborated by Isaiah Berlin,
are present in the media discourse. Another division into „resourceful“ and „demanding“ is
frequent in public usage. The concept of the „demanding“ homo sovieticus was often invoked
at the beginning of the transformation. All of these concepts distract the attention from the
discussion on the structural causes of poverty. The emphasis is put on individual behaviour
patterns and their individual motives. They are all based on an easy division into diservin and
undeserving poor.
80
The second factor weakening pressure on the national strategy is the issue of migration.
Large emigration from Poland to some countries of the European Union after 2004 resulted in
the weaker political and social pressure on the public authorities to conduct more effective
fight against poverty. It is estimated that in 2011, 1.67mln of Polish citizens were residents of
other EU member states, of which approximately 73% for earning purposes. The greatest
number of Polish migrants currently lives in the UK, Germany, Ireland and the Netherlands
(Informacja 2012). Migrant workers (partly form the population of working poor and the
unemployed) do not burden the benefit system in Poland, what might have been the case if
they stayed. Moreover they make financial transfers to families living in Poland.
The third factor is, paradoxically, the funding of anti-poverty policy from European
resources. The key-words such as activation and social inclusion are treated very superficially
and this practise is legitimised. It results in a lack of deeper thought about optimal activities
adjusted to the specific national needs and social preferences in Poland.
Fourth important factor is the institutional inertness. Despite the growing need for integrated
policy the institutions and stakeholders are still unable to change their mode of operation.
State institutions seem to be reluctant to other stakeholders, many of whom are dissatisfied
with the their low impact. Therefore they see current government as the dominant force.
Especially, trade unions the most influential anti-poverty stakeholders have been dissatisfied
with the social dialogue on poverty and ALMP in recent years.
Strategy to combat poverty is always a choice of goals in the situation of limited resources.
Poverty areas in Poland are very deep, so strategic thinking is based on the desire to address
help to those, who will not survive biologically without this assistance. Thus, the strategy is
not aimed at social inclusion, but rather at sustaining the subsistence minimum. In addition,
supported groups include the most needy: children, sick, disabled, elderly, less to others, who
"need to fend for themselves". Social workers (an to a lesser extent PES officers) base many
of their decisions on discretionary criteria. It is expected of them to distribute benefits or
inclusion instruments only after a careful process of just verification.
Since the middle of the last decade the main weakness of the inclusion agenda is the
dependence on budget deficits issue. The most influential stakeholders (government,
mainstream politicians) underline that the country currently cannot afford a more generous
policy.
The 2020 strategy was developed when the [economic] situation was a little bit
better than now…so the Ministry of Labour and Social Policy points out that
we will probably not be able to immediately improve our situation against the
European background, but it will certainly help to achieving the average
(Interview No. 015).
Another weakness of inclusion agenda is that social assistance is provided only at that stage
of depletion when the client is truly dependent and without resources. Whereas, the
instruments of support for people in relatively difficult situations – such as, for example,
working poor or young mothers wanting to return to the labour market are scarce.

81
5.2. A strategy for all working-age groups?
The system has several characteristic features concerning strategies for different working-age
benefit claimants. The system is mostly focused on the unemployed. There is a division of
responsibilities between local PES, which focus on support for short-term unemployed (who
are easier to activate) and social assistance offices that deal with long-term unemployment
(people often referred to as “difficult clients” in local PES).
Long-term unemployed pose a serious challenge to institutions. In the view of key
respondents the support for LTU should include psychological support along with vocational
training. Many of the various activation programmes that were introduced thanks to EU funds
were focused on LTU. However the question of their evaluation and long-term effectiveness
(finding a job) remains open. In 2008, the participation of LTU in the trainings was estimated
on the level of 27.6% of the whole group of trainees, whereas LTU constituted over 60% of
all registered unemployed (NIK 2008).
The instruments directed to the unemployed lack more systematic focus on social inclusion
and therefore may be interpreted as quite superficial, with low unemployment benefits for a
minor group of unemployed and high dependency on short-term projects, which sometimes
include social inclusion perspective.
Working poor seem to be a new subject. The phenomenon of work that does not cover
material or social needs is recognised, however it is not a strong element of current policies.
WP are excluded from the social assistance benefits even though their material status may be
blow the income threshold. Local PES still do not offer systematic support for WP, with job
offers for minimum wage, part time. They do not serve as centres for social inclusion for
unemployed and working poor, which was underlined by respondents. The trainings, which
could be available for WP do not enable to change job for a better one.
Therefore the needs of WP are not met. Several obstacles could be pointed out referring to
everyday life problems: difficulties with access to trainings caused by geographical distance,
lack of day care for children, long working hours and intensiveness of work that prevents
from participating in trainings or seeking for career advice. The fact of in-work status makes
WP secondary in the debate of poverty in Poland.
In case of SP a significant phenomenon comes to light. Several years ago, in time of forming
the strategy “Poland 2030” the government finally accepted the concept of Work Life
Balance and the need of supporting the family choices that combine work with family duties.
It was quite a political novelty because only a couple of years earlier women were
encouraged to stay at home and take care of children. However, the issue of single parents
and their multidimensional problem, which is combing work, family and avoiding risk of
poverty, is still not deeply recognised. What is significant the problems of SP quite easily
drop to category of “ideological debate”, with the view that support for SP would weaken the
institution of family. There are also arguments that it is the numerous families that should be
more supported.
In result, the needs of SP are not well addressed due to the more general problems of family
policy. The lack of childcare facilities is a serious obstacle because it forces SP to seek
expensive childcare on private market or informal childcare among other family members. In
case of not finding – SP become unemployed.
82
The vision of children as a “private matter” is also visible at local PES where there are no
places dedicated for children. The presence of day carer at local PES would be supportive for
SP and other parents seeking for job.
Situation of WP and SP is an example that the system is in the process of learning that the
simple division in-work versus out of work does not solve all the problems of poverty and
more precise approach is very needed.
The important background for all social groups – LTU, WP, SP, which cannot be omitted is
the housing problem. The access to communal housing is very restricted and the number of
people waiting for social housing is always many times higher than the supply of apartments.
The prices of renting on private market are often unaffordable for families of single parents
and working poor. In case of owning an apartment, many of the WP, SP or LTU cannot apply
for the housing allowance because the surface of the apartment is above the limit. The lack of
affordable housing prevents from mobility in search for better work.
In summary, the system is mainly focused on unemployed. The trainings for long-term
unemployed appeared in 2004 and since then their number increased due to the ESF funds,
which defined LTU as a special group. Before accession there were no funds focused
specifically on activation of long – term unemployed.
The system offers only modest financial support and employment agency services. System of
trainings lacks long-term vision and adjustment to the local labour market demands. The idea
is rather based on random “mix and match” with EU funds playing important but short-term
role. Unemployed with higher qualifications may seek on their own for trainings that are
suitable for their needs and apply for financing from PES. However PES usually do not
provide any job offers for them. The situation and specific needs of WP and SP are still not
addressed in more profound way.
In theory the employed and unemployed status should offer access to health care insurance.
This indeed is the case of unemployed who are cover with the insurance. However in case of
WP and other working the situation may vary depending on their type of contract. The more
and more popular civic contract for specific task do not include health care insurance
therefore the practice shows that employment and working status are not a guarantee of
health care insurance anymore.
The system may be viewed rather as default, lacking institutional resources, and the
cooperation between different institutions on local level is still too dependent on informal
contacts.
5.3. A multi-dimensional approach to working age poverty?
The approach to working age poverty is highly fragmented. Two main sources of it may be
identified: the legacy of the “sectorial” – or sometimes even “departmental” – state and the
reactive approach towards social policy. The former manifests itself though the lack of one
body (centre) responsible for policy shaping. Different arrangements are designed in different
places and coordination is limited to commenting detailed regulations. Traditional policy
divisions limit the influence of concepts such as OMC or active inclusion, which are based
multi-sectorial and multi-level approach towards social policy.

83
The latter is an effect of large-scale social problems connected to mass unemployment which
occurred in the early 1990s. Social policy was an instrument used to alleviate them. This
pattern has not changed significantly over the years. Policies addressing very basic survival
needs constructed ad hoc to answer the most acute problems have been supplemented by not
sufficiently considered ALMP. In result, no holistic and preventive approach towards social
policy has been developed over the years.
Moreover, the dynamics of relations between the central government and local governments
has not been working in favour of broader and cross sectorial social innovations, since it has
been based on cost avoidance strategy (see 3.3.).
The EU accession had a positive impact on inclusion of third sector partners into policy
planning and policy implementation. Although questions are raised about the scope of their
actual influence on its shape, their presence should be acknowledged. This way potentially
more subjects may be brought in to the political agenda by their advocates.
It is difficult to assess unequivocally the overall direction of reforms connected to combating
poverty. On the one hand, the emphasis was put on ALMP, however the system has been set
on up-skilling rather than work first approach (mainly because of scarcity of employment
opportunities). On the other, some arrangements aimed at coordinating the areas of labour
market policy and social assistance policy were introduced, but they have so far failed to
provide an integrated support for people experiencing poverty: it is possible for the more
enterprising people to make use of different forms of support, but the pieces of information
are often difficult to collect and take a lot of time and effort.

84
Conclusion
Mass unemployment at the beginning of transformation has forced poverty mitigation policy
("emergency" policy) rather than prevention. Accession to the EU resulted in rescaling policy
from more passive to more active. However, no coherent system based on prevention and
vision of the future was designed. On the one hand, notions such as “active inclusion” or
“flexicurity” have been used more as slogans, than incentives for development of more cross-
sectorial and multidimensional policy. On the other, the presence and availability of such
approaches formulated at the EU level has served as substitute for more in-depth discussion
about a national model of combating poverty and social exclusion.
Another important feature is related to the public choice. Polish state dedicates relatively
limited resources to the system, compared to other European countries considering the scale
of the problems in Poland. Benefits are low and set on fulfilling biological needs rather than
social – despite the protests of some stakeholders, income criteria of eligibility have not been
raised until recently (for six years in case of social assistance benefits and eight in case of
family benefits).
In result of those factors, the system remained fragmented and – simultaneously – highly
dependent on the central state structures. It is constantly improved but the changes are
perceived as chaotic and reactive. It seems related also to the institutional drift. Polish
administration no longer works in the bureaucratic paradigm, but it still does not work
entirely in the paradigm of New Public Management, which makes small, incremental
changes a lot easier to make than more complex and holistic ones.
There is a visible lack of a public debate on a more appropriate strategy for combating
poverty and social exclusion and other social priorities. The paradigm of inclusion based on
human capital investments, very popular in the developed countries, is implemented in
Poland with a focus on semi-training, rated as "poorly tailored." Despite the widespread
belief that investment in children is the best investment in the future, this issue is also not
approached comprehensively.
The issue of social rights still elicits many controversies. Despite the introduction of a quasi
GMI the MIP is commonly perceived as basic support for those people who really cannot
help themselves (because they have some kind of dysfunctions) or cannot count on family
support. Those who question administrative decisions concerning granting benefits tend to be
perceived as “sly foxes” and even “crafty fellows” and their attitude is classified as “claiming
and demanding” by social workers as well as participant of public debates. This discourse is
most certainly connected to the scale of social problems Poland had to cope with in the last
20 years and the drastic structural changes that occurred in this period. The tendency to
“individualise” financial successes as well as failures (i.e. falling into poverty) was connected
to the limited capacity of the state to protect its citizens from the consequences of systemic
transformation as well as the strong belief that under democracy and capitalism people could
achieve everything if they worked hard enough. Public debate seems to be slowly opening to
other views and more systemic reflections, also thanks to its shifting to the internet (blogs,
online journals, etc.).

85
References
Books:
Balcerzak-Paradowska B. (2004), Rodzina i polityka rodzinna na przełomie wieków, wyd.
IPiSS, Warszawa.
Balcerzak-Paradowska B., Golinowska St. (eds.). (2009), Polityka dochodowa, polityka
rodzinna i pomocy społecznej w zwalczaniu ubóstwa i wykluczenia społecznego. IPiSS,
Warszawa.
Bednarski M., Frieske K. (2012), atrudnienie na czas okre lony. Społeczne i ekonomiczne
konsekwencje zjawiska, IPiSS, Warszawa.
Beskid L. (1999), Analiza skali, dynamiki i społecznego rozkładu procesów pauperyzacji i
marginalizacji, IPiSS, Warszawa.
Błe dowski P. (2002), Rola administracji rza dowej i samorza dowej w finansowaniu pomocy
społecznej. in Leś E. (red.) (2002) Pomoc społeczna. Od klientelizmu do partycypacji, wyd.
IPS UW, Warszawa.
Broda-Wysocki P. (2003), Stare i nowe funkcje pomocy społecznej, in: Balcerzak-
Paradowska Bożena (ed.), Praca i polityka społeczna wobec wyzwań integracji. Instytut
Pracy i Polityki Społecznej, Warszawa.
Domański H. (2002) bóstwo w społeczeństwach postkomunistycznych Instytut Spraw
Publicznych, Warszawa.
Duszczyk M. (2010), Working poor – pracujący biedni w Polsce i świecie, in: R.
Szarfenberg., C. Żołędowski, Thiess M., bóstwo i wykluczenie społeczne – perspektywa
poznawcza, Dom Wydawniczy Elipsa: Warszawa
Firlit-Fesnak G. (2011), Rodziny polskie i polityka rodzina: stan i kierunki przemian, in:
Firlit-Fesnak G., Szylko-Skoczny M. (eds.), Polityka Społeczna Wydawnictwo Naukowe
PWN, Warszawa.
Firlit-Fesnak G., Szylko-Skoczny M. (2009), Polityka Społeczna Wydawnictwo Naukowe
PWN, Warszawa.
Frieske K. (1996), Bieda – miary i interpretacje, in: Golinowska S.(ed), Polska bieda, IPiSS,
Warszawa.
Gardawski J. (1999), Zasie g zwia zków zawodowych w wybranych działach przemysłu i
sekcjach usług publicznych, in: Gardawski J., Gonciarz., Mokrzyszewski A., Pańków W.
(eds), Rozpad bastionu? Zwia zki zawodowe w gospodarce prywatyzowanej, Instytut Spraw
Publicznych, Warszawa.
Gardawski J. (2001), Zwia zki zawodowe na rozdroz u, Instytut Spraw Publicznych,
Warszawa.

86
Golinowska St. (2000a). Polityka społeczna. Koncepcje – instytucje - koszty, (Social Policy,
Concepts – Institutions - Costs), Poltext, Warszawa.
Golinowska St. (2000b), Polityka społeczna państwa w gospodarce rynkowej. Studium
ekonomiczne, WN PWN, Warszawa.
Golinowska St.,Topińska I. (2001), Pomoc społeczna – zmiany i warunki skutecznego
działania, CeDeWu CASE, Warszawa.
Golinowska St. (2002), System pomocy społecznej. Główne problemy zmian i reform, in:
Leś E. (red.) (2002) Pomoc społeczna. Od klientelizmu do partycypacji, wyd. IPS UW,
Warszawa.
Golinowska St. (2008), Wykluczenie społeczne, in: Golinowska St, Morecka Z., Styrc M.,
Cukrowska E., Cukrowski J. (eds.), Od ubóstwa do wykluczenia społecznego. Badania,
koncepcja, wyniki, propozycje. Polska uropa, wiat, IPSS, Warszawa.
Golinowska St., Topińska I. (2002), Pomoc społeczna. miany warunki skutecznego
działania, Centrum Analiz Społeczno-Ekonomicznych, Warszawa.
Golinowska St., (2009), The National Welfare State in Poland. Tradition and Changes, in:
Stanisława Golinowska, Peter Hengestenberg, Maciej Z ukowski (eds.), Diversity and
Commonalty in European Social Policy: The Forging of European Social Model, Friedich
Ebert Stiftung, Warsaw.
Hausner J. (2007), Pe tle rozwoju, Wydawnictwo Naukowe Scholar, Warszawa.
Herbst M., Herczyński J., Levitas A., (2009), Finansowanie o wiaty w Polsce,
WydawnictwoNaukowe Scholar, Warszawa.
Inglot T., (2008), Welfare States in East Central Europe 1919–2004, Cambridge University
Press, Cambridge.
Keune M. (2010) Welfare states in Central and Eastern Europe in comparative perspective:
types and performances, in: Klenner Ch., Leiber S. (2008) Welfare states and gender
inequality in Central and Eastern Europe, ETUI, Brussels.
Klenner Ch., Leiber S. (2010) Welfare states and gender inequality in Central and Eastern
Europe, ETUI, Brussels.
Koczur, W. (2007) Pomoc społeczna jako zadanie samorza du terytorialnego, in: Zarza dzanie
publiczne w lokalnej polityce społecznej Komandor, Warszawa.
Kolarska-Bobińska L. (1999), Druga fala polskich reform, Instytut Spraw Publicznych,
Warszawa.
Kołodko G. (2008), We druja cy wiat, Prószyński i S-ka, Warszawa.

87
Kozek W. (2003) Czy wyłania się model? Problem instytucjonalizacji zbiorowego przetargu
w stosunkach pracy, in: Wiesława Kozek (ed), Instytucjonalizacja stosunków pracy w Polsce,
Wydawnictwo Naukowe Scholar, Warszawa.
Kozek W. (2004) How far to implementation? Social Dialogue in Poland for European
Employment Strategy, in: Magnusson L., Lafoucriere C. and Winterton J. (eds),. The
Enlargement of Social Europe: The Role of the Social Partners in the European Employment
Strategy, ETUI, Brussels.
Kozek W. (ed.) (2010), Gra o jutro usług publicznych w Polsce Wydawnictwa Uniwersytetu
Warszawskiego, Warszawa.
Kozek W. (2011) Rekonstrukcja rynku pracy, in: Bucholc M., Mandes S., Szawiel T.,
Wawrzyniak J. (eds.), Polska po 20 latach wolno ci, Wydawnictwa Uniwersytetu
Warszawskiego, Warszawa.
Kozek W. (2013), Rynek pracy. Perspektywa instytucjonalna, Wyd. Naukowe Uniwersytetu
Warszawskiego, Warszawa.
Ksie żopolski, M. (2004), Co dalej z polityka społeczna w Polsce? Od socjalistycznych
gwarancji do paternalistyczno-rynkowej hybrydy, in: M. Rymsza (ed.) – Reformy społeczne.
Bilans dekady, Instytut Spraw Publicznych, Warszawa.
Ksie żopolski M. (2011), Polityka społeczna w róz nych krajach i modele polityki społecznej,
in: Firlit-Fesnak G., Szylko-Skoczny M., Polityka Społeczna, Wydawnictwo Naukowe PWN,
Warszawa.
Kurzynowski A. (2000), Przemiany wzorów karier zawodowych kobiet w latach 1950 –
1989, in: Kobieta i praca. Z arnowska A., Szwarc A. (eds.), Wydaw. DiG, Warszawa.
Leś E. (red.) (2002), Pomoc społeczna. Od klientelizmu do partycypacji, wyd. IPS UW,
Warszawa.
Markowska H., Zalewska H., Uścińska G. (eds.) (2005), Addeneum. Obliczenia
porównawcze. Standardy zabezpieczenia społecznego, IPiSS, Warszawa.
Miś L., Nóz ka M., Smagacz-Poziemska M. (2011), Nasze problem – bieda i bezrobocie we
współczesnym społeczeństwie polskim, Universitas, Kraków.
Morecka Z. (2003), Świadczenia społeczne zakładów pracy: zanik czy nowe formy
Regulacje i procesy, in: Balcerzak – Paradowska B. (ed), Praca i polityka społeczna wobec
wyzwań integracji. Instytut Pracy i Polityki Społecznej, Warszawa.
Narojek W. (1991), Socjalistyczne „welfare state’. Studium z psychologii społecznej Polski
Ludowej, PWN, Warszawa.
Ost, D. (2005), The Defeat of Solidarity: Anger and Politics in Postcommunist Europe,
Cornell University Press, Ithaca NY.

88
Poleszczuk J. (1991), Praca w systemie gospodarki planowej, in: M. Marody (red), Co nam
zostało z tych lat. Społeczeństwo polskie u progu zmiany systemowej, Aneks, Londyn.
Potoczna M. Warzywoda-Kruszyńska W. (2009), Kobiety z Łódzkich enklaw biedy, WUŁ,
Łód .
Rosati D. (1998), Polska droga do rynku PWE Polskie Wydawnictwo Ekonomiczne,
Warszawa.
Rybka I. (2006), Diagnoza pomocy społecznej w Polsce w latach 1991-2006. Moz liwo ci i bariery zastosowania instrumentów ekonomii społecznej w pomocy społecznej, Instytut
Rozwoju Słuz b Społecznych, Warszawa.
Rymsza M. (ed.). (2011), Czy podej cie aktywizuja ce ma szanse?, ISP, Warszawa. Rysz-
Kowalczyk B. (2011) Polityka społeczna gmin i powiatów. Kompendium wiedzy o
instytucjach i procesach, IPS UW, Warszawa.
Stare ga-Piasek, J. (2004), Pomoc społeczna. Próba oceny funkcjonowania pomocy społecznej
w zwalczaniu ubóstwa i wykluczenia społecznego, in: Golinowska S., Tarkowska E.,.
Topińska I. (eds.), Badania nad ubóstwem i wykluczeniem społecznym. Metody i wyniki,
IPiSS Warszawa.
Szarfenberg R. (2006), Krytyka i afirmacja polityki społecznej IPS UW, Warszawa.
Szarfenberg R. (2011), Rodzaje i formy aktywnej polityki społecznej, in: Firlit-Fesnak G.,
Szylko-Skoczny M., Polityka Społeczna Wydawnictwo Naukowe PWN, Warszawa.
Szarfenberg R. (2011), Ubóstwo, marginalność i wykluczenie społeczne, in: in: Firlit-Fesnak
G., Szylko-Skoczny M., Polityka Społeczna Wydawnictwo Naukowe PWN, Warszawa.
Szela g A. (2009) Oczekiwania wobec absolwenta szkoły wyz szej jako podmiotu edukacji:
Oficyna Wydawnicza Atut, Wrocław.
Szumlicz J. (1989), Pomoc społeczna w badaniach empirycznych, Instytut Pracy i Spraw
Socjalnych, Warszawa.
Szylko-Skoczny M. (2009), Problemy społeczne w sferze pracy, in: Firlit-Fesnak G., Szylko-
Skoczny M. (2009) Polityka Społeczna Wydawnictwo Naukowe PWN, Warszawa.
Uścińska G. (2005), wiadczenia z zabezpieczenia społecznego w regulacjach
mie dzynarodowych i polskich. Studium porównawcze, IPiSS, Warszawa.
Uścińska G. (ed) (2008) abezpieczenie społeczne w Polsce. Problemy do rozwia zania w
najbliz szej przyszło ci, IPiSS, Warszawa.
Uścińska G., Zalewska H. (2008), Renty z tytułu niezdolności do pracy, in: Uścińska G. (ed)
(2008) Zabezpieczenie społeczne w Polsce. Problemy do rozwia zania w najbliz szej przyszło ci, IPiSS, Warszawa.
89
Zalewski D. (2005) Opieka i pomoc społeczna. Dynamika instytucji, Wydawnictwo
Uniwersytetu Warszawskiego, Warszawa.
Zaniewska H. (red.) (2007) Bieda mieszkaniowa i wykluczenie. Analiza zjawiska i polityki,
IPiSS, Warszawa.
Reports:
Bieńkuńska A. (ed.) (2012), bóstwo w Polsce w 2011 r. (na podstawie badań budżetów
gospodarstw domowych). Główny Urząd Statystyczny, Warszawa.
Boni M. (2011), Rekomendacje, in: Szafraniec K (ed)., Młodzi 2011, Kancelaria Prezesa
Rady Ministrów, Warszawa.
Boni M., Golinowska St. (2006), O nowych i starych dylematach polityki społecznej w
Polsce, in: Golinowska St., Boni M. (eds.) Nowe dylematy polityki społecznej. Raporty
CASE, CASE, Warszawa, Nr 65/2006.
Bonoli G. (2010), The political economy of active labour market policy. REC-WP 01/2010,
in: Working Papers on the Reconciliation of Work and Welfare in Europe, RECWOWE
Publication, Dissemination and Dialogue Centre, Edinburgh.
Chmielecka E.(ed) (2009), Od Europejskich do Krajowych Ram Kwalifikacji, Fundacja
Fundusz Współpracy, Warszawa.
Czapiński J., Panek T. (2009) Diagnoza społeczna [Social Diagnosis], WSFiZ, Warszawa.
Deniszuk L., Kurowski P., Stryc M. (2007), Progi minimalnej konsumpcji gospodarstw
domowych, IPiSS, WarszawaFlorczak J., Mordzon A., (2010) Diagnoza potrzeb i postaw
młodziez y w kontek cie ich szansna rynku pracy. ASM - Centrum Badań i Analiz Rynku
Pracy, Kutno.
Dmochowska H. (ed), (2007) Kobiety w Polsce 2007, Zakład Wydawnictw Statystycznych,
Warszawa.
Dudkiewicz M. (ed.) (2011), Pracownicy socjalni pomiędzy instytucją pomocy społecznej a
rodowiskiem lokalnym, ISP, Warszawa.
HRP (2011) End of Financial Support – przyszło ć rynku szkoleń w Polsce.
European Working Conditions Survey (2005), Eurofound.
Gaś Z.B. (ed.) (2008), Effectiveness of institutional forms of helping the youth threatened by
social exclusion : summary of the research project. Pracownia Wydawnicza Fundacji "Masz
Szanse ", Lublin.
Gardawski J. (2002), wiadczenia z tytułu utraty pracy. [Unemployment benefits], EIRO
report.

90
Gawska A., Je drak K., Gruntowski M. (2012), Ekspertyza na temat rozwoju i wykorzystania
ekonomii społecznej w organizacjach pozarza dowych działaja cych na rzecz osób
niepełnosprawnych., Fundacja Pomocy Matematykom i Informatykom Niepełnosprawnym
Ruchowo, Warszawa.
Grabowska I., Kotowska E. I., (2010), Doskonalenie zawodowe a status na rynku pracy, in:
Diagnoza Społeczna 2011, WSFiZ, Warszawa.
GUS (2010), Budżety jednostek samorządu terytorialnego 2003-2009.
GUS (2011a), Pomoc społeczna w Polsce w latach 2005-2009.
GUS (2011b), Ubóstwo w Polsce.
GUS (2012). Europejskie badanie dochodów i warunków życia ( -SILC) w 2011, Główny
Urząd Statystyczny: Warszawa.
Hryniewiecka A. (2010), Pomoc społeczna w liczbach 2010, Instytut Rozwoju Służb
Społecznych, Warszawa.
IBC GROUP Central Europe Holding S.A. and SMG/KRC POLAND MEDIA S.A. (2009)
Raport końcowy z badania ewaluacyjnego “Analiza aktualnej struktury instytucji rynku pracy
i instytucji pomocy społecznej w kontek cie zakresu ich wzajemnej współpracy, a także
głównych obszarów styku”.
IBRKK (2008) Regionalne zróżnicowane wykorzystywania narzędzi rynku pracy a
ograniczenie bezrobocia.
Kalužná D. (2009), Main features of the public employment service in Poland, in: OECD
Social, Employment and Migration Papers No. 80, online: http://www.oecd.org/els
Kohl H. (2009), Wolno ć związkowa, prawa pracowników i dialog społeczny w uropie
rodkowo - Wschodniej i na Bałkanach achodnich. Wyniki ankiet przeprowadzonych w 16
krajach, Friedrich- Ebert- Stiftung, Berlin
Kowalczuk K. (2010), Opinia społeczna o zróżnicowaniu dochodów i nierówno ciach
społecznych, Komunikat CBOS, nr, BS/136/2010.
Kryńska E. (ed.). (2009), Flexicurity w Polsce diagnoza i rekomendacje. Raport końcowy
zbadań. Warszawa, Ministerstwo Pracy i Polityki Społecznej.
Krzyszkowski J. (2010), Nowe zarza dzanie instytucjami pomocy społecznej. Systemy zarza dzania jako cia ISO w pomocy społecznej Case studies (Poznań, Gdańsk, Iława), WRZOS, Warszawa
Kształcenie dorosłych, (2009), Zakład Wydawnictw Statystycznych, GUS, Warszawa.
Kwiatkowski S.M., Sirojć Z., (2006), Młodzież na rynku pracy od badań do praktyki, Ochotnicze Hufce Pracy, Warszawa.
91
Mandes S., Sztandar-Sztanderska K. (2012) The National Governance of Integrated Social
Cohesion Policy. National Report Poland. Institute of Sociology, University of Warsaw:
Warszawa.
Matela P., Piotrowski B., Stare ga-Piasek Joanna, Wóycicka I. (2006), Rescaling social
welfare policies – national report. IRSS, IBnGR, Warszawa.
Ministerstwo Pracy i Polityki Społecznej (2012a) Bezrobocie rejestrowane w Polsce grudzień
2011.
Ministerstwo Pracy i Polityki Społecznej (2012b) Informacje o stanie i strukturze
zatrudnienia w WUP i PUP 2011.
Najwyższa Izba Kontroli (2008), Wykorzystanie rodków publicznych na szkolenie
bezrobotnych.
Najwyższa Izba Kontroli (2011), Informacja o wynikach kontroli wychowania
przedszkolnego.
Nitecki S. (2012), Współpraca międzysektorowa i zlecanie zadań podmiotom niepublicznym
pożytku publicznego i biznesowym (w ramach różnego rodzaju partnerstw)w sferze pomocy
społecznej.
Olech A., Sobczak, K. (2011), ako ć i organizacja pracy w o rodkach pomocy, IRSS,
Warszawa.
Piotrowski B., Sztandar-Sztanderska K., Zieleńska M. (2008), Powiatowy urza d pracy jako
animator i partner w zakresie polityki rynku pracy na szczeblu lokalnym i regionalnym, in::
Analiza funkcjonowania urze dów pracy po ich wła czeniu do administracji samorza dowej,
Ministerstwo Pracy i Polityki Społecznej, Warszawa.
Pohoski M., Styczeń M. (2000), Dynamika zatrudnienia i zarobków w okresie transformacji
ustrojowej w Polsce. Wyniki badania panelowego 1987-1991-1998, Instytut Socjologii UW,
Warsaw, online
Polakowski M, Szelewa D. (2012), Polityka społeczna po 1989 roku: je zyk, kontekst post-
socjalizmu i perspektywy rozwoju, presentation at conference „Debaty o Polityce Społecznej,
Fundacja F. Eberta i Fundacja ICRA, Warszawa.
Raport końcowy z badania, (2007), Wpływ interwencji z funduszy strukturalnych na
zatrudnienie, PAG Uniconsult, Pentor Research International dla Ministerstwa Rozwoju
Regionalnego, Warszawa.
Społeczna definicja biedy, jej zasie g i przyczyny (1997). Komunikat z badań CBOS
BS/33/33/97, online: www.cbos.org.pl
Stańczak J. (2011). Podstawowe informacje o sytuacji demograficznej Polski w 2011 roku
Główny Urząd Statystyczny, Warszawa.

92
Stare ga-Piasek J., Wóycicka I. (2009), Niektóre problemy zwia zane z systemem minimalnych
dochodów w Polsce. EAPN, Warszawa.
Structures of education, vocational training and adult education systems in Europe. Poland
(2008), in: Structures of education, vocational training and adult education systems in
Europe 2008, Edition, Eurydice, online: http://www.eurydice.org
Szarfenberg R. (2009), Minimalny dochód gwarantowany. EAPN, Warszawa.
Szarfenberg R. (2011), Standardy i standaryzacja pracy socjalnej i usługi pomocy i integracji
społecznej, in: Krajowy Raport Badawczy Pomoc i integracja społeczna wobec wybranych
grup – diagnoza standaryzacji usług i modeli instytucji, WRZOS, Warszawa.
Szczepańska J. (2008), Komu i jak pomagać Pomoc społeczna w opinii Polaków,
Komunikat z badaně CBOS BS/140/2008, online: www.cbos.org.pl
Sztanderska U. Wojciechowski, W. (2008), Czego nie ucza polskie szkoły, Raport, Friedrich
Ebret Stiftung., Warszawa.
Szczucka A., Turek K., Worek B. (2012), Kształcenie po szkole. czenie się dorosłych,
inwestycje w kadry w przedsiębiorstwach, instytucje szkoleniowe, Polska Agencja Rozwoju
Przedsiębiorczości, Warszawa.
Towalski R. (2002), Ocena funkcjonowania Funduszu Pracy, EIRO report
Večernik J. (2010), Earnings Disparities and Income Inequality in CEE Countries: An
Analysis of Development and Relationships, Luxemburg Income Study Working Paper Series,
Pobrano z: http://www.lisproject.org/publications/ liswps/540.pdf
Wciórka B. (1999). Ludzie biedni w Polsce. Komunikat CBPOS nr BS/18/99, online:
www.cbos.org.pl
Wóycicka I. (2009), System dochodów minimalnych – Polska. Peer review on social
protection and social inclusion and assessment in social inclusion, WRZOS, Warszawa.
Wóycicka I., Zieleńska M. (2009), Stakeholders Involvement in the OMC, IBnGR,
Warszawa.
Articles:
Heinen J., Wator M. (2006), Child Care in Poland before, during, and after the Transition:
Still a Women’s Business, Social Politics vol. 13 issue 2, ss:189-216
Szukiejłoć-Bienkuńska A. (2002), Przygotowanie GUS do prezentowania wska ników
społecznego wykluczenia proponowanych przez Unie Europejska Polityka Społeczna nr 11/12.
Kozek W., Kubisa J., Ostrowski P. (2005), Bliżej „junk job” niz „working poor”. Nisko
kwalifikowana nisko płatna praca w usługach w Polsce, Polityka Społeczna, 2005, nr 10,

93
Sztandar-Sztanderska K. (2009), Activation of the unemployed in Poland: from policy design
to policy implementation, International Journal of Sociology and Social Policy, 29 (11).
Official Documents:
Act on social assistance from 2004, with amendments.
Act on promotion of employment and labour market institutions from 2004 with amendments.
Evidence based conclusions on the role of Cohesion Policy in achieving Europe 2020
objectives, 2011, Warsaw, Ministry of Regional Development
Justification of the Family Benefits act, proceedings of the Parliament, Vol,1555.
Ministry of Labour and Social Policy Reports – MPiPS 03 from years 2000-2011
Najwyz sza Izba Kontroli [Supreme Audit Office]. (2009) Protokół kontroli Urze du Miasta
Siedlce w sprawie rozdysponowania dotacji na realizacje zadań z zakresu pomocy
społecznej" [Protocol from SAO control in teh Municipal Office of Siedlce concerning the
distribution of subventions on social assistance tasks].
National Programme of Preparation for the EU Membership 1998, 1999,2000.
National Social Inclusion Strategy 2004-2010 (Warsaw: Ministry of Labour and Social
Policy).
Parliamentary Commission for Social and Family Policy, note from the first hearing of the
draft of the act on social assistance, 08.10.2003.
Program Operacyjny Kapitał Ludzki 2007-2013 [Operational Programme Human Capital
2007-2013].
Resolution no. 37 of the Tripartite Commission from 01.10. 2010.
Sprawozdanie Głównego Inspektora Pracy z działalności Państwowej Inspekcji Pracy w roku
2010.
Tusk D. Expose. (12.10.2012).
Press articles and other :
Ćwiek J. Kraj głodnych dzieci. [The country of hungry children]. Rzeczpospolita
(25.02.2013).
Marczuk B. Polskie biedadzieci. [Polish “poverty children”]. Rzeczpospolita (30.01.2013a).
Marczuk B. Zielona Wyspa powinna się wstydzić głodnych dzieci. [Green Island should be
ashamed of hungry children]. Rzeczpospolita (25.02.2013b).

94
Marczuk B. Dziecko? Byle nie w Polsce. [Child? Better not in Poland]. Rzeczpospolita
(01.03.2013c).
Pawłowska-Salińska K. Człowiek jest zbe dny, gdy nie moz e kupować [People are redundant,
when they cannot buy things] (Gazeta Wyborcza: 04/07/2012).
Tarkowska E. Nie wyolbrzymiam problemu biedy. [I do not magnify the problem of
poverty]. (Gazeta Wyborcza: 05/01/2006).
Włodarski A. Pie ć mitów polskiej biedy. To nie emeryci maja najgorzej. [Five myths about
Polish poverty. Pensioners do not have it the worst.] (Gazeta Wyborcza: 02/08/2010).
Zubik M. Głodne dzieci siedzą w szkole.[Hungry children sit at school]. Gazeta Wyborcza
(27.02.2013).