national property market update september quarter
TRANSCRIPT
Dr. Andrew J. Wilson
Australian housing markets report
Dr Andrew Wilson – Chief Economist Domain GroupOctober 2017
Copyright 2017 Dr Andrew Wilson – all rights reserved
Dr Andrew J. Wilson
Australian capital city housing markets -synchronised, orderly growth and correction phases
Dr Andrew J. Wilson
expansion
trough
peak
trough
peak
correctionrecovery
contraction
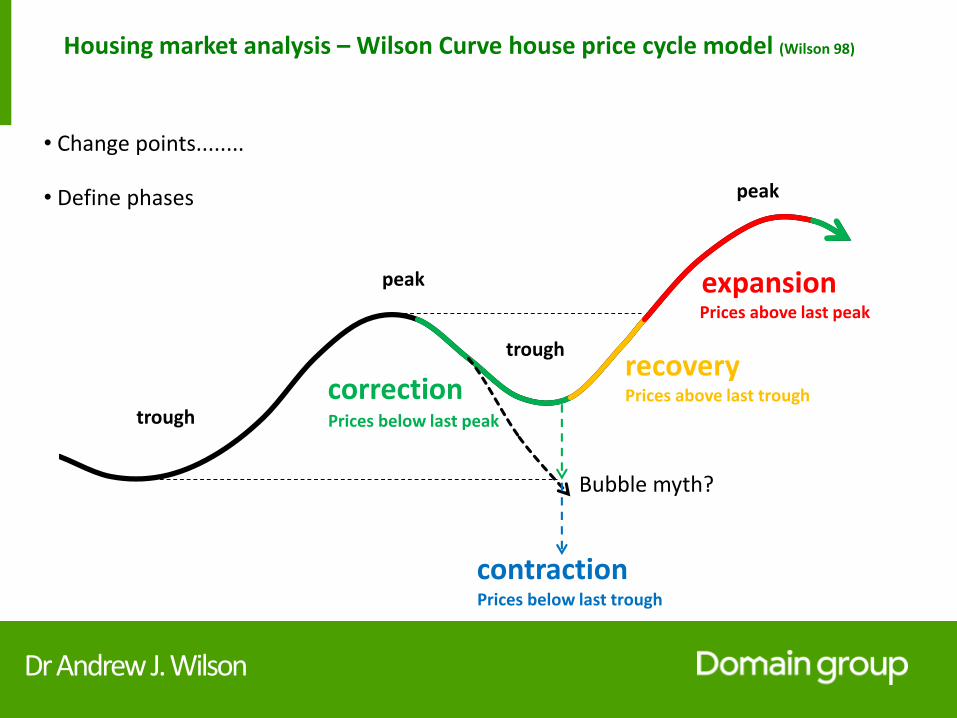
• Change points........
• Define phases
Housing market analysis – Wilson Curve house price cycle model (Wilson 98)
Prices below last peak
Prices below last trough
Prices above last trough
Prices above last peak
Bubble myth?
Dr Andrew J. Wilson
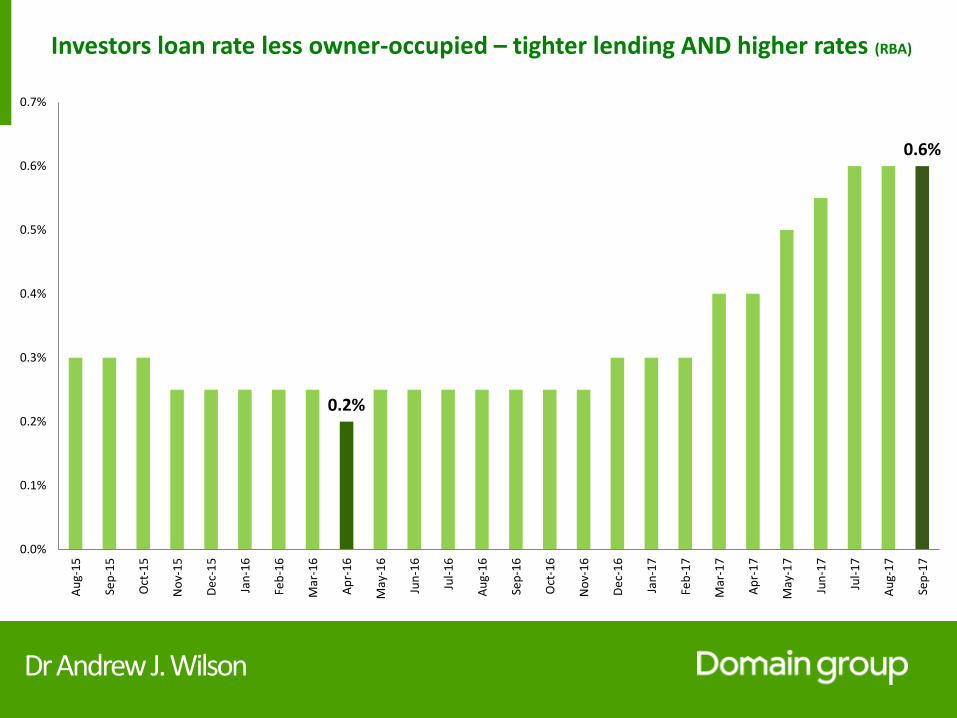
Investors loan rate less owner-occupied – tighter lending AND higher rates (RBA)
0.2%
0.6%
0.0%
0.1%
0.2%
0.3%
0.4%
0.5%
0.6%
0.7%
Au
g-1
5
Sep
-15
Oct
-15
No
v-1
5
De
c-1
5
Jan
-16
Feb
-16
Mar
-16
Ap
r-1
6
May
-16
Jun
-16
Jul-
16
Au
g-1
6
Sep
-16
Oct
-16
No
v-1
6
De
c-1
6
Jan
-17
Feb
-17
Mar
-17
Ap
r-1
7
May
-17
Jun
-17
Jul-
17
Au
g-1
7
Sep
-17
Dr Andrew J. Wilson
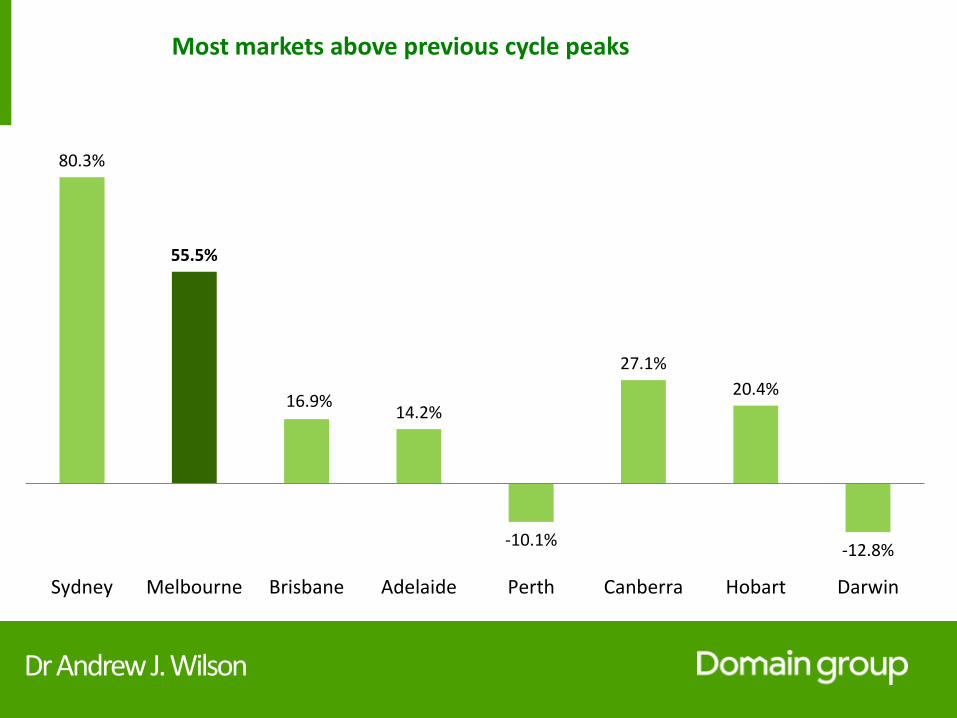
Most markets above previous cycle peaks
80.3%
55.5%
16.9%14.2%
-10.1%
27.1%
20.4%
-12.8%
Sydney Melbourne Brisbane Adelaide Perth Canberra Hobart Darwin

Dr Andrew J. Wilson
Capital city house price cycle – Wilson Curve
correctionrecovery
expansion
contraction
Sydney PerthMelbourne
Canberra
Brisbane
Darwin
Adelaide
Hobart
Dr Andrew J. Wilson
Current quarter capital city prices
Dr Andrew J. Wilson
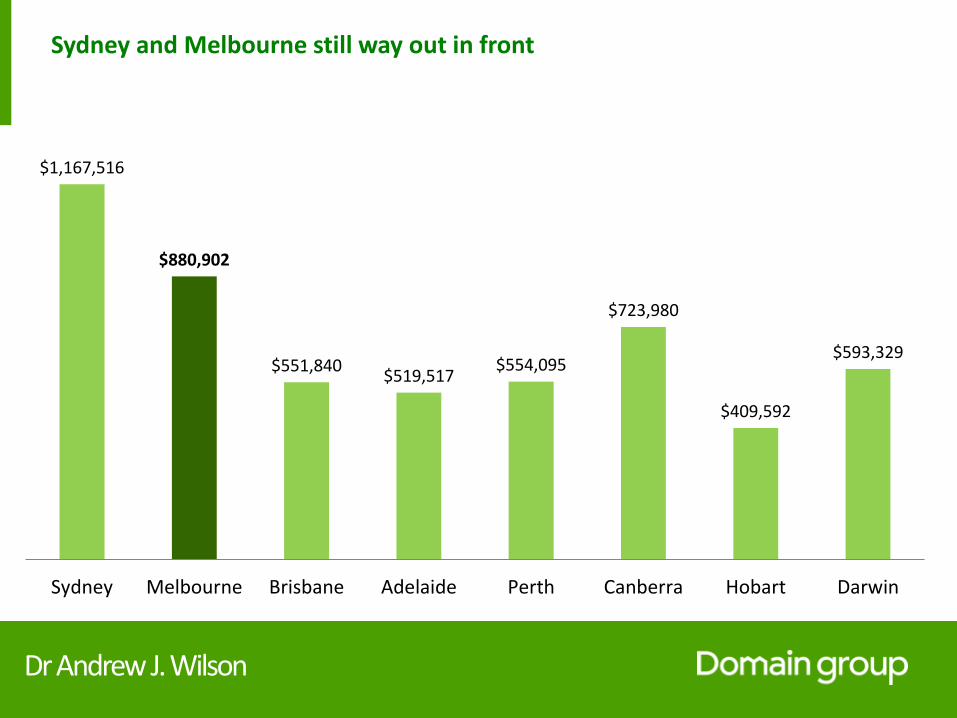
Sydney and Melbourne still way out in front
$1,167,516
$880,902
$551,840$519,517
$554,095
$723,980
$409,592
$593,329
Sydney Melbourne Brisbane Adelaide Perth Canberra Hobart Darwin
Dr Andrew J. Wilson
Rental Markets
Dr Andrew J. Wilson
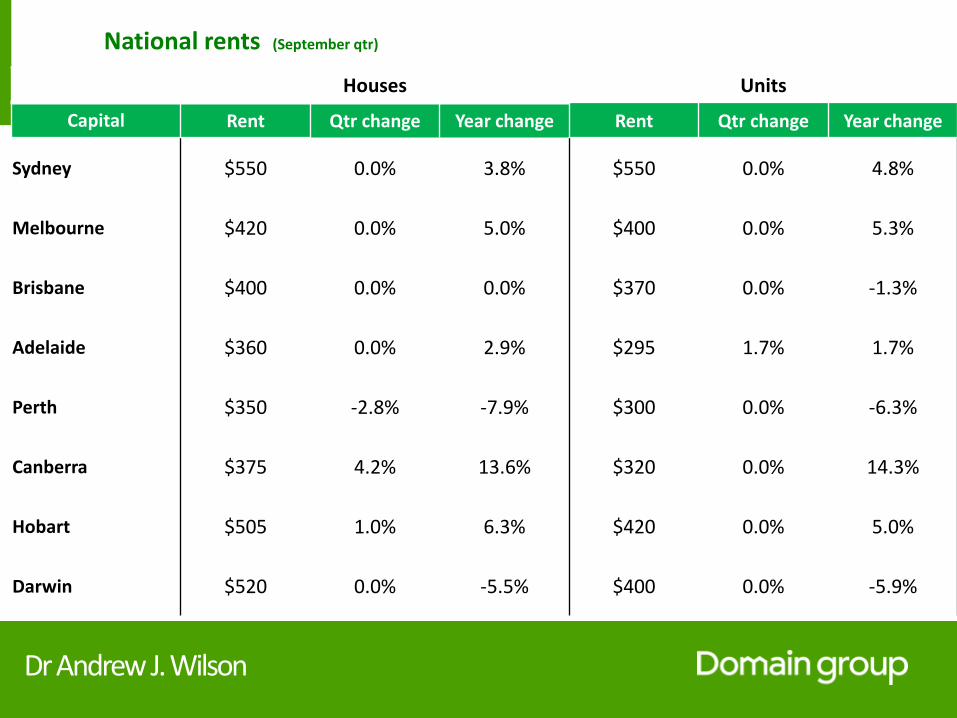
National rents (September qtr)
Houses Units
Capital Rent Qtr change Year change Rent Qtr change Year change
Sydney $550 0.0% 3.8% $550 0.0% 4.8%
Melbourne $420 0.0% 5.0% $400 0.0% 5.3%
Brisbane $400 0.0% 0.0% $370 0.0% -1.3%
Adelaide $360 0.0% 2.9% $295 1.7% 1.7%
Perth $350 -2.8% -7.9% $300 0.0% -6.3%
Canberra $375 4.2% 13.6% $320 0.0% 14.3%
Hobart $505 1.0% 6.3% $420 0.0% 5.0%
Darwin $520 0.0% -5.5% $400 0.0% -5.9%

Dr Andrew J. Wilson
National yields (September qtr)
Houses Units
Capital Gross yield Qtr change Year change Gross yield Qtr change Year change
Sydney 3.12% -1.1% -6.3% 3.86% 0.4% -2.6%
Melbourne 3.34% -1.2% -5.7% 4.47% -1.1% 1.6%
Brisbane 4.67% -0.5% -2.9% 4.93% -3.5% -1.2%
Adelaide 4.51% -1.5% -1.8% 5.18% -1.4% 0.6%
Perth 4.08% -1.1% -2.4% 4.37% -2.3% -5.7%
Canberra 5.29% -1.3% -4.1% 5.53% 0.7% -3.6%
Hobart 4.33% 0.4% -2.4% 5.77% 1.1% 3.7%
Darwin 4.88% -1.7% 3.9% 5.65% -0.8% 2.1%
Dr Andrew J. Wilson
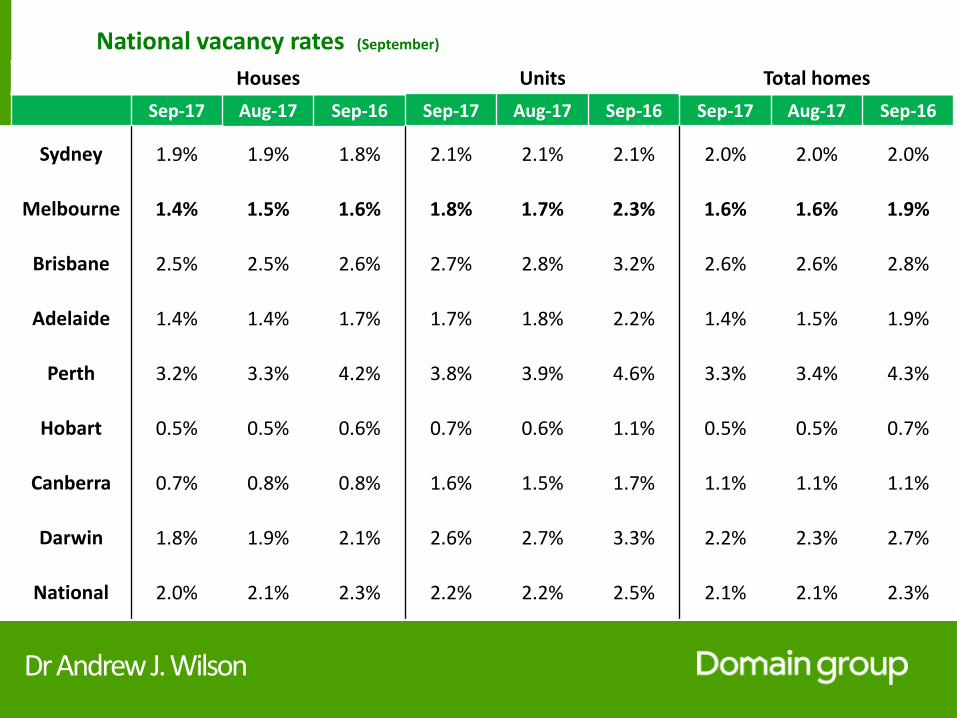
Houses Units Total homes
Sep-17 Aug-17 Sep-16 Sep-17 Aug-17 Sep-16 Sep-17 Aug-17 Sep-16
Sydney 1.9% 1.9% 1.8% 2.1% 2.1% 2.1% 2.0% 2.0% 2.0%
Melbourne 1.4% 1.5% 1.6% 1.8% 1.7% 2.3% 1.6% 1.6% 1.9%
Brisbane 2.5% 2.5% 2.6% 2.7% 2.8% 3.2% 2.6% 2.6% 2.8%
Adelaide 1.4% 1.4% 1.7% 1.7% 1.8% 2.2% 1.4% 1.5% 1.9%
Perth 3.2% 3.3% 4.2% 3.8% 3.9% 4.6% 3.3% 3.4% 4.3%
Hobart 0.5% 0.5% 0.6% 0.7% 0.6% 1.1% 0.5% 0.5% 0.7%
Canberra 0.7% 0.8% 0.8% 1.6% 1.5% 1.7% 1.1% 1.1% 1.1%
Darwin 1.8% 1.9% 2.1% 2.6% 2.7% 3.3% 2.2% 2.3% 2.7%
National 2.0% 2.1% 2.3% 2.2% 2.2% 2.5% 2.1% 2.1% 2.3%
National vacancy rates (September)
Dr Andrew J. Wilson
Key price drivers
Dr Andrew J. Wilson
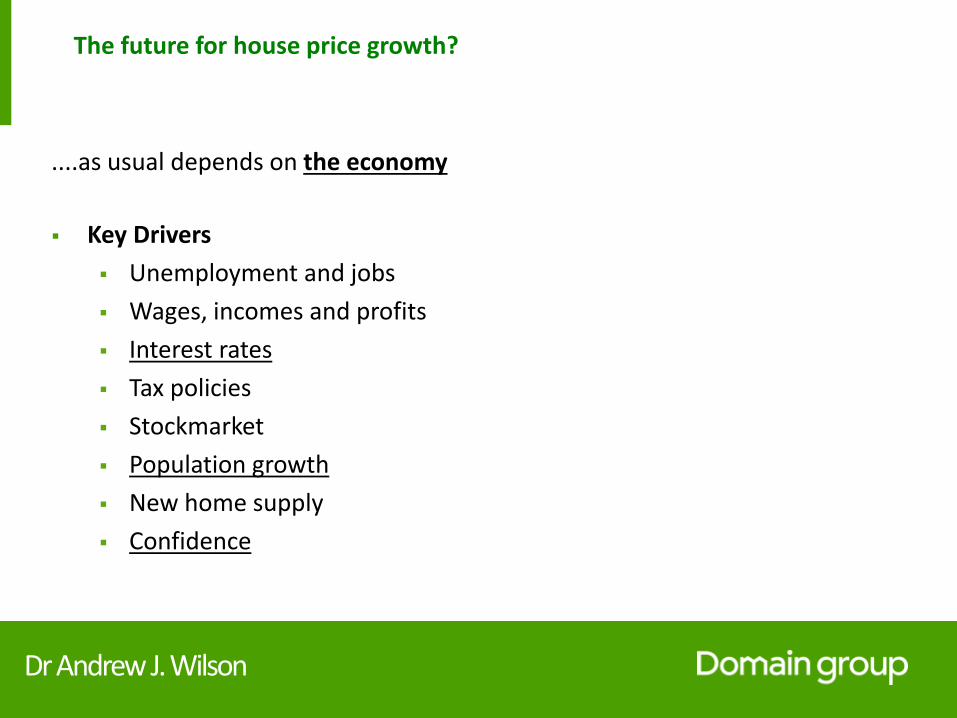
The future for house price growth?
....as usual depends on the economy
Key Drivers
Unemployment and jobs
Wages, incomes and profits
Interest rates
Tax policies
Stockmarket
Population growth
New home supply
Confidence
Dr Andrew J. Wilson
Interest rates and housing markets
Dr Andrew J. Wilson
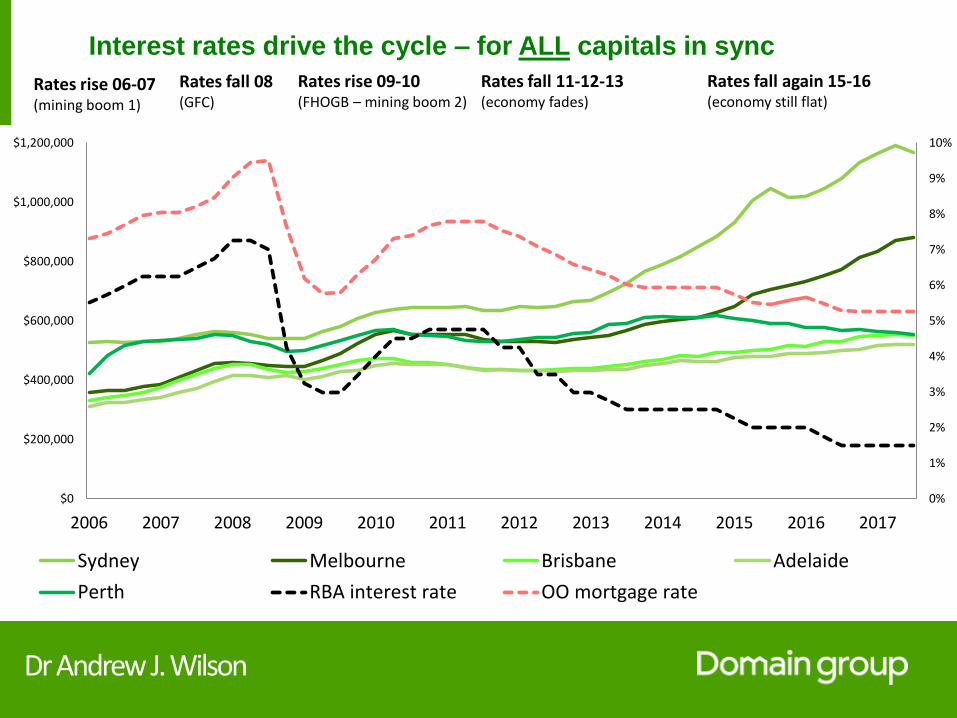
Interest rates drive the cycle – for ALL capitals in sync
Rates rise 09-10(FHOGB – mining boom 2)
Rates fall 11-12-13(economy fades)
Rates fall 08(GFC)
Rates rise 06-07(mining boom 1)
Rates fall again 15-16(economy still flat)
0%
1%
2%
3%
4%
5%
6%
7%
8%
9%
10%
$0
$200,000
$400,000
$600,000
$800,000
$1,000,000
$1,200,000
2006 2007 2008 2009 2010 2011 2012 2013 2014 2015 2016 2017
Sydney Melbourne Brisbane Adelaide
Perth RBA interest rate OO mortgage rate
Dr Andrew J. Wilson
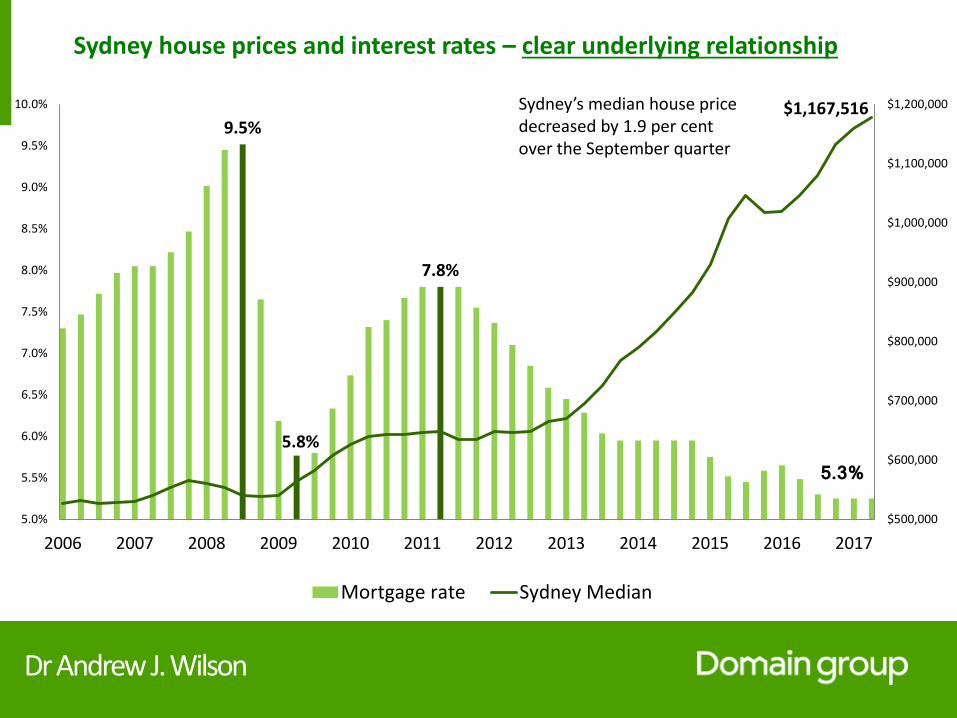
Sydney house prices and interest rates – clear underlying relationship
9.5%
5.8%
7.8%
5.3%
$1,167,516
$500,000
$600,000
$700,000
$800,000
$900,000
$1,000,000
$1,100,000
$1,200,000
5.0%
5.5%
6.0%
6.5%
7.0%
7.5%
8.0%
8.5%
9.0%
9.5%
10.0%
2006 2007 2008 2009 2010 2011 2012 2013 2014 2015 2016 2017
Mortgage rate Sydney Median
Sydney’s median house price decreased by 1.9 per cent over the September quarter
Dr Andrew J. Wilson
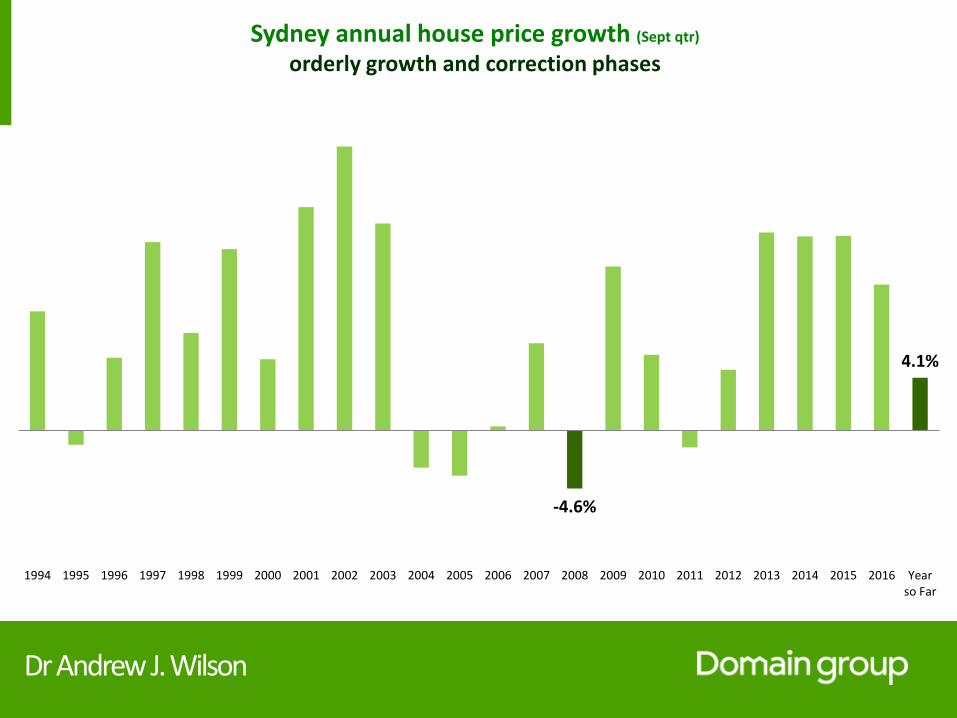
Sydney annual house price growth (Sept qtr)
orderly growth and correction phases
-4.6%
4.1%
1994 1995 1996 1997 1998 1999 2000 2001 2002 2003 2004 2005 2006 2007 2008 2009 2010 2011 2012 2013 2014 2015 2016 Yearso Far
Dr Andrew J. Wilson
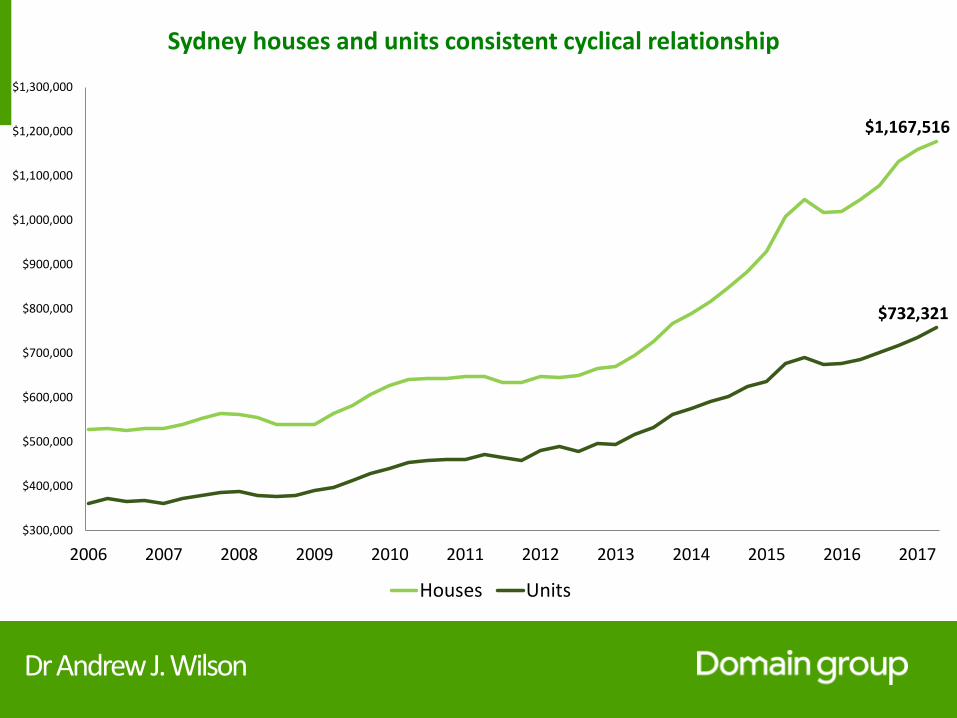
Sydney houses and units consistent cyclical relationship
$1,167,516
$732,321
$300,000
$400,000
$500,000
$600,000
$700,000
$800,000
$900,000
$1,000,000
$1,100,000
$1,200,000
$1,300,000
2006 2007 2008 2009 2010 2011 2012 2013 2014 2015 2016 2017
Houses Units
Dr Andrew J. Wilson
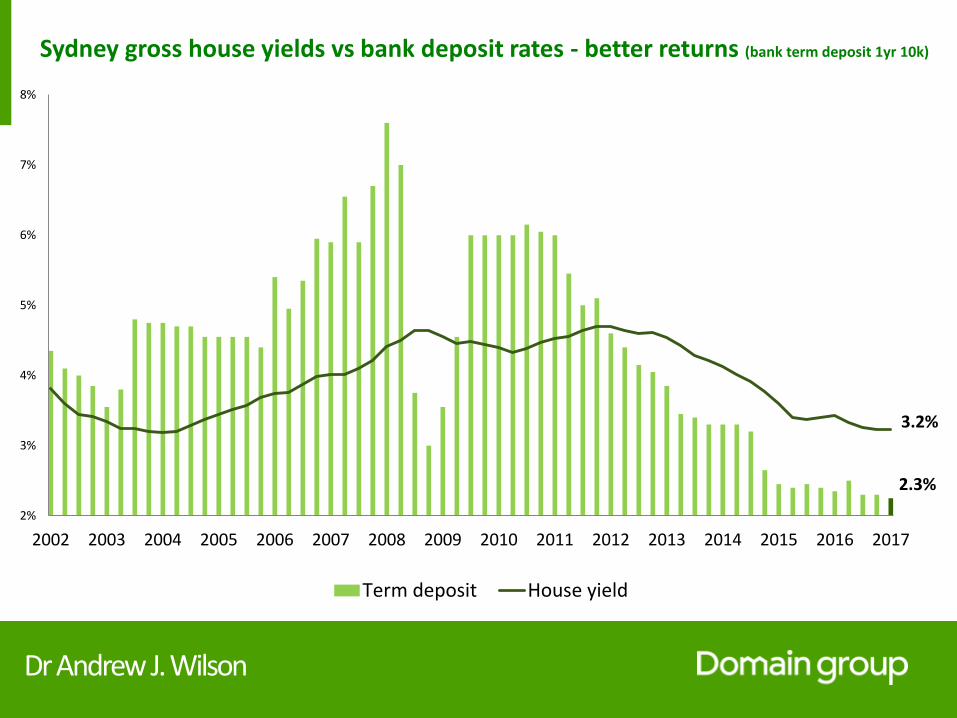
Sydney gross house yields vs bank deposit rates - better returns (bank term deposit 1yr 10k)
2.3%
3.2%
2%
3%
4%
5%
6%
7%
8%
2002 2003 2004 2005 2006 2007 2008 2009 2010 2011 2012 2013 2014 2015 2016 2017
Term deposit House yield
Dr Andrew J. Wilson
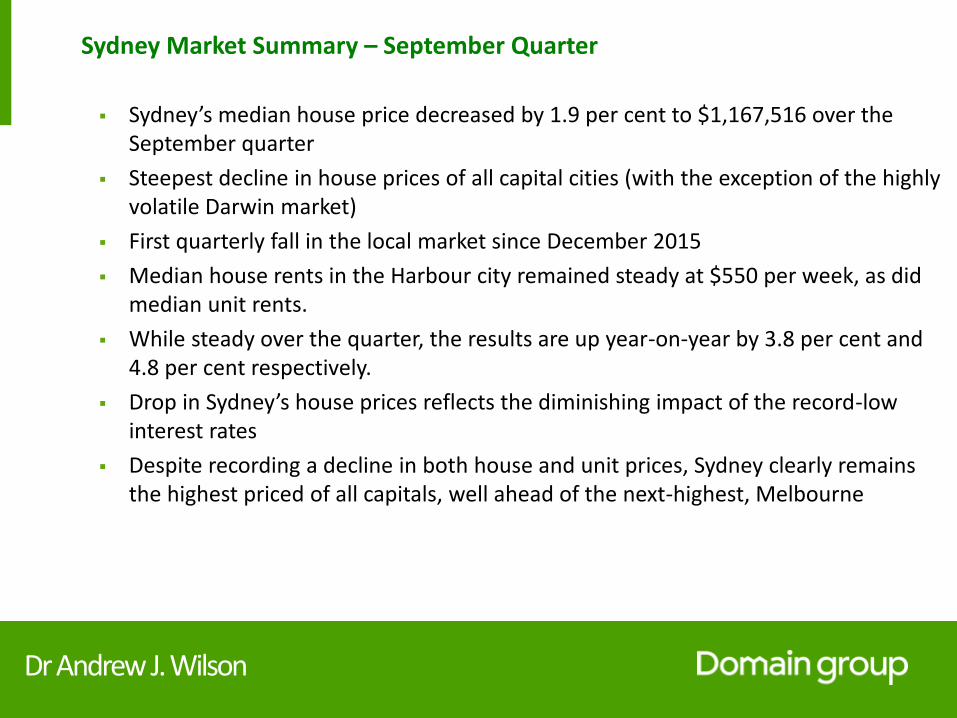
Sydney Market Summary – September Quarter
Sydney’s median house price decreased by 1.9 per cent to $1,167,516 over the September quarter
Steepest decline in house prices of all capital cities (with the exception of the highly volatile Darwin market)
First quarterly fall in the local market since December 2015
Median house rents in the Harbour city remained steady at $550 per week, as did median unit rents.
While steady over the quarter, the results are up year-on-year by 3.8 per cent and 4.8 per cent respectively.
Drop in Sydney’s house prices reflects the diminishing impact of the record-low interest rates
Despite recording a decline in both house and unit prices, Sydney clearly remains the highest priced of all capitals, well ahead of the next-highest, Melbourne
Dr Andrew J. Wilson
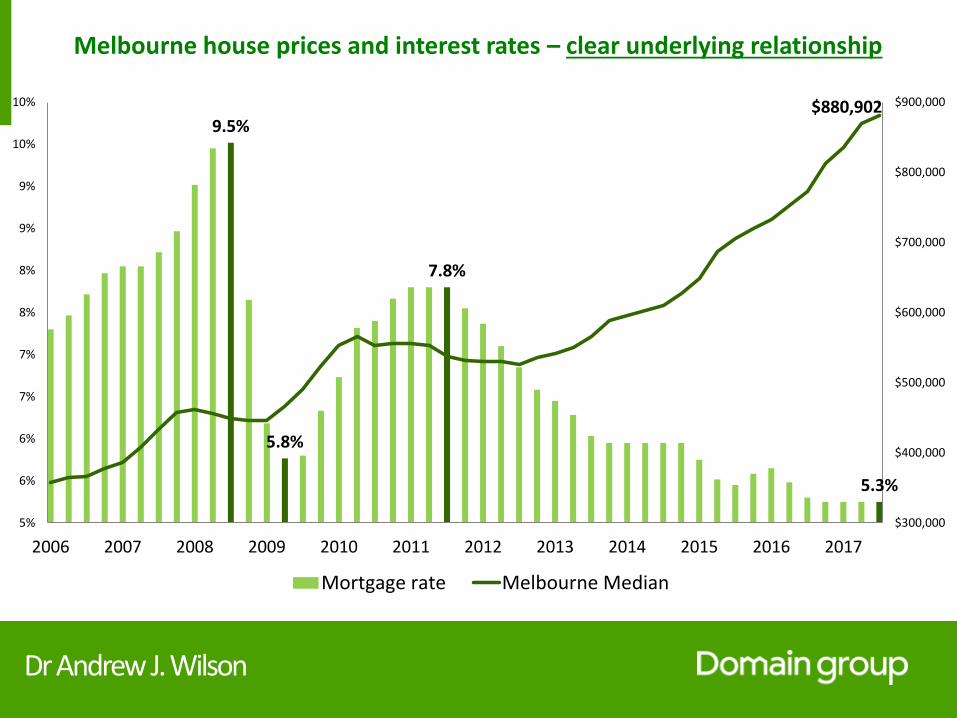
Melbourne house prices and interest rates – clear underlying relationship
9.5%
5.8%
7.8%
5.3%
$880,902
$300,000
$400,000
$500,000
$600,000
$700,000
$800,000
$900,000
5%
6%
6%
7%
7%
8%
8%
9%
9%
10%
10%
2006 2007 2008 2009 2010 2011 2012 2013 2014 2015 2016 2017
Mortgage rate Melbourne Median
Dr Andrew J. Wilson
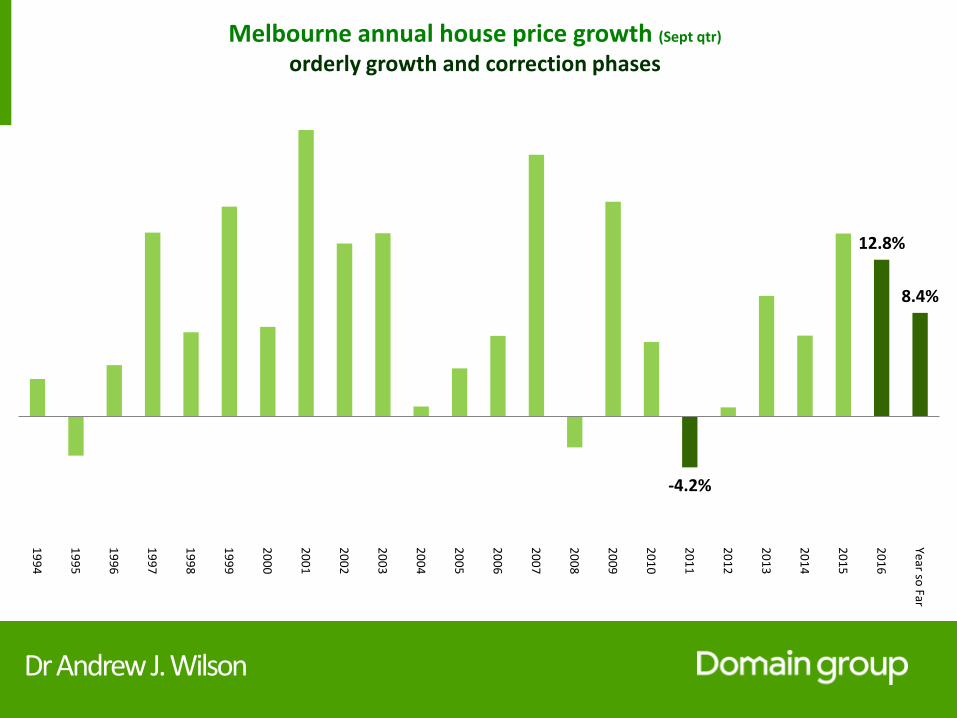
Melbourne annual house price growth (Sept qtr)
orderly growth and correction phases
-4.2%
12.8%
8.4%
19
94
19
95
19
96
19
97
19
98
19
99
20
00
20
01
20
02
20
03
20
04
20
05
20
06
20
07
20
08
20
09
20
10
20
11
20
12
20
13
20
14
20
15
20
16
Year so Far
Dr Andrew J. Wilson
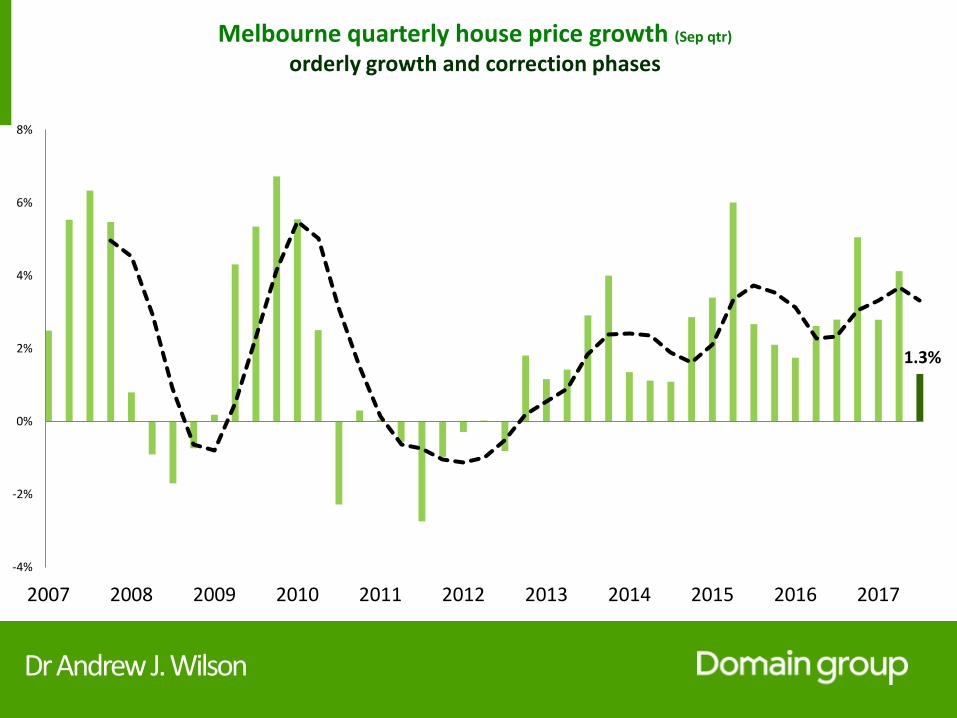
Melbourne quarterly house price growth (Sep qtr)
orderly growth and correction phases
1.3%
-4%
-2%
0%
2%
4%
6%
8%
2007 2008 2009 2010 2011 2012 2013 2014 2015 2016 2017
Dr Andrew J. Wilson
Houses and units
Dr Andrew J. Wilson
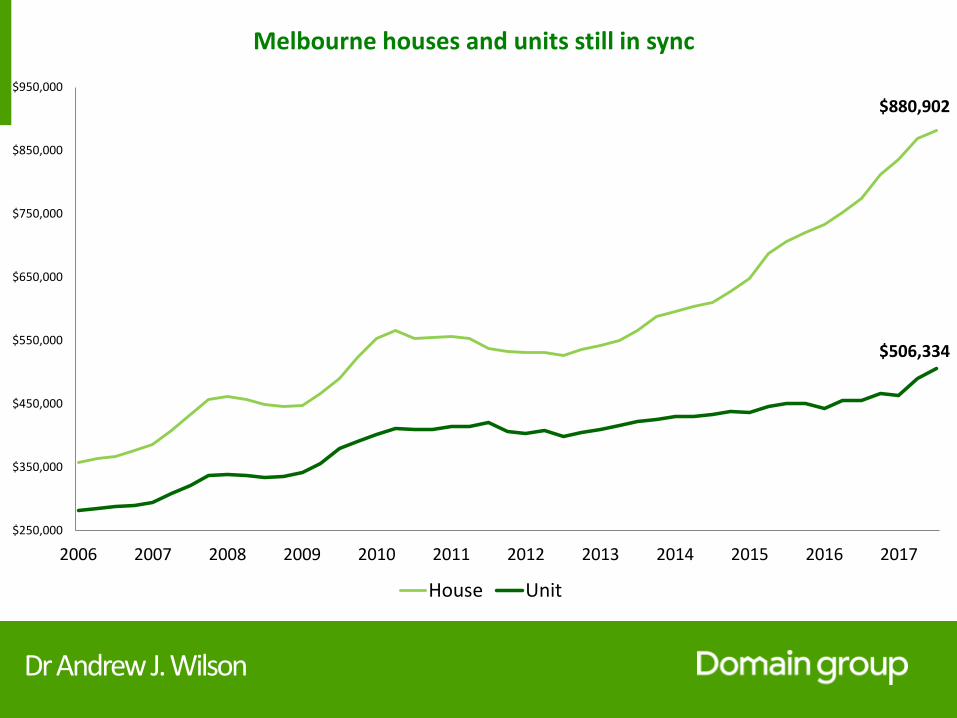
Melbourne houses and units still in sync
$880,902
$506,334
$250,000
$350,000
$450,000
$550,000
$650,000
$750,000
$850,000
$950,000
2006 2007 2008 2009 2010 2011 2012 2013 2014 2015 2016 2017
House Unit
Dr Andrew J. Wilson
Buyer types

Dr Andrew J. Wilson
Investor loan growth still up this year – FHB now rising (ABS this year to August vs last year VIC)
3.8%
12.3%
6.3%
11.8%
First home buyers Investors Changeover buyers Total

Dr Andrew J. Wilson
Housing supply
Dr Andrew J. Wilson
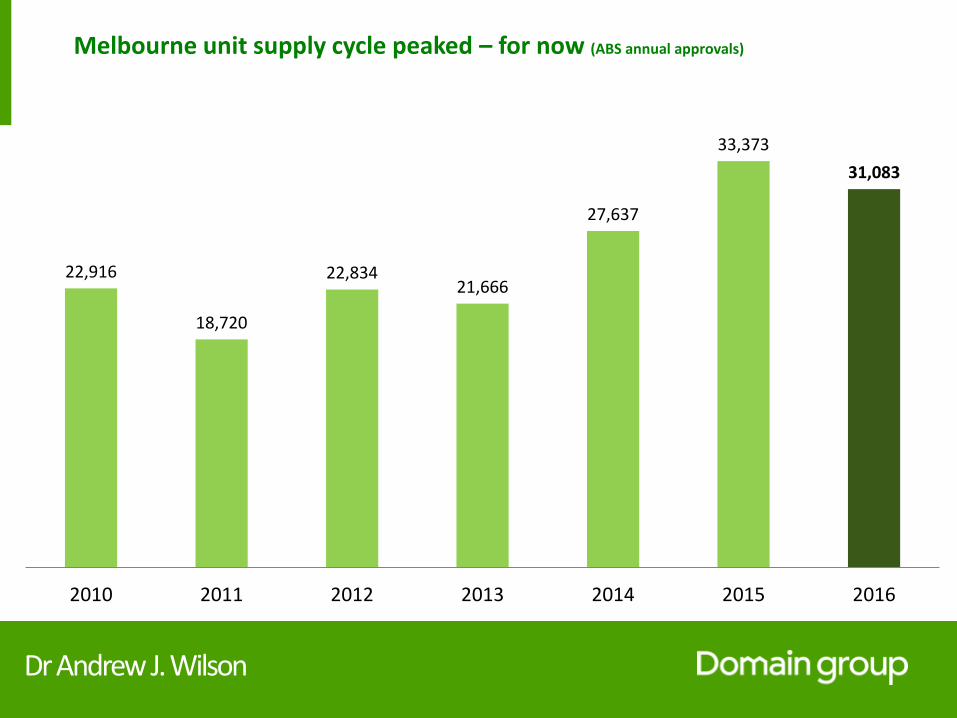
Melbourne unit supply cycle peaked – for now (ABS annual approvals)
22,916
18,720
22,83421,666
27,637
33,373
31,083
2010 2011 2012 2013 2014 2015 2016

Dr Andrew J. Wilson
Melbourne house supply cycle rising (ABS approvals)
2569 2613
0
500
1000
1500
2000
2500
3000
Jan-1
5
Feb
-15
Mar-1
5
Ap
r-15
May-1
5
Jun
-15
Jul-1
5
Au
g-15
Sep
-15
Oct-1
5
No
v-15
De
c-15
Jan-1
6
Feb
-16
Mar-1
6
Ap
r-16
May-1
6
Jun
-16
Jul-1
6
Au
g-16
Sep
-16
Oct-1
6
No
v-16
De
c-16
Jan-1
7
Feb
-17
Mar-1
7
Ap
r-17
May-1
7
Jun
-17
Jul-1
7
Au
g-17
Dr Andrew J. Wilson
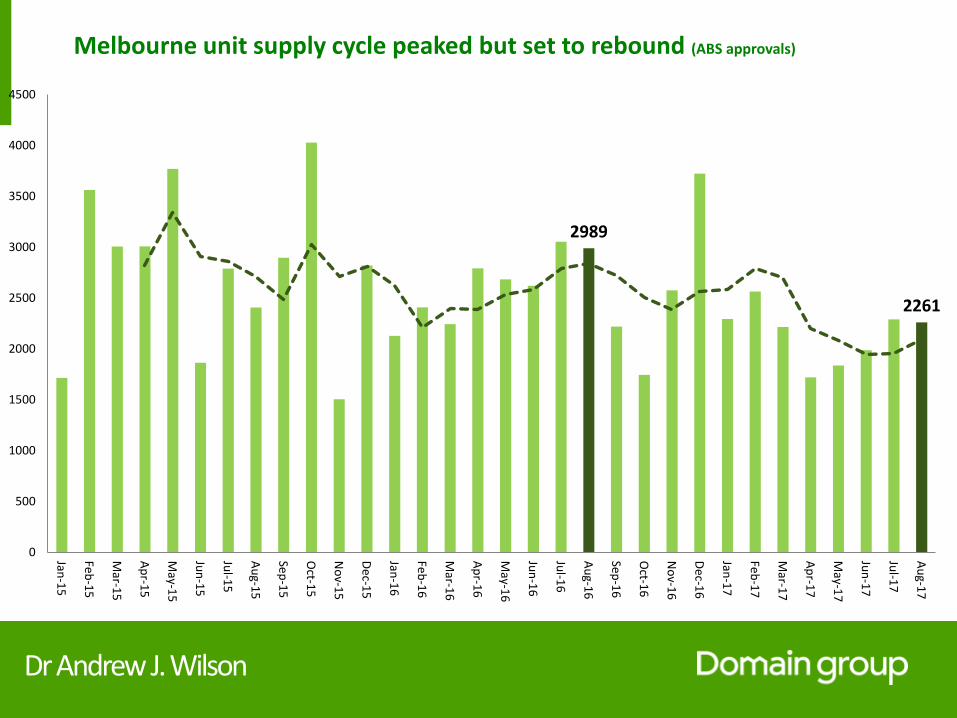
Melbourne unit supply cycle peaked but set to rebound (ABS approvals)
2989
2261
0
500
1000
1500
2000
2500
3000
3500
4000
4500
Jan-1
5
Feb
-15
Mar-1
5
Ap
r-15
May-1
5
Jun
-15
Jul-1
5
Au
g-15
Sep
-15
Oct-1
5
No
v-15
De
c-15
Jan-1
6
Feb
-16
Mar-1
6
Ap
r-16
May-1
6
Jun
-16
Jul-1
6
Au
g-16
Sep
-16
Oct-1
6
No
v-16
De
c-16
Jan-1
7
Feb
-17
Mar-1
7
Ap
r-17
May-1
7
Jun
-17
Jul-1
7
Au
g-17

Dr Andrew J. Wilson
Housing demand
Dr Andrew J. Wilson
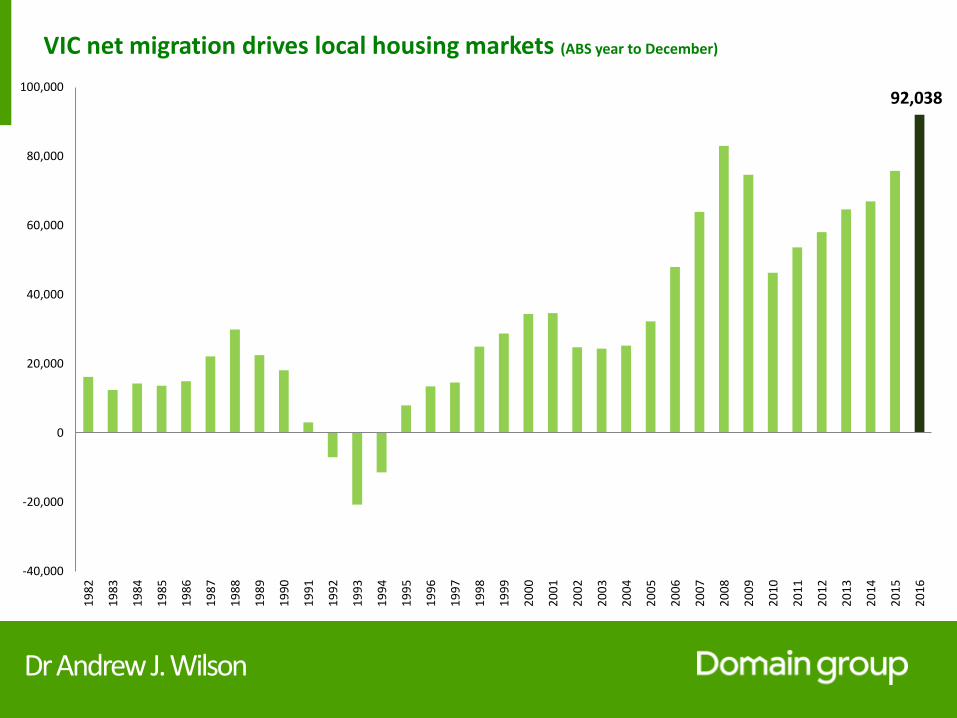
VIC net migration drives local housing markets (ABS year to December)
92,038
-40,000
-20,000
0
20,000
40,000
60,000
80,000
100,0001
98
2
19
83
19
84
19
85
19
86
19
87
19
88
19
89
19
90
19
91
19
92
19
93
19
94
19
95
19
96
19
97
19
98
19
99
20
00
20
01
20
02
20
03
20
04
20
05
20
06
20
07
20
08
20
09
20
10
20
11
20
12
20
13
20
14
20
15
20
16
Dr Andrew J. Wilson
Melbourne unit market
Dr Andrew J. Wilson
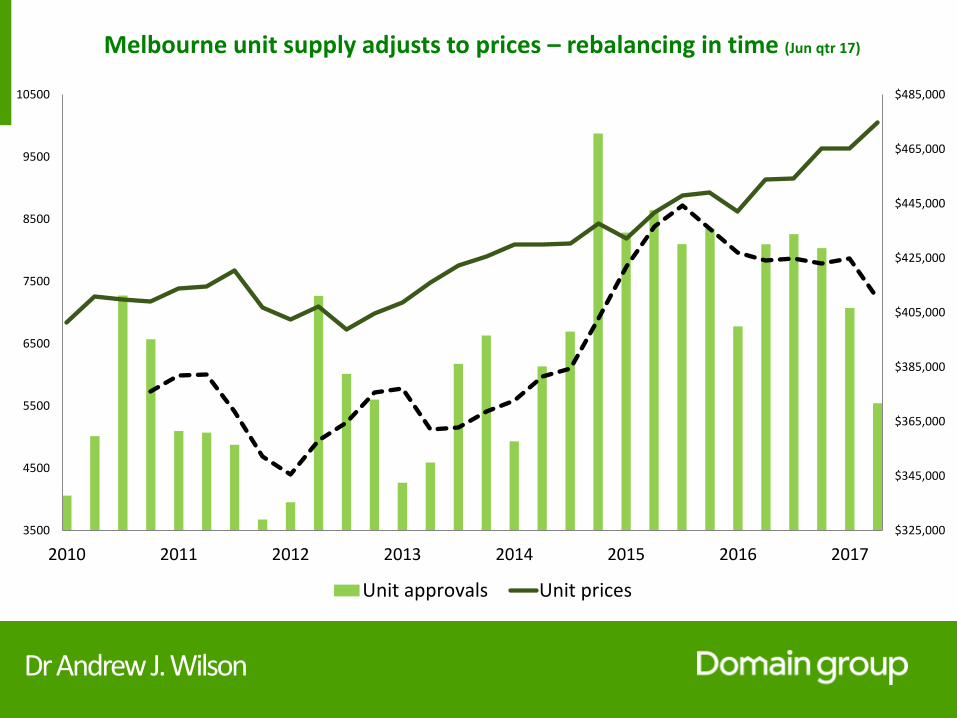
Melbourne unit supply adjusts to prices – rebalancing in time (Jun qtr 17)
$325,000
$345,000
$365,000
$385,000
$405,000
$425,000
$445,000
$465,000
$485,000
3500
4500
5500
6500
7500
8500
9500
10500
2010 2011 2012 2013 2014 2015 2016 2017
Unit approvals Unit prices

Dr Andrew J. Wilson
Melbourne market outlook 2017
Dr Andrew J. Wilson
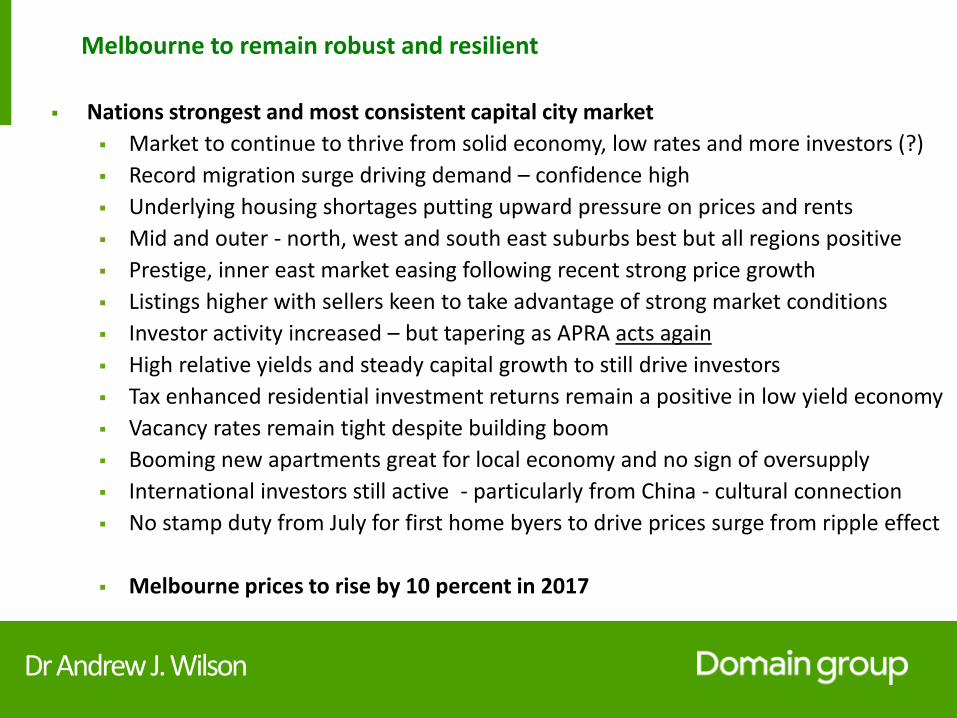
Melbourne to remain robust and resilient
Nations strongest and most consistent capital city market
Market to continue to thrive from solid economy, low rates and more investors (?)
Record migration surge driving demand – confidence high
Underlying housing shortages putting upward pressure on prices and rents
Mid and outer - north, west and south east suburbs best but all regions positive
Prestige, inner east market easing following recent strong price growth
Listings higher with sellers keen to take advantage of strong market conditions
Investor activity increased – but tapering as APRA acts again
High relative yields and steady capital growth to still drive investors
Tax enhanced residential investment returns remain a positive in low yield economy
Vacancy rates remain tight despite building boom
Booming new apartments great for local economy and no sign of oversupply
International investors still active - particularly from China - cultural connection
No stamp duty from July for first home byers to drive prices surge from ripple effect
Melbourne prices to rise by 10 percent in 2017
Dr Andrew J. Wilson
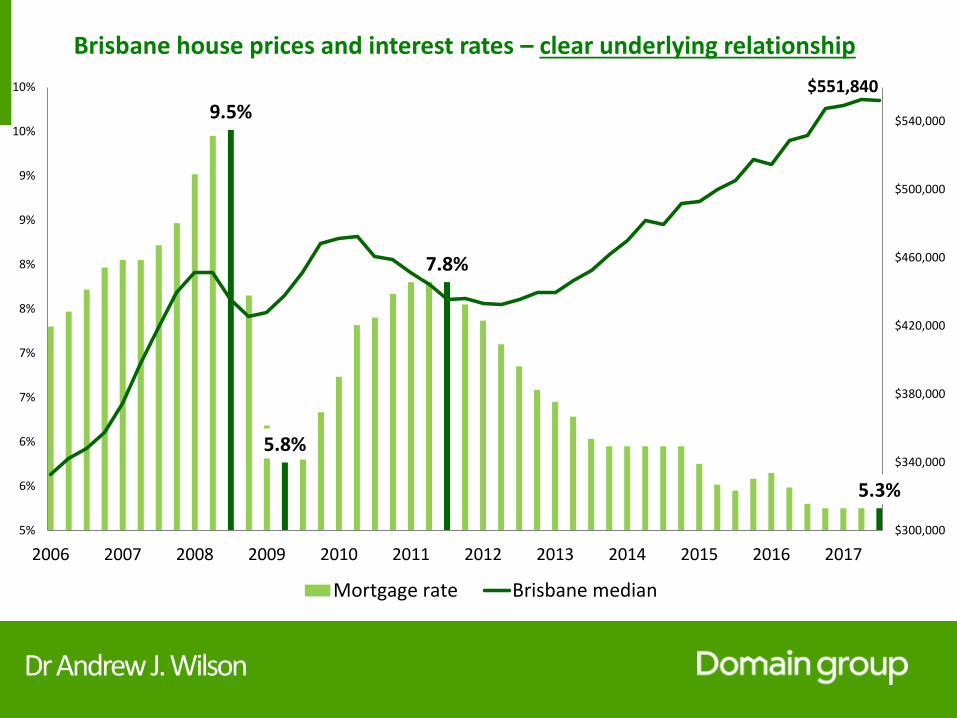
Brisbane house prices and interest rates – clear underlying relationship
9.5%
5.8%
7.8%
5.3%
$551,840
$300,000
$340,000
$380,000
$420,000
$460,000
$500,000
$540,000
5%
6%
6%
7%
7%
8%
8%
9%
9%
10%
10%
2006 2007 2008 2009 2010 2011 2012 2013 2014 2015 2016 2017
Mortgage rate Brisbane median
Dr Andrew J. Wilson
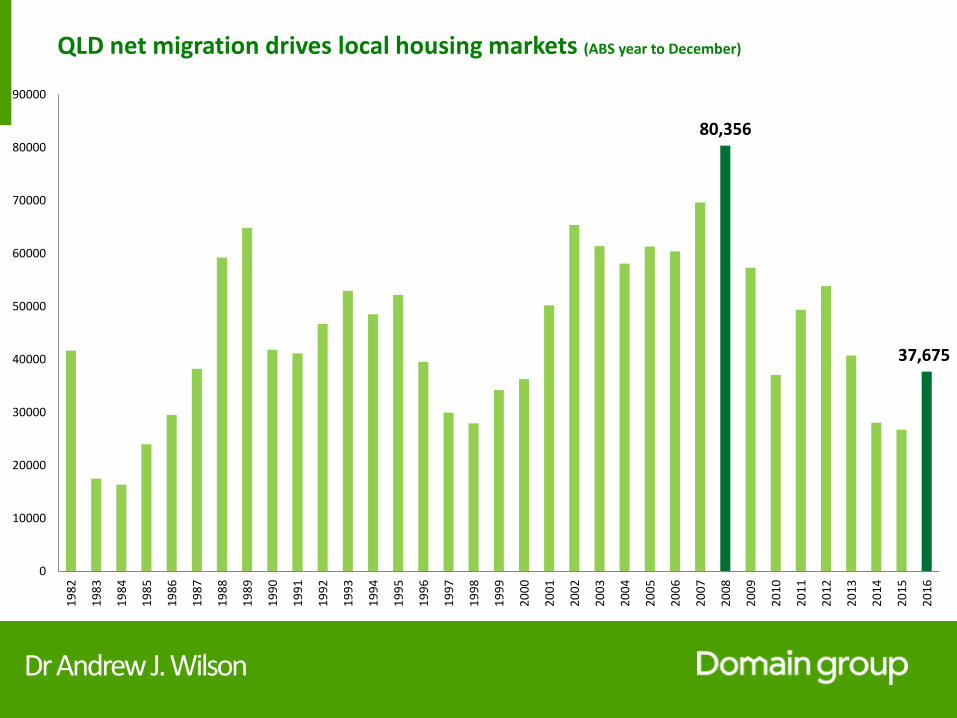
QLD net migration drives local housing markets (ABS year to December)
80,356
37,675
0
10000
20000
30000
40000
50000
60000
70000
80000
90000
19
82
19
83
19
84
19
85
19
86
19
87
19
88
19
89
19
90
19
91
19
92
19
93
19
94
19
95
19
96
19
97
19
98
19
99
20
00
20
01
20
02
20
03
20
04
20
05
20
06
20
07
20
08
20
09
20
10
20
11
20
12
20
13
20
14
20
15
20
16
Dr Andrew J. Wilson
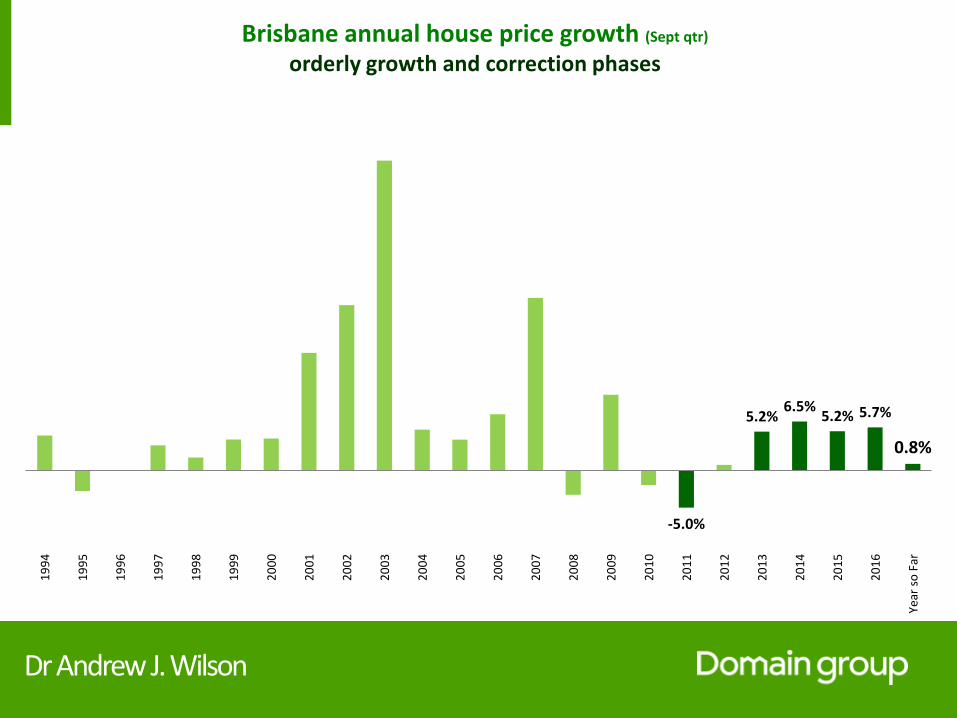
Brisbane annual house price growth (Sept qtr)
orderly growth and correction phases
-5.0%
5.2%6.5%
5.2% 5.7%
0.8%
19
94
19
95
19
96
19
97
19
98
19
99
20
00
20
01
20
02
20
03
20
04
20
05
20
06
20
07
20
08
20
09
20
10
20
11
20
12
20
13
20
14
20
15
20
16
Year
so
Far
Dr Andrew J. Wilson
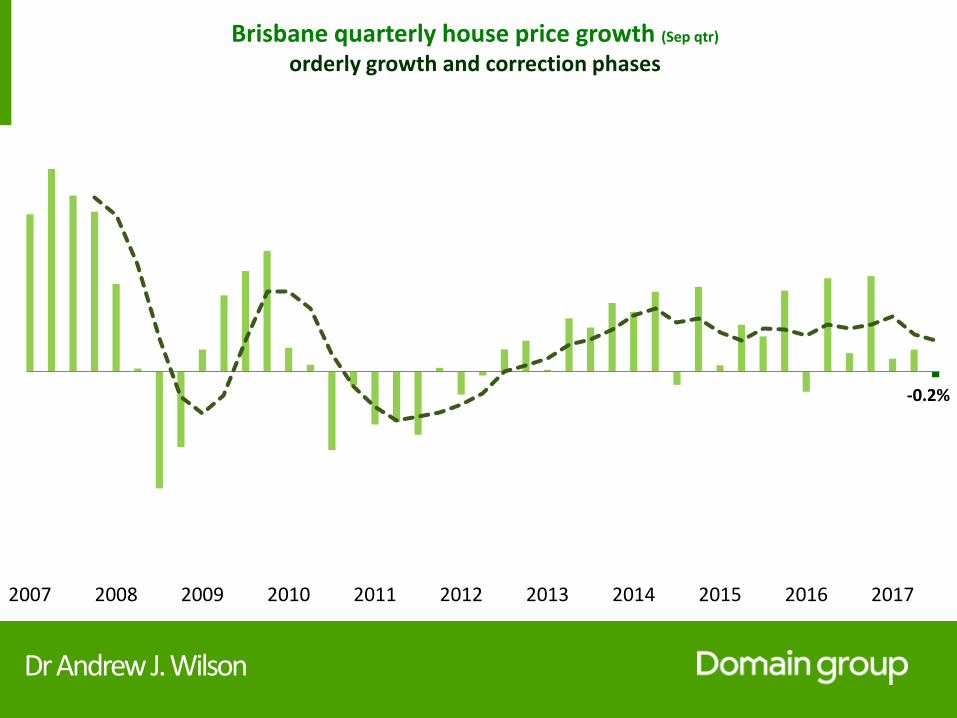
Brisbane quarterly house price growth (Sep qtr)
orderly growth and correction phases
-0.2%
2007 2008 2009 2010 2011 2012 2013 2014 2015 2016 2017
Dr Andrew J. Wilson
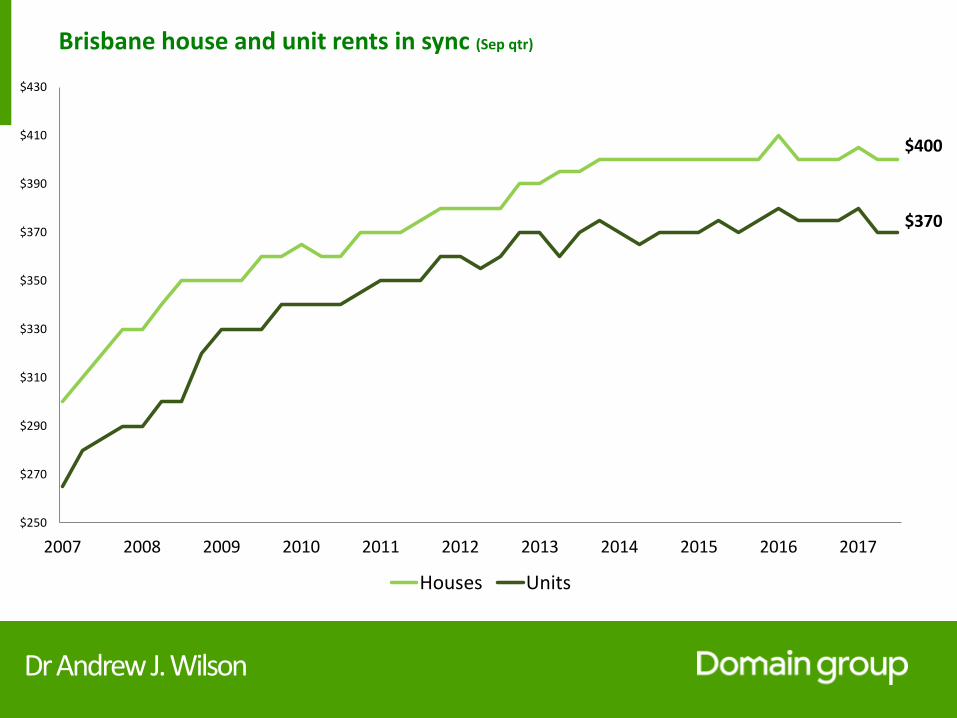
Brisbane house and unit rents in sync (Sep qtr)
$400
$370
$250
$270
$290
$310
$330
$350
$370
$390
$410
$430
2007 2008 2009 2010 2011 2012 2013 2014 2015 2016 2017
Houses Units

Dr Andrew J. Wilson
Brisbane house and unit yields in sync and rising (Sep qtr)
4.67%
4.93%
4.0%
4.2%
4.4%
4.6%
4.8%
5.0%
5.2%
5.4%
5.6%
2007 2008 2009 2010 2011 2012 2013 2014 2015 2016 2017
Houses Units
Dr Andrew J. Wilson
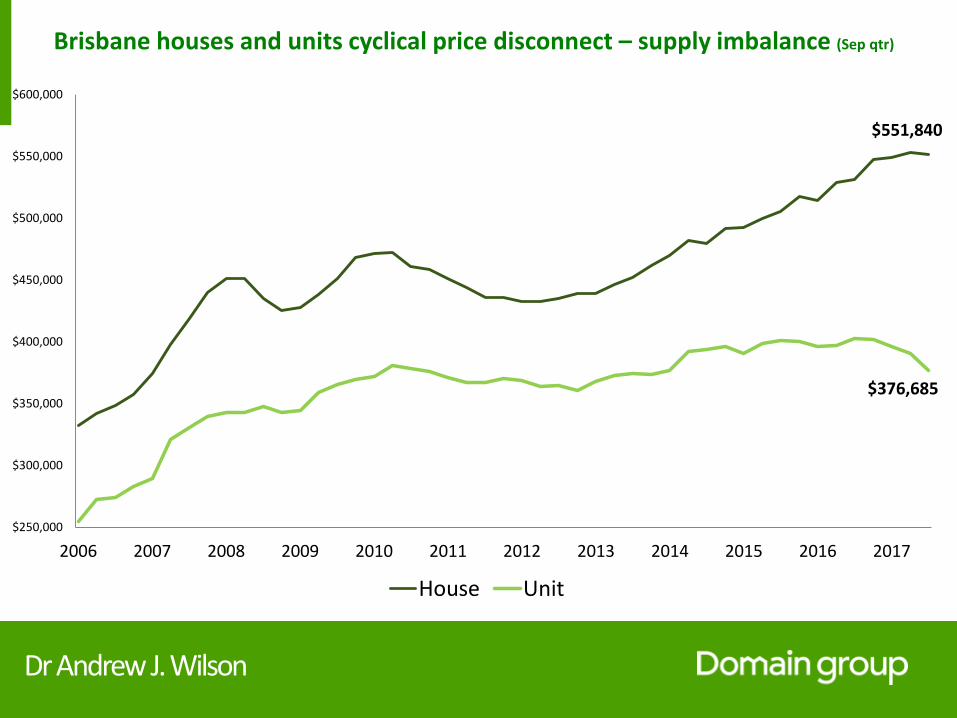
Brisbane houses and units cyclical price disconnect – supply imbalance (Sep qtr)
$551,840
$376,685
$250,000
$300,000
$350,000
$400,000
$450,000
$500,000
$550,000
$600,000
2006 2007 2008 2009 2010 2011 2012 2013 2014 2015 2016 2017
House Unit

Dr Andrew J. Wilson
National market outlook 2017

Dr Andrew J. Wilson
Housing Market Barometer
12%
2%
1%
0%
0%
Perth 0%
RISING
FALLING
2017 forecasts
4%8%
6%
4%
2%
2%
3%
4%
5%
Boom
Strong
Robust
Solid
Moderate
Moderate
Solid
Robust
Strong
Bust
Flat
Sydney, Adelaide, Darwin 5%
Hobart, Canberra 7%
Melbourne 10%
Brisbane 3%

Dr. Andrew J. Wilson
Thank you