third quarter 2021 update
TRANSCRIPT
Third Quarter 2021 Update

Organizational Update
3 | Wespath3 | Wespath
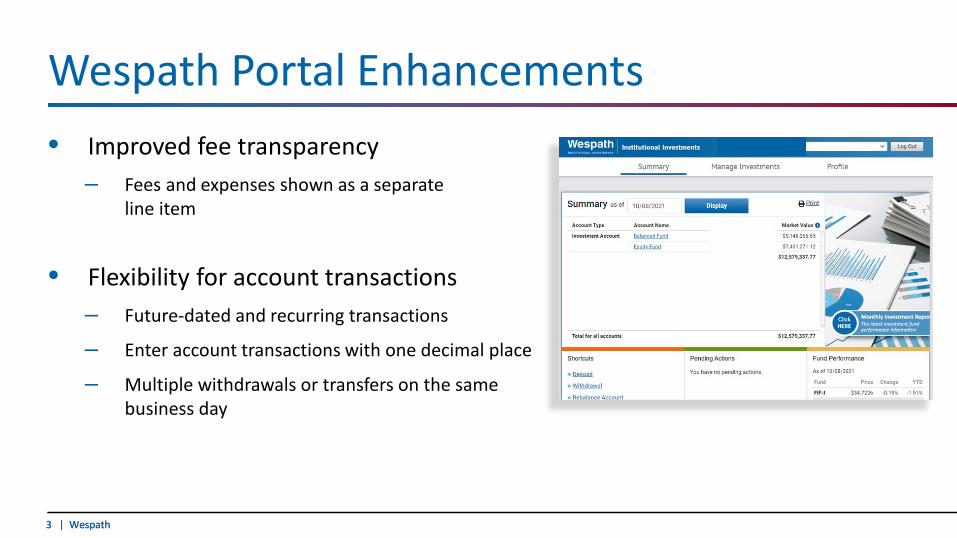
Wespath Portal Enhancements• Improved fee transparency
– Fees and expenses shown as a separateline item
• Flexibility for account transactions– Future-dated and recurring transactions
– Enter account transactions with one decimal place
– Multiple withdrawals or transfers on the same business day

4 | Wespath4 | Wespath
GIPS Compliance and Verification
• Announced compliance with Global Investment Performance Standards (GIPS)
• New Fiduciary Focus paper about the GIPS standards available on wespath.com
5 | Wespath5 | Wespath
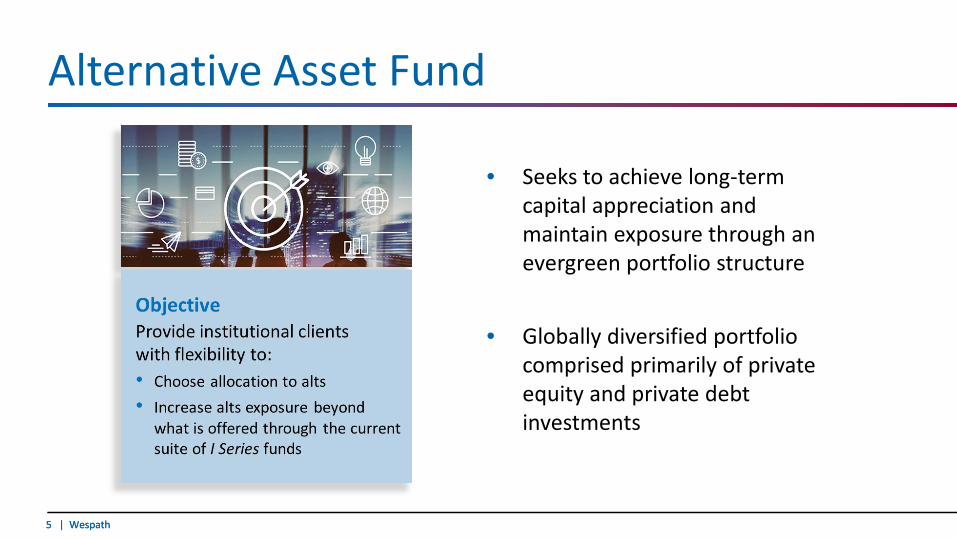
Alternative Asset Fund
• Seeks to achieve long-term capital appreciation and maintain exposure through an evergreen portfolio structure
• Globally diversified portfolio comprised primarily of private equity and private debt investments

Sustainable Investment Update

7 | Wespath7 | Wespath
Responsible Investor Op-Ed Climate Week NYC Panels

8 | Wespath8 | Wespath
Investors for Opioid and Pharmaceutical Accountability (IOPA)
• Leading engagement with Rite Aid on COVID-19 related workplace safety and protocols
• Continuing engagement with Cardinal Health
• Collaborating with opioid reporting metrics working group

9 | Wespath9 | Wespath
Human Rights Engagement—Booking Holdings
• Leading engagement on the expansion and implementation of the company’s human rights policies/framework
10 | Wespath10 | Wespath
Equitable Response to COVID-19
Investor Statement UMC Initiative
Market Update
12 | Wespath12 | Wespath
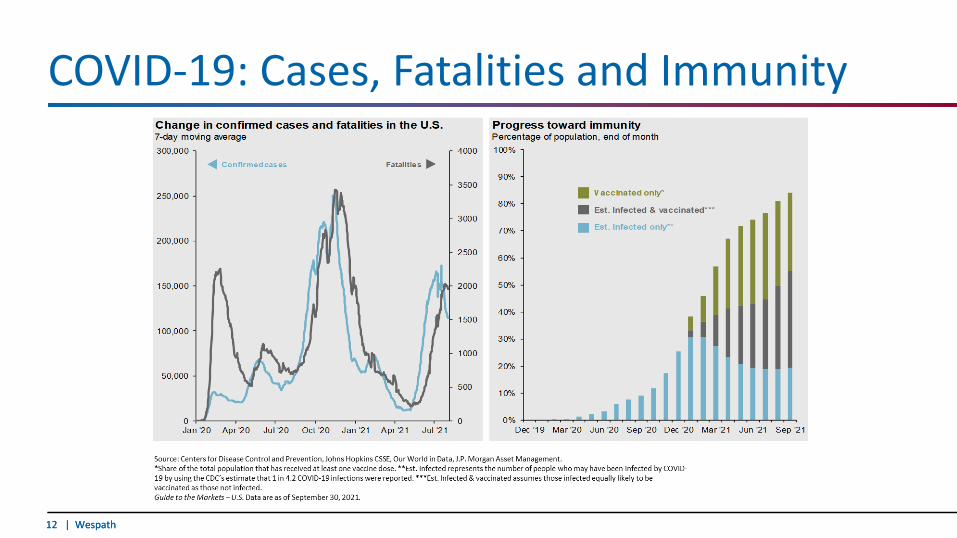
COVID-19: Cases, Fatalities and Immunity
13 | Wespath13 | Wespath
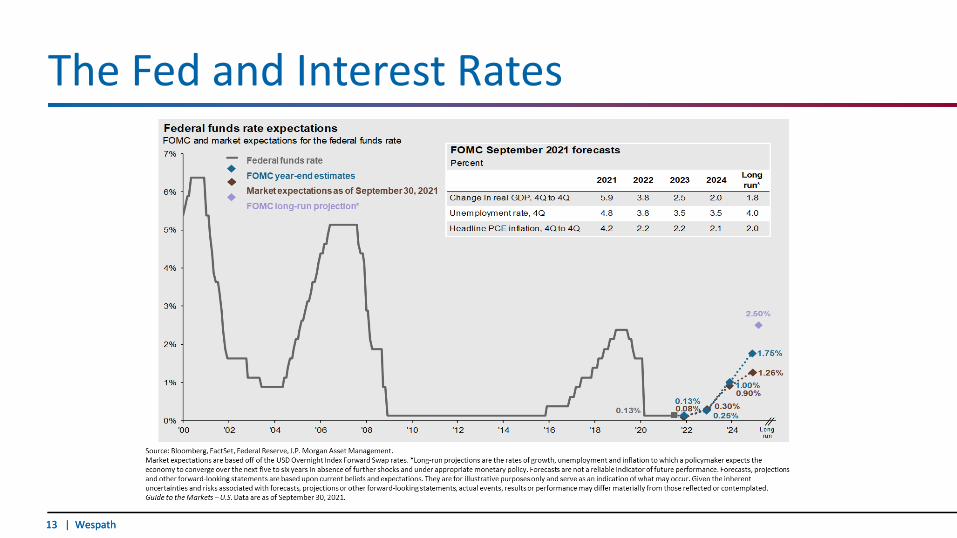
The Fed and Interest Rates
14 | Wespath14 | Wespath
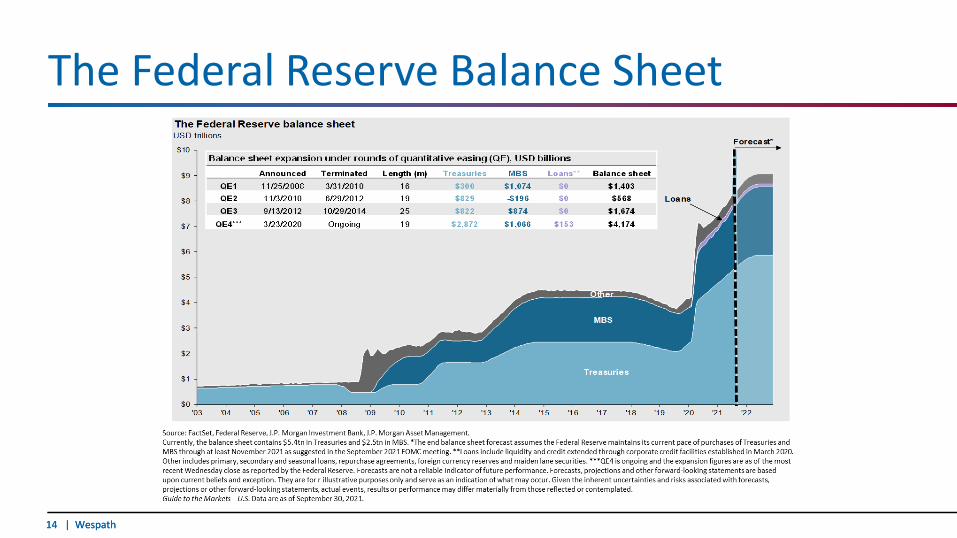
The Federal Reserve Balance Sheet
15 | Wespath15 | Wespath
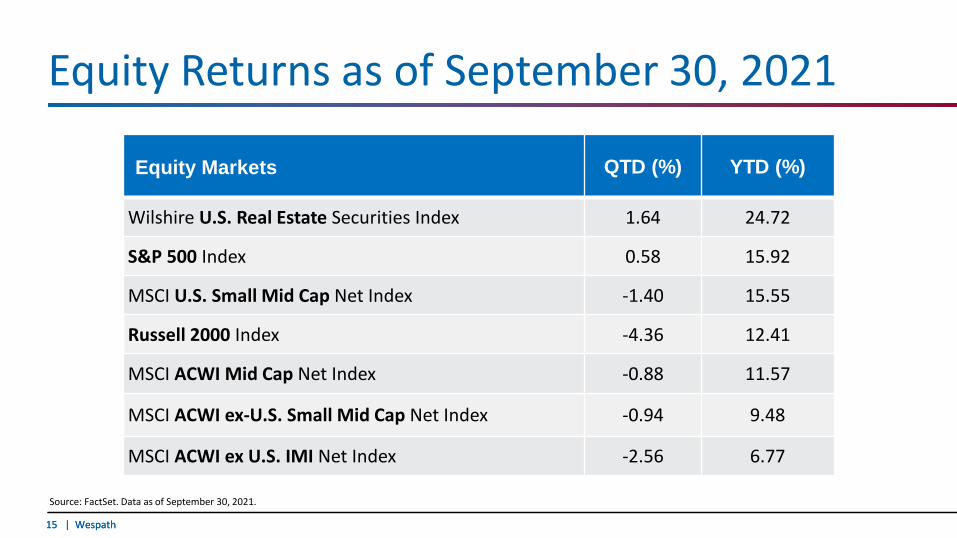
Equity Returns as of September 30, 2021
Equity Markets QTD (%) YTD (%)
Wilshire U.S. Real Estate Securities Index 1.64 24.72
S&P 500 Index 0.58 15.92
MSCI U.S. Small Mid Cap Net Index -1.40 15.55
Russell 2000 Index -4.36 12.41
MSCI ACWI Mid Cap Net Index -0.88 11.57
MSCI ACWI ex-U.S. Small Mid Cap Net Index -0.94 9.48
MSCI ACWI ex U.S. IMI Net Index -2.56 6.77
Source: FactSet. Data as of September 30, 2021.
16 | Wespath16 | Wespath
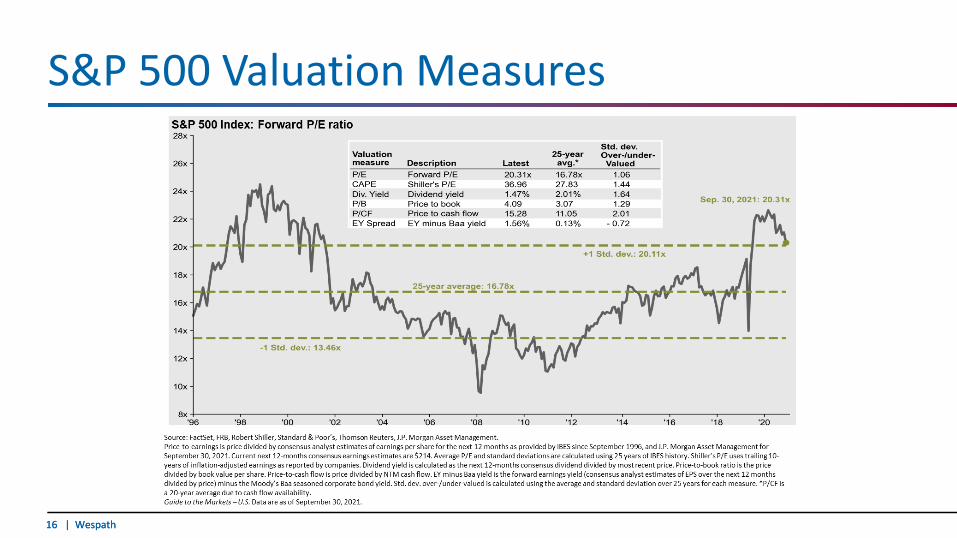
S&P 500 Valuation Measures
17 | Wespath17 | Wespath
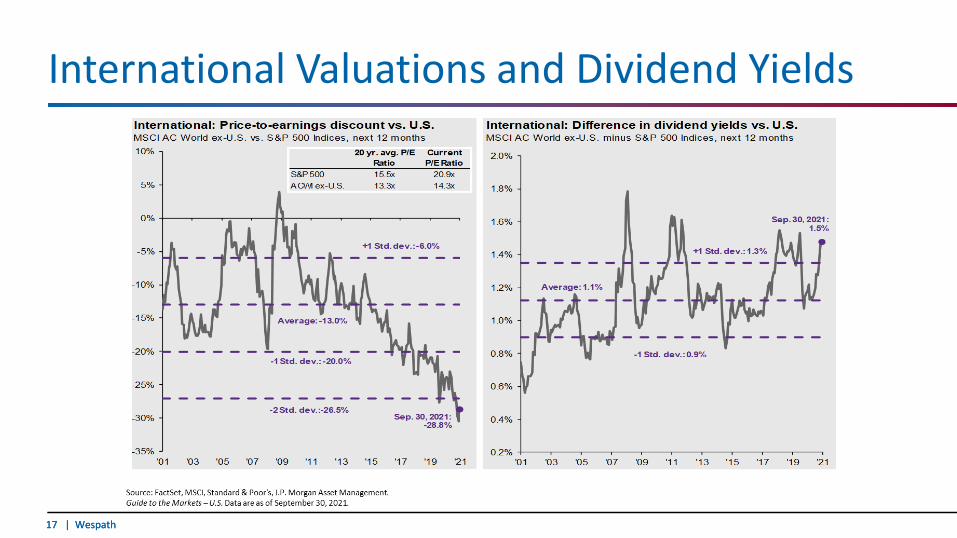
International Valuations and Dividend Yields
18 | Wespath18 | Wespath
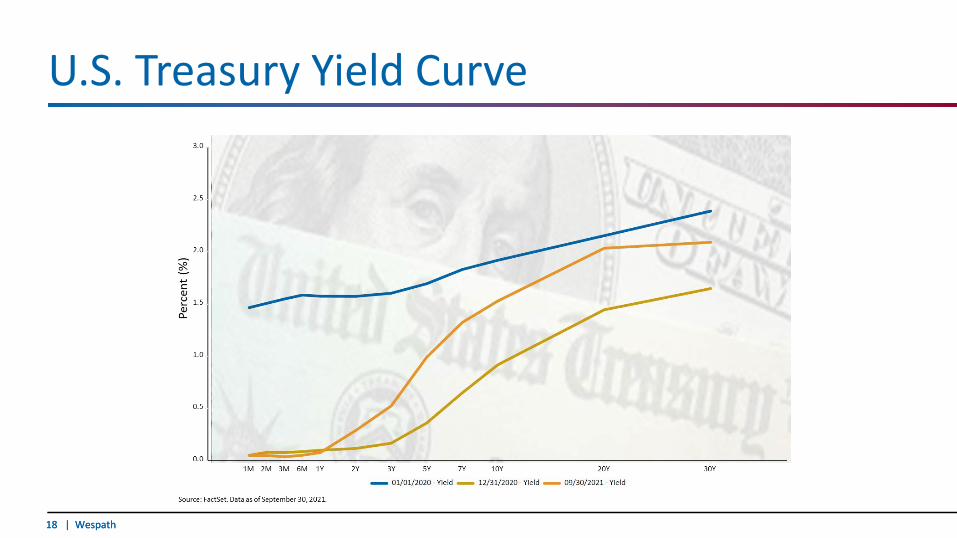
U.S. Treasury Yield Curve
19 | Wespath19 | Wespath
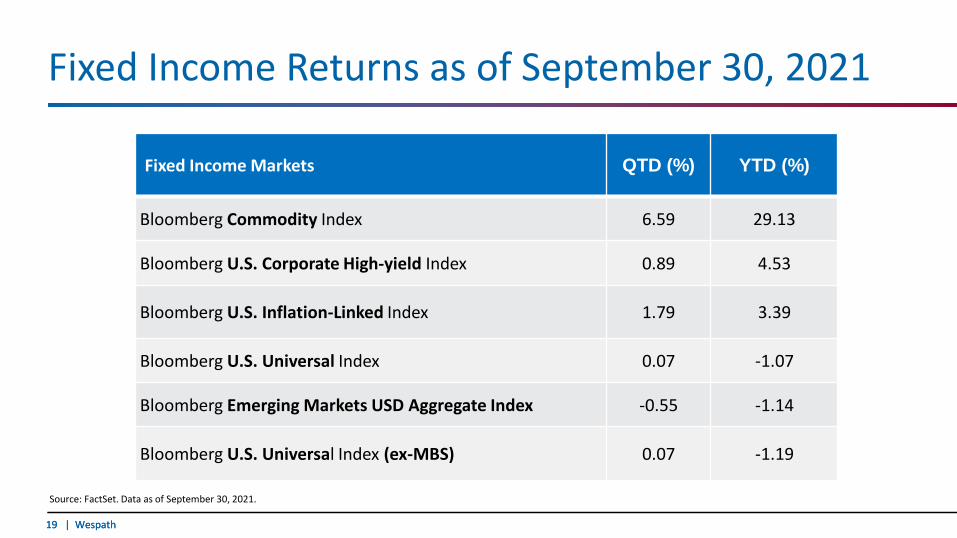
Fixed Income Returns as of September 30, 2021
Fixed Income Markets QTD (%) YTD (%)
Bloomberg Commodity Index 6.59 29.13
Bloomberg U.S. Corporate High-yield Index 0.89 4.53
Bloomberg U.S. Inflation-Linked Index 1.79 3.39
Bloomberg U.S. Universal Index 0.07 -1.07
Bloomberg Emerging Markets USD Aggregate Index -0.55 -1.14
Bloomberg U.S. Universal Index (ex-MBS) 0.07 -1.19
Source: FactSet. Data as of September 30, 2021.

Fund Review
21 | Wespath21 | Wespath
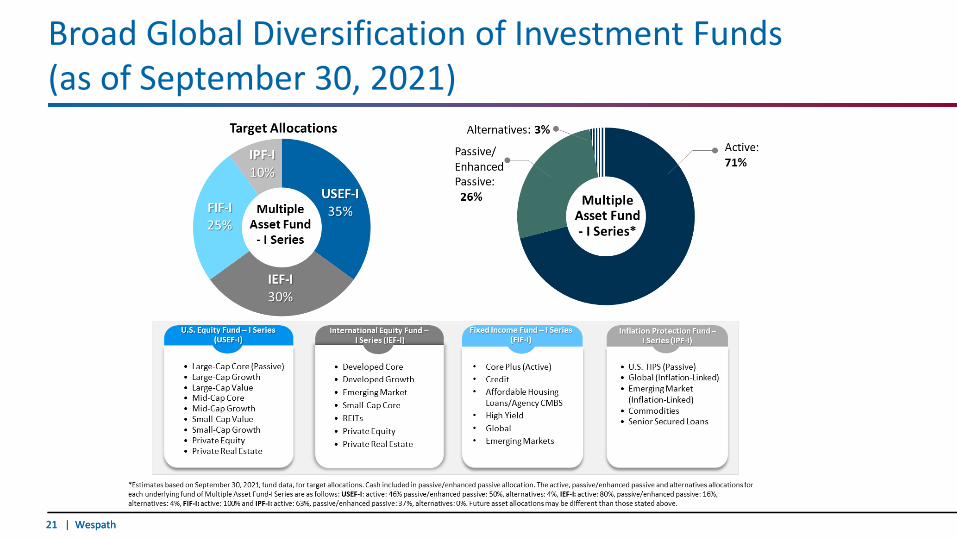
Broad Global Diversification of Investment Funds(as of September 30, 2021)
22 | Wespath22 | Wespath
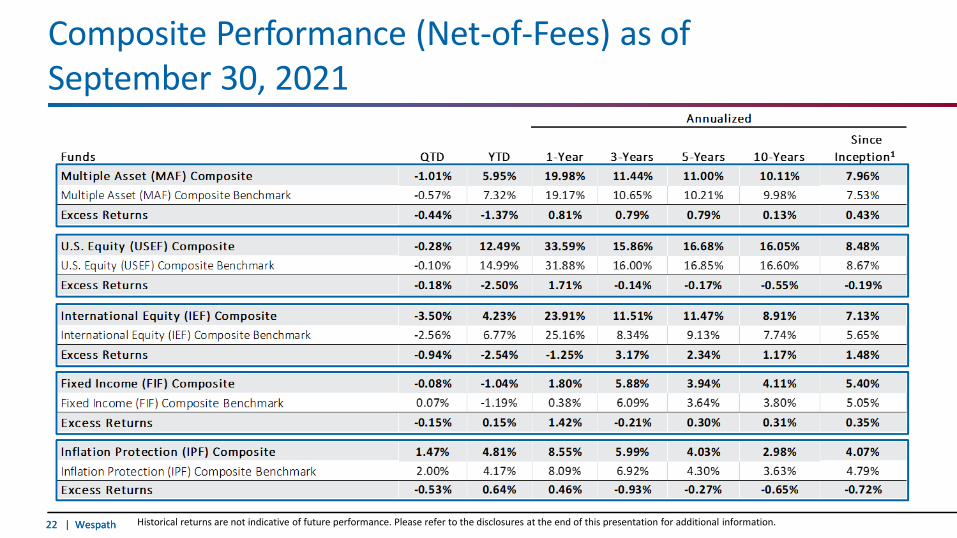
Composite Performance (Net-of-Fees) as of September 30, 2021
Historical returns are not indicative of future performance. Please refer to the disclosures at the end of this presentation for additional information.
23 | Wespath23 | Wespath
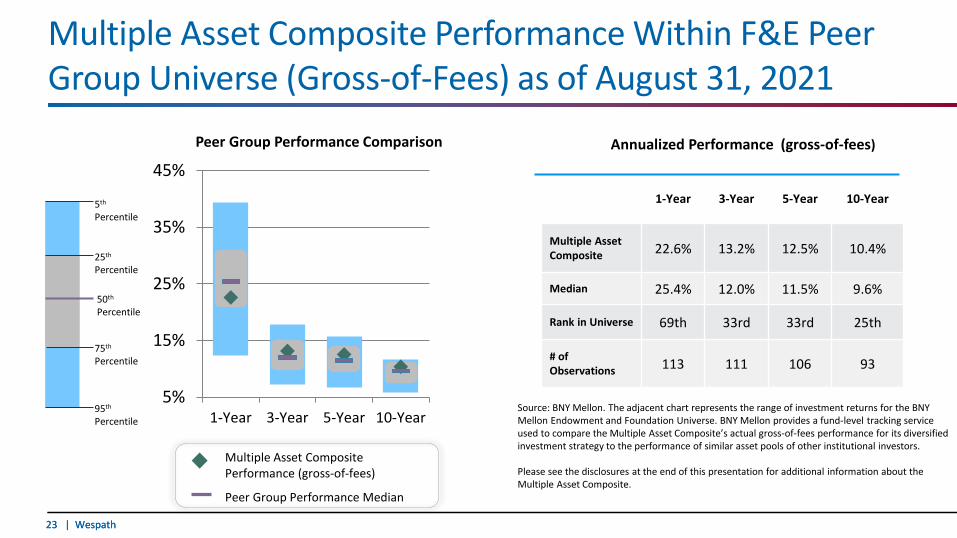
Multiple Asset Composite Performance Within F&E Peer Group Universe (Gross-of-Fees) as of August 31, 2021
5%
15%
25%
35%
45%
1-Year 3-Year 5-Year 10-Year
Peer Group Performance Comparison
Source: BNY Mellon. The adjacent chart represents the range of investment returns for the BNY Mellon Endowment and Foundation Universe. BNY Mellon provides a fund-level tracking service used to compare the Multiple Asset Composite’s actual gross-of-fees performance for its diversified investment strategy to the performance of similar asset pools of other institutional investors.
Please see the disclosures at the end of this presentation for additional information about the Multiple Asset Composite.
1-Year 3-Year 5-Year 10-Year
Multiple Asset Composite 22.6% 13.2% 12.5% 10.4%
Median 25.4% 12.0% 11.5% 9.6%
Rank in Universe 69th 33rd 33rd 25th
# of Observations 113 111 106 93
50th
Percentile
5th
Percentile
25th
Percentile
75th
Percentile
95th
Percentile
Multiple Asset CompositePerformance (gross-of-fees)
Peer Group Performance Median
Annualized Performance (gross-of-fees)

24 | Wespath24 | Wespath
Multiple Asset Fund – I Series—QTD Performance Attribution (Gross-of-Fees as of September 30, 2021)
Key Detractors
International Equity Fund – I Series HIGH
U.S. Equity Fund – I Series MED
Inflation Protection Fund – I Series LOW
Fixed Income Fund - I Series LOWHistorical returns are not indicative of future performance. Please refer to the disclosures at the end of this presentation for additional information.
Multiple Asset Fund - I Series -1.16%
MAF-I Benchmark 1 -0.57%
Difference -0.59%
Fund 3Q2021
25 | Wespath25 | Wespath
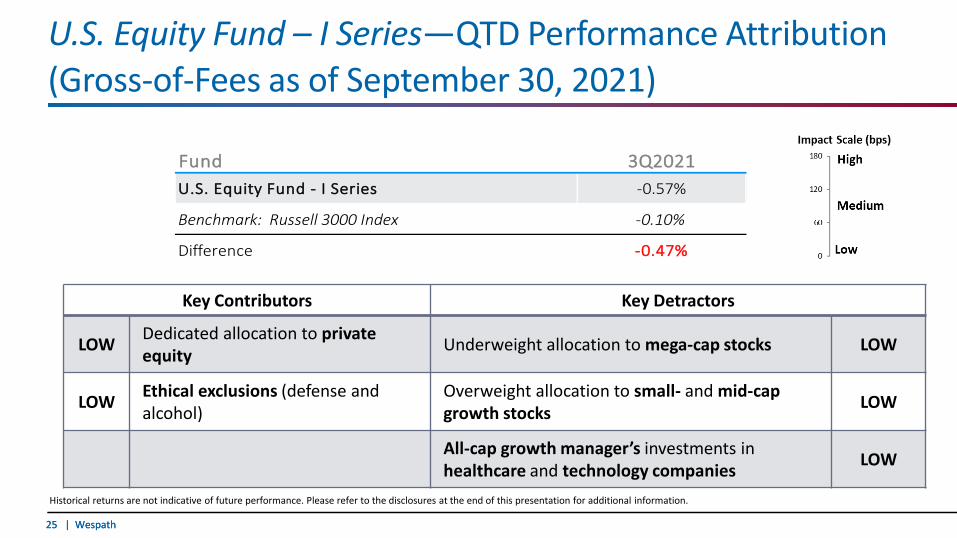
U.S. Equity Fund – I Series—QTD Performance Attribution (Gross-of-Fees as of September 30, 2021)
Key Contributors Key Detractors
LOW Dedicated allocation to private equity Underweight allocation to mega-cap stocks LOW
LOW Ethical exclusions (defense and alcohol)
Overweight allocation to small- and mid-cap growth stocks LOW
All-cap growth manager’s investments inhealthcare and technology companies LOW
U.S. Equity Fund - I Series -0.57%
Benchmark: Russell 3000 Index -0.10%
Difference -0.47%
Fund 3Q2021
Historical returns are not indicative of future performance. Please refer to the disclosures at the end of this presentation for additional information.
26 | Wespath26 | Wespath
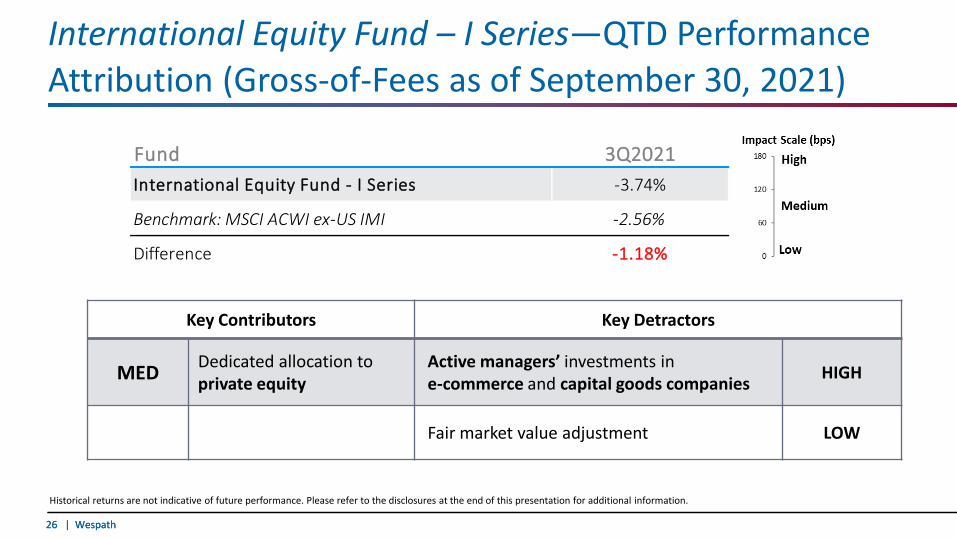
International Equity Fund – I Series—QTD Performance Attribution (Gross-of-Fees as of September 30, 2021)
Key Contributors Key Detractors
MED Dedicated allocation to private equity
Active managers’ investments in e-commerce and capital goods companies HIGH
Fair market value adjustment LOW
International Equity Fund - I Series -3.74%
Benchmark: MSCI ACWI ex-US IMI -2.56%
Difference -1.18%
Fund 3Q2021
Historical returns are not indicative of future performance. Please refer to the disclosures at the end of this presentation for additional information.
27 | Wespath27 | Wespath
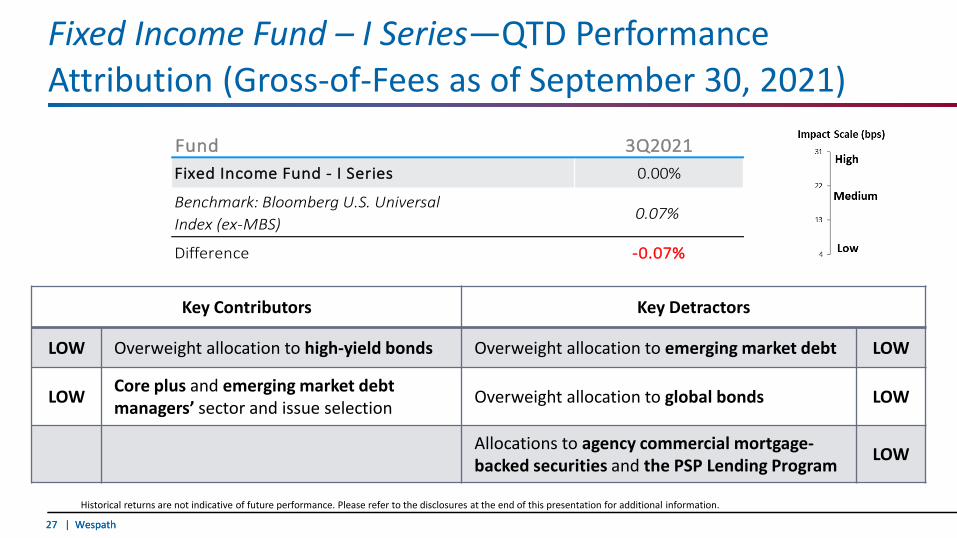
Fixed Income Fund – I Series—QTD Performance Attribution (Gross-of-Fees as of September 30, 2021)
Key Contributors Key Detractors
LOW Overweight allocation to high-yield bonds Overweight allocation to emerging market debt LOW
LOW Core plus and emerging market debtmanagers’ sector and issue selection Overweight allocation to global bonds LOW
Allocations to agency commercial mortgage-backed securities and the PSP Lending Program LOW
Fixed Income Fund - I Series 0.00%
Benchmark: Bloomberg U.S. Universal Index (ex-MBS)
0.07%
Difference -0.07%
Fund 3Q2021
Historical returns are not indicative of future performance. Please refer to the disclosures at the end of this presentation for additional information.
28 | Wespath28 | Wespath
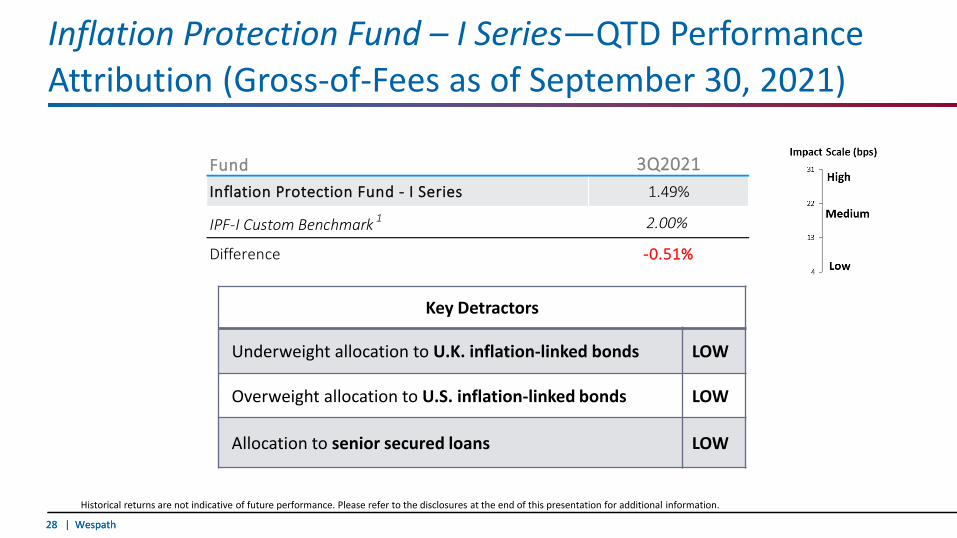
Inflation Protection Fund – I Series—QTD Performance Attribution (Gross-of-Fees as of September 30, 2021)
Key Detractors
Underweight allocation to U.K. inflation-linked bonds LOW
Overweight allocation to U.S. inflation-linked bonds LOW
Allocation to senior secured loans LOW
Inflation Protection Fund - I Series 1.49%
IPF-I Custom Benchmark 1 2.00%
Difference -0.51%
Fund 3Q2021
Historical returns are not indicative of future performance. Please refer to the disclosures at the end of this presentation for additional information.

Economic Update
30 | Wespath30 | Wespath
Inflation
31 | Wespath31 | Wespath
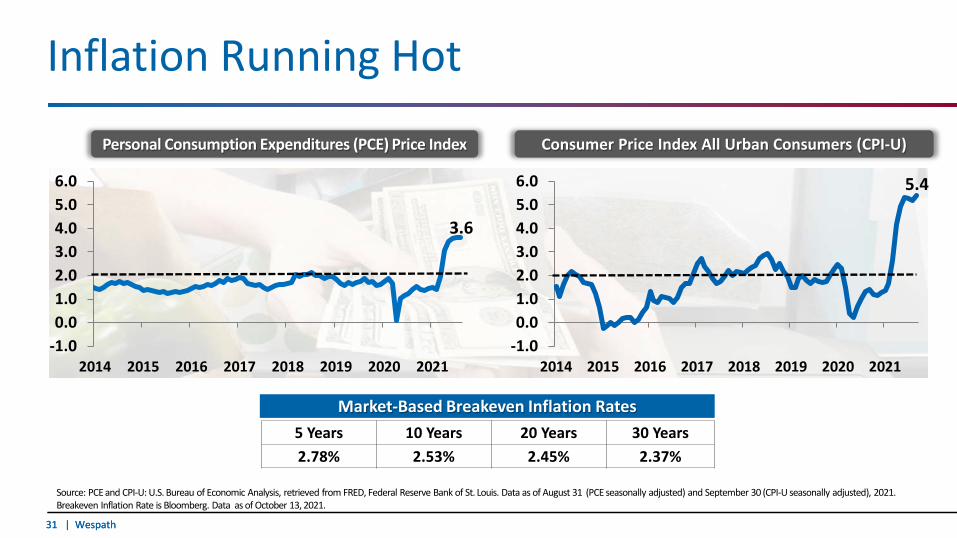
5.4
-1.00.01.02.03.04.05.06.0
2014 2015 2016 2017 2018 2019 2020 2021
3.6
-1.00.01.02.03.04.05.06.0
2014 2015 2016 2017 2018 2019 2020 2021
Inflation Running Hot
Personal Consumption Expenditures (PCE) Price Index Consumer Price Index All Urban Consumers (CPI-U)
Source: PCE and CPI-U: U.S. Bureau of Economic Analysis, retrieved from FRED, Federal Reserve Bank of St. Louis. Data as of August 31 (PCE seasonally adjusted) and September 30 (CPI-U seasonally adjusted), 2021. Breakeven Inflation Rate is Bloomberg. Data as of October 13, 2021.
5 Years 10 Years 20 Years 30 Years2.78% 2.53% 2.45% 2.37%
Market-Based Breakeven Inflation Rates

32 | Wespath32 | Wespath
Components of CPI
Source: U.S. Department of Labor Bureau of Labor Statistics, WespathData as of: December 30, 2020
Housing 46.6%
Food and Beverage 13.5%
Transportation 13.0%
Medical Care 12.2%
Recreation 5.4%
Education and Communication 4.3%
Apparel 1.9%
Other 3.1%
33 | Wespath33 | Wespath
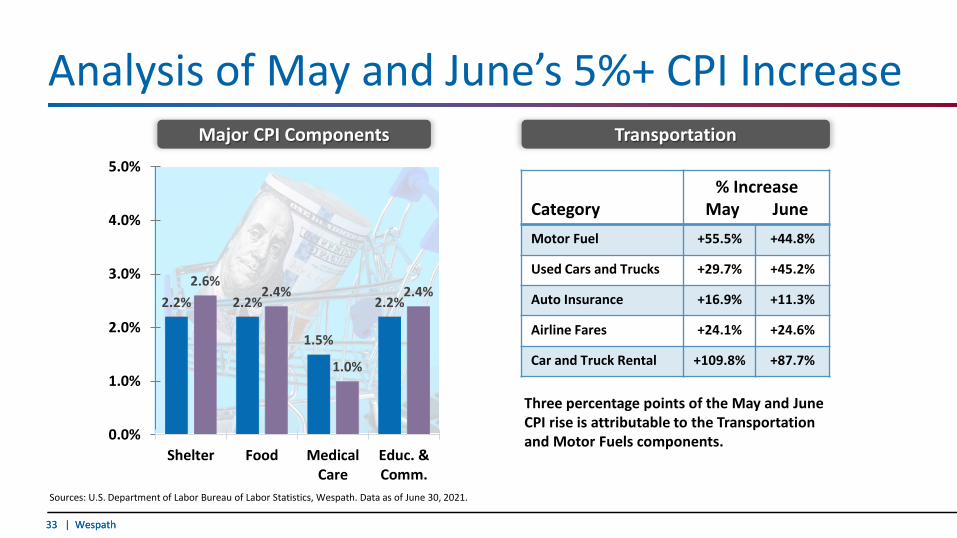
Analysis of May and June’s 5%+ CPI Increase
2.2% 2.2%
1.5%
2.2%2.6%
2.4%
1.0%
2.4%
0.0%
1.0%
2.0%
3.0%
4.0%
5.0%
Shelter Food MedicalCare
Educ. &Comm.
Major CPI Components Transportation
Category% Increase
May JuneMotor Fuel +55.5% +44.8%
Used Cars and Trucks +29.7% +45.2%
Auto Insurance +16.9% +11.3%
Airline Fares +24.1% +24.6%
Car and Truck Rental +109.8% +87.7%
Three percentage points of the May and June CPI rise is attributable to the Transportation and Motor Fuels components.
Sources: U.S. Department of Labor Bureau of Labor Statistics, Wespath. Data as of June 30, 2021.
34 | Wespath34 | Wespath
2.2% 2.2%
1.5%
2.6% 2.4%
1.0%
0.0%
1.0%
2.0%
3.0%
4.0%
5.0%
Shelter Food Medical Care
May June
2.8%
3.4%
0.8%
2.8%
3.7%
1.0%
3.2%
4.6%
0.9%
0.0%
1.0%
2.0%
3.0%
4.0%
5.0%
Shelter Food Medical Care
July August September
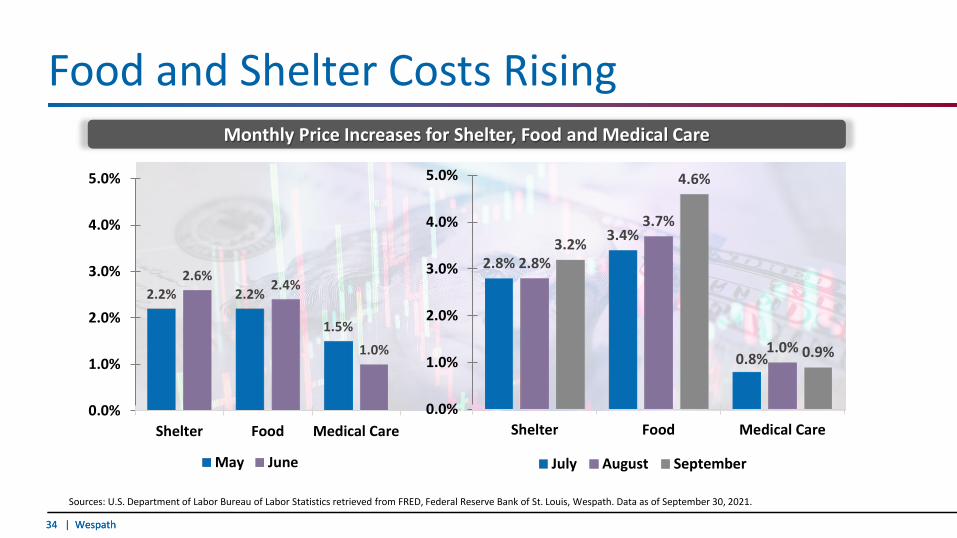
Food and Shelter Costs Rising
Sources: U.S. Department of Labor Bureau of Labor Statistics retrieved from FRED, Federal Reserve Bank of St. Louis, Wespath. Data as of September 30, 2021.
Monthly Price Increases for Shelter, Food and Medical Care
35 | Wespath35 | Wespath
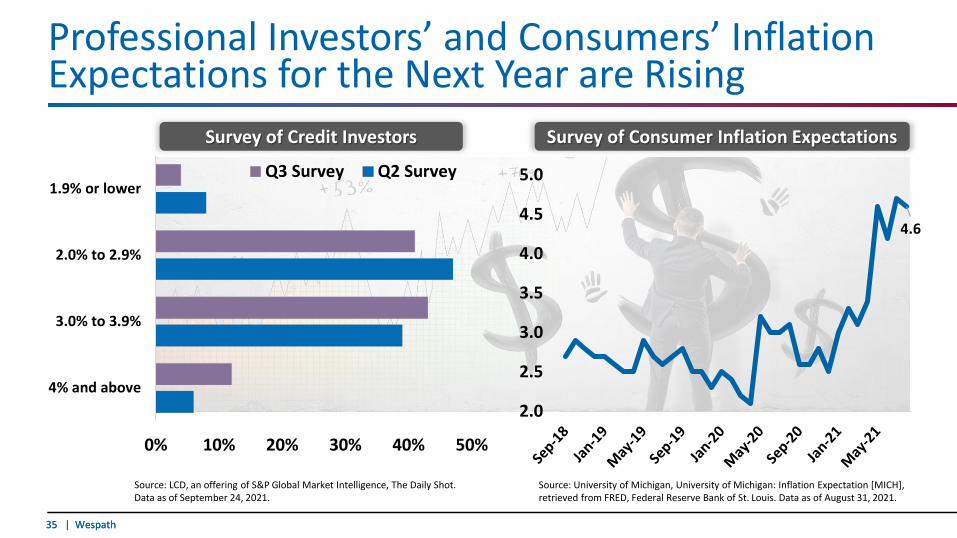
0% 10% 20% 30% 40% 50%
4% and above
3.0% to 3.9%
2.0% to 2.9%
1.9% or lowerQ3 Survey Q2 Survey
Professional Investors’ and Consumers’ Inflation Expectations for the Next Year are Rising
4.6
2.0
2.5
3.0
3.5
4.0
4.5
5.0
Source: University of Michigan, University of Michigan: Inflation Expectation [MICH], retrieved from FRED, Federal Reserve Bank of St. Louis. Data as of August 31, 2021.
Source: LCD, an offering of S&P Global Market Intelligence, The Daily Shot.Data as of September 24, 2021.
Survey of Credit Investors Survey of Consumer Inflation Expectations
36 | Wespath36 | Wespath
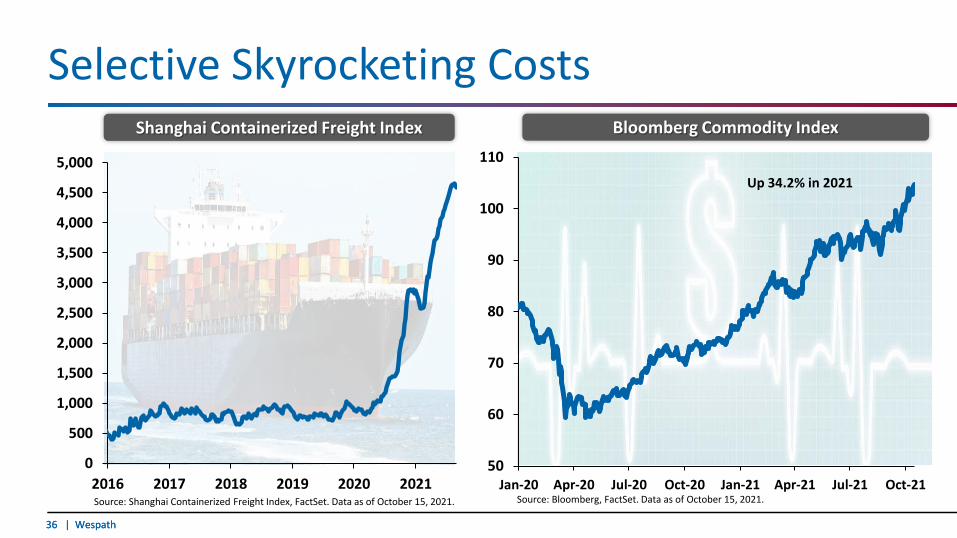
0
500
1,000
1,500
2,000
2,500
3,000
3,500
4,000
4,500
5,000
2016 2017 2018 2019 2020 2021
Selective Skyrocketing Costs
Source: Shanghai Containerized Freight Index, FactSet. Data as of October 15, 2021.
Shanghai Containerized Freight Index
50
60
70
80
90
100
110
Jan-20 Apr-20 Jul-20 Oct-20 Jan-21 Apr-21 Jul-21 Oct-21
Up 34.2% in 2021
Bloomberg Commodity Index
Source: Bloomberg, FactSet. Data as of October 15, 2021.

37 | Wespath37 | Wespath
Employment
38 | Wespath38 | Wespath
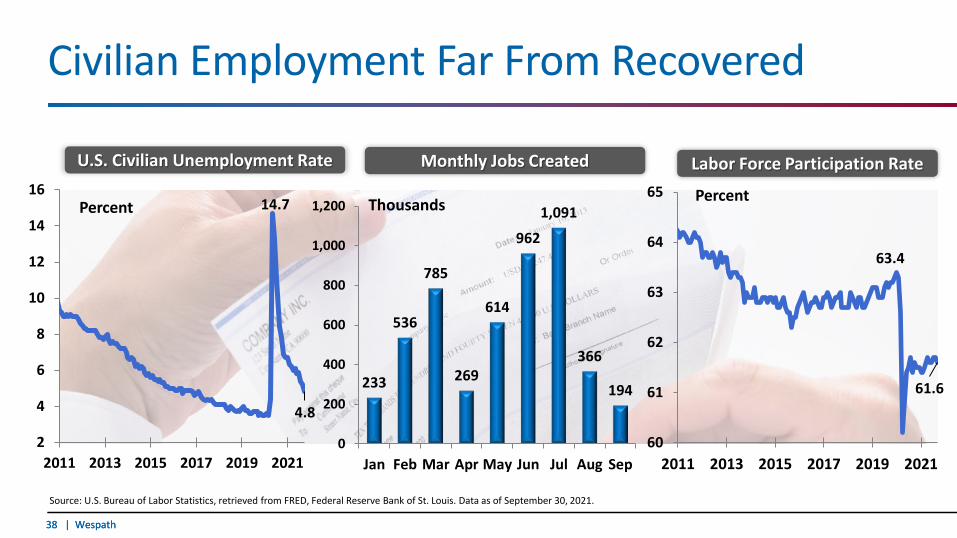
14.7
4.8
2
4
6
8
10
12
14
16
2011 2013 2015 2017 2019 2021
Civilian Employment Far From Recovered
Source: U.S. Bureau of Labor Statistics, retrieved from FRED, Federal Reserve Bank of St. Louis. Data as of September 30, 2021.
U.S. Civilian Unemployment Rate
Percent
233
536
785
269
614
962
1,091
366
194
0
200
400
600
800
1,000
1,200
Jan Feb Mar Apr May Jun Jul Aug Sep
Thousands
Monthly Jobs Created
63.4
61.6
60
61
62
63
64
65
2011 2013 2015 2017 2019 2021
Percent
Labor Force Participation Rate
39 | Wespath39 | Wespath
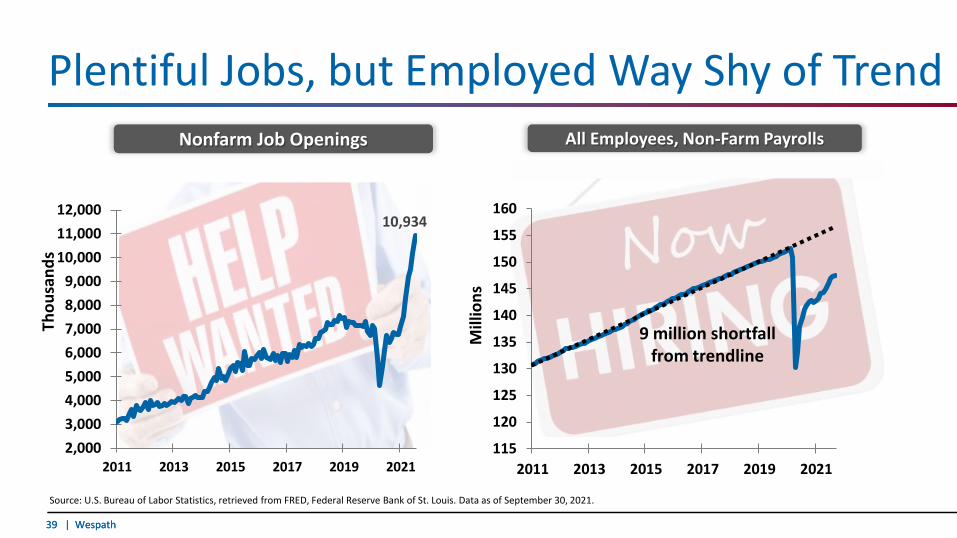
Plentiful Jobs, but Employed Way Shy of Trend
10,934
2,0003,0004,0005,0006,0007,0008,0009,000
10,00011,00012,000
2011 2013 2015 2017 2019 2021
Source: U.S. Bureau of Labor Statistics, retrieved from FRED, Federal Reserve Bank of St. Louis. Data as of September 30, 2021.
Thou
sand
s
Nonfarm Job Openings All Employees, Non-Farm Payrolls
115
120
125
130
135
140
145
150
155
160
2011 2013 2015 2017 2019 2021M
illio
ns
9 million shortfallfrom trendline
40 | Wespath40 | Wespath
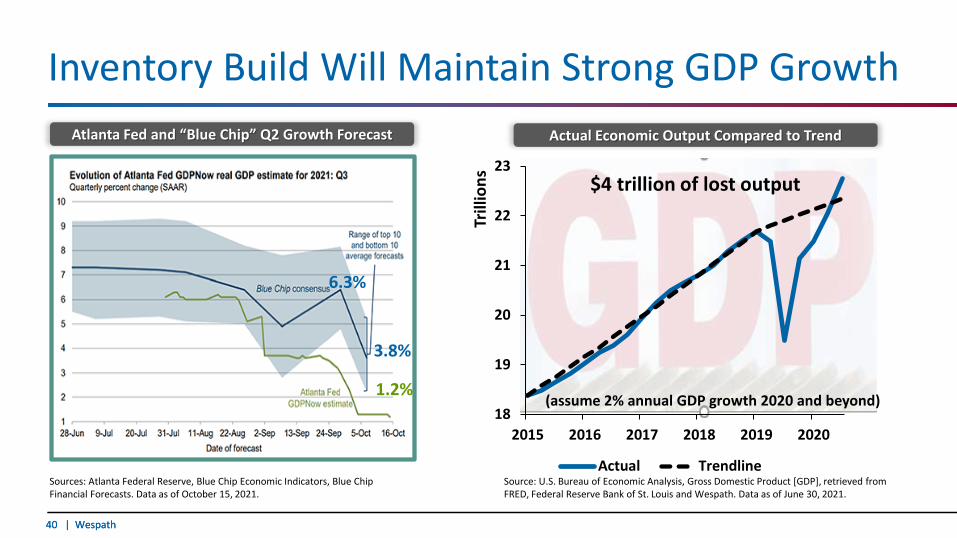
Inventory Build Will Maintain Strong GDP Growth
Sources: Atlanta Federal Reserve, Blue Chip Economic Indicators, Blue Chip Financial Forecasts. Data as of October 15, 2021.
Atlanta Fed and “Blue Chip” Q2 Growth Forecast
1.2%
3.8%
18
19
20
21
22
23
2015 2016 2017 2018 2019 2020
Trill
ions
Actual Trendline
$4 trillion of lost output
Source: U.S. Bureau of Economic Analysis, Gross Domestic Product [GDP], retrieved from FRED, Federal Reserve Bank of St. Louis and Wespath. Data as of June 30, 2021.
Actual Economic Output Compared to Trend
(assume 2% annual GDP growth 2020 and beyond)
6.3%
41 | Wespath41 | Wespath
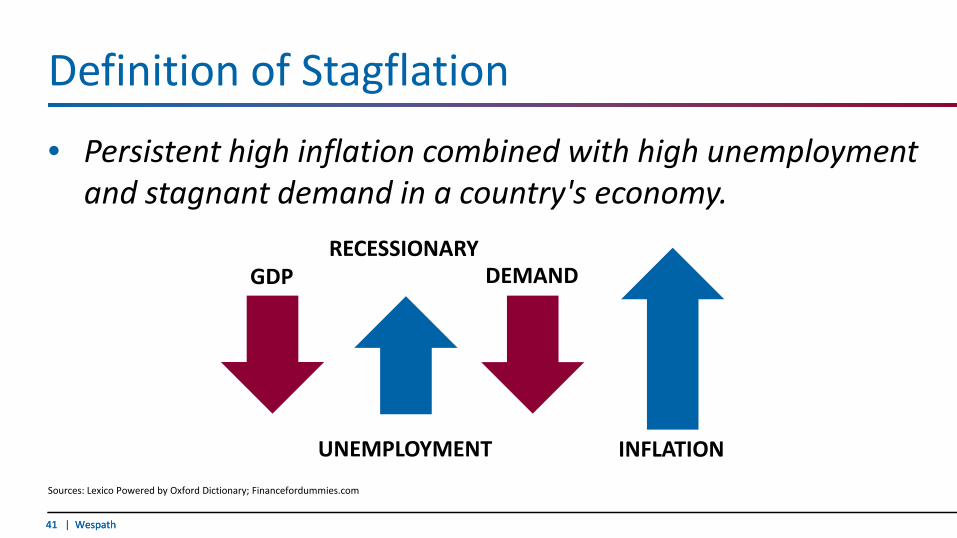
Definition of Stagflation
• Persistent high inflation combined with high unemployment and stagnant demand in a country's economy.
Sources: Lexico Powered by Oxford Dictionary; Financefordummies.com
GDP
UNEMPLOYMENT
RECESSIONARYDEMAND
INFLATION
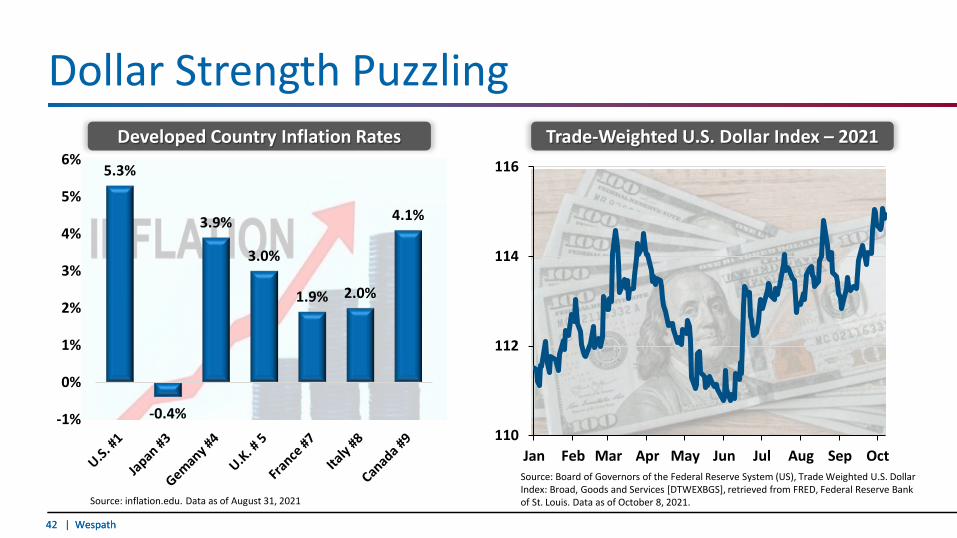
42 | Wespath42 | Wespath
110
112
114
116
Jan Feb Mar Apr May Jun Jul Aug Sep Oct
5.3%
-0.4%
3.9%
3.0%
1.9% 2.0%
4.1%
-1%
0%
1%
2%
3%
4%
5%
6%
Dollar Strength Puzzling
Source: inflation.edu. Data as of August 31, 2021
Developed Country Inflation Rates Trade-Weighted U.S. Dollar Index – 2021
Source: Board of Governors of the Federal Reserve System (US), Trade Weighted U.S. Dollar Index: Broad, Goods and Services [DTWEXBGS], retrieved from FRED, Federal Reserve Bank of St. Louis. Data as of October 8, 2021.
43 | Wespath43 | Wespath
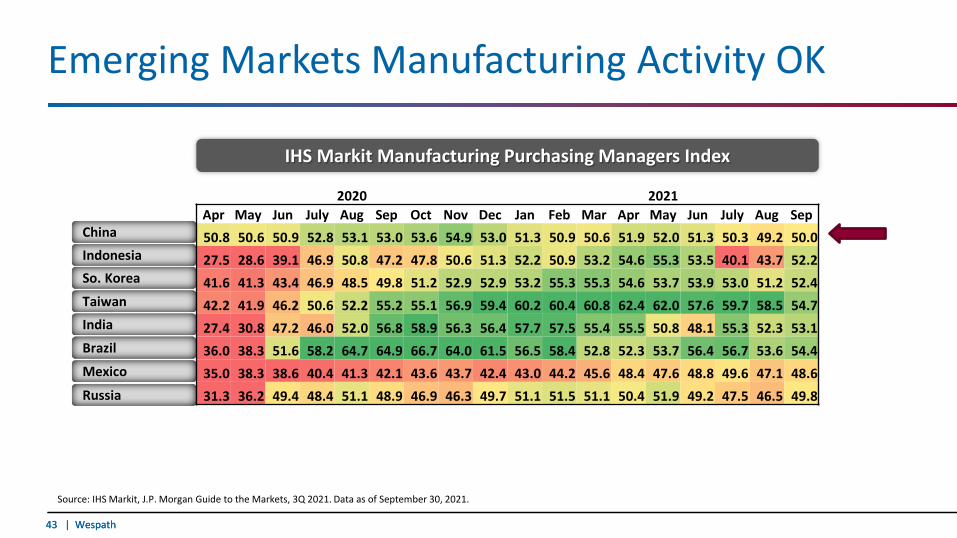
Emerging Markets Manufacturing Activity OK
IHS Markit Manufacturing Purchasing Managers Index
Source: IHS Markit, J.P. Morgan Guide to the Markets, 3Q 2021. Data as of September 30, 2021.
China Indonesia So. Korea
Taiwan India
Brazil
Mexico
Russia
2020 2021Apr May Jun July Aug Sep Oct Nov Dec Jan Feb Mar Apr May Jun July Aug Sep50.8 50.6 50.9 52.8 53.1 53.0 53.6 54.9 53.0 51.3 50.9 50.6 51.9 52.0 51.3 50.3 49.2 50.027.5 28.6 39.1 46.9 50.8 47.2 47.8 50.6 51.3 52.2 50.9 53.2 54.6 55.3 53.5 40.1 43.7 52.241.6 41.3 43.4 46.9 48.5 49.8 51.2 52.9 52.9 53.2 55.3 55.3 54.6 53.7 53.9 53.0 51.2 52.442.2 41.9 46.2 50.6 52.2 55.2 55.1 56.9 59.4 60.2 60.4 60.8 62.4 62.0 57.6 59.7 58.5 54.727.4 30.8 47.2 46.0 52.0 56.8 58.9 56.3 56.4 57.7 57.5 55.4 55.5 50.8 48.1 55.3 52.3 53.136.0 38.3 51.6 58.2 64.7 64.9 66.7 64.0 61.5 56.5 58.4 52.8 52.3 53.7 56.4 56.7 53.6 54.435.0 38.3 38.6 40.4 41.3 42.1 43.6 43.7 42.4 43.0 44.2 45.6 48.4 47.6 48.8 49.6 47.1 48.631.3 36.2 49.4 48.4 51.1 48.9 46.9 46.3 49.7 51.1 51.5 51.1 50.4 51.9 49.2 47.5 46.5 49.8
44 | Wespath44 | Wespath
China’s Lehman Moment?

Conclusion

47 | Wespath47 | Wespath
General DisclosuresGeneral Board of Pension and Health Benefits of The United Methodist Church, Incorporated in Illinois ("Wespath Benefits and Investments" or "Wespath") is a not-for-profit, administrative agency of the religious denomination known as The United Methodist Church.
Wespath is responsible for the general supervision and administration of retirement, disability, death and health benefit plans, and programs and for investment of the related assets and also through its subsidiaries provides certain investment services to institutional investors organized for religious, benevolent, or charitable purposes that are related to The United Methodist Church (sometimes referred to as the “Church”) as authorized by General Conference, the highest legislative authority of the Church. All funds under Wespath’s supervision are held in the Wespath Funds Trust, a Delaware statutory trust. Each of the funds available to investors is a series of the Wespath Funds Trust. The P Series funds are for investment of Church benefit plan related assets and the I Series funds are for investment of other assets of not-for-profit entities related to the Church such as foundations, children’s homes, older adult facilities, higher education institutions and healthcare organizations. UMC Benefit Board, Inc. (Benefit Board), a not-for-profit subsidiary of Wespath, is the trustee and investment adviser for the P Series funds. Wespath Institutional Investments (WII), a not-for-profit subsidiary of Wespath, is the trustee and investment adviser for the I Series funds.
Wespath, WII and Benefit Board are not registered investment advisers under the Investment Advisers Act of 1940, as amended, or under any comparable local, state or federal law or statute. Neither the Wespath Funds Trust nor the funds are registered as an investment company under the Investment Company Act of 1940 in reliance upon exclusions from the definition of an investment company under the Investment Company Act of 1940. Wespath, WII, Benefit Board, Wespath Funds Trust and the funds are not subject to registration, regulation or reporting under the Investment Company Act of 1940, the Securities Act of 1933, the Securities Exchange Act of 1934 or the Investment Advisers Act of 1940. Investors, therefore, will not be afforded the protections of those provisions of those laws and related regulations.
The investment funds referred to in this document are neither insured nor guaranteed by the government. No government entity has approved or disapproved these funds or passed upon the adequacy of this document.
This presentation is for informational purposes only, it does not constitute an offer to sell any investments and may be subject to changes and corrections. The material in this document contains summary information and is not a complete description of the investment guidelines, investment objectives, policies and risks or other matters associated with the investment funds. An offer for the sale of interests in the P Series funds will only be made through the Investment Funds Description – P Series. An offer for the sale of interests in the I Series funds will only be made through the Investment Funds Description – I. Any decision to invest with Wespath should be preceded by a complete review of the applicable disclosure documents as referenced above, which are available upon request or online at wespath.org.
Historical returns are not indicative of future performance. Except as otherwise noted, the performance in this presentation is presented net-of-fees—that is, with the deduction of investment management fees, custody fees, and administrative and overhead expenses. The fees and expenses for the P Series funds are described in the Investment Funds Description – P Series, and for the I Series funds in the Investment Funds Description – I Series.
The returns will be reduced by the amount of fees and expenses charged to the funds. The Funds’ expense ratios are based on projected asset balances, fees and expenses, and various other assumptions. Fund expense ratios may vary depending on, among other things, market events, portfolio size, transaction costs, timing of fund inflows and outflows, and applicable third party fees. All fees and expenses of the fund are deducted from the fund’s net asset value. The fees and expenses paid by the Fund include external investment management fees paid to subadvisors, and the fund's prorated portion of the bank custodial fees and administrative and overhead expenses incurred by the overall Wespath organization in connection with providing investment, operating and administrative support to the fund and other funds, and the cost of Wespath’s and its subsidiaries’ other activities and operations. These expenses are paid directly by the fund and are reflected in the unit price calculated for the fund.
As part of the Wespath organization, WII and Benefit Board utilize certain shared personnel, including the Wespath investment team. All WII shared personnel must comply in all respects with WII’s policies and procedures.
48 | Wespath48 | Wespath
General DisclosuresSlide 22 – Composite Performance (Net-of-Fees) 1. The inception for the MAF Composite is April 30, 2002; for the IPF Composite, it is January 5, 2004; for the remaining Composites it is December 31, 1997.
Slide 24 – Multiple Asset Fund – I Series – QTD Performance Attribution (Gross-of-Fees)This is not a complete list of all contributors and detractors. Fund performance is gross-of-fees. Multiple Asset Fund – I Series net-of-fees return for the third quarter of 2021 was -1.30%.1. The Multiple Asset Fund – I Series performance benchmark is a blended benchmark comprised of 35% Russell 3000 Index, 30% MSCI All Country World Index (ACWI) ex-USA Investable Market Index (IMI), 25% Bloomberg Barclays U.S. Universal Index ex-Mortgage Backed Securities (MBS) and 10% Inflation Protection Fund (IPF) - I Series performance benchmark. The IPF – I Series performance benchmark consists of a blended benchmark comprised of 80% Bloomberg Barclays World Government Inflation Linked Bond Index (Hedged), 10% Bloomberg Barclays Emerging Market Tradeable Inflation Linked Bond Index (Unhedged) and 10% Bloomberg Commodity Index.
Slide 25 – U.S. Equity Fund – I Series – QTD Performance Attribution (Gross-of-Fees)This is not a complete list of all contributors and detractors. Fund performance is gross-of-fees. U.S. Equity Fund – I Series net-of-fees return for the third quarter of 2021 was -0.70%.
Slide 26 – International Equity Fund – I Series – QTD Performance Attribution (Gross-of-Fees)This is not a complete list of all contributors and detractors. Fund performance is gross-of-fees. The International Equity Fund – I Series net-of-fees return for the third quarter of 2021 was -3.92%.
Slide 27 – Fixed Income Fund – I Series – QTD Performance Attribution (Gross-of-Fees)This is not a complete list of all contributors and detractors. Fund performance is gross-of-fees. The Fixed Income Fund – I Series net-of-fees return for the third quarter of 2021 was -0.13%.
Slide 28 – Inflation Protection Fund – I Series – QTD Performance Attribution (Gross-of-Fees)This is not a complete list of all contributors and detractors. Fund performance is gross-of-fees. The Inflation Protection Fund – I Series net-of-fees return for the third quarter of 2021 was 1.38%.1. The Inflation Protection Fund – I Series performance benchmark is a blended benchmark comprised of 80% Bloomberg Barclays World Government Inflation Linked Bond Index (Hedged), 10% Bloomberg Barclays Emerging Market Tradeable Inflation Linked Bond Index (Unhedged) and 10% Bloomberg Commodity Index.
49 | Wespath49 | Wespath
Composite Performance DisclosuresWespath Benefits and Investments (“Wespath”) is a general agency of The United Methodist Church, a 501(c)(3) tax-exempt organization. Wespath administers benefit plans and together with its subsidiaries, UMC Benefit Board, Inc. (“UMCBB”) and Wespath Institutional Investments, LLC (“WII”) invests (or provides back-office services for) assets on behalf of benefit plan participants and beneficiaries, plan sponsors and other institutions controlled by, affiliated with or related to The United Methodist Church (the “Church”). For GIPS compliance purposes, the Firm referenced herein is defined to include Wespath, UMCBB and WII (“Firm”). Wespath claims compliance with the Global Investment Performance Standards (GIPS®). GIPS is a registered trademark of CFA Institute. CFA Institute does not endorse or promote this organization, nor does it warrant the accuracy or quality of the content contained herein. To obtain a copy of Wespath’s GIPS Report, please call us at 1-847-866-4100 or e-mail us at [email protected].
The performance shown is for the stated time period only and computed in U.S. Dollars (USD). Historical returns are not indicative of future performance. Investment performance is presented net-of-fees—that is, with the deduction of external investment management fees, custody fees, and administrative and overhead expenses. The investments of the funds and composites may vary substantially from those in the applicable benchmark. The benchmarks are based on broad-based securities market indices, which are unmanaged, cannot be invested in and are not subject to fees and expenses typically associated with investment funds. Investments cannot be made directly in an index. This chart was produced using data from sources believed to be accurate.
The performance presented reflects the historical performance record of the composite employed by: (a) Wespath Institutional Investments (WII) through funds called the I Series funds available as of January 1, 2019; and (2) UMC Benefit Board, Inc. an affiliated entity, through funds called the P Series funds and available to certain institutional investors prior to January 1, 2019. The composite includes the applicable P Series fund before January 1, 2019. After January 1, 2019 the composite includes both the applicable P Series fund and I Series fund (asset-weighted). The composite for the applicable P Series fund and I Series fund have substantially similar investment objectives and investment strategies and are referred to collectively as “the Composite.” The P Series funds are not available to institutional investors other than in exceptional circumstances agreed to by the P Series funds adviser. Historical returns are not indicative of future performance. Returns presented are time-weighted returns. Net returns are presented net of actual fees and expenses, including transaction costs, custody fees, sub-advisory fees, and administrative/overhead expenses and are net of withholding taxes. The portfolios in the Composite do not pay any investment management fees to Wespath. Administrative/overhead expenses are paid by the portfolios in the Composite to Wespath.
50 | Wespath50 | Wespath
Composite Benchmark DisclosuresThroughout this document, the terms “benchmark” is used to refer to comparisons of each fund’s performance. A benchmark is a standard that investors use to evaluate how well a fund has performed. Comparing a fund to this fixed standard allows investors to evaluate how well the fund did in terms of meeting its goals, whether the goal was to match returns of the benchmark or to attain a return above the benchmark.
The investments of the Composites may vary substantially from those in the applicable benchmark. The benchmarks are based on broad-based securities market indices, which are unmanaged and are not subject to fees and expenses typically associated with investment funds. Investments cannot be made directly in an index.
FIF Composite Benchmark: The benchmark is the Bloomberg Barclays U.S. Universal Index (excluding mortgage-backed securities), effective August 24, 2016. The index consists of the U.S. Aggregate Bond Index, the U.S. High-Yield Corporate Index, the 144A Index, the Eurodollar Index, the Emerging Markets Index and the non-ERISA portion of the CMBS Index. Non-dollar denominated issues are excluded from the index.
IEF Composite Benchmark: The benchmark is the MSCI All Country World Index (ACWI) ex USA Investable Market Index (IMI) Net. The index measures the performance of equities of companies domiciled in developed and emerging markets, excluding the U.S. Benchmark returns are measured net of dividend tax withholding.
IPF Composite Benchmark: The blended benchmark comprises 80% Bloomberg Barclays World Government Inflation Linked Bond Index (Hedged), 10% Bloomberg Barclays Emerging market Tradeable Inflation Linked Bond Index (Unhedged) and 10% Bloomberg Commodity Index. The Bloomberg Barclays World Government Inflation Linked Bond Index (Hedged) measures the investment performance of a portfolio of developed market investment grade government inflation-linked debt. The Bloomberg Barclays Emerging Market Tradeable Inflation Linked Bond Index measures the investment performance of a portfolio of local currency emerging markets inflation-linked government debt. The Bloomberg Commodity Index measures the investment performance of a broadly diversified portfolio of futures contracts on physical commodities. The benchmark is calculated monthly using the monthly index return and the target index weights.
MAF Composite Benchmark: ffective January 1, 2017 the blended benchmark comprises: 35% Russell 3000 Index Gross, 30% MSCI All Country World Index (ACWI) ex-USA Investable Market Index (IMI) Net, 25% Bloomberg Barclays U.S. Universal Index ex-Mortgage Backed Securities (MBS), 10% Inflation Protection Composite’s blended benchmark (80% Bloomberg Barclays World Government Inflation Linked Bond Index (Hedged), 10% Bloomberg Barclays Emerging Market Tradeable Inflation Linked Bond Index (Unhedged) and 10% Bloomberg Commodity Index. The benchmark is calculated monthly using the monthly index return and the target index weights. Descriptions of each component of this blended benchmark can be found on each of the underlying composites.
USEF Composite Benchmark: The benchmark is the Russell 3000 Index Gross. The index measures the investment performance of the 3,000 largest (based on total market value) U.S. companies, representing approximately 98% of the publicly traded companies available for investment in the U.S. equity market.
affiliated with The United Methodist Church