national product and national utility: accounts of socio-economic wellbeing from time budgets....
TRANSCRIPT

National Product and National Utility: Accounts of
Socio-economic Wellbeing from Time Budgets.
Jonathan Gershuny
Centre for Time Use Research
Department of Sociology
University of Oxford

Summary• Time budgets can be used to produce
complete “extended national product” (eGNP) accounts.
• Time diaries can also be used to measure utility in the original (Bentham/Mill) sense...
• ...and used in turn to produce Gross National Utility (GNU) accounts.
• eGNP and GNU give different pictures of historical change in well-being.

Happiness, well-being & public purpose
• Durkheim: happiness object of ec. progress?• Kahneman: subjective vs objective happiness• Easterlin Paradox: happiness vs GNP….• …but why is the disjunction between growth
and happiness surprising?• Krueger, Kahneman (2009) Nat. Time Accs.• Public policy implications: Stiglitz commission

Work and National Product• Third person criterion:
– “work is any activity you can pay a third party to do for you without losing the benefit from it”.
• Hence:–unpaid household work, volunteering...–These can substitute for paid work– “Extended National Product”

“…without losing the benefit…”
• Refers to income or material product of the activity
• …ie implies that that there are no intrinsic satisfactions (or dis-satisfactions) in the conduct of paid and unpaid work.
• A strong assumption…• Alternative: JS Mill “utility”:
–Consumption & production both generate utilities alternative national accounts.
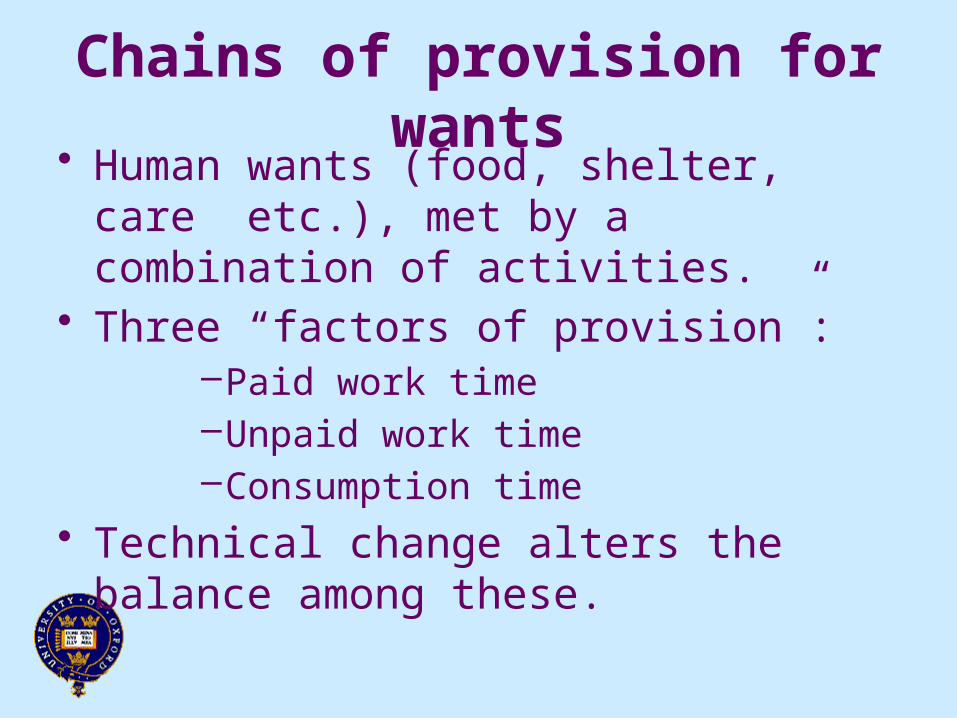
Chains of provision for wants• Human wants (food, shelter, care etc.),
met by a combination of activities.• Three “factors of provision”:
–Paid work time–Unpaid work time–Consumption time
• Technical change alters the balance among these.


A National Time Budget: UK adults, 1961 (minutes per UK adult aged 18+)
UK time_______________________________________ Non-UK
leisure
unpaid
work
UK paid work time___________
Med,Educ
M’gers,scientists
Other Serv
Manual total
Imprtwork
Sleep 564
Shelter,nutrition
94 159
Home leisure 213 12
Out-Leis, shops
87 25
Med & Ed 5
B’ground servs
Exports
TOTAL 963 196 15 32 83 150 1440

Input/output time budget construction
• Associate each final commodity with one (or more) categories of want…
• … multiply through by input/output coefficients to get value added by industry, plus imports and exports…
• … treating investment as if intermediate outputs…
• …then multiply through by hours of work by industry and occupation from LFS…
Gershuny 2000 Chapter 5(?)

A National Time Budget: UK adults, 1961 (minutes per UK adult aged 18+)
UK time_______________________________________ Non-UK
leisure
unpaid
work
UK paid work time___________
Med,Educ
M’gers,scientists
Other Serv
Manual total
Imprtwork
Sleep 564 564
Shelter,nutrition
94 159 1 15 32 71 374 24
Home leisure 213 12 1 2 5 12 245 4
Out-Leis, shops
87 25 0 2 13 12 139 3
Med & Ed 5 12 2 10 8 37 2
B’ground servs
1 5 13 17 36 1
Exported work
0 5 11 30 45 6
TOTAL 963 196 15 32 83 150 1440 40
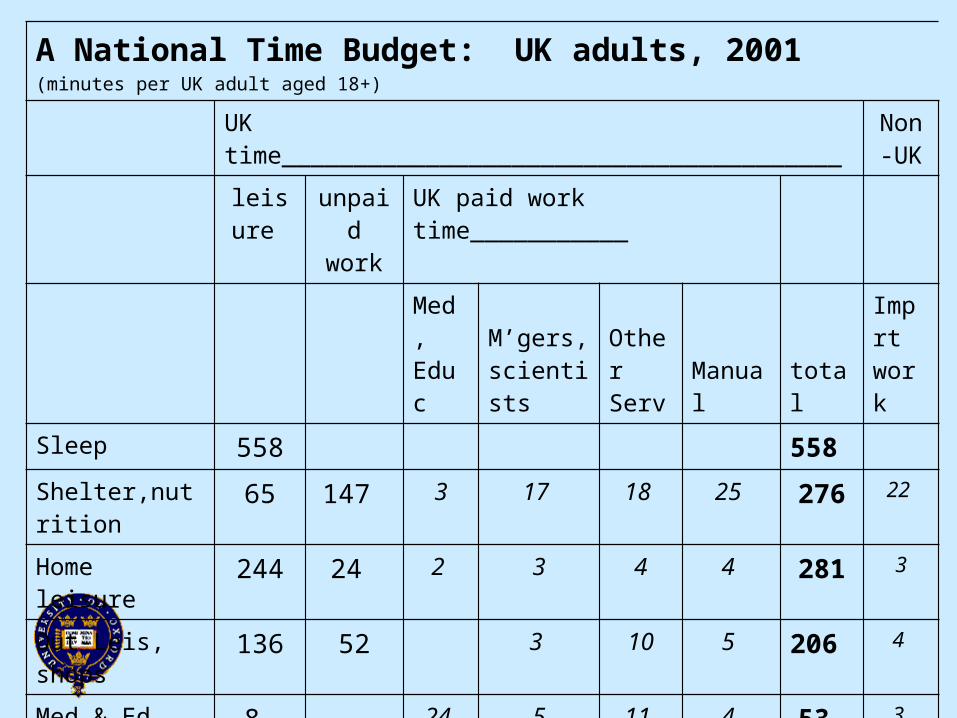
A National Time Budget: UK adults, 2001 (minutes per UK adult aged 18+)
UK time_______________________________________ Non-UK
leisure
unpaid
work
UK paid work time___________
Med,Educ
M’gers,scientists
Other Serv
Manual total
Imprtwork
Sleep 558 558
Shelter,nutrition
65 147 3 17 18 25 276 22
Home leisure 244 24 2 3 4 4 281 3
Out-Leis, shops
136 52 3 10 5 206 4
Med & Ed 8 24 5 11 4 53 3
B’ground servs
2 8 10 6 25 1
Exported work
2 11 11 18 41 10
TOTAL 1011 224 34 47 62 62 1440 43

GNP: non-exhaustive,input-based estimation
• GNP = ∑(paid time*wages)
Leisure,Consumption
Unpaid work
Paid work
All UK time
All UK time
1011 223 206 1440

Shift in paid/unpaid work balance
All UK work time Minutes/day
1961 2001
Paid work time 281 205
Unpaid work time 186 224
total 477 429
Paid as % of all work 59% 48%

GNP extension: valuing unpaid work
• Two methods:
1 Shadow wages– Assumes unpaid value=own marginal wage– values home-baked cake for brain surgeon at
10 times value of ditto for pastry chef
2 Shadow prices:– Either: specialist (eg taxi driver for school trip)– Or “housekeeper wage”

GNP and extended GNP, input-based
• GNP = ∑(paid time*wages)• Extended GNP =
∑(paid time*wages) + ∑(unpaid time*shadow wages)
Leisure,Consumption
Unpaid work
Paid work
All UK time
All UK time
1011 223 206 1440

Valuing consumption events• National accounting identity:
– Value of production ≡ value of consumption• Alternative approach to extension:
– Count consumption events in diary (meals, trips, outings, rests, nights’ sleep etc.)
– Use market prices for purchased instances– Use market-equivalent prices for home produced
instances (eg taxis for car trips, hotel rates for nights sleep etc); subtract costs of inputs (rent, materials etc).
(Luisella Goldschmidt-Clermont, Duncan Ironmonger, Sue Holloway)

Ext. GNP + nat. consump exhausts activity• Extended GNP =
∑(paid time*wages)+ ∑(unpaid time*shadow wages)
≡• (Extended) National Consumption =
Sum of actual or shadow values of every consumption episode
Leisure,Consumption
Unpaid work
Paid work
All UK time
All UK time
1011 223 206 1440

UK National Product and Extended National Product Estimates
(based on activity patterns of population aged 20-65)
Conventional National Product
Extended National Product
Extended NP as % of Conventional NP
1961 100 100 164
1984 162 199 201
2001 295 334 185

Ext. GNP + nat. consump exhausts activity• Extended GNP =
∑(paid time*wages)+ ∑(unpaid time*shadow wages)
≡• (Extended) National Consumption =
Sum of actual or shadow values of every consumption episode
• Exhaustive, BUT....• value added focus implies no intrinsic
welfare consequence from work• Hence need for more comprehensive
indicator

Utility is not happiness• Happiness vs utility in Kahneman (1999):
– “subjective happiness”== judgement of general affective state over a past interval (“Helen’s thoughts about how happy she was in March”)
– “objective happiness” == instant enjoyment of the moment, recorded by diary or similar…
– …“…an objective and normatively justified definition of ‘true’ well-being that is based on instantaneous utility” (p.4).

Process benefits, utility, enjoyment
• Utility: surveys of enjoyment of activities (JS Mill 1863)– “What is there to decide whether a particular pleasure is worth
purchasing at the cost of a particular pain, except the feelings and judgement of the experienced?”…“What means are there of determining which is the acutest of two pains or the intensest of two pleasurable sensations, except the general suffrage of those familiar with both?” (Utilitarianism Chapter 2)
• Process benefits (Juster and Stafford 1984) • “joint production” with national output• ∑(time in activity * questionnaire-based enjoyment measure)
• National Time Accounts (Krueger and Kahneman 2009)• ∑(time in activity * diary-based enjoyment measure)

Affect time diary studies
• Robinson 1985 US open-coded self-completion diary, start/end intervals, with enjoyment scale 0-10
• Erlich UK 1986 pre-coded self-completion diary, fixed 30-minute slots, converted to start/end with terminal affect score, enjoyment scale 5-1, recoded 2*(5.5 - enjoyment score)

USA enjoyment scores, 95% confidence intervals
out-home leisure
sleep & personal
care
other home leisure
tv child care
MEAN paid work
travel shopping
unpaid work
5.50
6.00
6.50
7.00
7.50
8.00
8.50
9.00

Men’s and women’s enjoyment of activities
5.00
5.50
6.00
6.50
7.00
7.50
8.00
8.50
9.00
m f m f m f m f m f m f m f m f m f m f m f m f m f m f m f m f m f m f m f m f
out-home
leisure
sleep &personal
care
otherhome
leisure
tv childcare
USMEAN
paidwork
travel shopping unpaidwork
out-home
leisure
sleep &personal
care
otherhome
leisure
tv childcare
UKMEAN
paidwork
travel shopping unpaidwork
US UK
enjo
ymen
t sc
ores

Utility estimation: analysis strategy
• Start with a “case=event” file…• …attach to each event of a particular
activity type, aggregate estimates of total time devoted by diarist to that activity during the diary day…
• …weight each event by its duration and…• …regress total time, total time squared,
and controls onto measured enjoyment of the event.

Utility from one type of activity
Eq 1) eij = ajkX + bjtj +cjt2
j
Marginal utility for an activity
Eq 2) δeij/δtj =bj+2cjtj
Total utility for the observation period
Eq 3) u = (∑1i∑1
j dij.eij )/TWhere:
– eij is the enjoyment rating of each diary event – dij is the duration of each event – i events in a continuous diary sequence – j exclusive categories of activity (eg “sleep”, “watching television”, “paid work”) – X a vector of k control variables – tj total all time devoted by diarist to activity j over the entire period.
Estimate from j separate equations (one for each activity)

OLS regressions. Dependent : enjoyment ratings11 point ( 0-10) scale for US, 5 point (1-9) scale for UK, p<.05 in bold
Other controls not shown: age, age sq, employed fulltime, has cores. partner, youngest child aged <5, youngest child aged 5-15,
complete sec'ry ed, some tertiary educ, log hourly wage
US (1985)leis out
other home leis
pers. care tv
paid work
dom work shop
child care travel
Multiple R 0.24 0.12 0.06 0.15 0.16 0.09 0.22 0.26 0.14
Mins in activity/100 0.31 0.30 0.25 -0.07 0.05 0.09 0.24 -0.08 -0.18
Mins acty sq/10000 -0.02 -0.03 -0.02 0.02 -0.01 -0.01 0.65 0.08 0.03
UK (1986)
Multiple R 0.17 0.20 0.19 0.21 0.24 0.28 0.29 0.23 0.26
Mins in activity/100 0.25 0.35 0.49 0.48 -0.08 0.00 1.16 0.47 0.19
Mins acty sq/10000 -0.02 -0.04 -0.04 -0.06 0.02 0.02 -0.16 -0.10 -0.01

Effect of time in activity on enjoyment of sleep and personal care
UK: sleep+personal care
-0.4
0
0.4
0.8
1.2
1.6
2
200 400 600 800 1000
minutes per daye
njo
yme
nt/m
arg
ina
l effe
cts
enjoyment effectmarginal effect*60enjoyment effectmarginal effect*60
US: sleep+personal care
-0.2
0
0.2
0.4
0.6
0.8
1
200 400 600 800 1000
minutes per day
enjo
ymen
t/mar
gina
l effe
cts
enjoyment effectmarginal effect*60

Effect of time in activity on enjoyment of non-tv leisure at home
US: non-tv leisure at home
-0.2
0
0.2
0.4
0.6
0.8
0 500 1000
minutes per day
en
joym
en
t/ma
rgin
al e
ffect
s
enjoyment effectmarginal effect*60
UK: non-tv leisure at home
-0.2
0
0.2
0.4
0.6
0.8
0 200 400 600 800 1000
minutes per day
enjo
ymen
t/mar
gina
l effe
ct
enjoyment effectmarginal effect*60

Effect of time in activity on enjoyment of out of home leisure
US: out of home leisure
0
0.2
0.4
0.6
0.8
0 100 200 300 400minutes per day
enjo
ymen
t/mar
gina
l effe
cts
enjoyment effectmarginal effect*60
UK: out of home leisure
0
0.1
0.2
0.3
0.4
0.5
0.6
0 100 200 300 400minutes per day
en
joym
en
t/ma
rgin
al e
ffect
enjoyment effectmarginal effect*60

Correspondence in UK/US “marginal utility=0” points
Marginal utility equals zero (mins/day)
results where at least one temporal coefficient (t, t2) is significant bold where both temporal coefficients for the country are significant; red where the net marginal effect is positive.
leisure
out
non-tv home leisure
sleep, personal tv
paid work
domestic unpaid work shopping
child care travel
US 855 448 702 192 ns ns ns ns ns
UK 561 445 617 430 207 6 370 235 ns

Counterfactual experiment• Estimate joint UK-US utility equations…• ...standardise for each sex (mean=0,sd=1)...• …then use coefficients to impute aggregate utility
for various MTUS surveys for a range of periods and nations.
• Interpret result as answering:– “What would be the utility consequence if a
population of Anglo-Americans had Nordic or Corporatist or Southern time budgets and other socio-demographic characteristics?”

Multinational Time Use Study: 50 surveys, 20 countries, 550K days
1961-69 1970-74 1975-84 1985-89 1990-94 1995-99 2000-
(N of Days) Canada 2138 2682 9618 8936 10726 Denmark 4173 3584 France 2898 4633 14631 Netherlands 4019 3263 3158 3227 11851 Norway 6516 6068 6129 7904 UK 9292 14898 9206 1962 17248 USA 2021 7010 4935 9386 1151 20340 Finland 11908 15219 8354 1686 Italy 37764 51206 Australia 1491 3181 13937 14315 Israel 3126 Sweden 7065 7747 Germany 3687 22554 35813 Austria 25162 South Africa 14217 Slovenia 12273 Spain 46774 Column total 22071 14778 46585 86770 99453 54366 227059 N surveys 5 4 6 8 9 7 11

National Time Value Accounts (GNU): Nordic countries
1975-84 1985-89 1990-94 1995-99 2000-4
-0.4
-0.3
-0.2
-0.1
0
0.1
0.2
0.3
0.4
0.5
Denmark
Sweden
Norway
Finland
Nordic men
1975-84 1985-89 1990-94 1995-99 2000-4
-0.4
-0.3
-0.2
-0.1
0
0.1
0.2
0.3
0.4
0.5
Denmark
Sweden
Norway
Finland
Nordic women
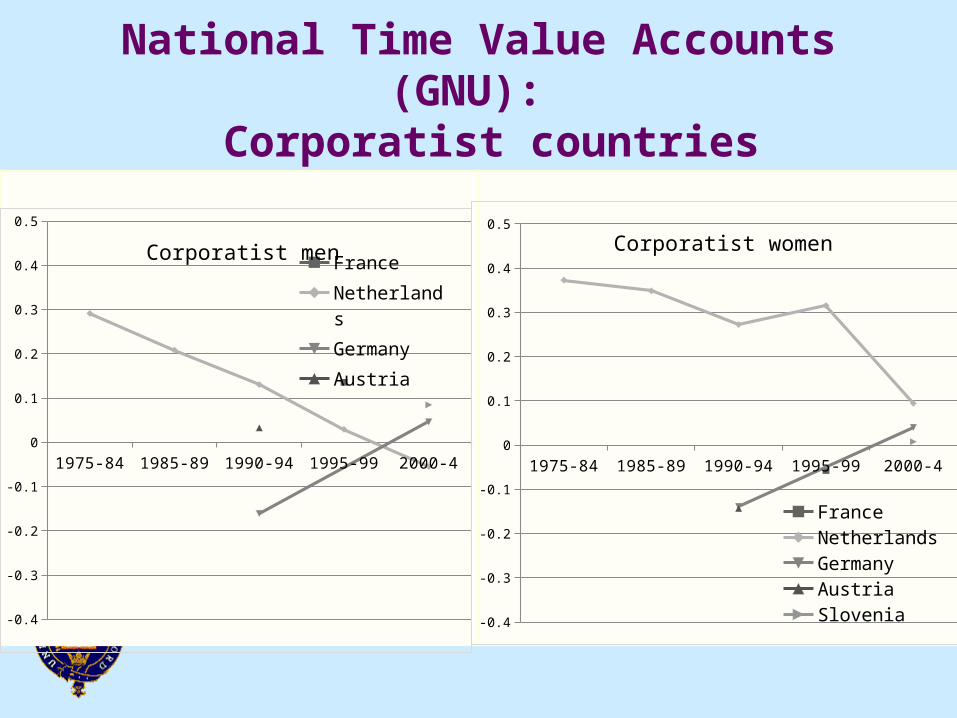
National Time Value Accounts (GNU): Corporatist countries
1975-84 1985-89 1990-94 1995-99 2000-4
-0.4
-0.3
-0.2
-0.1
0
0.1
0.2
0.3
0.4
0.5
France
Netherlands
Germany
Austria
Slovenia
Corporatist men
1975-84 1985-89 1990-94 1995-99 2000-4
-0.4
-0.3
-0.2
-0.1
0
0.1
0.2
0.3
0.4
0.5
FranceNetherlandsGermanyAustriaSlovenia
Corporatist women

National Time Value Accounts (GNU): Anglophone countries
1975-84 1985-89 1990-94 1995-99 2000-4
-0.4
-0.3
-0.2
-0.1
0
0.1
0.2
0.3
0.4
0.5
UKUSACanadaAustralia
Anglophone men
1975-84 1985-89 1990-94 1995-99 2000-4
-0.4
-0.3
-0.2
-0.1
0
0.1
0.2
0.3
0.4
0.5
UK
USA
Canada
Australia
Anglophone women

National Time Value Accounts (GNU): Southern countries
men women
-0.3
-0.25
-0.2
-0.15
-0.1
-0.05
0
0.05
0.1
Italy
Spain
Southern men and women1999-2001

Different time-use patterns, different evolution of GNU
• NORDIC: above the mean GNU: women rising substantially.
• CORPORATIST: both sexes converging on the mean.
• ANGLOPHONE: both sexes falling below the mean.
• SOUTHERN: men above the mean, women well below it.

Explanation?• Seems to be reasonably straightforward:
–Growth in total work time in Anglo countries...
– ... shift from paid work to unpaid work.–Women in Southern countries left with
disproportionate share of the unpaid work.–Women in the Nordic countries have
smaller, fairer share of the unpaid work

Lesson for public policy:
• Economic growth can reduce “objective happiness”
• Shorter working hours, more (paid employment) childcare support to reduce unpaid work, fairer sharing between men and women could both encourage growth and increase happiness.

Summary
• Difference between National Income and National Utility.
• Both derived from time budget tables.• Utility measures derived from diaries.• Counterfactual utility analysis.
→ Policy conclusions

ReferencesJ Gershuny 2000 Changing Times: Work and Leisure in Post Industrial Society,
Oxford: Oxford University Press.J Gershuny 2012 “National Utility: measuring the enjoyment of activities” European
Sociological Review doi: 10.1093/esr/jcs077Luisella Goldschmidt-Clermont, 1999 Households Non-SNA Production: Labour Time,
Value of Labour and of Product, and Contribution to Extended Private Consumption. Review of Income and Wealth 45(4), 519-529.
Holloway, Sue, Sandra Short & Sarah Tamplin. 2002. Household Satellite Account: (Experimental) Methodology. London, UK: Office for National Statistics.
Duncan Ironmonger, 1999 Counting Outputs, Capital Inputs and Caring Labor: Estimating Gross Household Product. Feminist Economics 2(3), 37-64.
Tom Juster and Frank Stafford 1984 (eds), Time, Goods and Well-Being, Ann Arbor: Institute for Social Research.
Danny Kahneman 1999 “Objective Happiness” in Well-Being: The Foundations of Hedonic Psychology eds DI Kahneman, E Diener and N Schwarz, New York: Russel Sage Foundation, pp. 3-25.
AB Krueger, D Kahneman, D Schkade, N Schwarz and AA Stone 2009 “National Time Accounting: The Currency of Life” in AB Krueger (ed) Measuring the Subjective Wellbeing of Nations: National Accounts of Time Use and Well-Being, University of Chicago Press/NBER, pp 9-81.