national passenger survey train operating company …d3cez36w5wymxj.cloudfront.net/migrated/national...
TRANSCRIPT

Rebecca Hunt BDRC Continental Kingsbourne House 229-231 High Holborn London, WC1V 7DA Tel: 020 7490 9148 Email: [email protected]
David Greeno Passenger Focus Fleetbank House 2-6 Salisbury Square London, EC4Y 8JX Tel: 0300 123 0837 Email: [email protected]
Contacts:
National Passenger Survey Train Operating Company Best In Class Report Spring 2013 This report covers the NPS wave 19 (Autumn 2008) through to wave 28 (Spring 2013). Best in class for previous waves when different TOCs existed is contained in the Best in Class report for wave 24 (Spring 2011)
1.1 2 4.1 77
1.2 Issues affecting fieldwork 3 4.2 93
2.1 5 5.1 113
2.2 21
3.1 41
3.2 57
Overall satisfaction with journey and station factor results
Train factor results
Overall satisfaction with journey and station factor results Standard reports produced for NPS
Train factor results
Contents
Methodology Overall satisfaction with journey and station factor results
Train factor results
Introduction 1
London and South East Services 2
High Speed and Long Distance Services 3
Regional Services 4
Technical Appendix 5
1

- the size of station- time of day- length of shift
- weekday/weekend- journey purpose (Commuter, Business, Leisure)- station size (this profile is applied for each TOC building block)
The stations for each TOC were stratified by number of passengers and a number of stations in each size stratum is sampled.This sample design and weighting ensures that data is representative of all passenger journeys made on each TOC.National results are constructed by combining data for all TOCs together, weighting by number of journeys.
From Autumn 2007 standard region definitions have been used replacing older rail regions. Analysis for the old regions is available on request.
For more details of NPS methodology, visit www.passengerfocus.org.uk
The data for number of journeys and profiles by these variables was generated from ORR data (2012).
Questionnaires are normally handed out at stations to customers about to board a train.
A reply paid envelope is provided for returning questionnaires.
Each Train Operating Company (TOC) is sampled separately. Interviewers are given a number of questionnaires to hand out at a station. At Gatwick and Heathrow Airports and for some shifts at certain London termini, questionnaires are handed out to passengers of a specific TOC. From Autumn 2003 onwards, at all other stations, questionnaires are handed out to passengers of any TOC (in the past, these were also targeted).
The number of questionnaires handed out will depend on:
TOC data is compiled to provide a national sample.
Fieldwork is carried out each Spring (February/March) and Autumn (September/October). Up to Spring 2003, fieldwork took place over 3 weeks.In Autumn 2003, the fieldwork was extended to an 11 week period, from 26 August to 9 November, to provide a better representation of journeys.
Quotas for returned questionnaires are set overall and by weekday/weekend, journey purpose and station size.
All data for a TOC in this Report is weighted up to the number of passenger journeys annually on the TOC and the profile of those journeys by:
1.1 Methodology 1
2 1.1 Methodology
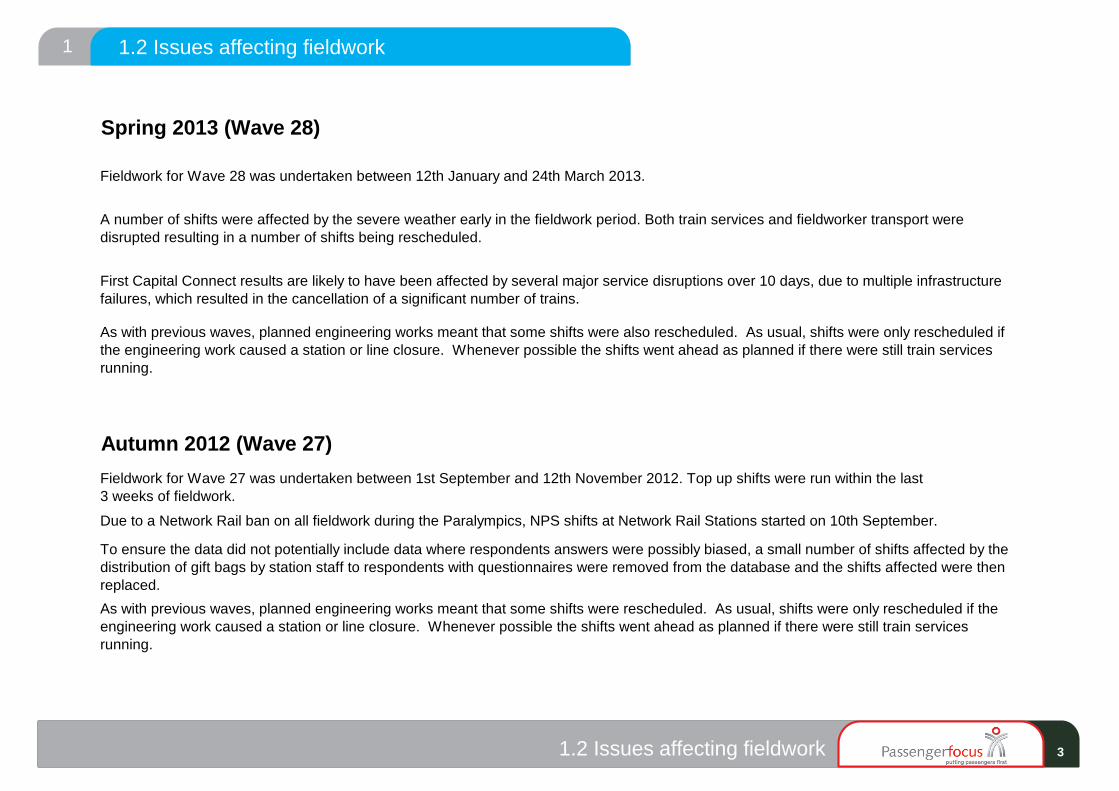
Autumn 2012 (Wave 27)Fieldwork for Wave 27 was undertaken between 1st September and 12th November 2012. Top up shifts were run within the last3 weeks of fieldwork.
Due to a Network Rail ban on all fieldwork during the Paralympics, NPS shifts at Network Rail Stations started on 10th September.
To ensure the data did not potentially include data where respondents answers were possibly biased, a small number of shifts affected by the distribution of gift bags by station staff to respondents with questionnaires were removed from the database and the shifts affected were then replaced.As with previous waves, planned engineering works meant that some shifts were rescheduled. As usual, shifts were only rescheduled if the engineering work caused a station or line closure. Whenever possible the shifts went ahead as planned if there were still train services running.
Spring 2013 (Wave 28)
Fieldwork for Wave 28 was undertaken between 12th January and 24th March 2013.
A number of shifts were affected by the severe weather early in the fieldwork period. Both train services and fieldworker transport were disrupted resulting in a number of shifts being rescheduled.
First Capital Connect results are likely to have been affected by several major service disruptions over 10 days, due to multiple infrastructure failures, which resulted in the cancellation of a significant number of trains.
As with previous waves, planned engineering works meant that some shifts were also rescheduled. As usual, shifts were only rescheduled if the engineering work caused a station or line closure. Whenever possible the shifts went ahead as planned if there were still train services running.
1.2 Issues affecting fieldwork 1
3 1.2 Issues affecting fieldwork

Spring 2012 (Wave 26)The fieldwork for Wave 26 (Main and Boost) was undertaken between 28th January and 30th March 2012. Top up shifts were run within the last 3 weeks of fieldwork.Due to a change of franchise holder, the ‘National Express East Anglia’ train company became ‘Greater Anglia’ on 5th February 2012. Fieldwork and distribution of questionnaires for this train company started a week later than others on 5th February as we waited for this change to take place.
In the latter stages of fieldwork we were refused permission to work on a small number of shifts. This meant the rescheduling of a few shifts but ultimately they were all done by the 30th March.
As with previous waves, planned engineering works meant that some shifts were rescheduled. As usual, shifts were only rescheduled if the engineering work caused a station or line closure. Whenever possible the shifts went ahead as planned if there were still train services running.
Autumn 2011 (Wave 25)Wave 25 fieldwork (Main and Boost) was undertaken between 1st September 2011 and 18th November 2011. Top up shifts were run within the last 3 weeks of the fieldwork period.Delayed fieldwork on a separate rail industry project led to a smaller number of NPS shifts than normal at London Euston during the first couple of weeks of fieldwork, with others planned being moved to later in the fieldwork period.
As with previous waves, planned engineering works meant that some shifts were rescheduled. As usual, shifts were only rescheduled if the engineering work caused a station or line closure. Whenever possible the shifts went ahead as planned if there were still train services running.
1.2 Issues affecting fieldwork (cont'd) 1
4 1.2 Issues affecting fieldwork (cont'd)

*Greater Anglia from 5th February 2012 (previously National Express East Anglia)
c2c 90 91 90 91 91 91 91 91 93 92
Chiltern Railways 90 90 91 91 90 88 88 90 91 89
First Capital Connect 78 76 75 76 76 78 80 79 81 76
First Great Western 80 81 82 83 82 82 83 82 83 80
Greater Anglia* 77 76 79 77 79 78 77 73 83 77
London Midland 80 78 87 86 86 83 85 87 83 80
London Overground 77 75 82 72 85 89 92 90 93 92
South West Trains 87 84 86 85 87 85 84 83 85 81
Southeastern 80 76 80 81 80 82 83 81 84 78
Southern 83 80 82 84 82 82 83 80 82 78
Average Score 82 80 82 82 83 83 83 82 85 81
BEST IN CLASS 90 91 91 91 91 91 92 91 93 92
Overall satisfaction with journey
2.1 London and South East Services 2 Note: The best in class is marked by a and is calculated by looking at the percentage satisfied by TOC to 3 decimal places. Percentages in the table however are rounded to 0 decimal places.
Autumn 2008
Autumn 2009
Spring 2009
Spring 2011
Autumn 2011
Autumn 2010
Spring 2010
Spring 2010
Spring 2011
Autumn 2010
Autumn 2009
Autumn 2012
Spring 2013
Spring 2012
Autumn 2011
Spring 2009
Autumn 2008
5 2.1 London and South East Services Non-franchised Train Operating Companies are excluded

*Greater Anglia from 5th February 2012 (previously National Express East Anglia)
c2c 80 83 86 83 87 84
Chiltern Railways 85 85 90 88 87 84
First Capital Connect 70 69 76 75 79 75
First Great Western 75 74 77 76 79 76
Greater Anglia* 72 74 74 71 79 75
London Midland 78 76 76 77 76 73
London Overground 74 79 81 81 87 79
South West Trains 78 74 74 74 78 74
Southeastern 75 75 78 73 75 73
Southern 74 74 78 75 78 73
Average Score 75 75 77 75 79 75
BEST IN CLASS 85 85 90 88 87 84
Overall satisfaction with the station
2.1 London and South East Services 2 Note: The best in class is marked by a and is calculated by looking at the percentage satisfied by TOC to 3 decimal places. Percentages in the table however are rounded to 0 decimal places.
Autumn 2008
Autumn 2009
Spring 2009
Spring 2011
Autumn 2011
Autumn 2010
Spring 2010
Spring 2011
Autumn 2010
Autumn 2012
Spring 2013
Spring 2012
Autumn 2011
6 2.1 London and South East Services Non-franchised Train Operating Companies are excluded

*Greater Anglia from 5th February 2012 (previously National Express East Anglia)
c2c 68 77 74 75 76 77 77 77 80 84
Chiltern Railways 84 80 81 82 81 81 84 82 81 83
First Capital Connect 66 68 69 66 69 66 68 70 71 68
First Great Western 73 77 74 75 71 73 75 75 74 76
Greater Anglia* 65 68 67 68 68 68 69 69 73 73
London Midland 67 72 72 72 76 78 79 78 75 72
London Overground 64 64 57 56 66 75 78 73 77 70
South West Trains 68 70 67 67 72 70 71 70 74 74
Southeastern 64 65 66 70 67 70 66 69 69 71
Southern 69 67 67 72 69 70 73 69 70 70
Average Score 67 69 68 70 70 71 72 71 73 73
BEST IN CLASS 84 80 81 82 81 81 84 82 81 84
Ticket buying facilities
2.1 London and South East Services 2 Note: The best in class is marked by a and is calculated by looking at the percentage satisfied by TOC to 3 decimal places. Percentages in the table however are rounded to 0 decimal places.
Autumn 2008
Autumn 2009
Spring 2009
Spring 2011
Autumn 2011
Autumn 2010
Spring 2010
Spring 2010
Spring 2011
Autumn 2010
Autumn 2009
Autumn 2012
Spring 2013
Spring 2012
Autumn 2011
Spring 2009
Autumn 2008
7 2.1 London and South East Services Non-franchised Train Operating Companies are excluded

*Greater Anglia from 5th February 2012 (previously National Express East Anglia)
c2c 82 85 83 85 86 87 87 86 89 88
Chiltern Railways 84 86 84 86 85 83 83 86 85 85
First Capital Connect 75 71 75 70 73 73 77 78 80 77
First Great Western 76 78 79 79 77 77 81 81 83 83
Greater Anglia* 75 72 75 76 76 73 75 74 80 77
London Midland 78 73 80 80 84 82 83 83 85 80
London Overground 62 66 69 63 75 77 80 82 83 81
South West Trains 81 81 82 78 84 83 81 83 84 81
Southeastern 76 72 76 76 79 77 80 77 78 76
Southern 80 78 79 78 81 77 81 79 80 76
Average Score 78 76 78 77 80 78 80 80 82 79
BEST IN CLASS 84 86 84 86 86 87 87 86 89 88
Provision of information about train times/platforms
2.1 London and South East Services 2 Note: The best in class is marked by a and is calculated by looking at the percentage satisfied by TOC to 3 decimal places. Percentages in the table however are rounded to 0 decimal places.
Autumn 2008
Autumn 2009
Spring 2009
Spring 2011
Autumn 2011
Autumn 2010
Spring 2010
Spring 2010
Spring 2011
Autumn 2010
Autumn 2009
Autumn 2012
Spring 2013
Spring 2012
Autumn 2011
Spring 2009
Autumn 2008
8 2.1 London and South East Services Non-franchised Train Operating Companies are excluded

*Greater Anglia from 5th February 2012 (previously National Express East Anglia)
c2c 69 70 67 69 73 71 72 75 80 78
Chiltern Railways 81 82 81 76 78 77 84 79 83 80
First Capital Connect 61 60 61 58 57 60 63 67 66 67
First Great Western 67 65 65 64 63 60 66 65 68 69
Greater Anglia* 64 63 68 64 64 63 67 66 71 68
London Midland 59 56 63 63 68 63 69 67 70 66
London Overground 61 62 62 55 67 74 74 77 78 77
South West Trains 59 58 58 55 62 59 57 57 68 64
Southeastern 60 56 61 65 62 64 64 64 68 65
Southern 62 59 63 60 63 62 67 65 69 62
Average Score 62 60 63 61 63 63 65 66 70 67
BEST IN CLASS 81 82 81 76 78 77 84 79 83 80
The upkeep/repair of the station buildings/platforms
2.1 London and South East Services 2 Note: The best in class is marked by a and is calculated by looking at the percentage satisfied by TOC to 3 decimal places. Percentages in the table however are rounded to 0 decimal places.
Autumn 2008
Autumn 2009
Spring 2009
Spring 2011
Autumn 2011
Autumn 2010
Spring 2010
Spring 2010
Spring 2011
Autumn 2010
Autumn 2009
Autumn 2012
Spring 2013
Spring 2012
Autumn 2011
Spring 2009
Autumn 2008
9 2.1 London and South East Services Non-franchised Train Operating Companies are excluded

*Greater Anglia from 5th February 2012 (previously National Express East Anglia)
c2c 75 77 76 76 80 78 77 78 82 83
Chiltern Railways 83 84 83 80 83 81 88 83 86 85
First Capital Connect 66 67 69 66 66 68 70 72 75 74
First Great Western 72 70 71 69 69 67 71 70 74 73
Greater Anglia* 70 69 73 68 71 68 72 68 75 71
London Midland 68 65 70 71 71 69 73 72 75 71
London Overground 67 65 65 61 77 79 78 78 80 80
South West Trains 65 64 63 60 67 63 63 63 71 69
Southeastern 66 63 67 70 69 69 72 70 73 70
Southern 68 66 71 69 70 71 72 69 75 69
Average Score 68 67 69 67 70 69 71 70 75 72
BEST IN CLASS 83 84 83 80 83 81 88 83 86 85
Cleanliness of the station
2.1 London and South East Services 2 Note: The best in class is marked by a and is calculated by looking at the percentage satisfied by TOC to 3 decimal places. Percentages in the table however are rounded to 0 decimal places.
Autumn 2008
Autumn 2009
Spring 2009
Spring 2011
Autumn 2011
Autumn 2010
Spring 2010
Spring 2010
Spring 2011
Autumn 2010
Autumn 2009
Autumn 2012
Spring 2013
Spring 2012
Autumn 2011
Spring 2009
Autumn 2008
10 2.1 London and South East Services Non-franchised Train Operating Companies are excluded

*Greater Anglia from 5th February 2012 (previously National Express East Anglia)
c2c 46 44 50 51 52 53 55 55 58 56
Chiltern Railways 67 68 64 60 65 62 69 66 68 67
First Capital Connect 46 44 46 41 45 43 50 47 54 52
First Great Western 59 59 58 56 54 53 54 53 60 57
Greater Anglia* 51 51 53 54 51 51 52 50 59 56
London Midland 45 47 46 50 50 48 49 48 54 54
London Overground 30 32 30 29 32 29 34 35 45 43
South West Trains 48 48 47 45 50 50 46 47 58 57
Southeastern 47 46 47 50 50 48 51 50 57 51
Southern 49 48 50 50 49 49 50 48 57 53
Average Score 49 48 49 49 50 48 49 48 56 54
BEST IN CLASS 67 68 64 60 65 62 69 66 68 67
The facilities and services at the station
2.1 London and South East Services 2 Note: The best in class is marked by a and is calculated by looking at the percentage satisfied by TOC to 3 decimal places. Percentages in the table however are rounded to 0 decimal places.
Autumn 2008
Autumn 2009
Spring 2009
Spring 2011
Autumn 2011
Autumn 2010
Spring 2010
Spring 2010
Spring 2011
Autumn 2010
Autumn 2009
Autumn 2012
Spring 2013
Spring 2012
Autumn 2011
Spring 2009
Autumn 2008
11 2.1 London and South East Services Non-franchised Train Operating Companies are excluded

*Greater Anglia from 5th February 2012 (previously National Express East Anglia)
c2c 71 75 73 75 77 74 75 76 75 82
Chiltern Railways 76 78 79 79 75 78 77 78 79 79
First Capital Connect 65 65 66 66 64 67 66 71 71 67
First Great Western 71 70 73 74 74 72 73 75 74 75
Greater Anglia* 66 66 64 64 69 66 68 65 68 67
London Midland 65 68 66 69 74 69 74 73 73 70
London Overground 68 63 68 65 72 68 67 65 68 69
South West Trains 68 68 68 67 68 68 66 69 67 68
Southeastern 67 66 65 68 69 66 69 67 68 65
Southern 66 63 70 69 69 69 70 69 72 67
Average Score 67 67 68 68 69 69 69 69 70 69
BEST IN CLASS 76 78 79 79 77 78 77 78 79 82
The attitudes and helpfulness of the staff at the station
2.1 London and South East Services 2 Note: The best in class is marked by a and is calculated by looking at the percentage satisfied by TOC to 3 decimal places. Percentages in the table however are rounded to 0 decimal places.
Autumn 2008
Autumn 2009
Spring 2009
Spring 2011
Autumn 2011
Autumn 2010
Spring 2010
Spring 2010
Spring 2011
Autumn 2010
Autumn 2009
Autumn 2012
Spring 2013
Spring 2012
Autumn 2011
Spring 2009
Autumn 2008
12 2.1 London and South East Services Non-franchised Train Operating Companies are excluded

*Greater Anglia from 5th February 2012 (previously National Express East Anglia)
c2c 65 69 70 70 70 72 70 73 75 76
Chiltern Railways 70 71 74 72 74 74 74 78 75 72
First Capital Connect 69 70 71 72 70 70 73 76 79 75
First Great Western 72 72 74 74 70 72 72 71 72 70
Greater Anglia* 76 79 79 77 78 78 77 76 80 78
London Midland 69 66 67 71 67 71 67 69 69 71
London Overground 70 73 73 76 77 76 74 76 76 77
South West Trains 75 77 76 75 76 74 74 74 78 76
Southeastern 78 74 74 74 75 75 75 73 76 76
Southern 76 75 76 78 76 74 73 72 80 75
Average Score 74 74 75 75 74 74 74 74 77 75
BEST IN CLASS 78 79 79 78 78 78 77 78 80 78
Connections with other forms of public transport from the station
2.1 London and South East Services 2 Note: The best in class is marked by a and is calculated by looking at the percentage satisfied by TOC to 3 decimal places. Percentages in the table however are rounded to 0 decimal places.
Autumn 2008
Autumn 2009
Spring 2009
Spring 2011
Autumn 2011
Autumn 2010
Spring 2010
Spring 2010
Spring 2011
Autumn 2010
Autumn 2009
Autumn 2012
Spring 2013
Spring 2012
Autumn 2011
Spring 2009
Autumn 2008
13 2.1 London and South East Services Non-franchised Train Operating Companies are excluded

*Greater Anglia from 5th February 2012 (previously National Express East Anglia)
c2c 43 42 45 49 55 53 52 55 58 60
Chiltern Railways 67 68 69 72 69 67 69 65 72 71
First Capital Connect 39 40 42 43 45 46 45 45 45 43
First Great Western 53 54 53 53 58 58 57 55 57 54
Greater Anglia* 41 36 46 42 51 50 51 48 50 50
London Midland 41 43 48 49 49 54 53 56 57 45
London Overground 20 24 24 30 22 20 27 35 32 33
South West Trains 43 44 46 47 51 48 56 50 55 50
Southeastern 34 32 36 45 40 44 47 41 44 46
Southern 35 40 35 43 43 42 44 40 41 40
Average Score 40 41 43 46 47 47 49 46 49 47
BEST IN CLASS 67 68 69 72 69 67 69 65 72 71
Facilities for car parking
2.1 London and South East Services 2 Note: The best in class is marked by a and is calculated by looking at the percentage satisfied by TOC to 3 decimal places. Percentages in the table however are rounded to 0 decimal places.
Autumn 2008
Autumn 2009
Spring 2009
Spring 2011
Autumn 2011
Autumn 2010
Spring 2010
Spring 2010
Spring 2011
Autumn 2010
Autumn 2009
Autumn 2012
Spring 2013
Spring 2012
Autumn 2011
Spring 2009
Autumn 2008
14 2.1 London and South East Services Non-franchised Train Operating Companies are excluded

*Greater Anglia from 5th February 2012 (previously National Express East Anglia)
c2c 66 69 68 67 72 72 74 75 76 77
Chiltern Railways 82 82 83 79 80 78 85 83 83 80
First Capital Connect 59 58 61 57 61 57 64 65 70 67
First Great Western 68 67 69 66 65 66 67 66 68 66
Greater Anglia* 64 63 69 63 66 62 66 63 71 65
London Midland 61 58 61 64 67 64 66 67 69 61
London Overground 62 59 60 50 65 69 72 71 77 71
South West Trains 62 64 63 59 67 63 61 62 68 63
Southeastern 61 56 60 63 63 63 68 65 65 64
Southern 62 61 64 62 63 64 69 65 68 61
Average Score 63 62 64 62 65 64 67 66 69 65
BEST IN CLASS 82 82 83 79 80 78 85 83 83 80
Overall environment of the station
2.1 London and South East Services 2 Note: The best in class is marked by a and is calculated by looking at the percentage satisfied by TOC to 3 decimal places. Percentages in the table however are rounded to 0 decimal places.
Autumn 2008
Autumn 2009
Spring 2009
Spring 2011
Autumn 2011
Autumn 2010
Spring 2010
Spring 2010
Spring 2011
Autumn 2010
Autumn 2009
Autumn 2012
Spring 2013
Spring 2012
Autumn 2011
Spring 2009
Autumn 2008
15 2.1 London and South East Services Non-franchised Train Operating Companies are excluded

*Greater Anglia from 5th February 2012 (previously National Express East Anglia)
c2c 60 61 59 62 65 65 66 70 71 73
Chiltern Railways 75 74 76 75 74 76 79 77 79 75
First Capital Connect 61 61 61 61 61 59 65 66 72 69
First Great Western 67 67 67 67 68 67 71 69 72 69
Greater Anglia* 59 58 64 62 62 61 62 64 69 65
London Midland 59 62 64 63 64 66 67 68 71 66
London Overground 55 56 59 58 62 67 68 70 73 69
South West Trains 62 63 62 65 68 67 64 68 68 67
Southeastern 59 55 57 64 62 62 63 62 66 64
Southern 61 59 64 63 63 65 68 65 70 66
Average Score 61 60 62 63 64 65 66 66 70 67
BEST IN CLASS 75 74 76 75 74 76 79 77 79 75
Your personal security whilst using the station
2.1 London and South East Services 2 Note: The best in class is marked by a and is calculated by looking at the percentage satisfied by TOC to 3 decimal places. Percentages in the table however are rounded to 0 decimal places.
Autumn 2008
Autumn 2009
Spring 2009
Spring 2011
Autumn 2011
Autumn 2010
Spring 2010
Spring 2010
Spring 2011
Autumn 2010
Autumn 2009
Autumn 2012
Spring 2013
Spring 2012
Autumn 2011
Spring 2009
Autumn 2008
16 2.1 London and South East Services Non-franchised Train Operating Companies are excluded

*Greater Anglia from 5th February 2012 (previously National Express East Anglia)
c2c 62 63 65 64 66 66 66 67 67 72
Chiltern Railways 65 63 63 61 64 65 67 68 64 63
First Capital Connect 55 55 56 53 54 49 55 56 60 56
First Great Western 58 59 59 60 58 60 60 62 59 63
Greater Anglia* 55 55 56 54 56 52 55 53 55 57
London Midland 53 54 55 55 57 59 59 59 56 55
London Overground 57 60 63 55 62 57 57 60 62 63
South West Trains 57 57 55 52 55 53 53 54 52 54
Southeastern 55 54 53 57 58 57 56 57 58 57
Southern 57 55 58 61 57 59 58 58 60 58
Average Score 56 56 56 56 57 56 57 57 58 58
BEST IN CLASS 65 63 65 64 66 66 67 68 67 72
The availability of staff at the station
2.1 London and South East Services 2 Note: The best in class is marked by a and is calculated by looking at the percentage satisfied by TOC to 3 decimal places. Percentages in the table however are rounded to 0 decimal places.
Autumn 2008
Autumn 2009
Spring 2009
Spring 2011
Autumn 2011
Autumn 2010
Spring 2010
Spring 2010
Spring 2011
Autumn 2010
Autumn 2009
Autumn 2012
Spring 2013
Spring 2012
Autumn 2011
Spring 2009
Autumn 2008
17 2.1 London and South East Services Non-franchised Train Operating Companies are excluded

*Greater Anglia from 5th February 2012 (previously National Express East Anglia)
c2c 72 69
Chiltern Railways 79 72
First Capital Connect 66 57
First Great Western 68 63
Greater Anglia* 66 59
London Midland 71 63
London Overground 70 60
South West Trains 65 60
Southeastern 66 59
Southern 69 60
Average Score 68 61
BEST IN CLASS 79 72
The provision of shelter facilities
2.1 London and South East Services 2 Note: The best in class is marked by a and is calculated by looking at the percentage satisfied by TOC to 3 decimal places. Percentages in the table however are rounded to 0 decimal places.
Spring 2011
Autumn 2011
Autumn 2012
Spring 2013
18 2.1 London and South East Services Non-franchised Train Operating Companies are excluded

*Greater Anglia from 5th February 2012 (previously National Express East Anglia)
c2c 58 58
Chiltern Railways 57 51
First Capital Connect 44 41
First Great Western 49 49
Greater Anglia* 45 40
London Midland 53 45
London Overground 57 45
South West Trains 41 38
Southeastern 42 42
Southern 39 39
Average Score 45 42
BEST IN CLASS 58 58
Availability of seating
2.1 London and South East Services 2 Note: The best in class is marked by a and is calculated by looking at the percentage satisfied by TOC to 3 decimal places. Percentages in the table however are rounded to 0 decimal places.
Autumn 2008
Autumn 2009
Spring 2009
Spring 2011
Autumn 2011
Autumn 2010
Spring 2010
Autumn 2012
Spring 2013
19 2.1 London and South East Services Non-franchised Train Operating Companies are excluded

*Greater Anglia from 5th February 2012 (previously National Express East Anglia)
c2c 85 88 75 89 79 83 89 92 92 86
Chiltern Railways 85 83 87 87 87 86 89 89 85 85
First Capital Connect 88 86 81 76 87 79 85 83 86 81
First Great Western 87 85 83 88 86 90 87 87 88 90
Greater Anglia* 81 80 81 80 82 83 82 78 83 84
London Midland 78 81 80 87 86 90 92 86 88 81
London Overground 91 71 71 72 78 68 88 90 86 83
South West Trains 83 82 84 84 79 79 87 82 83 75
Southeastern 80 77 84 84 90 86 80 76 82 79
Southern 79 78 83 81 86 83 85 80 82 76
Average Score 83 81 82 82 84 83 85 82 84 80
BEST IN CLASS 91 88 87 89 90 90 92 92 92 90
How request to station staff was handled
2.1 London and South East Services 2 Note: The best in class is marked by a and is calculated by looking at the percentage satisfied by TOC to 3 decimal places. Percentages in the table however are rounded to 0 decimal places.
Autumn 2008
Autumn 2009
Spring 2009
Spring 2011
Autumn 2011
Autumn 2010
Spring 2010
Spring 2010
Spring 2011
Autumn 2010
Autumn 2009
Autumn 2012
Spring 2013
Spring 2012
Autumn 2011
Spring 2009
Autumn 2008
20 2.1 London and South East Services Non-franchised Train Operating Companies are excluded

*Greater Anglia from 5th February 2012 (previously National Express East Anglia)
c2c 92 90
Chiltern Railways 89 88
First Capital Connect 74 67
First Great Western 81 79
Greater Anglia* 73 70
London Midland 83 80
London Overground 92 92
South West Trains 83 79
Southeastern 80 75
Southern 80 75
Average Score 81 77
BEST IN CLASS 92 92
Overall satisfaction with the train
2.2 London and South East Services 2 Note: The best in class is marked by a and is calculated by looking at the percentage satisfied by TOC to 3 decimal places. Percentages in the table however are rounded to 0 decimal places.
Autumn 2008
Autumn 2009
Spring 2009
Spring 2011
Autumn 2011
Autumn 2010
Spring 2010
Autumn 2012
Spring 2013
21 2.2 London and South East Services Non-franchised Train Operating Companies are excluded

*Greater Anglia from 5th February 2012 (previously National Express East Anglia)
c2c 82 86 85 85 85 86 84 83 86 87
Chiltern Railways 84 84 83 85 85 82 80 80 80 77
First Capital Connect 77 74 73 70 75 74 76 79 79 75
First Great Western 75 75 77 78 77 76 78 76 75 76
Greater Anglia* 73 71 72 74 74 73 76 72 77 76
London Midland 74 69 79 80 78 77 77 83 78 76
London Overground 52 59 60 51 74 77 82 79 79 79
South West Trains 79 81 78 79 79 78 76 79 77 73
Southeastern 71 73 73 73 75 76 75 76 77 75
Southern 72 68 75 74 73 75 76 74 75 70
Average Score 74 74 75 75 76 76 77 77 77 75
BEST IN CLASS 84 86 85 85 85 86 84 83 86 87
The frequency of the trains on that route
2.2 London and South East Services 2 Note: The best in class is marked by a and is calculated by looking at the percentage satisfied by TOC to 3 decimal places. Percentages in the table however are rounded to 0 decimal places.
Autumn 2008
Autumn 2009
Spring 2009
Spring 2011
Autumn 2011
Autumn 2010
Spring 2010
Spring 2010
Spring 2011
Autumn 2010
Autumn 2009
Autumn 2012
Spring 2013
Spring 2012
Autumn 2011
Spring 2009
Autumn 2008
22 2.2 London and South East Services Non-franchised Train Operating Companies are excluded
*Greater Anglia from 5th February 2012 (previously National Express East Anglia)
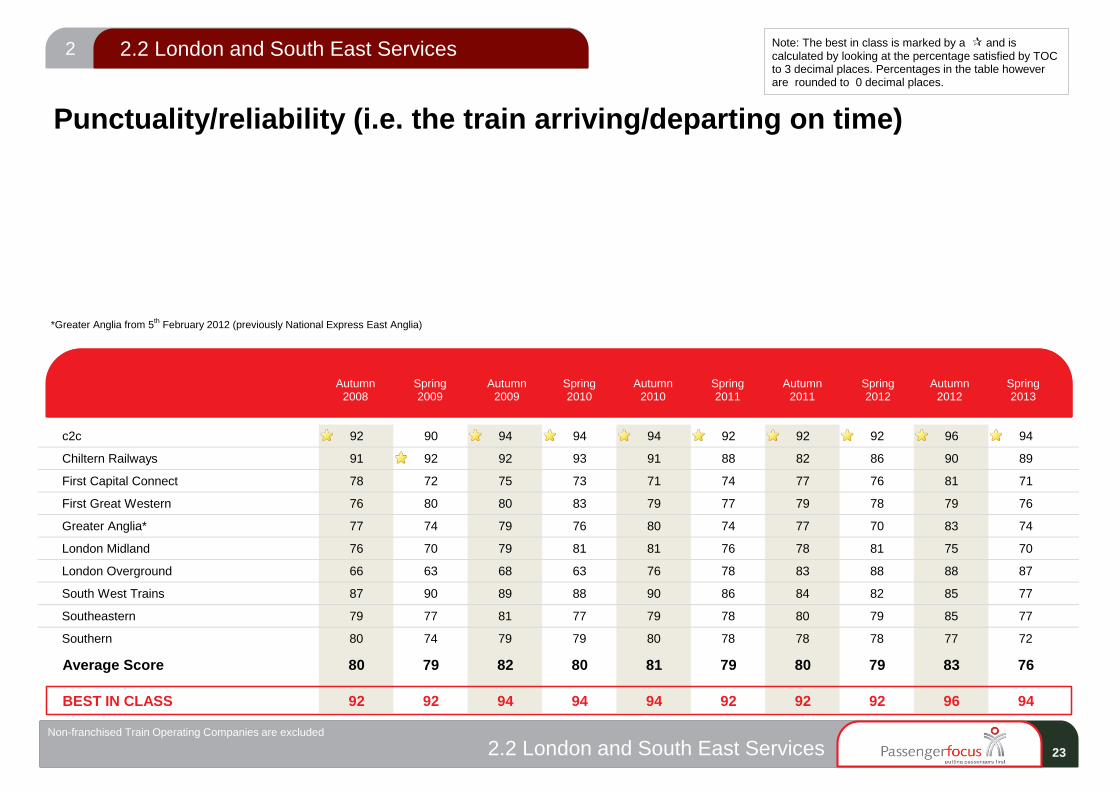
c2c 92 90 94 94 94 92 92 92 96 94
Chiltern Railways 91 92 92 93 91 88 82 86 90 89
First Capital Connect 78 72 75 73 71 74 77 76 81 71
First Great Western 76 80 80 83 79 77 79 78 79 76
Greater Anglia* 77 74 79 76 80 74 77 70 83 74
London Midland 76 70 79 81 81 76 78 81 75 70
London Overground 66 63 68 63 76 78 83 88 88 87
South West Trains 87 90 89 88 90 86 84 82 85 77
Southeastern 79 77 81 77 79 78 80 79 85 77
Southern 80 74 79 79 80 78 78 78 77 72
Average Score 80 79 82 80 81 79 80 79 83 76
BEST IN CLASS 92 92 94 94 94 92 92 92 96 94
Punctuality/reliability (i.e. the train arriving/departing on time)
2.2 London and South East Services 2 Note: The best in class is marked by a and is calculated by looking at the percentage satisfied by TOC to 3 decimal places. Percentages in the table however are rounded to 0 decimal places.
Autumn 2008
Autumn 2009
Spring 2009
Spring 2011
Autumn 2011
Autumn 2010
Spring 2010
Spring 2010
Spring 2011
Autumn 2010
Autumn 2009
Autumn 2012
Spring 2013
Spring 2012
Autumn 2011
Spring 2009
Autumn 2008
23 2.2 London and South East Services Non-franchised Train Operating Companies are excluded

*Greater Anglia from 5th February 2012 (previously National Express East Anglia)
c2c 89 90 89 91 91 93 90 92 92 94
Chiltern Railways 87 90 89 88 85 83 87 87 88 88
First Capital Connect 83 82 83 82 82 84 83 84 87 82
First Great Western 83 83 83 86 85 84 86 85 85 83
Greater Anglia* 80 78 79 80 82 80 81 79 85 81
London Midland 86 81 86 88 86 86 86 89 84 84
London Overground 77 80 80 79 87 90 87 89 88 89
South West Trains 84 86 83 85 87 83 82 82 82 81
Southeastern 81 79 81 78 80 80 81 79 85 80
Southern 83 79 83 84 83 83 84 83 84 80
Average Score 83 82 83 83 84 84 83 83 85 82
BEST IN CLASS 89 90 89 91 91 93 90 92 92 94
The length of time the journey was scheduled to take (speed)
2.2 London and South East Services 2 Note: The best in class is marked by a and is calculated by looking at the percentage satisfied by TOC to 3 decimal places. Percentages in the table however are rounded to 0 decimal places.
Autumn 2008
Autumn 2009
Spring 2009
Spring 2011
Autumn 2011
Autumn 2010
Spring 2010
Spring 2010
Spring 2011
Autumn 2010
Autumn 2009
Autumn 2012
Spring 2013
Spring 2012
Autumn 2011
Spring 2009
Autumn 2008
24 2.2 London and South East Services Non-franchised Train Operating Companies are excluded

*Greater Anglia from 5th February 2012 (previously National Express East Anglia)
c2c 75 78 75 83 81 78 79 84 87 85
Chiltern Railways 74 76 72 77 72 70 76 75 72 76
First Capital Connect 75 74 76 72 75 75 76 76 79 76
First Great Western 70 71 72 75 74 73 76 73 73 73
Greater Anglia* 71 71 72 73 72 73 72 75 78 73
London Midland 66 71 73 77 75 75 74 78 76 72
London Overground 65 70 69 66 83 82 81 84 83 82
South West Trains 76 78 77 76 78 78 76 76 73 74
Southeastern 71 70 68 72 73 71 71 72 77 73
Southern 73 66 72 76 74 76 76 76 77 74
Average Score 72 72 73 74 75 76 75 77 77 75
BEST IN CLASS 76 78 77 83 83 82 81 84 87 85
Connections with other train services
2.2 London and South East Services 2 Note: The best in class is marked by a and is calculated by looking at the percentage satisfied by TOC to 3 decimal places. Percentages in the table however are rounded to 0 decimal places.
Autumn 2008
Autumn 2009
Spring 2009
Spring 2011
Autumn 2011
Autumn 2010
Spring 2010
Spring 2010
Spring 2011
Autumn 2010
Autumn 2009
Autumn 2012
Spring 2013
Spring 2012
Autumn 2011
Spring 2009
Autumn 2008
25 2.2 London and South East Services Non-franchised Train Operating Companies are excluded

*Greater Anglia from 5th February 2012 (previously National Express East Anglia)
c2c 47 40 43 46 48 43 43 42 46 46
Chiltern Railways 54 46 50 54 55 48 51 48 50 45
First Capital Connect 36 31 35 38 38 32 38 34 38 32
First Great Western 51 46 50 53 56 49 53 48 53 48
Greater Anglia* 33 28 34 36 35 35 33 30 37 35
London Midland 46 44 49 55 56 53 52 53 52 51
London Overground 59 50 56 49 59 53 54 49 57 48
South West Trains 42 35 39 42 43 37 38 36 37 33
Southeastern 37 29 34 39 39 32 36 32 38 31
Southern 42 35 42 45 43 40 42 38 42 36
Average Score 41 35 40 43 44 39 42 38 43 38
BEST IN CLASS 59 50 56 55 59 53 54 53 57 51
The value for money for the price of your ticket
2.2 London and South East Services 2 Note: The best in class is marked by a and is calculated by looking at the percentage satisfied by TOC to 3 decimal places. Percentages in the table however are rounded to 0 decimal places.
Autumn 2008
Autumn 2009
Spring 2009
Spring 2011
Autumn 2011
Autumn 2010
Spring 2010
Spring 2010
Spring 2011
Autumn 2010
Autumn 2009
Autumn 2012
Spring 2013
Spring 2012
Autumn 2011
Spring 2009
Autumn 2008
26 2.2 London and South East Services Non-franchised Train Operating Companies are excluded
*Greater Anglia from 5th February 2012 (previously National Express East Anglia)
c2c 88 88 90 91 93 90 91 92 92 91
Chiltern Railways 87 82 85 80 85 85 87 85 87 86
First Capital Connect 65 66 64 64 63 64 65 65 64 57
First Great Western 73 73 72 70 73 72 76 75 76 75
Greater Anglia* 64 61 59 58 60 62 64 58 62 59
London Midland 74 73 83 76 77 75 80 81 81 76
London Overground 57 58 67 73 89 94 93 92 92 91
South West Trains 78 77 73 73 75 73 73 77 75 73
Southeastern 68 65 66 69 70 68 70 71 72 69
Southern 76 74 76 74 70 73 72 71 73 70
Average Score 72 70 71 70 72 72 74 74 75 72
BEST IN CLASS 88 88 90 91 93 94 93 92 92 91
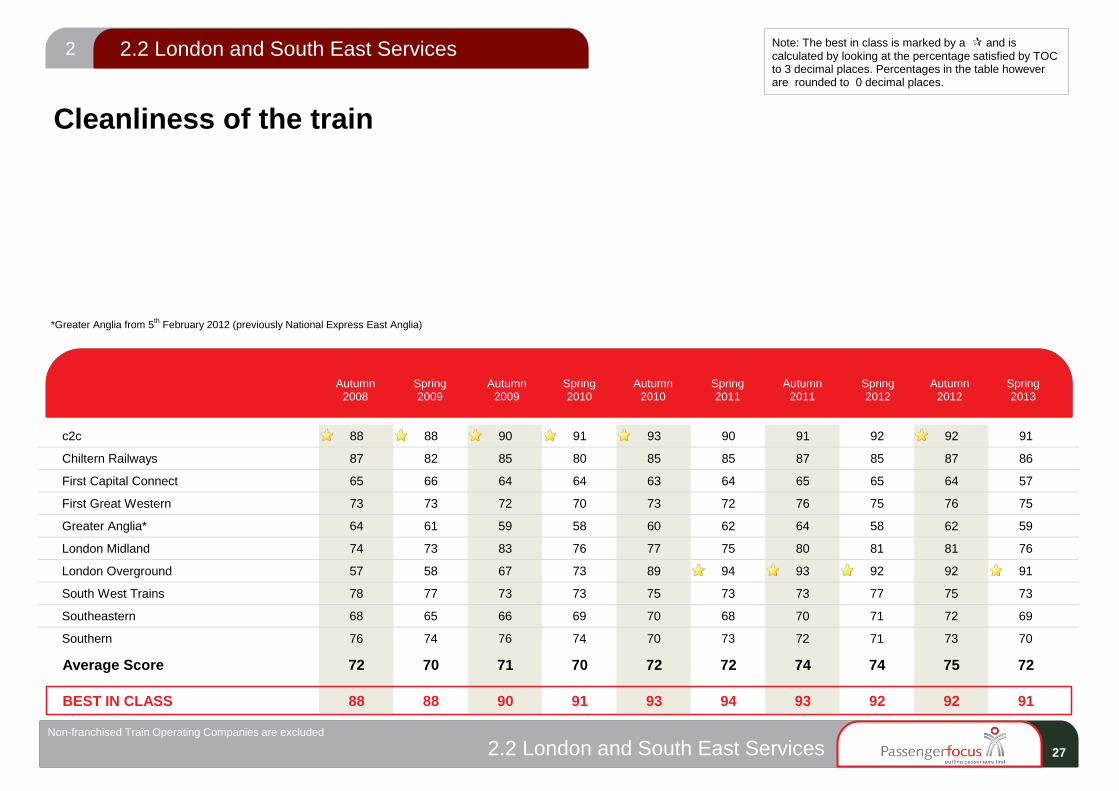
Cleanliness of the train
2.2 London and South East Services 2 Note: The best in class is marked by a and is calculated by looking at the percentage satisfied by TOC to 3 decimal places. Percentages in the table however are rounded to 0 decimal places.
Autumn 2008
Autumn 2009
Spring 2009
Spring 2011
Autumn 2011
Autumn 2010
Spring 2010
Spring 2010
Spring 2011
Autumn 2010
Autumn 2009
Autumn 2012
Spring 2013
Spring 2012
Autumn 2011
Spring 2009
Autumn 2008
27 2.2 London and South East Services Non-franchised Train Operating Companies are excluded

*Greater Anglia from 5th February 2012 (previously National Express East Anglia)
c2c 88 88 89 90 93 90 92 91 92 92
Chiltern Railways 86 80 84 81 83 85 89 87 89 84
First Capital Connect 61 63 61 62 61 60 63 62 60 52
First Great Western 74 74 72 70 74 72 78 77 78 76
Greater Anglia* 61 56 56 52 55 55 55 55 58 53
London Midland 71 71 82 79 77 74 80 84 84 80
London Overground 48 53 61 72 91 95 96 95 94 92
South West Trains 84 85 82 82 82 80 79 83 79 78
Southeastern 69 66 65 68 73 68 72 72 75 70
Southern 76 74 76 72 72 73 71 67 72 69
Average Score 72 71 71 71 74 73 75 74 76 72
BEST IN CLASS 88 88 89 90 93 95 96 95 94 92
Upkeep and repair of the train
2.2 London and South East Services 2 Note: The best in class is marked by a and is calculated by looking at the percentage satisfied by TOC to 3 decimal places. Percentages in the table however are rounded to 0 decimal places.
Autumn 2008
Autumn 2009
Spring 2009
Spring 2011
Autumn 2011
Autumn 2010
Spring 2010
Spring 2010
Spring 2011
Autumn 2010
Autumn 2009
Autumn 2012
Spring 2013
Spring 2012
Autumn 2011
Spring 2009
Autumn 2008
28 2.2 London and South East Services Non-franchised Train Operating Companies are excluded

*Greater Anglia from 5th February 2012 (previously National Express East Anglia)
c2c 74 73 76 80 80 80 83 80 81 84
Chiltern Railways 74 74 74 74 73 73 77 75 77 75
First Capital Connect 49 50 50 51 46 47 47 50 50 47
First Great Western 62 64 63 65 65 64 68 68 69 67
Greater Anglia* 60 59 58 56 55 57 58 56 62 60
London Midland 57 55 63 64 66 66 68 74 76 70
London Overground 51 52 65 63 84 86 87 86 86 85
South West Trains 77 77 74 75 77 77 74 76 74 73
Southeastern 64 57 66 63 67 65 66 68 71 69
Southern 75 73 76 75 76 74 72 71 75 73
Average Score 66 65 66 66 69 68 69 70 71 69
BEST IN CLASS 77 77 76 80 84 86 87 86 86 85
The provision of information during the journey
2.2 London and South East Services 2 Note: The best in class is marked by a and is calculated by looking at the percentage satisfied by TOC to 3 decimal places. Percentages in the table however are rounded to 0 decimal places.
Autumn 2008
Autumn 2009
Spring 2009
Spring 2011
Autumn 2011
Autumn 2010
Spring 2010
Spring 2010
Spring 2011
Autumn 2010
Autumn 2009
Autumn 2012
Spring 2013
Spring 2012
Autumn 2011
Spring 2009
Autumn 2008
29 2.2 London and South East Services Non-franchised Train Operating Companies are excluded

*Greater Anglia from 5th February 2012 (previously National Express East Anglia)
c2c 34 29 37 31 33 37 33 34 34 42
Chiltern Railways 53 52 52 55 60 58 62 62 56 57
First Capital Connect 32 29 29 36 35 31 32 37 38 37
First Great Western 64 66 66 69 70 70 70 66 67 68
Greater Anglia* 47 47 44 44 49 46 47 46 48 49
London Midland 48 54 59 57 57 63 65 63 66 59
London Overground 32 34 35 47 52 44 54 57 57 60
South West Trains 62 64 66 65 69 68 67 68 71 70
Southeastern 49 39 47 57 52 55 52 56 54 56
Southern 54 54 56 57 61 57 61 54 57 54
Average Score 52 51 54 56 58 57 57 57 59 59
BEST IN CLASS 64 66 66 69 70 70 70 68 71 70
The helpfulness and attitude of staff on train
2.2 London and South East Services 2 Note: The best in class is marked by a and is calculated by looking at the percentage satisfied by TOC to 3 decimal places. Percentages in the table however are rounded to 0 decimal places.
Autumn 2008
Autumn 2009
Spring 2009
Spring 2011
Autumn 2011
Autumn 2010
Spring 2010
Spring 2010
Spring 2011
Autumn 2010
Autumn 2009
Autumn 2012
Spring 2013
Spring 2012
Autumn 2011
Spring 2009
Autumn 2008
30 2.2 London and South East Services Non-franchised Train Operating Companies are excluded

*Greater Anglia from 5th February 2012 (previously National Express East Anglia)
c2c 46 47 47 50 51 48 50 51 49 50
Chiltern Railways 50 52 57 55 56 56 60 62 55 55
First Capital Connect 42 45 41 43 44 47 44 47 45 41
First Great Western 52 53 53 54 53 55 55 53 53 57
Greater Anglia* 47 46 47 48 52 49 50 52 54 49
London Midland 44 48 51 50 57 53 52 58 55 54
London Overground 41 41 43 51 62 60 69 63 62 58
South West Trains 57 56 57 58 59 57 53 59 55 53
Southeastern 42 38 43 48 47 46 48 48 48 47
Southern 48 49 50 49 50 49 48 47 46 43
Average Score 48 48 49 51 52 52 52 53 52 50
BEST IN CLASS 57 56 57 58 62 60 69 63 62 58
The space for luggage on the train
2.2 London and South East Services 2 Note: The best in class is marked by a and is calculated by looking at the percentage satisfied by TOC to 3 decimal places. Percentages in the table however are rounded to 0 decimal places.
Autumn 2008
Autumn 2009
Spring 2009
Spring 2011
Autumn 2011
Autumn 2010
Spring 2010
Spring 2010
Spring 2011
Autumn 2010
Autumn 2009
Autumn 2012
Spring 2013
Spring 2012
Autumn 2011
Spring 2009
Autumn 2008
31 2.2 London and South East Services Non-franchised Train Operating Companies are excluded

*Greater Anglia from 5th February 2012 (previously National Express East Anglia)
c2c 43 47 52 52 49 55 53 59 56 58
Chiltern Railways 46 47 51 48 54 55 51 53 53 54
First Capital Connect 26 24 24 26 23 26 25 29 27 26
First Great Western 43 45 45 43 43 40 44 44 44 42
Greater Anglia* 24 25 29 25 29 27 30 31 34 34
London Midland 38 44 52 48 53 48 51 50 52 53
London Overground 9 9 11 10 18 10 19 17 16 12
South West Trains 41 37 38 36 39 36 37 39 36 30
Southeastern 25 22 21 32 33 25 32 28 30 34
Southern 40 38 41 36 33 38 36 29 36 35
Average Score 34 33 34 34 35 34 35 35 36 34
BEST IN CLASS 46 47 52 52 54 55 53 59 56 58
The toilet facilities on the train
2.2 London and South East Services 2 Note: The best in class is marked by a and is calculated by looking at the percentage satisfied by TOC to 3 decimal places. Percentages in the table however are rounded to 0 decimal places.
Autumn 2008
Autumn 2009
Spring 2009
Spring 2011
Autumn 2011
Autumn 2010
Spring 2010
Spring 2010
Spring 2011
Autumn 2010
Autumn 2009
Autumn 2012
Spring 2013
Spring 2012
Autumn 2011
Spring 2009
Autumn 2008
32 2.2 London and South East Services Non-franchised Train Operating Companies are excluded

*Greater Anglia from 5th February 2012 (previously National Express East Anglia)
c2c 61 62 62 65 66 61 65 64 66 64
Chiltern Railways 72 72 77 73 77 74 77 75 74 75
First Capital Connect 57 60 61 60 60 59 60 62 61 59
First Great Western 66 67 68 67 68 69 68 67 65 68
Greater Anglia* 59 58 61 59 64 61 67 65 70 63
London Midland 61 63 72 67 74 70 66 74 71 66
London Overground 46 48 56 58 68 75 80 77 76 72
South West Trains 71 72 70 71 71 69 67 73 67 63
Southeastern 58 54 59 64 62 63 63 61 68 64
Southern 62 67 68 68 68 67 66 66 66 64
Average Score 62 63 65 66 67 66 67 68 68 65
BEST IN CLASS 72 72 77 73 77 75 80 77 76 75
Sufficient room for all passengers to sit/stand on the train
2.2 London and South East Services 2 Note: The best in class is marked by a and is calculated by looking at the percentage satisfied by TOC to 3 decimal places. Percentages in the table however are rounded to 0 decimal places.
Autumn 2008
Autumn 2009
Spring 2009
Spring 2011
Autumn 2011
Autumn 2010
Spring 2010
Spring 2010
Spring 2011
Autumn 2010
Autumn 2009
Autumn 2012
Spring 2013
Spring 2012
Autumn 2011
Spring 2009
Autumn 2008
33 2.2 London and South East Services Non-franchised Train Operating Companies are excluded

*Greater Anglia from 5th February 2012 (previously National Express East Anglia)
c2c 77 78 79 80 82 79 80 81 80 81
Chiltern Railways 78 75 80 78 79 77 82 80 81 80
First Capital Connect 58 63 61 58 60 62 62 62 60 58
First Great Western 70 70 70 67 69 71 73 72 72 72
Greater Anglia* 59 56 57 55 58 56 60 59 62 58
London Midland 64 67 73 71 74 72 73 80 79 75
London Overground 47 52 54 67 81 83 86 83 85 81
South West Trains 78 78 78 76 79 76 75 76 75 72
Southeastern 64 60 61 66 70 65 67 67 71 67
Southern 70 71 73 72 72 71 72 69 70 67
Average Score 67 67 68 68 71 70 71 71 72 69
BEST IN CLASS 78 78 80 80 82 83 86 83 85 81
The comfort of the seating area on the train
2.2 London and South East Services 2 Note: The best in class is marked by a and is calculated by looking at the percentage satisfied by TOC to 3 decimal places. Percentages in the table however are rounded to 0 decimal places.
Autumn 2008
Autumn 2009
Spring 2009
Spring 2011
Autumn 2011
Autumn 2010
Spring 2010
Spring 2010
Spring 2011
Autumn 2010
Autumn 2009
Autumn 2012
Spring 2013
Spring 2012
Autumn 2011
Spring 2009
Autumn 2008
34 2.2 London and South East Services Non-franchised Train Operating Companies are excluded

*Greater Anglia from 5th February 2012 (previously National Express East Anglia)
c2c 83 82 84 84 85 84 85 85 87 87
Chiltern Railways 90 88 92 90 91 88 89 89 88 87
First Capital Connect 71 74 77 74 75 75 74 76 76 73
First Great Western 75 76 76 78 77 77 78 77 76 76
Greater Anglia* 74 75 74 76 77 76 78 76 81 78
London Midland 75 76 81 82 81 80 81 86 81 80
London Overground 57 56 68 67 81 86 89 84 86 81
South West Trains 80 81 80 79 83 80 81 82 79 77
Southeastern 78 72 77 79 78 78 79 79 81 78
Southern 77 77 79 78 79 78 76 75 77 74
Average Score 76 76 78 78 79 79 80 79 80 77
BEST IN CLASS 90 88 92 90 91 88 89 89 88 87
The ease of being able to get on and off the train
2.2 London and South East Services 2 Note: The best in class is marked by a and is calculated by looking at the percentage satisfied by TOC to 3 decimal places. Percentages in the table however are rounded to 0 decimal places.
Autumn 2008
Autumn 2009
Spring 2009
Spring 2011
Autumn 2011
Autumn 2010
Spring 2010
Spring 2010
Spring 2011
Autumn 2010
Autumn 2009
Autumn 2012
Spring 2013
Spring 2012
Autumn 2011
Spring 2009
Autumn 2008
35 2.2 London and South East Services Non-franchised Train Operating Companies are excluded
*Greater Anglia from 5th February 2012 (previously National Express East Anglia)
c2c 68 67 69 72 75 72 74 75 76 77
Chiltern Railways 84 81 86 83 85 82 86 85 86 85
First Capital Connect 64 65 68 65 67 68 68 71 73 70
First Great Western 78 77 77 77 79 79 80 81 79 79
Greater Anglia* 65 65 66 65 66 64 67 64 72 68
London Midland 71 70 76 76 79 76 78 80 79 75
London Overground 53 54 62 64 75 81 82 80 83 80
South West Trains 77 77 76 79 82 79 78 81 80 80
Southeastern 64 60 64 69 67 68 71 70 73 69
Southern 69 69 72 72 75 74 76 72 76 74
Average Score 69 69 71 72 74 74 75 75 77 75
BEST IN CLASS 84 81 86 83 85 82 86 85 86 85
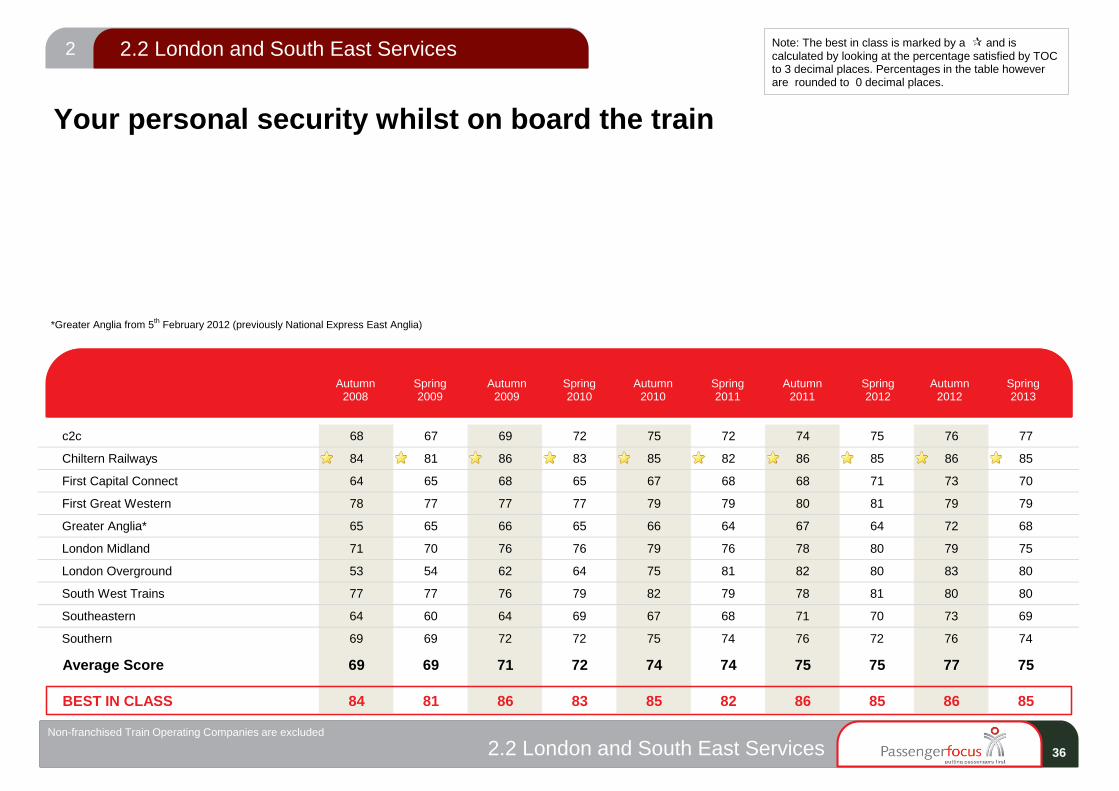
Your personal security whilst on board the train
2.2 London and South East Services 2 Note: The best in class is marked by a and is calculated by looking at the percentage satisfied by TOC to 3 decimal places. Percentages in the table however are rounded to 0 decimal places.
Autumn 2008
Autumn 2009
Spring 2009
Spring 2011
Autumn 2011
Autumn 2010
Spring 2010
Spring 2010
Spring 2011
Autumn 2010
Autumn 2009
Autumn 2012
Spring 2013
Spring 2012
Autumn 2011
Spring 2009
Autumn 2008
36 2.2 London and South East Services Non-franchised Train Operating Companies are excluded
*Greater Anglia from 5th February 2012 (previously National Express East Anglia)
c2c 87 89 89 91 91 89 91 91 93 90
Chiltern Railways 85 81 85 81 84 85 87 86 86 84
First Capital Connect 64 67 64 61 62 64 65 64 65 57
First Great Western 72 73 72 69 72 72 76 77 77 74
Greater Anglia* 64 60 59 57 59 61 63 57 62 57
London Midland 73 72 83 76 77 74 80 82 83 76
London Overground 55 60 69 72 92 94 93 92 93 91
South West Trains 78 78 74 74 76 74 75 78 76 74
Southeastern 66 64 66 69 71 68 72 71 73 68
Southern 74 73 76 74 71 73 72 70 74 70
Average Score 71 70 71 70 72 72 75 74 75 71
BEST IN CLASS 87 89 89 91 92 94 93 92 93 91
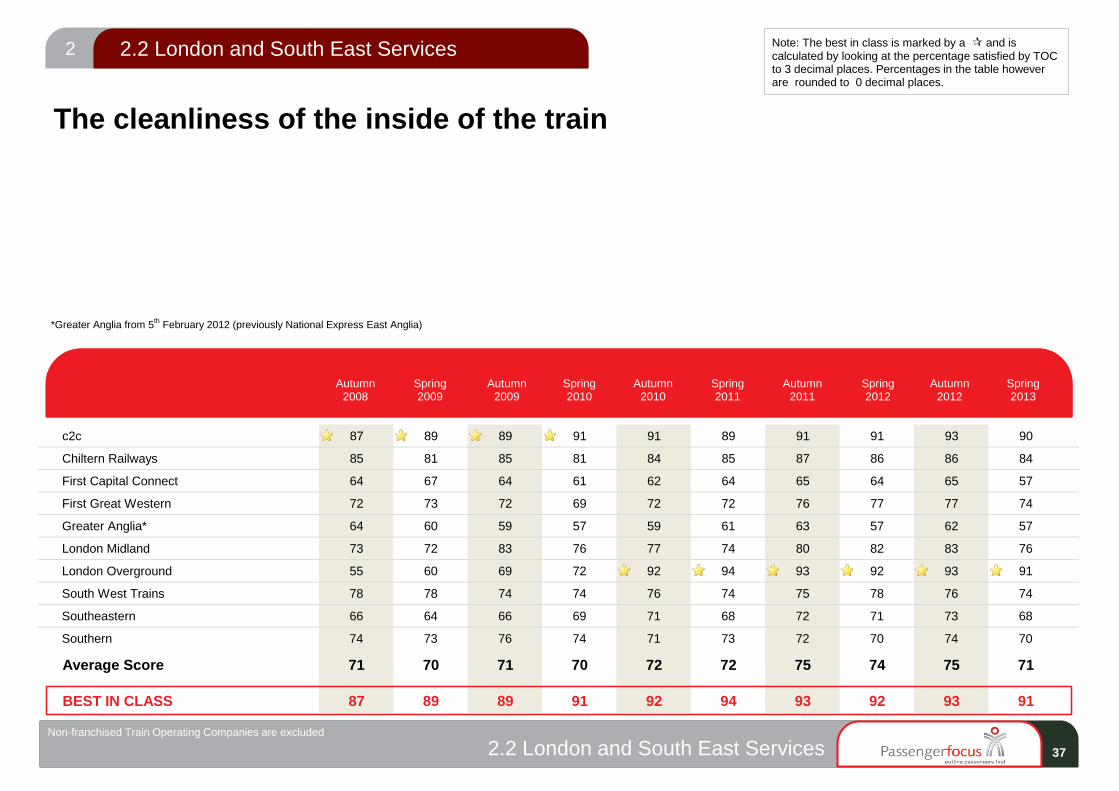
The cleanliness of the inside of the train
2.2 London and South East Services 2 Note: The best in class is marked by a and is calculated by looking at the percentage satisfied by TOC to 3 decimal places. Percentages in the table however are rounded to 0 decimal places.
Autumn 2008
Autumn 2009
Spring 2009
Spring 2011
Autumn 2011
Autumn 2010
Spring 2010
Spring 2010
Spring 2011
Autumn 2010
Autumn 2009
Autumn 2012
Spring 2013
Spring 2012
Autumn 2011
Spring 2009
Autumn 2008
37 2.2 London and South East Services Non-franchised Train Operating Companies are excluded

*Greater Anglia from 5th February 2012 (previously National Express East Anglia)
c2c 84 85 86 87 88 86 90 88 89 86
Chiltern Railways 84 80 84 76 82 79 85 83 83 81
First Capital Connect 60 62 61 56 56 53 60 57 56 51
First Great Western 68 70 70 64 70 65 74 73 73 70
Greater Anglia* 59 54 58 48 52 53 59 54 58 50
London Midland 71 71 81 74 77 72 80 83 83 77
London Overground 56 58 70 70 92 92 91 90 92 89
South West Trains 81 78 77 75 79 75 78 77 79 75
Southeastern 66 62 64 63 70 64 70 68 71 65
Southern 74 72 77 73 74 72 74 69 71 66
Average Score 70 68 71 67 72 69 74 72 74 69
BEST IN CLASS 84 85 86 87 92 92 91 90 92 89
The cleanliness of the outside of the train
2.2 London and South East Services 2 Note: The best in class is marked by a and is calculated by looking at the percentage satisfied by TOC to 3 decimal places. Percentages in the table however are rounded to 0 decimal places.
Autumn 2008
Autumn 2009
Spring 2009
Spring 2011
Autumn 2011
Autumn 2010
Spring 2010
Spring 2010
Spring 2011
Autumn 2010
Autumn 2009
Autumn 2012
Spring 2013
Spring 2012
Autumn 2011
Spring 2009
Autumn 2008
38 2.2 London and South East Services Non-franchised Train Operating Companies are excluded

*Greater Anglia from 5th February 2012 (previously National Express East Anglia)
c2c 17 16 19 19 18 22 20 22 19 23
Chiltern Railways 27 28 30 33 37 38 39 39 35 34
First Capital Connect 15 11 15 12 13 12 14 17 16 13
First Great Western 41 45 47 48 51 50 50 49 47 48
Greater Anglia* 24 23 22 22 25 26 28 27 25 26
London Midland 31 34 36 39 41 43 47 45 48 41
London Overground 15 19 22 31 37 26 37 37 42 42
South West Trains 45 49 50 52 53 52 54 55 52 51
Southeastern 26 21 26 35 31 33 33 33 33 34
Southern 34 35 38 41 41 39 40 36 35 33
Average Score 31 32 34 37 38 37 39 39 38 37
BEST IN CLASS 45 49 50 52 53 52 54 55 52 51
The availability of staff on the train
2.2 London and South East Services 2 Note: The best in class is marked by a and is calculated by looking at the percentage satisfied by TOC to 3 decimal places. Percentages in the table however are rounded to 0 decimal places.
Autumn 2008
Autumn 2009
Spring 2009
Spring 2011
Autumn 2011
Autumn 2010
Spring 2010
Spring 2010
Spring 2011
Autumn 2010
Autumn 2009
Autumn 2012
Spring 2013
Spring 2012
Autumn 2011
Spring 2009
Autumn 2008
39 2.2 London and South East Services Non-franchised Train Operating Companies are excluded

*Greater Anglia from 5th February 2012 (previously National Express East Anglia)
c2c 45 53 42 51 49 50 40 42 62 62
Chiltern Railways 48 37 52 35 52 46 39 38 51 46
First Capital Connect 31 35 32 24 34 25 33 30 33 28
First Great Western 42 39 41 48 42 43 45 41 48 44
Greater Anglia* 34 29 33 27 41 28 32 28 44 28
London Midland 29 25 37 36 41 32 41 49 46 32
London Overground 27 23 16 18 28 50 42 43 42 35
South West Trains 42 40 41 42 40 33 41 37 48 45
Southeastern 32 26 25 29 34 24 26 31 40 31
Southern 33 32 33 29 35 34 35 35 39 30
Average Score 35 32 33 32 37 34 36 35 43 36
BEST IN CLASS 48 53 52 51 52 50 45 49 62 62
How well train company dealt with delays
2.2 London and South East Services 2 Note: The best in class is marked by a and is calculated by looking at the percentage satisfied by TOC to 3 decimal places. Percentages in the table however are rounded to 0 decimal places.
Autumn 2008
Autumn 2009
Spring 2009
Spring 2011
Autumn 2011
Autumn 2010
Spring 2010
Spring 2010
Spring 2011
Autumn 2010
Autumn 2009
Autumn 2012
Spring 2013
Spring 2012
Autumn 2011
Spring 2009
Autumn 2008
40 2.2 London and South East Services Non-franchised Train Operating Companies are excluded

CrossCountry 84 85 85 85 84 85 82 84 85 84
East Coast 88 87 89 88 89 87 87 89 92 86
East Midlands Trains 81 80 84 86 88 86 87 87 89 88
First TransPennine Express 83 87 89 87 87 89 84 88 88 85
Virgin Trains 84 86 89 90 90 90 89 91 92 92
Average Score 84 85 87 87 87 87 86 88 89 87
BEST IN CLASS 88 87 89 90 90 90 89 91 92 92
Overall satisfaction with journey
3.1 High Speed Long Distance Services 3 Note: The best in class is marked by a and is calculated by looking at the percentage satisfied by TOC to 3 decimal places. Percentages in the table however are rounded to 0 decimal places.
Spring 2010
Spring 2011
Autumn 2010
Autumn 2009
Autumn 2012
Spring 2013
Spring 2012
Autumn 2011
Spring 2009
Autumn 2008
41 3.1 High Speed Long Distance Services Non-franchised Train Operating Companies are excluded

CrossCountry 79 77 80 79 80 76
East Coast 79 77 76 75 88 87
East Midlands Trains 85 82 83 85 89 82
First TransPennine Express 86 87 85 86 86 86
Virgin Trains 80 82 82 82 80 79
Average Score 82 81 81 81 84 81
BEST IN CLASS 86 87 85 86 89 87
Overall satisfaction with the station
3.1 High Speed Long Distance Services 3 Note: The best in class is marked by a and is calculated by looking at the percentage satisfied by TOC to 3 decimal places. Percentages in the table however are rounded to 0 decimal places.
Spring 2011
Autumn 2010
Autumn 2012
Spring 2013
Spring 2012
Autumn 2011
42 3.1 High Speed Long Distance Services Non-franchised Train Operating Companies are excluded

CrossCountry 85 84 82 80 80 79 83 78 84 85
East Coast 80 79 84 80 79 80 81 84 86 87
East Midlands Trains 80 74 77 78 76 77 79 81 87 77
First TransPennine Express 81 81 81 81 88 84 89 87 87 84
Virgin Trains 82 81 79 81 85 78 85 83 87 83
Average Score 82 80 80 80 82 79 84 82 86 83
BEST IN CLASS 85 84 84 81 88 84 89 87 87 87
Ticket buying facilities
3.1 High Speed Long Distance Services 3 Note: The best in class is marked by a and is calculated by looking at the percentage satisfied by TOC to 3 decimal places. Percentages in the table however are rounded to 0 decimal places.
Spring 2010
Spring 2011
Autumn 2010
Autumn 2009
Autumn 2012
Spring 2013
Spring 2012
Autumn 2011
Spring 2009
Autumn 2008
43 3.1 High Speed Long Distance Services Non-franchised Train Operating Companies are excluded

CrossCountry 84 86 85 84 82 84 85 83 85 85
East Coast 90 90 88 89 88 86 85 87 91 90
East Midlands Trains 84 82 84 86 83 84 86 84 86 83
First TransPennine Express 85 85 85 86 89 91 87 88 91 88
Virgin Trains 82 87 85 87 88 86 89 87 87 87
Average Score 85 86 85 86 86 86 86 86 88 87
BEST IN CLASS 90 90 88 89 89 91 89 88 91 90
Provision of information about train times/platforms
3.1 High Speed Long Distance Services 3 Note: The best in class is marked by a and is calculated by looking at the percentage satisfied by TOC to 3 decimal places. Percentages in the table however are rounded to 0 decimal places.
Spring 2010
Spring 2011
Autumn 2010
Autumn 2009
Autumn 2012
Spring 2013
Spring 2012
Autumn 2011
Spring 2009
Autumn 2008
44 3.1 High Speed Long Distance Services Non-franchised Train Operating Companies are excluded

CrossCountry 70 68 72 70 68 70 69 66 71 67
East Coast 72 67 73 72 68 68 66 65 83 82
East Midlands Trains 72 75 75 74 76 75 78 80 82 76
First TransPennine Express 73 75 80 77 81 80 79 83 79 82
Virgin Trains 69 70 69 67 70 71 71 71 71 72
Average Score 71 71 73 72 73 73 73 73 76 75
BEST IN CLASS 73 75 80 77 81 80 79 83 83 82
The upkeep/repair of the station buildings/platforms
3.1 High Speed Long Distance Services 3 Note: The best in class is marked by a and is calculated by looking at the percentage satisfied by TOC to 3 decimal places. Percentages in the table however are rounded to 0 decimal places.
Spring 2010
Spring 2011
Autumn 2010
Autumn 2009
Autumn 2012
Spring 2013
Spring 2012
Autumn 2011
Spring 2009
Autumn 2008
45 3.1 High Speed Long Distance Services Non-franchised Train Operating Companies are excluded

CrossCountry 78 75 77 74 74 75 74 74 74 74
East Coast 76 72 77 76 74 72 73 72 88 86
East Midlands Trains 76 77 79 78 80 80 82 83 86 80
First TransPennine Express 78 80 81 80 84 82 81 85 82 86
Virgin Trains 75 74 74 74 75 74 76 74 77 75
Average Score 76 76 78 76 77 77 77 77 80 79
BEST IN CLASS 78 80 81 80 84 82 82 85 88 86
Cleanliness of the station
3.1 High Speed Long Distance Services 3 Note: The best in class is marked by a and is calculated by looking at the percentage satisfied by TOC to 3 decimal places. Percentages in the table however are rounded to 0 decimal places.
Spring 2010
Spring 2011
Autumn 2010
Autumn 2009
Autumn 2012
Spring 2013
Spring 2012
Autumn 2011
Spring 2009
Autumn 2008
46 3.1 High Speed Long Distance Services Non-franchised Train Operating Companies are excluded

CrossCountry 62 64 68 65 63 63 65 60 67 63
East Coast 64 59 61 64 61 61 60 58 79 76
East Midlands Trains 60 61 61 61 61 63 67 64 70 65
First TransPennine Express 61 64 68 66 64 65 67 68 74 75
Virgin Trains 61 64 66 65 65 65 67 62 70 67
Average Score 62 63 65 64 63 64 65 62 71 68
BEST IN CLASS 64 64 68 66 65 65 67 68 79 76
The facilities and services at the station
3.1 High Speed Long Distance Services 3 Note: The best in class is marked by a and is calculated by looking at the percentage satisfied by TOC to 3 decimal places. Percentages in the table however are rounded to 0 decimal places.
Spring 2010
Spring 2011
Autumn 2010
Autumn 2009
Autumn 2012
Spring 2013
Spring 2012
Autumn 2011
Spring 2009
Autumn 2008
47 3.1 High Speed Long Distance Services Non-franchised Train Operating Companies are excluded
CrossCountry 80 79 77 77 80 76 77 79 79 77
East Coast 76 74 79 78 79 76 75 76 83 80
East Midlands Trains 76 76 77 76 77 76 77 78 81 78
First TransPennine Express 77 72 74 75 79 79 81 78 80 81
Virgin Trains 72 74 74 74 79 71 74 73 77 77
Average Score 76 76 76 76 79 76 77 77 80 78
BEST IN CLASS 80 79 79 78 80 79 81 79 83 81
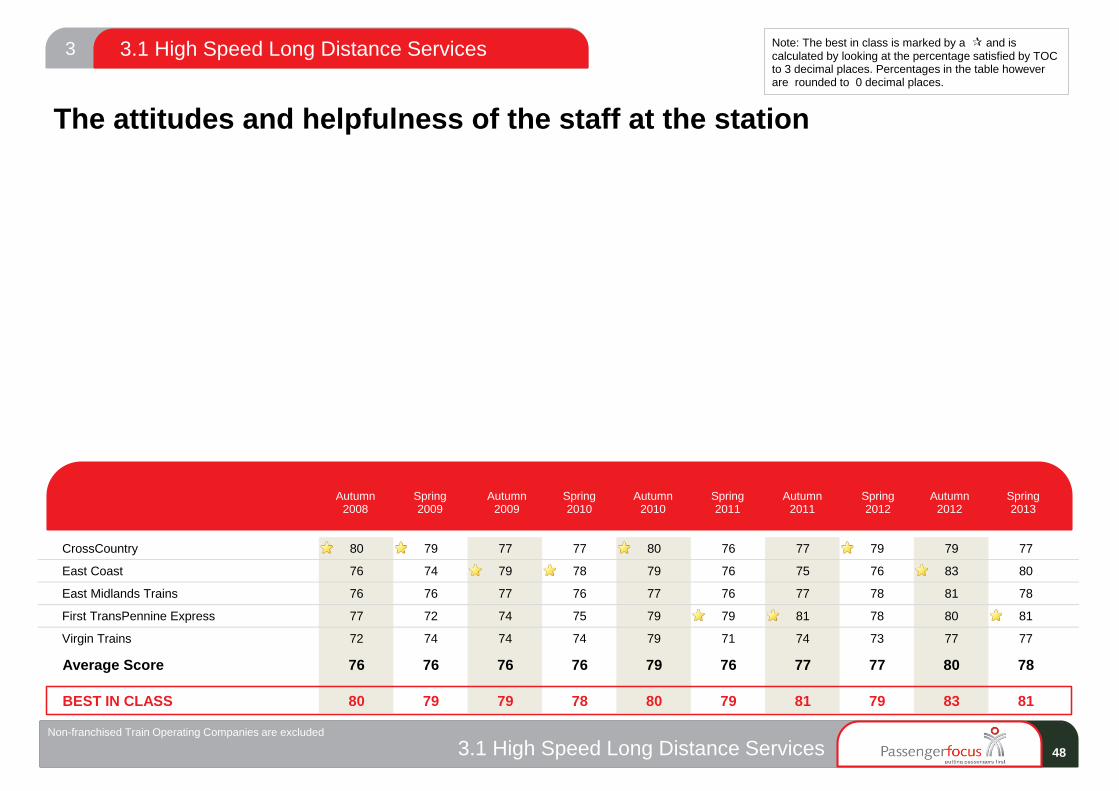
The attitudes and helpfulness of the staff at the station
3.1 High Speed Long Distance Services 3 Note: The best in class is marked by a and is calculated by looking at the percentage satisfied by TOC to 3 decimal places. Percentages in the table however are rounded to 0 decimal places.
Spring 2010
Spring 2011
Autumn 2010
Autumn 2009
Autumn 2012
Spring 2013
Spring 2012
Autumn 2011
Spring 2009
Autumn 2008
48 3.1 High Speed Long Distance Services Non-franchised Train Operating Companies are excluded

CrossCountry 73 73 76 75 76 77 70 74 74 73
East Coast 76 75 73 80 81 80 80 80 85 81
East Midlands Trains 71 76 70 74 70 71 70 72 77 74
First TransPennine Express 70 73 73 75 76 75 71 73 80 76
Virgin Trains 77 79 79 77 82 80 81 82 86 84
Average Score 74 75 74 76 77 76 74 76 80 78
BEST IN CLASS 77 79 79 80 82 80 81 82 86 84
Connections with other forms of public transport from the station
3.1 High Speed Long Distance Services 3 Note: The best in class is marked by a and is calculated by looking at the percentage satisfied by TOC to 3 decimal places. Percentages in the table however are rounded to 0 decimal places.
Spring 2010
Spring 2011
Autumn 2010
Autumn 2009
Autumn 2012
Spring 2013
Spring 2012
Autumn 2011
Spring 2009
Autumn 2008
49 3.1 High Speed Long Distance Services Non-franchised Train Operating Companies are excluded

CrossCountry 65 59 54 57 59 53 59 58 58 60
East Coast 52 55 50 58 49 55 56 49 57 51
East Midlands Trains 52 54 58 57 61 58 64 67 70 67
First TransPennine Express 43 43 45 50 60 61 65 62 58 55
Virgin Trains 43 46 56 55 52 55 65 58 55 51
Average Score 52 52 53 55 57 56 62 60 60 57
BEST IN CLASS 65 59 58 58 61 61 65 67 70 67
Facilities for car parking
3.1 High Speed Long Distance Services 3 Note: The best in class is marked by a and is calculated by looking at the percentage satisfied by TOC to 3 decimal places. Percentages in the table however are rounded to 0 decimal places.
Spring 2010
Spring 2011
Autumn 2010
Autumn 2009
Autumn 2012
Spring 2013
Spring 2012
Autumn 2011
Spring 2009
Autumn 2008
50 3.1 High Speed Long Distance Services Non-franchised Train Operating Companies are excluded

CrossCountry 70 74 74 70 71 69 71 69 70 65
East Coast 72 69 72 72 69 69 66 64 82 80
East Midlands Trains 72 75 74 76 77 75 78 80 83 74
First TransPennine Express 75 76 79 77 83 81 80 82 78 79
Virgin Trains 70 70 70 70 72 71 74 71 70 70
Average Score 71 73 74 73 74 73 74 73 76 73
BEST IN CLASS 75 76 79 77 83 81 80 82 83 80
Overall environment of the station
3.1 High Speed Long Distance Services 3 Note: The best in class is marked by a and is calculated by looking at the percentage satisfied by TOC to 3 decimal places. Percentages in the table however are rounded to 0 decimal places.
Spring 2010
Spring 2011
Autumn 2010
Autumn 2009
Autumn 2012
Spring 2013
Spring 2012
Autumn 2011
Spring 2009
Autumn 2008
51 3.1 High Speed Long Distance Services Non-franchised Train Operating Companies are excluded

CrossCountry 73 73 73 72 74 71 73 72 77 74
East Coast 72 71 72 71 73 72 70 71 80 78
East Midlands Trains 69 70 71 75 73 75 74 76 78 72
First TransPennine Express 68 73 71 75 77 75 75 77 81 80
Virgin Trains 69 71 73 70 75 71 76 73 76 74
Average Score 70 72 72 72 74 73 74 74 78 76
BEST IN CLASS 73 73 73 75 77 75 76 77 81 80
Your personal security whilst using the station
3.1 High Speed Long Distance Services 3 Note: The best in class is marked by a and is calculated by looking at the percentage satisfied by TOC to 3 decimal places. Percentages in the table however are rounded to 0 decimal places.
Spring 2010
Spring 2011
Autumn 2010
Autumn 2009
Autumn 2012
Spring 2013
Spring 2012
Autumn 2011
Spring 2009
Autumn 2008
52 3.1 High Speed Long Distance Services Non-franchised Train Operating Companies are excluded
CrossCountry 67 67 68 68 68 65 67 67 68 64
East Coast 68 65 68 68 67 67 66 67 73 69
East Midlands Trains 63 66 66 66 68 66 68 68 72 64
First TransPennine Express 65 64 65 63 68 67 69 69 69 72
Virgin Trains 62 61 63 61 64 58 60 60 62 63
Average Score 65 65 66 65 67 65 66 66 68 66
BEST IN CLASS 68 67 68 68 68 67 69 69 73 72
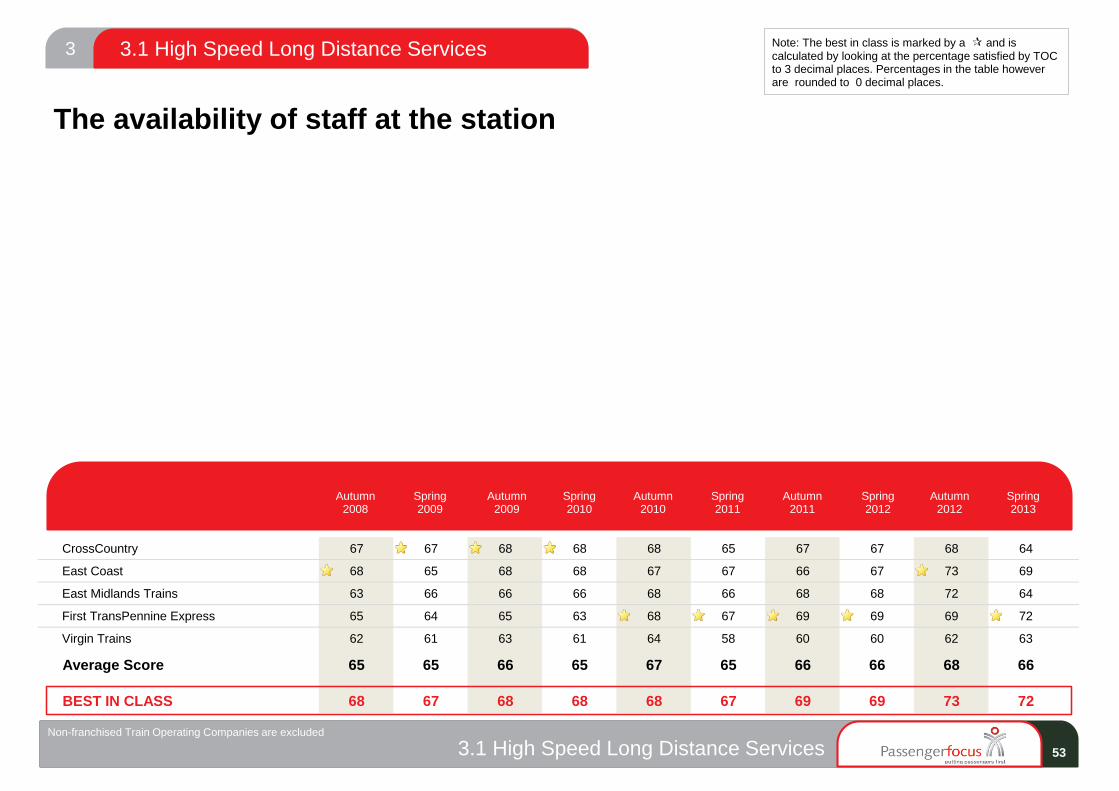
The availability of staff at the station
3.1 High Speed Long Distance Services 3 Note: The best in class is marked by a and is calculated by looking at the percentage satisfied by TOC to 3 decimal places. Percentages in the table however are rounded to 0 decimal places.
Spring 2010
Spring 2011
Autumn 2010
Autumn 2009
Autumn 2012
Spring 2013
Spring 2012
Autumn 2011
Spring 2009
Autumn 2008
53 3.1 High Speed Long Distance Services Non-franchised Train Operating Companies are excluded

CrossCountry 75 66
East Coast 77 70
East Midlands Trains 79 67
First TransPennine Express 78 75
Virgin Trains 74 69
Average Score 76 69
BEST IN CLASS 79 75
The provision of shelter facilities
3.1 High Speed Long Distance Services 3 Note: The best in class is marked by a and is calculated by looking at the percentage satisfied by TOC to 3 decimal places. Percentages in the table however are rounded to 0 decimal places.
Autumn 2012
Spring 2013
54 3.1 High Speed Long Distance Services Non-franchised Train Operating Companies are excluded

CrossCountry 53 53
East Coast 48 43
East Midlands Trains 55 50
First TransPennine Express 59 58
Virgin Trains 44 43
Average Score 52 50
BEST IN CLASS 59 58
Availability of seating
3.1 High Speed Long Distance Services 3 Note: The best in class is marked by a and is calculated by looking at the percentage satisfied by TOC to 3 decimal places. Percentages in the table however are rounded to 0 decimal places.
Autumn 2012
Spring 2013
55 3.1 High Speed Long Distance Services Non-franchised Train Operating Companies are excluded

CrossCountry 85 87 89 91 89 87 87 92 89 90
East Coast 90 87 89 89 87 88 86 85 88 87
East Midlands Trains 85 87 84 85 84 85 89 89 91 85
First TransPennine Express 84 86 88 90 93 90 89 88 89 91
Virgin Trains 85 86 87 91 88 86 82 87 90 88
Average Score 86 87 88 89 88 87 87 89 89 89
BEST IN CLASS 90 87 89 91 93 90 89 92 91 91
How request to station staff was handled
3.1 High Speed Long Distance Services 3 Note: The best in class is marked by a and is calculated by looking at the percentage satisfied by TOC to 3 decimal places. Percentages in the table however are rounded to 0 decimal places.
Spring 2010
Spring 2011
Autumn 2010
Autumn 2009
Autumn 2012
Spring 2013
Spring 2012
Autumn 2011
Spring 2009
Autumn 2008
56 3.1 High Speed Long Distance Services Non-franchised Train Operating Companies are excluded

CrossCountry 82 81
East Coast 89 87
East Midlands Trains 87 86
First TransPennine Express 88 86
Virgin Trains 92 93
Average Score 87 86
BEST IN CLASS 92 93
Overall satisfaction with the train
3.2 High Speed Long Distance Services 3 Note: The best in class is marked by a and is calculated by looking at the percentage satisfied by TOC to 3 decimal places. Percentages in the table however are rounded to 0 decimal places.
Autumn 2012
Spring 2013
57 3.2 High Speed Long Distance Services Non-franchised Train Operating Companies are excluded

CrossCountry 80 80 81 84 79 80 80 81 79 80
East Coast 86 90 89 89 91 90 89 90 91 90
East Midlands Trains 76 76 76 79 81 80 80 82 85 81
First TransPennine Express 79 81 83 83 82 83 82 86 81 84
Virgin Trains 81 85 86 90 90 89 90 89 91 90
Average Score 80 82 82 85 84 84 84 85 85 85
BEST IN CLASS 86 90 89 90 91 90 90 90 91 90
The frequency of the trains on that route
3.2 High Speed Long Distance Services 3 Note: The best in class is marked by a and is calculated by looking at the percentage satisfied by TOC to 3 decimal places. Percentages in the table however are rounded to 0 decimal places.
Spring 2010
Spring 2011
Autumn 2010
Autumn 2009
Autumn 2012
Spring 2013
Spring 2012
Autumn 2011
Spring 2009
Autumn 2008
58 3.2 High Speed Long Distance Services Non-franchised Train Operating Companies are excluded

CrossCountry 80 87 85 88 83 84 79 85 82 80
East Coast 87 89 90 89 83 85 78 88 89 83
East Midlands Trains 79 84 85 84 87 86 88 88 88 86
First TransPennine Express 81 84 88 84 84 87 84 88 88 82
Virgin Trains 82 79 90 89 89 92 85 89 90 87
Average Score 81 84 87 87 85 87 83 87 87 83
BEST IN CLASS 87 89 90 89 89 92 88 89 90 87
Punctuality/reliability (i.e. the train arriving/departing on time)
3.2 High Speed Long Distance Services 3 Note: The best in class is marked by a and is calculated by looking at the percentage satisfied by TOC to 3 decimal places. Percentages in the table however are rounded to 0 decimal places.
Spring 2010
Spring 2011
Autumn 2010
Autumn 2009
Autumn 2012
Spring 2013
Spring 2012
Autumn 2011
Spring 2009
Autumn 2008
59 3.2 High Speed Long Distance Services Non-franchised Train Operating Companies are excluded

CrossCountry 83 86 86 88 86 84 85 87 85 86
East Coast 90 90 91 91 90 90 88 90 92 88
East Midlands Trains 79 83 83 86 88 87 90 89 89 86
First TransPennine Express 87 87 90 89 89 92 89 91 88 89
Virgin Trains 82 92 93 94 93 94 91 94 94 93
Average Score 84 88 88 89 89 89 88 90 89 89
BEST IN CLASS 90 92 93 94 93 94 91 94 94 93
The length of time the journey was scheduled to take (speed)
3.2 High Speed Long Distance Services 3 Note: The best in class is marked by a and is calculated by looking at the percentage satisfied by TOC to 3 decimal places. Percentages in the table however are rounded to 0 decimal places.
Spring 2010
Spring 2011
Autumn 2010
Autumn 2009
Autumn 2012
Spring 2013
Spring 2012
Autumn 2011
Spring 2009
Autumn 2008
60 3.2 High Speed Long Distance Services Non-franchised Train Operating Companies are excluded

CrossCountry 76 77 76 82 79 79 77 78 78 77
East Coast 78 78 81 82 81 80 79 79 84 77
East Midlands Trains 69 70 66 71 79 77 77 79 79 78
First TransPennine Express 75 72 81 77 76 83 81 81 81 80
Virgin Trains 75 77 84 82 86 83 83 88 87 87
Average Score 75 75 77 79 80 80 79 81 82 80
BEST IN CLASS 78 78 84 82 86 83 83 88 87 87
Connections with other train services
3.2 High Speed Long Distance Services 3 Note: The best in class is marked by a and is calculated by looking at the percentage satisfied by TOC to 3 decimal places. Percentages in the table however are rounded to 0 decimal places.
Spring 2010
Spring 2011
Autumn 2010
Autumn 2009
Autumn 2012
Spring 2013
Spring 2012
Autumn 2011
Spring 2009
Autumn 2008
61 3.2 High Speed Long Distance Services Non-franchised Train Operating Companies are excluded

CrossCountry 55 51 56 57 55 53 52 49 53 49
East Coast 54 54 55 59 60 58 57 56 58 56
East Midlands Trains 49 45 48 52 57 52 52 52 49 48
First TransPennine Express 53 52 63 60 59 60 59 56 57 55
Virgin Trains 56 57 64 63 65 59 59 59 60 61
Average Score 54 52 57 58 59 56 56 54 55 54
BEST IN CLASS 56 57 64 63 65 60 59 59 60 61
The value for money for the price of your ticket
3.2 High Speed Long Distance Services 3 Note: The best in class is marked by a and is calculated by looking at the percentage satisfied by TOC to 3 decimal places. Percentages in the table however are rounded to 0 decimal places.
Spring 2010
Spring 2011
Autumn 2010
Autumn 2009
Autumn 2012
Spring 2013
Spring 2012
Autumn 2011
Spring 2009
Autumn 2008
62 3.2 High Speed Long Distance Services Non-franchised Train Operating Companies are excluded
CrossCountry 83 83 80 80 77 77 76 79 77 79
East Coast 81 82 84 85 83 83 84 82 85 85
East Midlands Trains 74 71 72 76 76 78 81 82 83 81
First TransPennine Express 83 86 86 86 87 84 83 85 86 86
Virgin Trains 88 87 89 87 87 89 86 89 88 90
Average Score 82 82 82 82 82 82 82 83 84 84
BEST IN CLASS 88 87 89 87 87 89 86 89 88 90
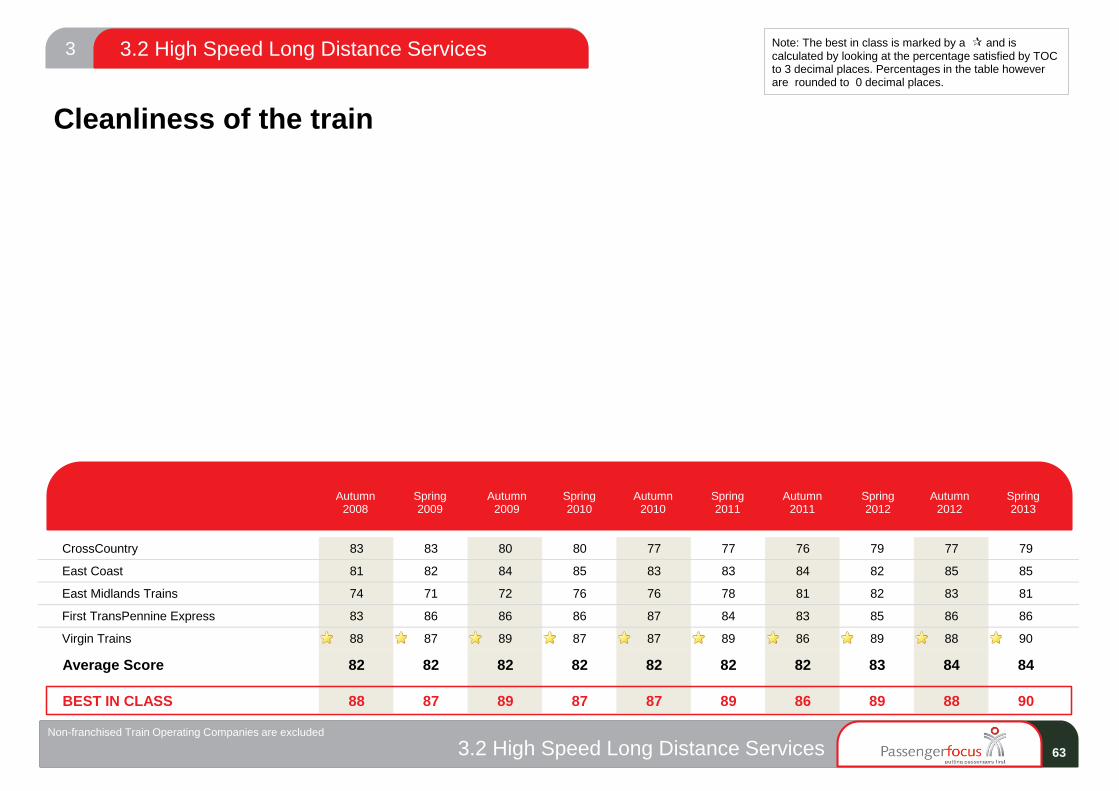
Cleanliness of the train
3.2 High Speed Long Distance Services 3 Note: The best in class is marked by a and is calculated by looking at the percentage satisfied by TOC to 3 decimal places. Percentages in the table however are rounded to 0 decimal places.
Spring 2010
Spring 2011
Autumn 2010
Autumn 2009
Autumn 2012
Spring 2013
Spring 2012
Autumn 2011
Spring 2009
Autumn 2008
63 3.2 High Speed Long Distance Services Non-franchised Train Operating Companies are excluded

CrossCountry 84 83 84 83 82 81 79 80 82 80
East Coast 79 79 84 83 82 80 81 79 82 81
East Midlands Trains 66 67 68 75 76 77 85 85 85 84
First TransPennine Express 88 91 91 91 90 88 87 88 89 90
Virgin Trains 90 90 88 89 88 90 87 89 89 91
Average Score 82 82 82 84 84 83 84 84 85 85
BEST IN CLASS 90 91 91 91 90 90 87 89 89 91
Upkeep and repair of the train
3.2 High Speed Long Distance Services 3 Note: The best in class is marked by a and is calculated by looking at the percentage satisfied by TOC to 3 decimal places. Percentages in the table however are rounded to 0 decimal places.
Spring 2010
Spring 2011
Autumn 2010
Autumn 2009
Autumn 2012
Spring 2013
Spring 2012
Autumn 2011
Spring 2009
Autumn 2008
64 3.2 High Speed Long Distance Services Non-franchised Train Operating Companies are excluded
CrossCountry 77 79 76 76 75 75 74 76 73 76
East Coast 76 77 76 79 77 78 80 79 81 80
East Midlands Trains 65 62 66 68 68 71 70 71 74 72
First TransPennine Express 78 81 81 79 83 81 79 80 80 82
Virgin Trains 76 80 80 82 83 81 80 82 84 88
Average Score 74 76 75 77 77 77 76 78 78 80
BEST IN CLASS 78 81 81 82 83 81 80 82 84 88
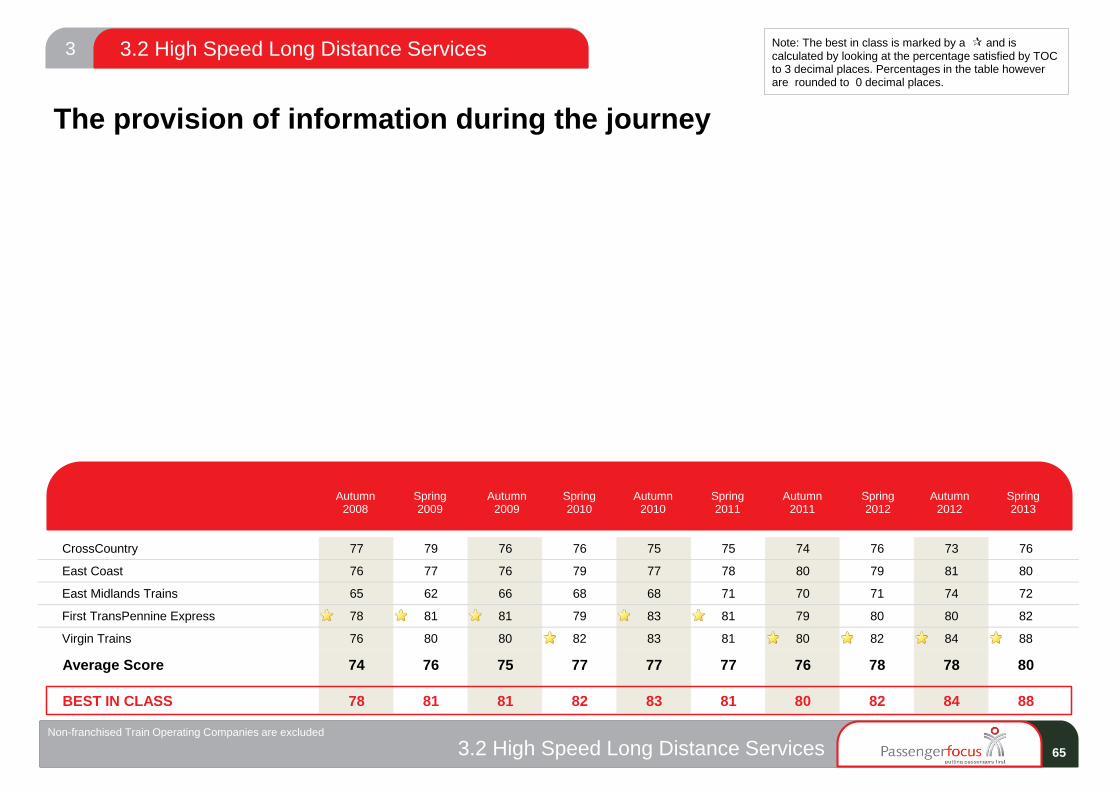
The provision of information during the journey
3.2 High Speed Long Distance Services 3 Note: The best in class is marked by a and is calculated by looking at the percentage satisfied by TOC to 3 decimal places. Percentages in the table however are rounded to 0 decimal places.
Spring 2010
Spring 2011
Autumn 2010
Autumn 2009
Autumn 2012
Spring 2013
Spring 2012
Autumn 2011
Spring 2009
Autumn 2008
65 3.2 High Speed Long Distance Services Non-franchised Train Operating Companies are excluded

CrossCountry 77 80 77 78 81 80 76 78 79 77
East Coast 78 77 78 80 79 78 80 82 85 84
East Midlands Trains 73 68 73 76 76 77 79 80 78 80
First TransPennine Express 73 76 77 78 77 79 80 82 81 82
Virgin Trains 77 76 82 78 80 80 80 81 81 84
Average Score 76 75 77 78 78 79 79 80 80 81
BEST IN CLASS 78 80 82 80 81 80 80 82 85 84
The helpfulness and attitude of staff on train
3.2 High Speed Long Distance Services 3 Note: The best in class is marked by a and is calculated by looking at the percentage satisfied by TOC to 3 decimal places. Percentages in the table however are rounded to 0 decimal places.
Spring 2010
Spring 2011
Autumn 2010
Autumn 2009
Autumn 2012
Spring 2013
Spring 2012
Autumn 2011
Spring 2009
Autumn 2008
66 3.2 High Speed Long Distance Services Non-franchised Train Operating Companies are excluded

CrossCountry 47 51 48 51 51 53 52 55 50 55
East Coast 54 56 55 56 55 60 61 63 66 63
East Midlands Trains 53 47 48 50 48 57 57 56 56 53
First TransPennine Express 51 53 54 52 50 50 47 50 52 58
Virgin Trains 45 51 50 51 51 56 52 57 59 62
Average Score 49 51 51 52 51 55 53 56 56 58
BEST IN CLASS 54 56 55 56 55 60 61 63 66 63
The space for luggage on the train
3.2 High Speed Long Distance Services 3 Note: The best in class is marked by a and is calculated by looking at the percentage satisfied by TOC to 3 decimal places. Percentages in the table however are rounded to 0 decimal places.
Spring 2010
Spring 2011
Autumn 2010
Autumn 2009
Autumn 2012
Spring 2013
Spring 2012
Autumn 2011
Spring 2009
Autumn 2008
67 3.2 High Speed Long Distance Services Non-franchised Train Operating Companies are excluded

CrossCountry 54 55 53 48 53 49 49 48 48 48
East Coast 45 45 47 48 51 49 55 52 54 50
East Midlands Trains 42 45 46 46 48 52 53 50 54 43
First TransPennine Express 54 59 59 56 52 53 52 57 56 53
Virgin Trains 50 56 58 56 55 53 52 54 57 60
Average Score 49 52 52 51 52 51 52 52 54 52
BEST IN CLASS 54 59 59 56 55 53 55 57 57 60
The toilet facilities on the train
3.2 High Speed Long Distance Services 3 Note: The best in class is marked by a and is calculated by looking at the percentage satisfied by TOC to 3 decimal places. Percentages in the table however are rounded to 0 decimal places.
Spring 2010
Spring 2011
Autumn 2010
Autumn 2009
Autumn 2012
Spring 2013
Spring 2012
Autumn 2011
Spring 2009
Autumn 2008
68 3.2 High Speed Long Distance Services Non-franchised Train Operating Companies are excluded

CrossCountry 59 72 70 68 66 70 64 70 65 70
East Coast 73 75 74 72 76 77 79 79 81 79
East Midlands Trains 68 67 68 72 74 72 76 74 70 74
First TransPennine Express 63 68 66 66 62 64 62 63 61 65
Virgin Trains 68 77 77 74 74 77 71 80 82 83
Average Score 66 72 71 70 70 71 70 73 71 74
BEST IN CLASS 73 77 77 74 76 77 79 80 82 83
Sufficient room for all passengers to sit/stand on the train
3.2 High Speed Long Distance Services 3 Note: The best in class is marked by a and is calculated by looking at the percentage satisfied by TOC to 3 decimal places. Percentages in the table however are rounded to 0 decimal places.
Spring 2010
Spring 2011
Autumn 2010
Autumn 2009
Autumn 2012
Spring 2013
Spring 2012
Autumn 2011
Spring 2009
Autumn 2008
69 3.2 High Speed Long Distance Services Non-franchised Train Operating Companies are excluded

CrossCountry 78 79 78 74 76 77 76 76 74 77
East Coast 74 76 77 76 77 77 81 79 81 80
East Midlands Trains 70 71 71 76 79 78 83 82 81 81
First TransPennine Express 81 83 84 82 83 80 80 79 80 83
Virgin Trains 78 80 80 78 78 79 77 82 84 86
Average Score 76 78 78 77 79 78 79 79 80 81
BEST IN CLASS 81 83 84 82 83 80 83 82 84 86
The comfort of the seating area on the train
3.2 High Speed Long Distance Services 3 Note: The best in class is marked by a and is calculated by looking at the percentage satisfied by TOC to 3 decimal places. Percentages in the table however are rounded to 0 decimal places.
Spring 2010
Spring 2011
Autumn 2010
Autumn 2009
Autumn 2012
Spring 2013
Spring 2012
Autumn 2011
Spring 2009
Autumn 2008
70 3.2 High Speed Long Distance Services Non-franchised Train Operating Companies are excluded

CrossCountry 80 81 80 81 82 82 78 82 80 83
East Coast 79 78 81 78 82 82 84 83 84 82
East Midlands Trains 76 76 77 82 81 82 83 85 84 84
First TransPennine Express 82 86 86 83 82 82 79 83 81 82
Virgin Trains 83 84 87 88 85 87 88 90 89 91
Average Score 80 81 82 83 83 83 82 85 83 85
BEST IN CLASS 83 86 87 88 85 87 88 90 89 91
The ease of being able to get on and off the train
3.2 High Speed Long Distance Services 3 Note: The best in class is marked by a and is calculated by looking at the percentage satisfied by TOC to 3 decimal places. Percentages in the table however are rounded to 0 decimal places.
Spring 2010
Spring 2011
Autumn 2010
Autumn 2009
Autumn 2012
Spring 2013
Spring 2012
Autumn 2011
Spring 2009
Autumn 2008
71 3.2 High Speed Long Distance Services Non-franchised Train Operating Companies are excluded

CrossCountry 81 80 84 84 82 84 81 85 84 84
East Coast 84 82 85 85 85 86 86 86 90 86
East Midlands Trains 79 79 79 84 83 82 85 85 86 84
First TransPennine Express 81 84 85 84 84 87 81 86 84 86
Virgin Trains 85 85 85 86 86 89 87 89 89 89
Average Score 82 82 83 85 84 85 84 86 86 86
BEST IN CLASS 85 85 85 86 86 89 87 89 90 89
Your personal security whilst on board the train
3.2 High Speed Long Distance Services 3 Note: The best in class is marked by a and is calculated by looking at the percentage satisfied by TOC to 3 decimal places. Percentages in the table however are rounded to 0 decimal places.
Spring 2010
Spring 2011
Autumn 2010
Autumn 2009
Autumn 2012
Spring 2013
Spring 2012
Autumn 2011
Spring 2009
Autumn 2008
72 3.2 High Speed Long Distance Services Non-franchised Train Operating Companies are excluded

CrossCountry 83 82 80 79 78 78 77 79 79 78
East Coast 80 82 83 84 83 82 85 82 85 85
East Midlands Trains 70 70 72 78 76 79 82 83 84 83
First TransPennine Express 83 86 87 86 87 84 85 86 86 86
Virgin Trains 87 88 88 87 86 88 86 89 90 90
Average Score 81 82 81 82 82 82 82 84 84 84
BEST IN CLASS 87 88 88 87 87 88 86 89 90 90
The cleanliness of the inside of the train
3.2 High Speed Long Distance Services 3 Note: The best in class is marked by a and is calculated by looking at the percentage satisfied by TOC to 3 decimal places. Percentages in the table however are rounded to 0 decimal places.
Spring 2010
Spring 2011
Autumn 2010
Autumn 2009
Autumn 2012
Spring 2013
Spring 2012
Autumn 2011
Spring 2009
Autumn 2008
73 3.2 High Speed Long Distance Services Non-franchised Train Operating Companies are excluded

CrossCountry 79 79 80 78 76 76 77 78 79 74
East Coast 77 77 78 78 79 74 78 76 77 72
East Midlands Trains 64 64 69 67 73 69 75 74 77 71
First TransPennine Express 82 83 86 79 85 79 82 82 85 82
Virgin Trains 83 82 84 81 87 82 82 86 87 87
Average Score 77 77 79 76 80 76 79 79 81 78
BEST IN CLASS 83 83 86 81 87 82 82 86 87 87
The cleanliness of the outside of the train
3.2 High Speed Long Distance Services 3 Note: The best in class is marked by a and is calculated by looking at the percentage satisfied by TOC to 3 decimal places. Percentages in the table however are rounded to 0 decimal places.
Spring 2010
Spring 2011
Autumn 2010
Autumn 2009
Autumn 2012
Spring 2013
Spring 2012
Autumn 2011
Spring 2009
Autumn 2008
74 3.2 High Speed Long Distance Services Non-franchised Train Operating Companies are excluded

CrossCountry 62 67 64 64 66 66 63 67 64 63
East Coast 64 63 67 68 67 68 70 72 72 71
East Midlands Trains 53 54 56 62 66 65 68 67 62 64
First TransPennine Express 59 67 68 66 66 64 64 67 66 69
Virgin Trains 66 66 70 69 70 68 68 70 68 71
Average Score 61 64 64 66 67 66 66 68 66 67
BEST IN CLASS 66 67 70 69 70 68 70 72 72 71
The availability of staff on the train
3.2 High Speed Long Distance Services 3 Note: The best in class is marked by a and is calculated by looking at the percentage satisfied by TOC to 3 decimal places. Percentages in the table however are rounded to 0 decimal places.
Spring 2010
Spring 2011
Autumn 2010
Autumn 2009
Autumn 2012
Spring 2013
Spring 2012
Autumn 2011
Spring 2009
Autumn 2008
75 3.2 High Speed Long Distance Services Non-franchised Train Operating Companies are excluded

CrossCountry 48 52 41 53 49 49 46 52 51 51
East Coast 61 62 56 61 62 52 56 63 69 62
East Midlands Trains 43 37 41 51 41 48 39 51 56 58
First TransPennine Express 39 38 42 46 52 48 53 55 49 53
Virgin Trains 50 54 54 51 57 56 55 54 60 64
Average Score 48 50 46 52 52 51 50 55 56 57
BEST IN CLASS 61 62 56 61 62 56 56 63 69 64
How well train company dealt with delays
3.2 High Speed Long Distance Services 3 Note: The best in class is marked by a and is calculated by looking at the percentage satisfied by TOC to 3 decimal places. Percentages in the table however are rounded to 0 decimal places.
Spring 2010
Spring 2011
Autumn 2010
Autumn 2009
Autumn 2012
Spring 2013
Spring 2012
Autumn 2011
Spring 2009
Autumn 2008
76 3.2 High Speed Long Distance Services Non-franchised Train Operating Companies are excluded

Arriva Trains Wales 86 87 86 88 87 87 84 88 88 88
Merseyrail 90 91 91 93 93 91 93 96 92 92
Northern Rail 82 80 82 82 82 83 83 80 80 76
ScotRail 90 89 90 90 86 86 89 89 90 90
Average Score 86 86 87 88 86 86 87 86 86 84
BEST IN CLASS 90 91 91 93 93 91 93 96 92 92
Overall satisfaction with journey
4.1 Regional Services 4 Note: The best in class is marked by a and is calculated by looking at the percentage satisfied by TOC to 3 decimal places. Percentages in the table however are rounded to 0 decimal places.
Spring 2010
Spring 2011
Autumn 2010
Autumn 2009
Autumn 2012
Spring 2013
Spring 2012
Autumn 2011
Spring 2009
Autumn 2008
77 4.1 Regional Services Non-franchised Train Operating Companies are excluded
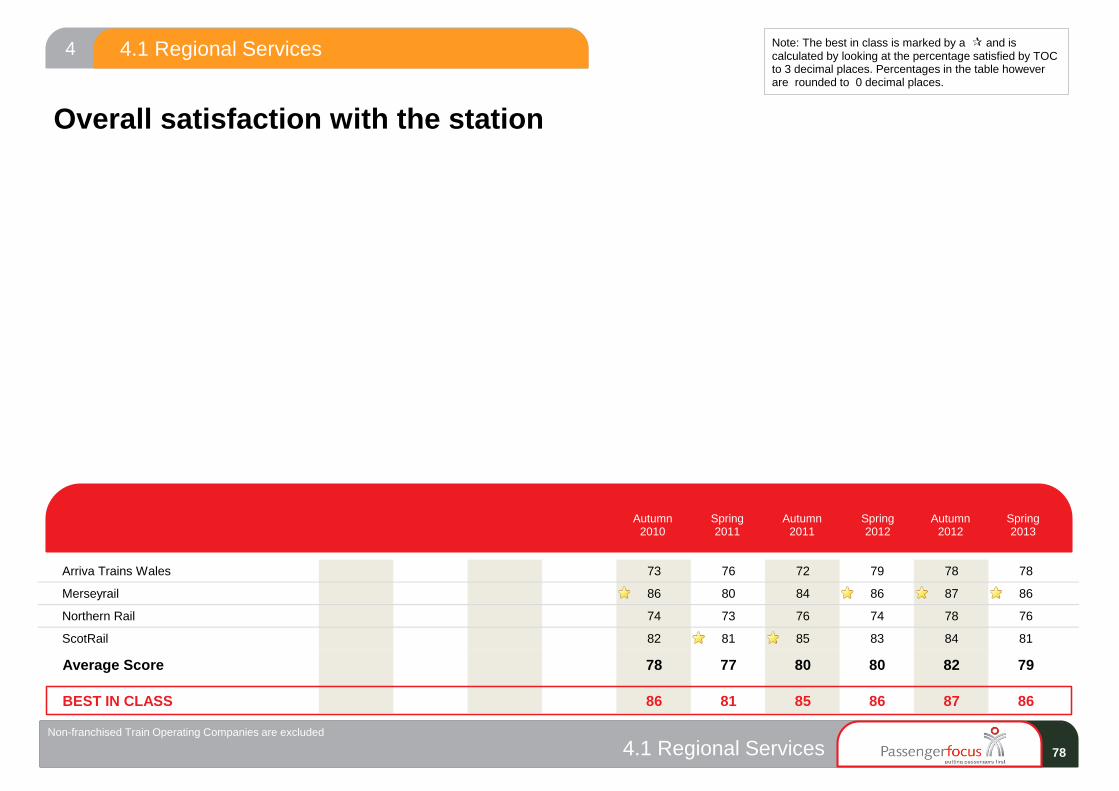
Arriva Trains Wales 73 76 72 79 78 78
Merseyrail 86 80 84 86 87 86
Northern Rail 74 73 76 74 78 76
ScotRail 82 81 85 83 84 81
Average Score 78 77 80 80 82 79
BEST IN CLASS 86 81 85 86 87 86
Overall satisfaction with the station
4.1 Regional Services 4 Note: The best in class is marked by a and is calculated by looking at the percentage satisfied by TOC to 3 decimal places. Percentages in the table however are rounded to 0 decimal places.
Spring 2011
Autumn 2010
Autumn 2012
Spring 2013
Spring 2012
Autumn 2011
78 4.1 Regional Services Non-franchised Train Operating Companies are excluded

Arriva Trains Wales 61 71 76 70 76 75 80 75 81 78
Merseyrail 81 82 78 84 86 86 90 90 89 89
Northern Rail 76 77 75 74 74 73 73 74 78 77
ScotRail 87 83 83 84 79 78 82 80 84 80
Average Score 80 80 79 79 78 77 80 79 82 80
BEST IN CLASS 87 83 83 84 86 86 90 90 89 89
Ticket buying facilities
4.1 Regional Services 4 Note: The best in class is marked by a and is calculated by looking at the percentage satisfied by TOC to 3 decimal places. Percentages in the table however are rounded to 0 decimal places.
Spring 2010
Spring 2011
Autumn 2010
Autumn 2009
Autumn 2012
Spring 2013
Spring 2012
Autumn 2011
Spring 2009
Autumn 2008
79 4.1 Regional Services Non-franchised Train Operating Companies are excluded

Arriva Trains Wales 74 80 80 79 78 79 80 81 81 83
Merseyrail 79 84 86 87 89 85 87 89 88 91
Northern Rail 79 78 83 81 80 77 81 80 83 84
ScotRail 84 84 86 84 86 85 86 86 89 88
Average Score 80 81 84 83 83 81 83 84 86 86
BEST IN CLASS 84 84 86 87 89 85 87 89 89 91
Provision of information about train times/platforms
4.1 Regional Services 4 Note: The best in class is marked by a and is calculated by looking at the percentage satisfied by TOC to 3 decimal places. Percentages in the table however are rounded to 0 decimal places.
Spring 2010
Spring 2011
Autumn 2010
Autumn 2009
Autumn 2012
Spring 2013
Spring 2012
Autumn 2011
Spring 2009
Autumn 2008
80 4.1 Regional Services Non-franchised Train Operating Companies are excluded

Arriva Trains Wales 56 58 60 57 64 63 63 66 66 69
Merseyrail 63 68 73 71 75 72 70 75 81 85
Northern Rail 68 68 70 68 69 68 69 71 75 76
ScotRail 79 80 80 78 82 77 78 77 80 79
Average Score 70 72 73 71 74 71 71 73 77 78
BEST IN CLASS 79 80 80 78 82 77 78 77 81 85
The upkeep/repair of the station buildings/platforms
4.1 Regional Services 4 Note: The best in class is marked by a and is calculated by looking at the percentage satisfied by TOC to 3 decimal places. Percentages in the table however are rounded to 0 decimal places.
Spring 2010
Spring 2011
Autumn 2010
Autumn 2009
Autumn 2012
Spring 2013
Spring 2012
Autumn 2011
Spring 2009
Autumn 2008
81 4.1 Regional Services Non-franchised Train Operating Companies are excluded

Arriva Trains Wales 58 62 65 62 67 68 63 68 68 70
Merseyrail 67 69 72 77 78 77 78 77 86 84
Northern Rail 70 71 74 68 73 70 71 72 80 78
ScotRail 80 83 84 82 86 81 84 82 81 83
Average Score 72 74 76 74 77 74 76 76 80 80
BEST IN CLASS 80 83 84 82 86 81 84 82 86 84
Cleanliness of the station
4.1 Regional Services 4 Note: The best in class is marked by a and is calculated by looking at the percentage satisfied by TOC to 3 decimal places. Percentages in the table however are rounded to 0 decimal places.
Spring 2010
Spring 2011
Autumn 2010
Autumn 2009
Autumn 2012
Spring 2013
Spring 2012
Autumn 2011
Spring 2009
Autumn 2008
82 4.1 Regional Services Non-franchised Train Operating Companies are excluded

Arriva Trains Wales 36 39 44 39 42 43 43 48 49 51
Merseyrail 43 39 43 55 48 43 48 53 62 57
Northern Rail 52 49 53 46 47 50 49 49 52 52
ScotRail 56 58 54 58 58 53 56 52 53 48
Average Score 51 50 51 52 50 49 51 50 54 51
BEST IN CLASS 56 58 54 58 58 53 56 53 62 57
The facilities and services at the station
4.1 Regional Services 4 Note: The best in class is marked by a and is calculated by looking at the percentage satisfied by TOC to 3 decimal places. Percentages in the table however are rounded to 0 decimal places.
Spring 2010
Spring 2011
Autumn 2010
Autumn 2009
Autumn 2012
Spring 2013
Spring 2012
Autumn 2011
Spring 2009
Autumn 2008
83 4.1 Regional Services Non-franchised Train Operating Companies are excluded
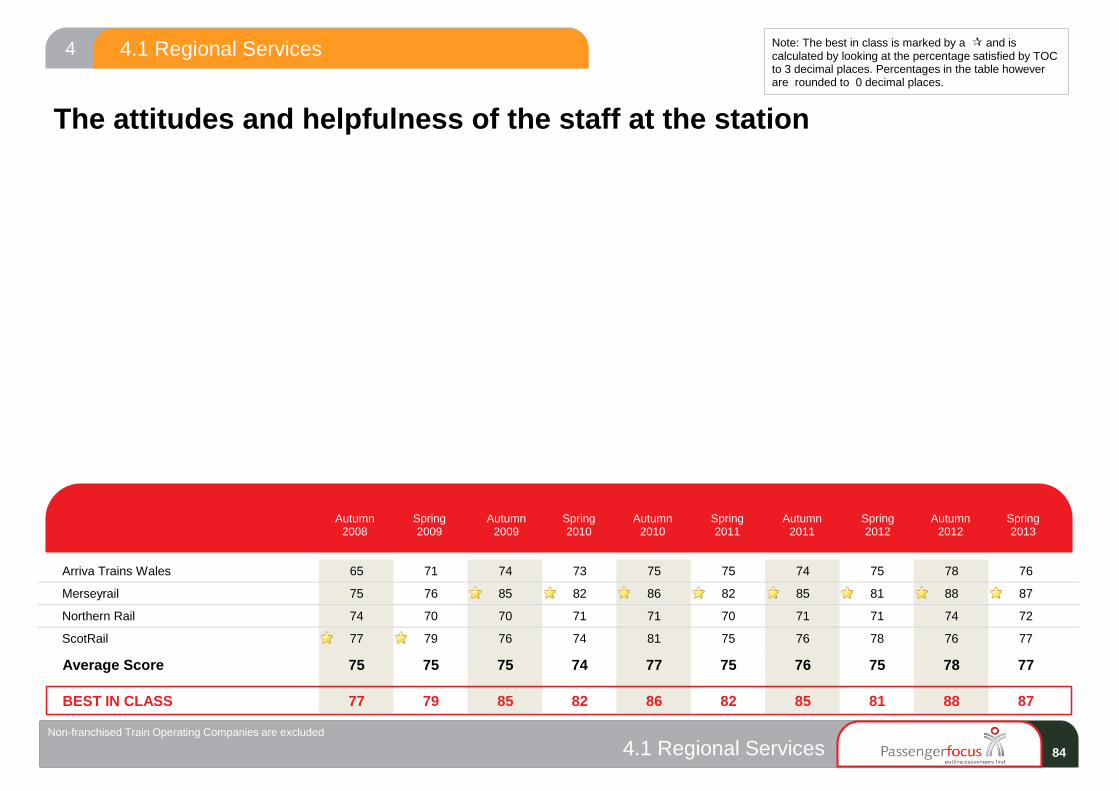
Arriva Trains Wales 65 71 74 73 75 75 74 75 78 76
Merseyrail 75 76 85 82 86 82 85 81 88 87
Northern Rail 74 70 70 71 71 70 71 71 74 72
ScotRail 77 79 76 74 81 75 76 78 76 77
Average Score 75 75 75 74 77 75 76 75 78 77
BEST IN CLASS 77 79 85 82 86 82 85 81 88 87
The attitudes and helpfulness of the staff at the station
4.1 Regional Services 4 Note: The best in class is marked by a and is calculated by looking at the percentage satisfied by TOC to 3 decimal places. Percentages in the table however are rounded to 0 decimal places.
Spring 2010
Spring 2011
Autumn 2010
Autumn 2009
Autumn 2012
Spring 2013
Spring 2012
Autumn 2011
Spring 2009
Autumn 2008
84 4.1 Regional Services Non-franchised Train Operating Companies are excluded

Arriva Trains Wales 58 62 63 64 64 61 61 66 70 66
Merseyrail 66 67 73 75 77 70 70 73 82 83
Northern Rail 69 71 70 65 66 69 69 65 75 71
ScotRail 70 68 71 71 71 65 73 69 67 76
Average Score 68 68 70 69 69 67 70 68 73 74
BEST IN CLASS 70 71 73 75 77 70 73 73 82 83
Connections with other forms of public transport from the station
4.1 Regional Services 4 Note: The best in class is marked by a and is calculated by looking at the percentage satisfied by TOC to 3 decimal places. Percentages in the table however are rounded to 0 decimal places.
Spring 2010
Spring 2011
Autumn 2010
Autumn 2009
Autumn 2012
Spring 2013
Spring 2012
Autumn 2011
Spring 2009
Autumn 2008
85 4.1 Regional Services Non-franchised Train Operating Companies are excluded

Arriva Trains Wales 58 53 63 61 58 63 59 63 69 62
Merseyrail 57 54 56 57 45 48 51 49 64 61
Northern Rail 48 50 53 49 53 57 60 53 57 55
ScotRail 46 47 44 47 49 46 48 47 37 40
Average Score 50 50 51 50 51 53 55 52 54 52
BEST IN CLASS 58 54 63 61 58 63 60 63 69 62
Facilities for car parking
4.1 Regional Services 4 Note: The best in class is marked by a and is calculated by looking at the percentage satisfied by TOC to 3 decimal places. Percentages in the table however are rounded to 0 decimal places.
Spring 2010
Spring 2011
Autumn 2010
Autumn 2009
Autumn 2012
Spring 2013
Spring 2012
Autumn 2011
Spring 2009
Autumn 2008
86 4.1 Regional Services Non-franchised Train Operating Companies are excluded

Arriva Trains Wales 57 58 62 58 61 62 63 66 66 68
Merseyrail 65 66 72 70 76 73 73 77 83 79
Northern Rail 67 67 70 65 66 65 66 67 73 70
ScotRail 76 79 77 75 79 74 78 75 76 74
Average Score 69 70 72 69 71 69 71 71 75 73
BEST IN CLASS 76 79 77 75 79 74 78 77 83 79
Overall environment of the station
4.1 Regional Services 4 Note: The best in class is marked by a and is calculated by looking at the percentage satisfied by TOC to 3 decimal places. Percentages in the table however are rounded to 0 decimal places.
Spring 2010
Spring 2011
Autumn 2010
Autumn 2009
Autumn 2012
Spring 2013
Spring 2012
Autumn 2011
Spring 2009
Autumn 2008
87 4.1 Regional Services Non-franchised Train Operating Companies are excluded

Arriva Trains Wales 55 59 63 63 60 62 67 67 66 70
Merseyrail 66 70 68 72 69 71 72 76 81 76
Northern Rail 66 64 66 62 60 64 65 67 70 66
ScotRail 69 75 73 72 74 71 71 74 71 73
Average Score 66 68 69 67 66 67 68 71 72 70
BEST IN CLASS 69 75 73 72 74 71 72 76 81 76
Your personal security whilst using the station
4.1 Regional Services 4 Note: The best in class is marked by a and is calculated by looking at the percentage satisfied by TOC to 3 decimal places. Percentages in the table however are rounded to 0 decimal places.
Spring 2010
Spring 2011
Autumn 2010
Autumn 2009
Autumn 2012
Spring 2013
Spring 2012
Autumn 2011
Spring 2009
Autumn 2008
88 4.1 Regional Services Non-franchised Train Operating Companies are excluded

Arriva Trains Wales 46 54 57 54 57 56 58 57 60 65
Merseyrail 68 67 74 75 78 78 78 81 82 81
Northern Rail 60 58 61 57 59 58 57 61 58 58
ScotRail 69 69 68 65 63 63 63 66 63 70
Average Score 63 63 66 62 63 63 63 66 64 66
BEST IN CLASS 69 69 74 75 78 78 78 81 82 81
The availability of staff at the station
4.1 Regional Services 4 Note: The best in class is marked by a and is calculated by looking at the percentage satisfied by TOC to 3 decimal places. Percentages in the table however are rounded to 0 decimal places.
Spring 2010
Spring 2011
Autumn 2010
Autumn 2009
Autumn 2012
Spring 2013
Spring 2012
Autumn 2011
Spring 2009
Autumn 2008
89 4.1 Regional Services Non-franchised Train Operating Companies are excluded

Arriva Trains Wales 72 70
Merseyrail 84 78
Northern Rail 70 69
ScotRail 82 74
Average Score 76 72
BEST IN CLASS 84 78
The provision of shelter facilities
4.1 Regional Services 4 Note: The best in class is marked by a and is calculated by looking at the percentage satisfied by TOC to 3 decimal places. Percentages in the table however are rounded to 0 decimal places.
Autumn 2012
Spring 2013
90 4.1 Regional Services Non-franchised Train Operating Companies are excluded

Arriva Trains Wales 55 54
Merseyrail 68 69
Northern Rail 55 54
ScotRail 61 60
Average Score 59 59
BEST IN CLASS 68 69
Availability of seating
4.1 Regional Services 4 Note: The best in class is marked by a and is calculated by looking at the percentage satisfied by TOC to 3 decimal places. Percentages in the table however are rounded to 0 decimal places.
Autumn 2012
Spring 2013
91 4.1 Regional Services Non-franchised Train Operating Companies are excluded

Arriva Trains Wales 83 89 88 84 88 88 90 89 86 92
Merseyrail 91 81 82 81 94 80 90 81 88 93
Northern Rail 83 83 85 86 90 89 89 84 90 84
ScotRail 88 89 83 84 77 86 92 89 91 88
Average Score 86 86 84 84 87 87 90 86 90 88
BEST IN CLASS 91 89 88 86 94 89 92 89 91 93
How request to station staff was handled
4.1 Regional Services 4 Note: The best in class is marked by a and is calculated by looking at the percentage satisfied by TOC to 3 decimal places. Percentages in the table however are rounded to 0 decimal places.
Spring 2010
Spring 2011
Autumn 2010
Autumn 2009
Autumn 2012
Spring 2013
Spring 2012
Autumn 2011
Spring 2009
Autumn 2008
92 4.1 Regional Services Non-franchised Train Operating Companies are excluded
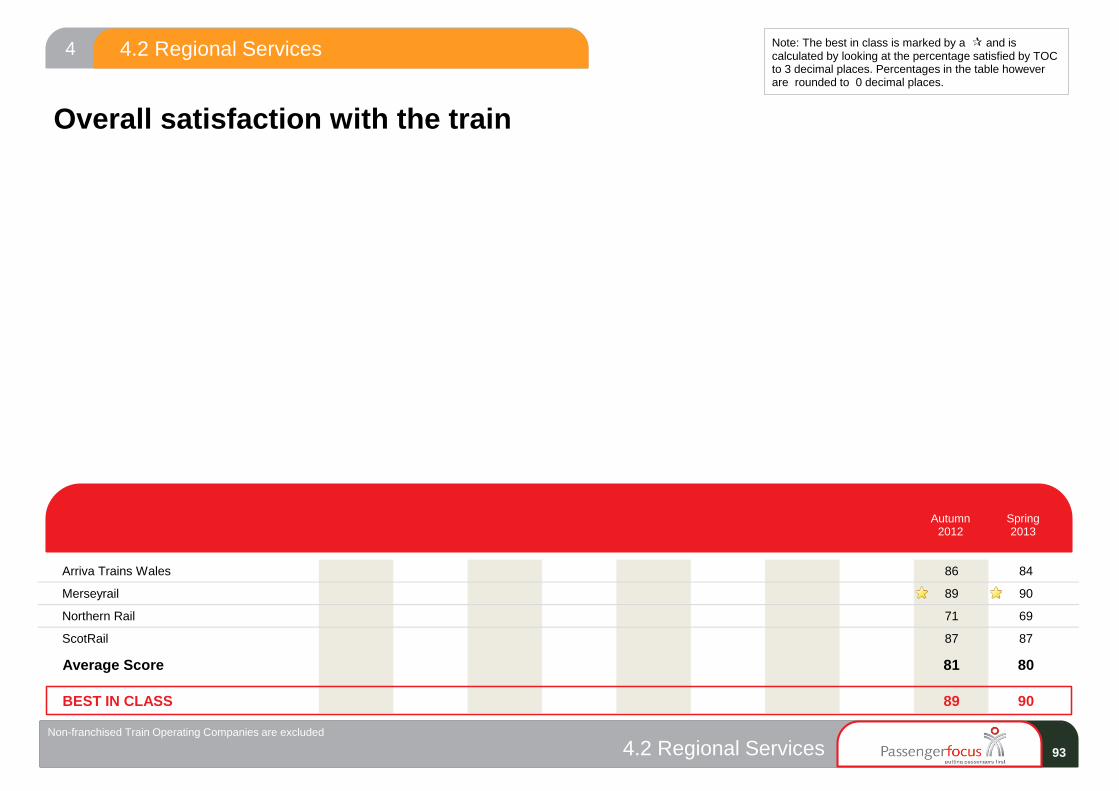
Arriva Trains Wales 86 84
Merseyrail 89 90
Northern Rail 71 69
ScotRail 87 87
Average Score 81 80
BEST IN CLASS 89 90
Overall satisfaction with the train
4.2 Regional Services 4 Note: The best in class is marked by a and is calculated by looking at the percentage satisfied by TOC to 3 decimal places. Percentages in the table however are rounded to 0 decimal places.
Autumn 2012
Spring 2013
93 4.2 Regional Services Non-franchised Train Operating Companies are excluded

Arriva Trains Wales 76 77 79 81 77 81 76 78 77 78
Merseyrail 89 92 94 94 95 91 95 97 94 93
Northern Rail 74 70 74 75 73 71 75 70 73 69
ScotRail 82 84 84 85 79 83 83 84 81 84
Average Score 80 79 81 82 79 80 81 80 79 79
BEST IN CLASS 89 92 94 94 95 91 95 97 94 93
The frequency of the trains on that route
4.2 Regional Services 4 Note: The best in class is marked by a and is calculated by looking at the percentage satisfied by TOC to 3 decimal places. Percentages in the table however are rounded to 0 decimal places.
Spring 2010
Spring 2011
Autumn 2010
Autumn 2009
Autumn 2012
Spring 2013
Spring 2012
Autumn 2011
Spring 2009
Autumn 2008
94 4.2 Regional Services Non-franchised Train Operating Companies are excluded

Arriva Trains Wales 81 85 87 89 85 84 87 87 86 85
Merseyrail 88 94 92 95 90 93 95 94 92 91
Northern Rail 79 79 81 83 80 78 80 78 77 72
ScotRail 90 86 89 88 86 81 86 87 87 84
Average Score 85 85 86 87 84 82 86 85 84 81
BEST IN CLASS 90 94 92 95 90 93 95 94 92 91
Punctuality/reliability (i.e. the train arriving/departing on time)
4.2 Regional Services 4 Note: The best in class is marked by a and is calculated by looking at the percentage satisfied by TOC to 3 decimal places. Percentages in the table however are rounded to 0 decimal places.
Spring 2010
Spring 2011
Autumn 2010
Autumn 2009
Autumn 2012
Spring 2013
Spring 2012
Autumn 2011
Spring 2009
Autumn 2008
95 4.2 Regional Services Non-franchised Train Operating Companies are excluded

Arriva Trains Wales 89 87 88 89 89 88 83 85 86 83
Merseyrail 94 94 94 96 96 94 97 97 96 97
Northern Rail 85 85 87 87 87 86 87 84 85 81
ScotRail 88 89 90 90 87 89 91 89 92 89
Average Score 88 88 90 90 89 88 90 88 89 87
BEST IN CLASS 94 94 94 96 96 94 97 97 96 97
The length of time the journey was scheduled to take (speed)
4.2 Regional Services 4 Note: The best in class is marked by a and is calculated by looking at the percentage satisfied by TOC to 3 decimal places. Percentages in the table however are rounded to 0 decimal places.
Spring 2010
Spring 2011
Autumn 2010
Autumn 2009
Autumn 2012
Spring 2013
Spring 2012
Autumn 2011
Spring 2009
Autumn 2008
96 4.2 Regional Services Non-franchised Train Operating Companies are excluded

Arriva Trains Wales 71 77 74 77 80 78 77 77 80 82
Merseyrail 81 78 87 85 85 82 91 89 89 92
Northern Rail 71 69 74 72 76 78 78 73 73 72
ScotRail 74 78 75 78 80 78 77 79 70 75
Average Score 74 74 77 77 79 79 80 78 76 78
BEST IN CLASS 81 78 87 85 85 82 91 89 89 92
Connections with other train services
4.2 Regional Services 4 Note: The best in class is marked by a and is calculated by looking at the percentage satisfied by TOC to 3 decimal places. Percentages in the table however are rounded to 0 decimal places.
Spring 2010
Spring 2011
Autumn 2010
Autumn 2009
Autumn 2012
Spring 2013
Spring 2012
Autumn 2011
Spring 2009
Autumn 2008
97 4.2 Regional Services Non-franchised Train Operating Companies are excluded

Arriva Trains Wales 61 60 62 66 64 60 59 56 55 54
Merseyrail 71 55 60 66 70 64 66 67 70 65
Northern Rail 62 54 59 60 64 58 60 50 57 54
ScotRail 62 55 58 61 57 56 59 51 52 49
Average Score 63 55 59 62 63 58 61 54 57 53
BEST IN CLASS 71 60 62 66 70 64 66 67 70 65
The value for money for the price of your ticket
4.2 Regional Services 4 Note: The best in class is marked by a and is calculated by looking at the percentage satisfied by TOC to 3 decimal places. Percentages in the table however are rounded to 0 decimal places.
Spring 2010
Spring 2011
Autumn 2010
Autumn 2009
Autumn 2012
Spring 2013
Spring 2012
Autumn 2011
Spring 2009
Autumn 2008
98 4.2 Regional Services Non-franchised Train Operating Companies are excluded

Arriva Trains Wales 76 78 73 75 76 75 75 78 79 78
Merseyrail 79 75 76 76 79 77 78 80 81 79
Northern Rail 58 57 61 59 62 59 62 57 62 60
ScotRail 80 80 82 77 77 79 82 84 83 84
Average Score 71 71 73 70 71 70 73 72 74 73
BEST IN CLASS 80 80 82 77 79 79 82 84 83 84
Cleanliness of the train
4.2 Regional Services 4 Note: The best in class is marked by a and is calculated by looking at the percentage satisfied by TOC to 3 decimal places. Percentages in the table however are rounded to 0 decimal places.
Spring 2010
Spring 2011
Autumn 2010
Autumn 2009
Autumn 2012
Spring 2013
Spring 2012
Autumn 2011
Spring 2009
Autumn 2008
99 4.2 Regional Services Non-franchised Train Operating Companies are excluded

Arriva Trains Wales 73 75 70 73 76 74 75 76 79 79
Merseyrail 83 80 80 78 84 80 80 83 80 81
Northern Rail 55 53 58 56 59 53 57 54 57 55
ScotRail 81 79 80 76 78 79 81 83 81 83
Average Score 71 69 71 69 71 68 71 70 71 71
BEST IN CLASS 83 80 80 78 84 80 81 83 81 83
Upkeep and repair of the train
4.2 Regional Services 4 Note: The best in class is marked by a and is calculated by looking at the percentage satisfied by TOC to 3 decimal places. Percentages in the table however are rounded to 0 decimal places.
Spring 2010
Spring 2011
Autumn 2010
Autumn 2009
Autumn 2012
Spring 2013
Spring 2012
Autumn 2011
Spring 2009
Autumn 2008
100 4.2 Regional Services Non-franchised Train Operating Companies are excluded

Arriva Trains Wales 61 65 63 69 67 67 65 66 66 66
Merseyrail 84 81 86 87 86 87 81 86 90 87
Northern Rail 54 57 59 58 57 59 58 56 60 59
ScotRail 76 77 78 75 77 72 76 80 74 77
Average Score 69 69 71 70 69 69 69 70 71 71
BEST IN CLASS 84 81 86 87 86 87 81 86 90 87
The provision of information during the journey
4.2 Regional Services 4 Note: The best in class is marked by a and is calculated by looking at the percentage satisfied by TOC to 3 decimal places. Percentages in the table however are rounded to 0 decimal places.
Spring 2010
Spring 2011
Autumn 2010
Autumn 2009
Autumn 2012
Spring 2013
Spring 2012
Autumn 2011
Spring 2009
Autumn 2008
101 4.2 Regional Services Non-franchised Train Operating Companies are excluded

Arriva Trains Wales 76 79 75 82 82 79 79 81 82 82
Merseyrail 53 49 56 67 63 67 68 67 63 67
Northern Rail 73 70 72 72 73 76 72 71 71 73
ScotRail 75 79 83 77 81 79 79 81 79 76
Average Score 72 72 75 75 75 76 75 75 75 74
BEST IN CLASS 76 79 83 82 82 79 79 81 82 82
The helpfulness and attitude of staff on train
4.2 Regional Services 4 Note: The best in class is marked by a and is calculated by looking at the percentage satisfied by TOC to 3 decimal places. Percentages in the table however are rounded to 0 decimal places.
Spring 2010
Spring 2011
Autumn 2010
Autumn 2009
Autumn 2012
Spring 2013
Spring 2012
Autumn 2011
Spring 2009
Autumn 2008
102 4.2 Regional Services Non-franchised Train Operating Companies are excluded

Arriva Trains Wales 61 63 56 61 64 57 60 59 66 63
Merseyrail 52 49 57 64 68 60 59 60 59 61
Northern Rail 56 55 54 55 55 55 56 57 57 56
ScotRail 62 64 63 65 63 63 65 69 65 65
Average Score 58 59 58 61 61 59 60 62 61 60
BEST IN CLASS 62 64 63 65 68 63 65 69 66 65
The space for luggage on the train
4.2 Regional Services 4 Note: The best in class is marked by a and is calculated by looking at the percentage satisfied by TOC to 3 decimal places. Percentages in the table however are rounded to 0 decimal places.
Spring 2010
Spring 2011
Autumn 2010
Autumn 2009
Autumn 2012
Spring 2013
Spring 2012
Autumn 2011
Spring 2009
Autumn 2008
103 4.2 Regional Services Non-franchised Train Operating Companies are excluded

Arriva Trains Wales 47 44 42 49 46 45 46 49 51 55
Merseyrail 19 12 20 19 17 9 14 10 21 17
Northern Rail 36 32 41 35 41 38 43 34 39 31
ScotRail 45 48 46 50 40 41 51 52 49 46
Average Score 39 38 40 41 39 36 42 39 42 38
BEST IN CLASS 47 48 46 50 46 45 51 52 51 55
The toilet facilities on the train
4.2 Regional Services 4 Note: The best in class is marked by a and is calculated by looking at the percentage satisfied by TOC to 3 decimal places. Percentages in the table however are rounded to 0 decimal places.
Spring 2010
Spring 2011
Autumn 2010
Autumn 2009
Autumn 2012
Spring 2013
Spring 2012
Autumn 2011
Spring 2009
Autumn 2008
104 4.2 Regional Services Non-franchised Train Operating Companies are excluded

Arriva Trains Wales 74 76 71 73 74 70 72 71 73 73
Merseyrail 72 72 76 78 82 79 78 81 80 79
Northern Rail 69 69 67 70 68 65 65 66 71 66
ScotRail 73 76 77 78 72 69 77 77 79 80
Average Score 72 73 73 75 72 69 72 73 75 73
BEST IN CLASS 74 76 77 78 82 79 78 81 80 80
Sufficient room for all passengers to sit/stand on the train
4.2 Regional Services 4 Note: The best in class is marked by a and is calculated by looking at the percentage satisfied by TOC to 3 decimal places. Percentages in the table however are rounded to 0 decimal places.
Spring 2010
Spring 2011
Autumn 2010
Autumn 2009
Autumn 2012
Spring 2013
Spring 2012
Autumn 2011
Spring 2009
Autumn 2008
105 4.2 Regional Services Non-franchised Train Operating Companies are excluded

Arriva Trains Wales 74 77 72 76 74 74 76 77 76 78
Merseyrail 80 79 79 80 82 76 76 81 80 81
Northern Rail 62 60 64 63 64 58 62 60 65 62
ScotRail 77 78 81 77 75 77 82 80 82 78
Average Score 71 71 74 72 72 69 72 72 74 72
BEST IN CLASS 80 79 81 80 82 77 82 81 82 81
The comfort of the seating area on the train
4.2 Regional Services 4 Note: The best in class is marked by a and is calculated by looking at the percentage satisfied by TOC to 3 decimal places. Percentages in the table however are rounded to 0 decimal places.
Spring 2010
Spring 2011
Autumn 2010
Autumn 2009
Autumn 2012
Spring 2013
Spring 2012
Autumn 2011
Spring 2009
Autumn 2008
106 4.2 Regional Services Non-franchised Train Operating Companies are excluded

Arriva Trains Wales 83 83 82 81 82 84 83 82 84 85
Merseyrail 86 86 88 90 90 86 87 90 90 90
Northern Rail 80 77 79 80 77 78 78 77 81 77
ScotRail 85 88 89 88 84 86 89 87 88 85
Average Score 83 83 84 84 82 82 83 83 85 83
BEST IN CLASS 86 88 89 90 90 86 89 90 90 90
The ease of being able to get on and off the train
4.2 Regional Services 4 Note: The best in class is marked by a and is calculated by looking at the percentage satisfied by TOC to 3 decimal places. Percentages in the table however are rounded to 0 decimal places.
Spring 2010
Spring 2011
Autumn 2010
Autumn 2009
Autumn 2012
Spring 2013
Spring 2012
Autumn 2011
Spring 2009
Autumn 2008
107 4.2 Regional Services Non-franchised Train Operating Companies are excluded

Arriva Trains Wales 77 79 79 79 82 82 82 83 81 86
Merseyrail 73 74 75 77 79 79 77 80 83 78
Northern Rail 77 74 75 76 75 76 79 76 79 73
ScotRail 82 86 82 84 82 83 86 87 80 83
Average Score 78 79 78 79 78 79 81 81 80 79
BEST IN CLASS 82 86 82 84 82 83 86 87 83 86
Your personal security whilst on board the train
4.2 Regional Services 4 Note: The best in class is marked by a and is calculated by looking at the percentage satisfied by TOC to 3 decimal places. Percentages in the table however are rounded to 0 decimal places.
Spring 2010
Spring 2011
Autumn 2010
Autumn 2009
Autumn 2012
Spring 2013
Spring 2012
Autumn 2011
Spring 2009
Autumn 2008
108 4.2 Regional Services Non-franchised Train Operating Companies are excluded

Arriva Trains Wales 72 78 74 75 78 76 75 78 80 78
Merseyrail 78 75 77 76 78 78 79 80 80 81
Northern Rail 58 57 61 60 64 56 62 58 63 60
ScotRail 80 80 83 78 76 80 84 84 82 84
Average Score 71 70 73 71 72 70 73 72 74 73
BEST IN CLASS 80 80 83 78 78 80 84 84 82 84
The cleanliness of the inside of the train
4.2 Regional Services 4 Note: The best in class is marked by a and is calculated by looking at the percentage satisfied by TOC to 3 decimal places. Percentages in the table however are rounded to 0 decimal places.
Spring 2010
Spring 2011
Autumn 2010
Autumn 2009
Autumn 2012
Spring 2013
Spring 2012
Autumn 2011
Spring 2009
Autumn 2008
109 4.2 Regional Services Non-franchised Train Operating Companies are excluded

Arriva Trains Wales 70 74 70 66 68 64 69 69 74 70
Merseyrail 68 66 71 65 65 56 71 67 71 70
Northern Rail 58 51 62 49 60 48 62 47 61 49
ScotRail 74 73 76 68 75 70 76 77 81 80
Average Score 67 64 69 60 66 58 69 62 70 65
BEST IN CLASS 74 74 76 68 75 70 76 77 81 80
The cleanliness of the outside of the train
4.2 Regional Services 4 Note: The best in class is marked by a and is calculated by looking at the percentage satisfied by TOC to 3 decimal places. Percentages in the table however are rounded to 0 decimal places.
Spring 2010
Spring 2011
Autumn 2010
Autumn 2009
Autumn 2012
Spring 2013
Spring 2012
Autumn 2011
Spring 2009
Autumn 2008
110 4.2 Regional Services Non-franchised Train Operating Companies are excluded
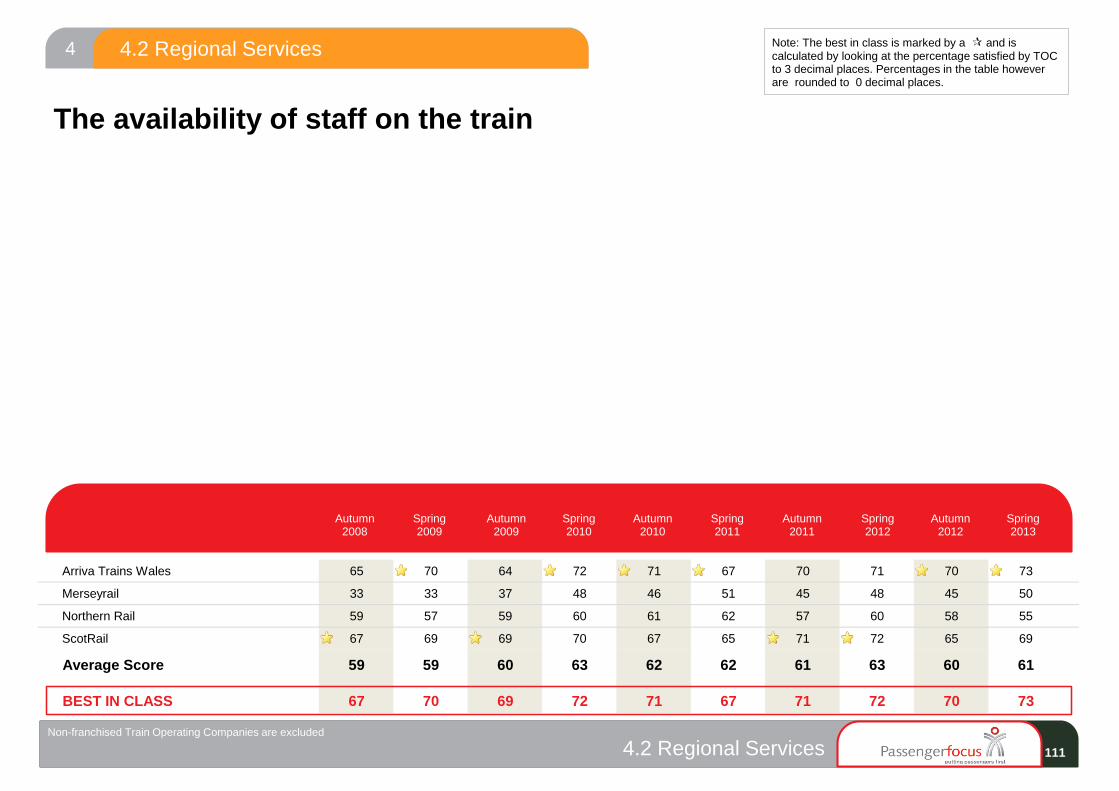
Arriva Trains Wales 65 70 64 72 71 67 70 71 70 73
Merseyrail 33 33 37 48 46 51 45 48 45 50
Northern Rail 59 57 59 60 61 62 57 60 58 55
ScotRail 67 69 69 70 67 65 71 72 65 69
Average Score 59 59 60 63 62 62 61 63 60 61
BEST IN CLASS 67 70 69 72 71 67 71 72 70 73
The availability of staff on the train
4.2 Regional Services 4 Note: The best in class is marked by a and is calculated by looking at the percentage satisfied by TOC to 3 decimal places. Percentages in the table however are rounded to 0 decimal places.
Spring 2010
Spring 2011
Autumn 2010
Autumn 2009
Autumn 2012
Spring 2013
Spring 2012
Autumn 2011
Spring 2009
Autumn 2008
111 4.2 Regional Services Non-franchised Train Operating Companies are excluded

Arriva Trains Wales 41 44 32 40 37 43 45 40 42 38
Merseyrail 23 35 52 42 47 49 50 29 43 41
Northern Rail 34 35 36 36 45 35 43 33 39 29
ScotRail 42 35 47 40 44 34 34 38 40 43
Average Score 36 36 41 38 44 37 41 35 40 35
BEST IN CLASS 42 44 52 42 47 49 50 40 43 43
How well train company dealt with delays
4.2 Regional Services 4 Note: The best in class is marked by a and is calculated by looking at the percentage satisfied by TOC to 3 decimal places. Percentages in the table however are rounded to 0 decimal places.
Spring 2010
Spring 2011
Autumn 2010
Autumn 2009
Autumn 2012
Spring 2013
Spring 2012
Autumn 2011
Spring 2009
Autumn 2008
112 4.2 Regional Services Non-franchised Train Operating Companies are excluded

Stations report Percentage of passengers satisfied by each main factor for last 10 waves for all stations covered by NPS during that time period.
The following reports are produced each wave:
Full report(formerly called Summary report)
Summary tables for all TOCs (including comparison with one year previously), trend tables for last 10 waves by TOC, trend charts for the main NPS factors, peak vs off-peak analysis for LSE TOCs.
TOC reportsTables and graphs showing results for TOC (including comparisons with one year previously and with relevant sector), trend charts for all factors (including sector and benchmark (if relevant) comparisons), summary profile of passengers surveyed, station sample sizes for TOC and sample composition & weighting.
Stakeholder report(formerly called Consultees report)
Summary national trend charts for all main factors, trend charts by age/journey purpose & gender, summary results for leisure/business passengers & commuters, one page for each factor showing national trend and results for all TOCs, Government Office Region charts for each factor and simple tables for some questions that are not included in the main NPS report.
Best in class report Trend tables showing results for all main factors for all TOCs and building blocks for the last 10 waves.
Multivariate report Multivariate analysis showing drivers of satisfaction and dissatisfaction nationally, by sector and by TOC for latest two NPS waves combined.
Personal security at stations report Percentage of passengers satisfied and dissatisfied with personal security at all stations that were included in the NPS for the last 10 survey waves.
Rankings report Results since wave 10 showing satisfaction score for each TOC by factor, significant changes since one year earlier, national rank and rank in TOC type.
Virtual TOC reports NPS reports for TOCs that used to exist or that are planned to exist in the future (exactly the same format as TOC reports).
Tables report Quite detailed tables for all TOCs showing results for the majority of NPS questions by gender, age, journey purpose, time of week and whether they were a frequent traveller or not.
Building block report Summary results showing satisfaction for all building blocks for all main NPS factors.
PTE reports NPS reports for all PTEs (exactly the same format as TOC reports).
Demographic reports Simple reports for all TOCs showing demographic profile (and answers to other questions).
5.1 Standard reports produced for NPS 5
113 5.1 Standard reports produced for NPS

Rebecca Hunt BDRC Continental Kingsbourne House 229-231 High Holborn London, WC1V 7DA Tel: 020 7490 9148 Email: [email protected]
David Greeno Passenger Focus Fleetbank House 2-6 Salisbury Square London, EC4Y 8JX Tel: 0300 123 0837 Email: [email protected]
Contacts:
Reference: Train Operating Company Best In Class Report
Spring 2013
Passenger Focus is the operating name of the Passengers' Council. This survey was published in
June 2013. © Passenger Focus 2013.