national railroad passenger corporation amtrak fy2010-2014
TRANSCRIPT
National Railroad Passenger Corporation
AMTRAK
FY2010-2014 FIVE YEAR FINANCIAL PLAN
September 23, 2009
1 of 56

This page intentionally left blank.
2 of 56
Table of Contents Introduction............................................................................................................................ 5
Background........................................................................................................................ 5 Amtrak Values ................................................................................................................... 5 Amtrak Mission and Goals ................................................................................................ 6 Funding .............................................................................................................................. 6
Investment and Spending Plans ............................................................................................. 8 Safer ....................................................................................................................................... 9
Safety ............................................................................................................................... 10 Security ............................................................................................................................ 11
Greener................................................................................................................................. 13 Energy Conservation........................................................................................................ 13
1. Buildings & Facilities .......................................................................................... 14 2. Train Diesel Fuel.................................................................................................. 14
Emissions ......................................................................................................................... 15 Additional Greenhouse Gas Reduction Efforts................................................................ 16 Recycling ......................................................................................................................... 17 Electrification................................................................................................................... 17
Healthier............................................................................................................................... 17 State Supported Services.................................................................................................. 18 Reliability......................................................................................................................... 19
1. Infrastructure........................................................................................................ 19 2. Fleet Equipment ................................................................................................... 22 3. IT Modernization Programs................................................................................. 25
Customer Service ................................................................................................................. 29 Accessibility - Americans with Disabilities..................................................................... 29 Reservation Booking and Ticketing Delivery Programs ................................................. 31 Other Programs ................................................................................................................ 33
1. Route Performance Improvement Program ......................................................... 33 2. Station and Facility Improvements ...................................................................... 34 3. On Board Wi-Fi ................................................................................................... 34 4. Amtrak.com Enhancements ................................................................................. 34 5. Additional Train Services .................................................................................... 35
Food & Beverage Services............................................................................................... 36 Financial Performance ......................................................................................................... 37
Key Performance Indicators (KPIs)................................................................................. 38 Development Methodology ............................................................................................. 40 Operating Statement - Key Budget Assumptions ............................................................ 41
Ridership and Ticket Revenue ..................................................................................... 42 Expenses ...................................................................................................................... 45 Fuel, Power and Utilities.............................................................................................. 46 Other ............................................................................................................................ 48
Capital Budget ................................................................................................................. 49 Debt Service and Debt Related Equipment Purchases ........................................................ 50
Principal and Interest ....................................................................................................... 50 Early Buyout Option (EBO) ............................................................................................ 51
3 of 56
Operating Cash Requirements ............................................................................................. 52
Sources and Uses of Cash – Budget Basis....................................................................... 53
Tables and Charts
Chart 1 – Sources for Operating ............................................................................................ 7 Chart 2 - Authorization for Funding ...................................................................................... 8 Table 3 - Economic Recovery Scenarios ............................................................................... 9 Table 4 – Safety Culture Program ....................................................................................... 11 Table 5 – Operating and Capital requirements for Security Needs ..................................... 12 Table 6 - Reduction in Train Diesel Fuel Consumption ...................................................... 15 Table 7 – Engineering Infrastructure Capital Spend Plan ................................................... 21 Table 8 - Equipment Reliability: SOGR & Availability Ratios ......................................... 22 Table 9 – LCPM Replacement Schedule ............................................................................. 25 Table 10 – Fleet Program..................................................................................................... 25 Table 11 - Estimated Operating Expense Savings from SAM initiative ............................. 27 Table 12 - Planned Operating Expense Savings from SAM by Fiscal Year ....................... 27 Table 13 - Technology Spend Plan...................................................................................... 29 Table 14 - ADA Spend Plan ................................................................................................ 31 Table 15 - Results of Call Center Initiatives FY01-FY08 ................................................... 32 Table 16 – Routes in the Performance Improvement Program............................................ 33 Table 17 – Station and Facility Improvements .................................................................... 34 Table 18 – State Services..................................................................................................... 36 Chart 19 - KPI’s before Improvement Initiatives ................................................................ 39 Chart 20 - KPI’s after Improvement Initiatives ................................................................... 39 Table 21 - Metrics by Business Line ................................................................................... 40 Table 22 - Projected Profit and Loss Statement................................................................... 42 Chart 24 – Ticket, Food and Beverage Revenue Trends ($millions) .................................. 45 Chart 25 – Salaries, Wages, Taxes and Benefits ($millions)............................................... 46 Chart 26 – Diesel Fuel ......................................................................................................... 47 Chart 27 – Fuel, Power and Utilities.................................................................................... 48 Table 28 – Summary Capital Funding excluding ARRA Grants ........................................ 49 Table 29 – Summary Capital Program Plan All Sources excluding ARRA........................ 49 Table 30 – ARRA Capital Funding ..................................................................................... 50 Table 31 – Summary of Debt Service & Debt-Related Equipment Purchases ($ Millions) 51 Table 31 – Details on Debt Related Equipment Purchases ($ Millions) ............................. 52 Table 32 – Simple Sources and Uses................................................................................... 53
Appendices Profit and Loss Statement by year by major account Capital Program Projections Net Impact of Improvement Initiatives Summary Metrics Summary Table of Business Line Metrics Projected Cash Operating Profit (Loss) per Passenger Projected Passenger Miles per Core Employee Allocation
4 of 56
Projected Seat Miles per Core Employee Allocation
Introduction
Background The National Railroad Passenger Corporation (Amtrak) is a large, complex enterprise focused on the operation of intercity passenger rail service in the U.S. It operates more than 315 trains per day over 43 routes, carrying an average of 78,500 passengers daily. Amtrak has just fewer than 19,000 employees and had FY 2008 revenues of $2.4 billion, which included intercity passenger service revenues, revenues from related businesses and state capital payments. Despite recent growth, the United States still has one of the lowest intercity rail usages in the developed world. Amtrak is a unique institution. It is not only a company; it is the national provider of a mode of transportation. As the inheritor of a portion of the common carrier obligation of the nation’s railroads, Amtrak has a dual responsibility. It is required to carry every person who wishes to travel and pays the fare, and it is obligated to serve the nation. The latter aspect entails compliance with Federal laws, regulations and mandates as a matter of course, and it also carries the responsibility for supporting the government in moments of disaster or national emergency. In addition to providing the full range of functions and activities required to operate the national passenger rail service system, Amtrak engages in related ancillary businesses that include:
Operating commuter railroads under contract to their agencies Providing infrastructure access to commuter agencies and freight railroads Performing rail services for other rail operators, both commuter agencies and freight
railroads, on a reimbursable basis Managing and leasing of commercial real estate
The Passenger Rail Investment and Improvement Act of 2008 (PRIIA) was passed and signed into law, re-authorizing Amtrak for the next five years. Section 204 of the Act requires that Amtrak submit a five year Operating and Capital financial plan by October 1, 2009. This document is submitted to meet that requirement of the Act. This Five Year Financial Plan is bound by the authorized funding levels as stated in PRIIA; however, our vision extends beyond these constraints. It is a companion document to and provides additional detail for Amtrak’s Strategic Overview within the authorized constraints.
Amtrak Values Our values underpin every aspect of our corporate life. While our strategic goals describe the tasks Amtrak must accomplish if it is to succeed in its mission, our values describe the qualities and character of perspective, priorities, and work each of us must bring to our daily duties.
1. SAFETY: We focus our efforts to reduce the risk of harm for our employees and our Customers in everything that we do.
5 of 56
2. CUSTOMER FOCUS: We continuously strive to understand and exceed our customer expectations.
3. CONTINUOUS IMPROVEMENT: We continuously improve business processes to support our mission and vision.
4. TEAMWORK: We respect and value each other as contributing individuals. We value constructive ideas, and work for common alignment on goals so that teamwork results.
5. EMPLOYEE INVOLVEMENT: Every job well done deserves respect. We take the time for employees to have a say in what and how they do their work.
6. INTEGRITY: We are a trusted partner in all matters. 7. EMPLOYEE DEVELOPMENT: We focus on Human Capital Planning for our future. 8. INNOVATION: We encourage and develop good ideas. 9. GOODWILL: We value humor and perspective. They keep us in balance.
Amtrak Mission and Goals
The Passenger Rail Investment and Improvement Act of 2008 sets national policy for intercity passenger rail and assigns Amtrak a clear mission:
“To provide efficient and effective intercity passenger rail mobility consisting of high-quality service that is trip-time competitive with other intercity travel options.”
Amtrak will have performed this mission if it succeeds in providing intercity passenger rail service that is safer, greener and healthier and better than it has ever been before. This service must not only be an improvement on existing Amtrak service; it must also be significantly better than the service offered by competitors. To this end, Amtrak has identified five areas that collectively encompass the corporation’s objectives. These goals align with and promote the broader “Strategic Transportation Goals” outlined in the Administration’s Vision for High Speed Rail In America and will be discussed in more detail in further sections of this plan:
1. Safer: Operate the safest passenger railroad in America 2. Greener: Increase efficiency, reduce emissions, and make better use of resources 3. Healthier: Improve the condition, durability and wholesomeness of every aspect of the
company 4. Customer Service: Improve the quality and attractiveness of our service for passengers 5. Financial Performance: Improve our bottom line 6. National Needs: Participate and assist with disaster relief and mobilization efforts, and
help advance national policies and plans
Funding
6 of 56
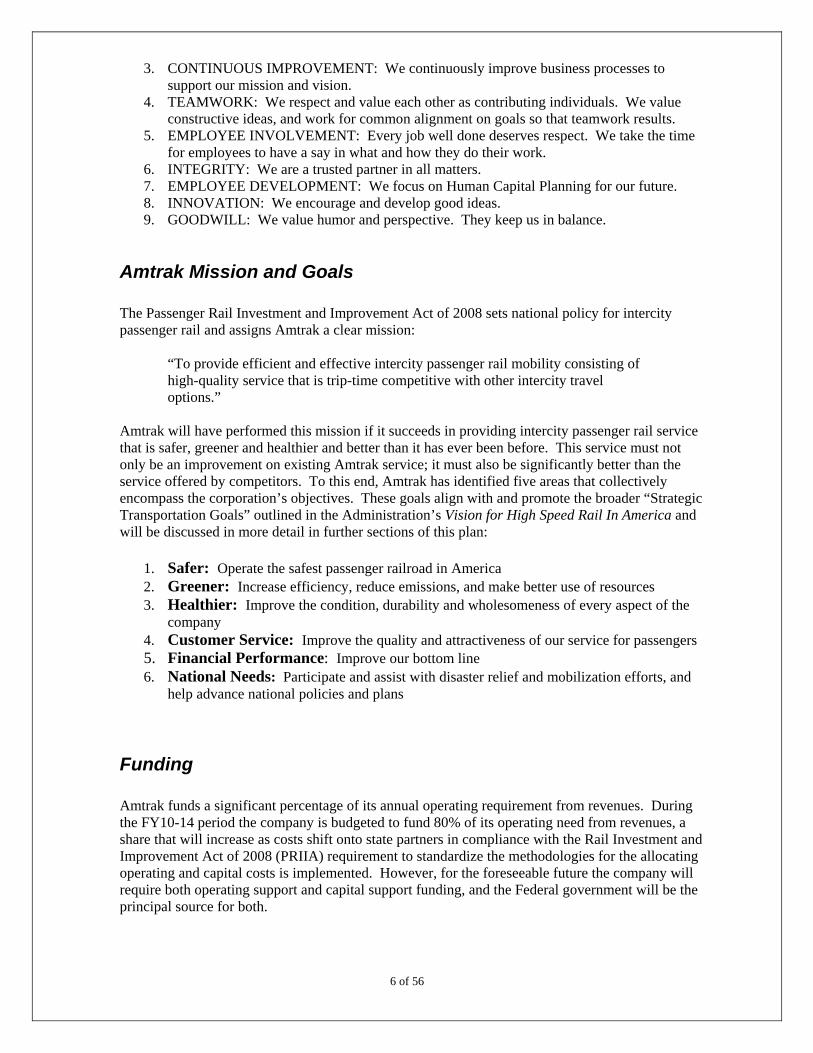
Amtrak funds a significant percentage of its annual operating requirement from revenues. During the FY10-14 period the company is budgeted to fund 80% of its operating need from revenues, a share that will increase as costs shift onto state partners in compliance with the Rail Investment and Improvement Act of 2008 (PRIIA) requirement to standardize the methodologies for the allocating operating and capital costs is implemented. However, for the foreseeable future the company will require both operating support and capital support funding, and the Federal government will be the principal source for both.
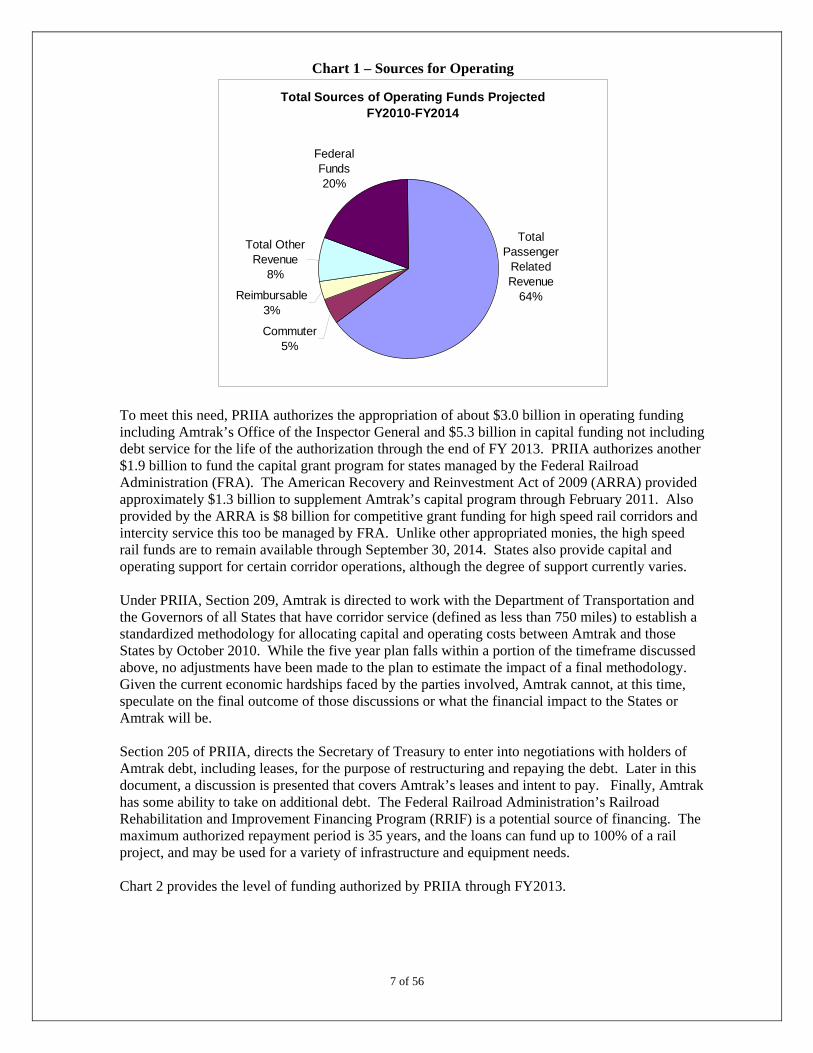
Chart 1 – Sources for Operating
Total Sources of Operating Funds Projected FY2010-FY2014
Commuter5%
Total Other Revenue
8%
Federal Funds20%
Reimbursable3%
Total Passenger
Related Revenue
64%
To meet this need, PRIIA authorizes the appropriation of about $3.0 billion in operating funding including Amtrak’s Office of the Inspector General and $5.3 billion in capital funding not including debt service for the life of the authorization through the end of FY 2013. PRIIA authorizes another $1.9 billion to fund the capital grant program for states managed by the Federal Railroad Administration (FRA). The American Recovery and Reinvestment Act of 2009 (ARRA) provided approximately $1.3 billion to supplement Amtrak’s capital program through February 2011. Also provided by the ARRA is $8 billion for competitive grant funding for high speed rail corridors and intercity service this too be managed by FRA. Unlike other appropriated monies, the high speed rail funds are to remain available through September 30, 2014. States also provide capital and operating support for certain corridor operations, although the degree of support currently varies. Under PRIIA, Section 209, Amtrak is directed to work with the Department of Transportation and the Governors of all States that have corridor service (defined as less than 750 miles) to establish a standardized methodology for allocating capital and operating costs between Amtrak and those States by October 2010. While the five year plan falls within a portion of the timeframe discussed above, no adjustments have been made to the plan to estimate the impact of a final methodology. Given the current economic hardships faced by the parties involved, Amtrak cannot, at this time, speculate on the final outcome of those discussions or what the financial impact to the States or Amtrak will be. Section 205 of PRIIA, directs the Secretary of Treasury to enter into negotiations with holders of Amtrak debt, including leases, for the purpose of restructuring and repaying the debt. Later in this document, a discussion is presented that covers Amtrak’s leases and intent to pay. Finally, Amtrak has some ability to take on additional debt. The Federal Railroad Administration’s Railroad Rehabilitation and Improvement Financing Program (RRIF) is a potential source of financing. The maximum authorized repayment period is 35 years, and the loans can fund up to 100% of a rail project, and may be used for a variety of infrastructure and equipment needs. Chart 2 provides the level of funding authorized by PRIIA through FY2013.
7 of 56
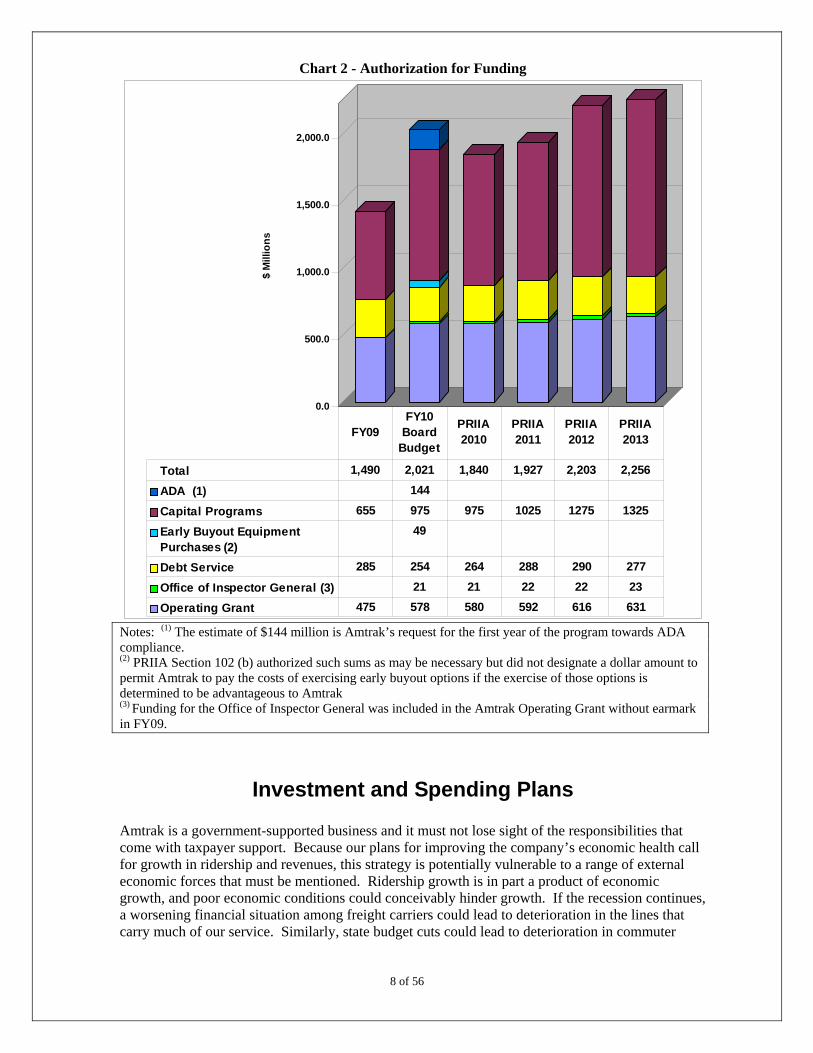
Chart 2 - Authorization for Funding
0.0
500.0
1,000.0
1,500.0
2,000.0
$ M
illio
ns
Total 1,490 2,021 1,840 1,927 2,203 2,256
ADA (1) 144
Capital Programs 655 975 975 1025 1275 1325
Early Buyout EquipmentPurchases (2)
49
Debt Service 285 254 264 288 290 277
Office of Inspector General (3) 21 21 22 22 23
Operating Grant 475 578 580 592 616 631
FY09FY10
Board Budget
PRIIA 2010
PRIIA 2011
PRIIA 2012
PRIIA 2013
Notes: (1) The estimate of $144 million is Amtrak’s request for the first year of the program towards ADA compliance. (2) PRIIA Section 102 (b) authorized such sums as may be necessary but did not designate a dollar amount to permit Amtrak to pay the costs of exercising early buyout options if the exercise of those options is determined to be advantageous to Amtrak (3) Funding for the Office of Inspector General was included in the Amtrak Operating Grant without earmark in FY09.
Investment and Spending Plans
8 of 56
Amtrak is a government-supported business and it must not lose sight of the responsibilities that come with taxpayer support. Because our plans for improving the company’s economic health call for growth in ridership and revenues, this strategy is potentially vulnerable to a range of external economic forces that must be mentioned. Ridership growth is in part a product of economic growth, and poor economic conditions could conceivably hinder growth. If the recession continues, a worsening financial situation among freight carriers could lead to deterioration in the lines that carry much of our service. Similarly, state budget cuts could lead to deterioration in commuter
infrastructure. Even prosperity carries risks, for a boom in freight traffic could lead to difficulties on freight carriers if growing traffic and poor dispatching practices lead to decreases in on-time performance of Amtrak trains. In the aftermath of continuous and significant Amtrak ticket revenue growth from 2003 through 2008 due to the synergy between favorable market conditions, weakened travel competition and improved/expanded Amtrak train services, FY09 Amtrak ticket revenues will fall short of FY08 levels by about 7% due to the FY09 recession, growing unemployment and weakened consumer confidence. All of these factors combined have led to reduced business and leisure travel in FY09. Additionally, continued low FY09 gasoline prices – certainly lower than FY07 and FY08 levels – have diverted some customers back to their cars for many of their trips. Recognizing these risks, Amtrak reviewed three scenarios that depict different levels of expected economic recovery and the potential revenue results. Table 3 shows the revenue levels for each scenario and the resultant federal subsidy required based upon a Net Operating Loss before depreciation, net interest and non-cash Other Post Employment Benefits (OPEBs). The “Plan Case” conservative scenario is the estimate represented throughout this Five Year Plan.
Table 3 - Economic Recovery Scenarios
$millions
FY08 Actual
FY09 Fcst
FY10 Budget
FY11 Plan
FY12 Plan
FY13 Plan
FY14 Plan
Plan Case - Conservative estimate of economic recovery 2,425.5 2,326.4 2,397.3 2,509.0 2,632.8 2,756.0 2,876.6
2,518.2 2,650.8 2,773.3 2,905.32,527.4 2,668.9 2,790.5 2,934.0
Total Operating Expense
Plan Case - All scenarios
3,623.9 3,776.8 3,941.3 4,091.1 4,260.1
Plan Case - Conservative estimate of economic recovery
(394.3) (483.7) (599.2) (611.7) (637.7) (653.9) (692.6)
(602.5) (619.6) (636.7) (663.9)
(593.3) (601.6) (619.5) (635.2)Best Case (Optimistic est. of economic recovery)
Net Operating Loss (before Depreciation, Net Interest and OPEBs)
Best Case (Optimistic est. of economic recovery)
Total Operating Revenue
Mid case
Mid case
Amtrak’s five year investment and spending plan is presented in the following sections that are organized to align with Amtrak’s stated goals.
Safer
9 of 56
Amtrak will maintain and continuously improve safety by applying new technology where warranted, as well as required (e.g., positive train control systems required by PRIIA), and applying a new behavior-based risk reduction safety process throughout the ranks of Amtrak. Safety and security are an inseparable part of our company’s self-image; they define us.
Safety Safe operations are the foundation of economical and effective railroading and provide the basis for the passenger experience. They protect and sustain the men and women who run, repair, and staff our rights of way, structures, and trains. As the nation’s intercity passenger railroad, Amtrak has a responsibility to ensure that it is the safest railroad in the United States, and that our commitment to safety is reflected in our procedures and policies, embraced by employees, and measured by the industry standards for success. Safety is the primary objective of the company. To support that standard, and to make our railroad even safer, in FY10-14 Amtrak is undertaking two revolutionary initiatives in addition to more traditional approaches to railroad safety One is the implementation of a program, named Safe-2-Safer that further strengthens the emphasis on safety within our corporate culture. The other is the implementation of Positive Train Control (PTC) across the Amtrak system. These two initiatives are complementary. The Safe-2-Safer program ensures a higher reliability of safety behaviors at all levels from executives to agreement employees, while positive train control brings the most modern information technologies to the task of controlling and protecting train movements to prevent collisions and other accidents. The Safe-2-Safer program involves detailed examinations of employee culture and performance, and creates and implements effective programs aimed at the enhancement of safety leadership practices and workplace behavior to ensure operating practices are safe and effective. The process incorporates leading and precursor measures to address potential accidents before they occur. This objective is to be reached through training, coaching and greater accountability for management, along with broad employee engagement through peer-to-peer feedback. All management and supervisors will be trained and coached to improve their management and safety leadership skills, and set goals and performance objectives around leading with safety. The process further uses trained employee teams to conduct observations of co-workers doing their jobs. If a team member observes activity that poses a risk for injury, they will coach the employee on safer actions. The success of the program is measured by changes to the injury rate, specifically the reportable injury ratio. In addition, Amtrak is collaborating with its labor partners on other programs focused on reducing the number of operating rule violations which are expected to result in further reductions in the injury ratio in future years. Safe-2-Safer is championed by CEO Joseph Boardman and COO William Crosbie. Underscoring the importance of this effort, Safe-2-Safer will be led directly by Amtrak’s Vice President of Transportation. Commitment to this program is further reflected in both Amtrak’s committed funding and budgeted benefits in FY10-14. Costs include retaining a professional services company to develop the program and train Amtrak personnel, 44 dedicated Amtrak employees to serve as the facilitators and implementers of the program, and an additional 200,000 man-hours of employee participation and training in the first full year of the program with approximately 100,000 man-hours annually thereafter. The projected savings are from reduced employee and passenger injury claims in future years.
10 of 56
Budgeted costs and savings for the next five years are as follows, in millions of dollars. Net savings will continue beyond FY14.
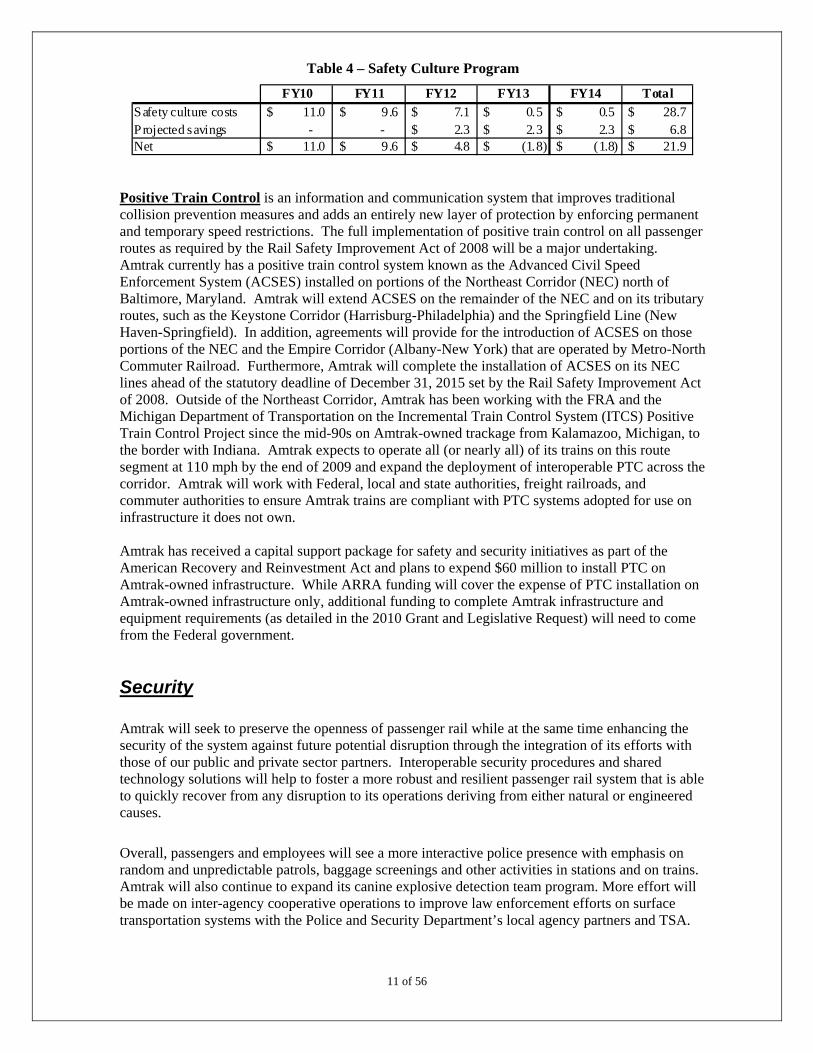
Table 4 – Safety Culture Program
FY10 FY11 FY12 FY13 FY14 Total
Safety culture costs 11.0$ 9.6$ 7.1$ 0.5$ 0.5$ 28.7$ P rojected savings - - 2.3$ 2.3$ 2.3$ 6.8$ Net 11.0$ 9.6$ 4.8$ (1.8)$ (1.8)$ 21.9$
Positive Train Control is an information and communication system that improves traditional collision prevention measures and adds an entirely new layer of protection by enforcing permanent and temporary speed restrictions. The full implementation of positive train control on all passenger routes as required by the Rail Safety Improvement Act of 2008 will be a major undertaking. Amtrak currently has a positive train control system known as the Advanced Civil Speed Enforcement System (ACSES) installed on portions of the Northeast Corridor (NEC) north of Baltimore, Maryland. Amtrak will extend ACSES on the remainder of the NEC and on its tributary routes, such as the Keystone Corridor (Harrisburg-Philadelphia) and the Springfield Line (New Haven-Springfield). In addition, agreements will provide for the introduction of ACSES on those portions of the NEC and the Empire Corridor (Albany-New York) that are operated by Metro-North Commuter Railroad. Furthermore, Amtrak will complete the installation of ACSES on its NEC lines ahead of the statutory deadline of December 31, 2015 set by the Rail Safety Improvement Act of 2008. Outside of the Northeast Corridor, Amtrak has been working with the FRA and the Michigan Department of Transportation on the Incremental Train Control System (ITCS) Positive Train Control Project since the mid-90s on Amtrak-owned trackage from Kalamazoo, Michigan, to the border with Indiana. Amtrak expects to operate all (or nearly all) of its trains on this route segment at 110 mph by the end of 2009 and expand the deployment of interoperable PTC across the corridor. Amtrak will work with Federal, local and state authorities, freight railroads, and commuter authorities to ensure Amtrak trains are compliant with PTC systems adopted for use on infrastructure it does not own. Amtrak has received a capital support package for safety and security initiatives as part of the American Recovery and Reinvestment Act and plans to expend $60 million to install PTC on Amtrak-owned infrastructure. While ARRA funding will cover the expense of PTC installation on Amtrak-owned infrastructure only, additional funding to complete Amtrak infrastructure and equipment requirements (as detailed in the 2010 Grant and Legislative Request) will need to come from the Federal government.
Security Amtrak will seek to preserve the openness of passenger rail while at the same time enhancing the security of the system against future potential disruption through the integration of its efforts with those of our public and private sector partners. Interoperable security procedures and shared technology solutions will help to foster a more robust and resilient passenger rail system that is able to quickly recover from any disruption to its operations deriving from either natural or engineered causes.
11 of 56
Overall, passengers and employees will see a more interactive police presence with emphasis on random and unpredictable patrols, baggage screenings and other activities in stations and on trains. Amtrak will also continue to expand its canine explosive detection team program. More effort will be made on inter-agency cooperative operations to improve law enforcement efforts on surface transportation systems with the Police and Security Department’s local agency partners and TSA.
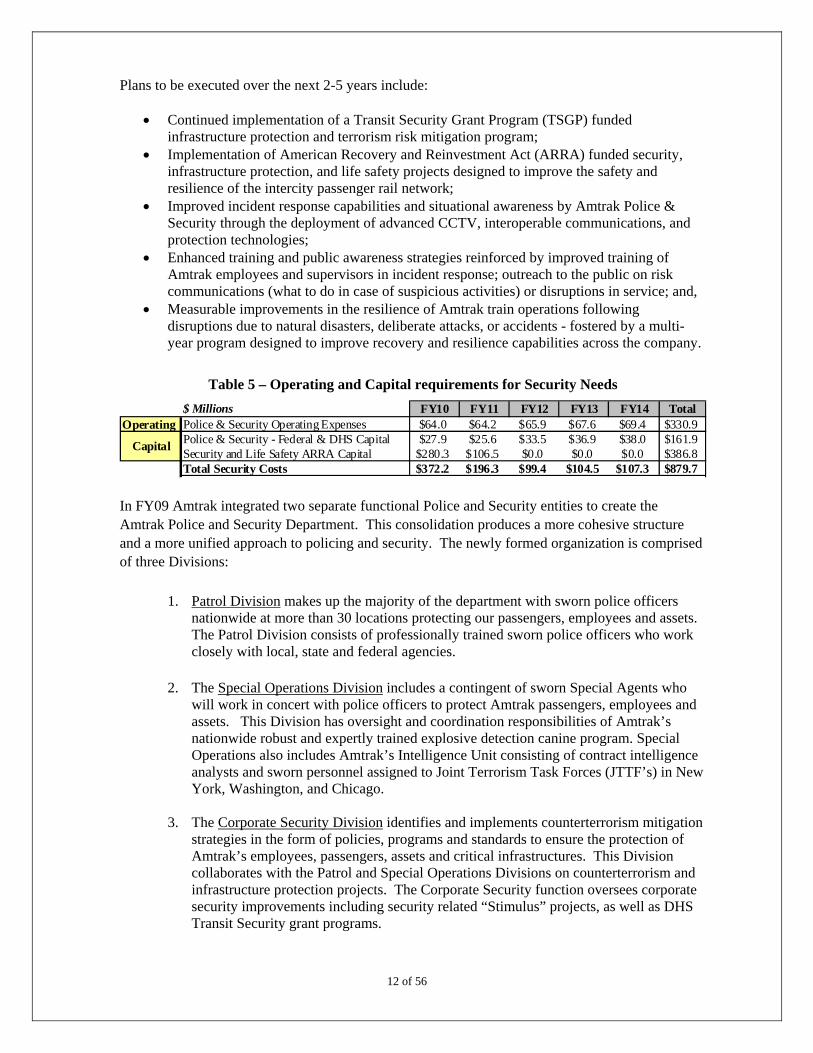
Plans to be executed over the next 2-5 years include:
Continued implementation of a Transit Security Grant Program (TSGP) funded infrastructure protection and terrorism risk mitigation program;
Implementation of American Recovery and Reinvestment Act (ARRA) funded security, infrastructure protection, and life safety projects designed to improve the safety and resilience of the intercity passenger rail network;
Improved incident response capabilities and situational awareness by Amtrak Police & Security through the deployment of advanced CCTV, interoperable communications, and protection technologies;
Enhanced training and public awareness strategies reinforced by improved training of Amtrak employees and supervisors in incident response; outreach to the public on risk communications (what to do in case of suspicious activities) or disruptions in service; and,
Measurable improvements in the resilience of Amtrak train operations following disruptions due to natural disasters, deliberate attacks, or accidents - fostered by a multi-year program designed to improve recovery and resilience capabilities across the company.
Table 5 – Operating and Capital requirements for Security Needs
$ Millions FY10 FY11 FY12 FY13 FY14 TotalOperating Police & Security Operating Expenses $64.0 $64.2 $65.9 $67.6 $69.4 $330.9
Police & Security - Federal & DHS Capital $27.9 $25.6 $33.5 $36.9 $38.0 $161.9Security and Life Safety ARRA Capital $280.3 $106.5 $0.0 $0.0 $0.0 $386.8Total Security Costs $372.2 $196.3 $99.4 $104.5 $107.3 $879.7
Capital
In FY09 Amtrak integrated two separate functional Police and Security entities to create the Amtrak Police and Security Department. This consolidation produces a more cohesive structure and a more unified approach to policing and security. The newly formed organization is comprised of three Divisions:
1. Patrol Division makes up the majority of the department with sworn police officers nationwide at more than 30 locations protecting our passengers, employees and assets. The Patrol Division consists of professionally trained sworn police officers who work closely with local, state and federal agencies.
2. The Special Operations Division includes a contingent of sworn Special Agents who
will work in concert with police officers to protect Amtrak passengers, employees and assets. This Division has oversight and coordination responsibilities of Amtrak’s nationwide robust and expertly trained explosive detection canine program. Special Operations also includes Amtrak’s Intelligence Unit consisting of contract intelligence analysts and sworn personnel assigned to Joint Terrorism Task Forces (JTTF’s) in New York, Washington, and Chicago.
12 of 56
3. The Corporate Security Division identifies and implements counterterrorism mitigation strategies in the form of policies, programs and standards to ensure the protection of Amtrak’s employees, passengers, assets and critical infrastructures. This Division collaborates with the Patrol and Special Operations Divisions on counterterrorism and infrastructure protection projects. The Corporate Security function oversees corporate security improvements including security related “Stimulus” projects, as well as DHS Transit Security grant programs.
The new Police and Security organization will pursue accreditation as awarded by the Commission on Accreditation for Law Enforcement Agencies (CALEA). The accreditation process requires that the Amtrak Police and Security Department be in compliance with over 400 law enforcement standards measuring policies, procedures, management, operations, and support services. The Amtrak Police Department became the first nationally accredited law enforcement agency in 1992 and has since been awarded reaccreditation status on two occasions. External factors risking Safety and Security A number of external factors, outside of the control of the company, could hinder, impede or jeopardize our plans to improve the company’s safety and security record. Some of the more prominent possibilities include:
A successful terrorist attack on passenger rail could change national policy on transportation security
A worsening of the international situation could generate additional threats Freight partners could delay or dispute key portions of the PTC implementation program Funding for PTC is not guaranteed, and could be inadequate A major leap in retirement rates could stress our training system
Greener All of us want to live and work in a greener world. Rail has a smaller carbon footprint than its competitors. Rail uses less land to provide mobility than any other surface competitor. Amtrak is proving that it can draw riders from both air and auto in places like the Northeast Corridor (NEC) and California. Amtrak makes extensive use of the electric grid to propel our trains in the Northeast, helping to make us independent of liquid petroleum and allowing both a more effective and efficient use of scarce energy resources. We will seek opportunities to extend the use of electric propulsion where it makes sense to do so. We recycle, use solar cells, buy more energy efficient locomotives and extend the useful life of our existing fleet where it makes sense to do so. We will encourage a more seamless and connected public transportation system that will allow more people to improve their range of mobility options in a more environmentally benign way by choosing Amtrak for part of their trip.
Energy Conservation Amtrak established a Fuel and Energy Management committee whose goal is to identify efficiencies in the way fuel and utilities are used by Amtrak that will positively impact Amtrak’s overall use of these commodities. Members of this committee proposed a five year energy reduction program at the June 2009 Board meeting. The proposed plan clearly states Amtrak’s commitment to reducing energy usage at all locations across the country and directly aligns with Amtrak’s corporate goal of becoming a Safer, Greener and Healthier company. Following is a summary of the energy conservation and emissions reduction efforts currently underway at Amtrak.
13 of 56
1. Buildings & Facilities Amtrak’s Energy Management staff provides oversight, support, information and analysis of the company’s utility expenditures in an effort to identify specific strategies to reduce energy consumption. In addition to implementing energy conservation initiatives and identifying lower-cost providers of electricity and natural gas, since 2006 the Energy Management team has directed energy audits at a number of Amtrak’s largest maintenance facilities and stations. The top 20 facilities, which generate 80% of the company’s utility costs, were targeted. As of the end of FY09, eight audits have been completed. These audits have identified significant opportunities to reduce energy and water usage and consequently, overall utility expenses:
Several energy savings measures such as replacing inefficient lighting, repairing leaks in underground water, steam, and air pipes, activating or reprogramming automatic control systems for better energy efficiency, resolving billing errors, eliminating unnecessary utility services, and switching to lower cost providers have been enacted. These efforts have saved or avoided $17 million in utility costs.
Capital improvements that have the potential to further reduce consumption by replacing inefficient lighting, HVAC systems, and underground piping systems have been recommended.
Energy conservation awareness has been stressed during site visits, emphasizing behaviors such as turning off unnecessary lights, closing doors, and making efficient use of ground power when locomotives are in a yard.
An energy consultant (Advantage I.Q.) has been retained to perform centralized invoice payment and usage auditing functions for all utility invoices. AIQ is confirming that the proper rates are being billed and paid, identifying opportunities to negotiate better rates, benchmarking energy consumption and identifying opportunities to reduce usage, and performing the budgeting functions.
The FY10 – 14 Plan includes the continuation of energy saving audits and efforts at Amtrak’s building facilities. A number of these strategies will require the use of capital funds. Specifically, the company has budgeted to reduce the usage of comparable utilities by 4% in FY10 as compared to FY09. In dollars, this is a net reduction of $1.7M, after absorbing price inflation. This reduction reflects the benefits of efforts to date, which will be continued and reinforced in the FY10-14 period. Overall utility expenses have grown primarily because of additional consumption at Mechanical facilities for extended operating hours for ARRA activity.
2. Train Diesel Fuel As oil prices skyrocketed during 2008 and the cost of petroleum products reached new heights, the cost of diesel fuel to power the non-electric locomotives posed a significant risk to the company’s financial health. In response, the company formed a cross-functional Fuel and Energy Management committee to recommend strategies for improving the fuel efficiency of the diesel fleet and its support operations. Over the past year the committee has performed extensive work and analysis. The committee has approached the reduction of diesel fuel consumption in the following ways:
1. Reducing the consumption of diesel fuel by the locomotives. Amtrak Transportation implemented improved train handling procedures in order to reduce energy consumption on our diesel and electric locomotive powered trains.
14 of 56
Our energy reduction plan involves the use of simulators and new train handling software to teach locomotive engineers the most optimum method to operate a specific
train on a specific territory. Using the simulators, our locomotive engineers are given prompts (cues) regarding speed and braking to accomplish the most economical way to operate our trains. These prompts are territory (grade, curvature, speed) and train (number of cars/locomotives) dependent. We are also studying the feasibility of equipping our locomotive fleet with onboard software which will update to the most optimum train handling methods as conditions change. This software would function in the same way as the simulators except it will operate in “real-time”. Also, as Positive Train Control (PTC) systems are implemented, we are investigating how to achieve an even greater savings by having the onboard equipment “see what’s ahead” by interfacing with the train dispatching system to predict the most efficient operating practice.
2. Reviewing the fuel procurement and distribution processes to ensure that optimal
fueling sources and locations are utilized, and that fuel purchased is received and properly accounted for.
3. Benchmarking Amtrak’s practices against the major freight railroads to ensure industry
best practices are being employed.
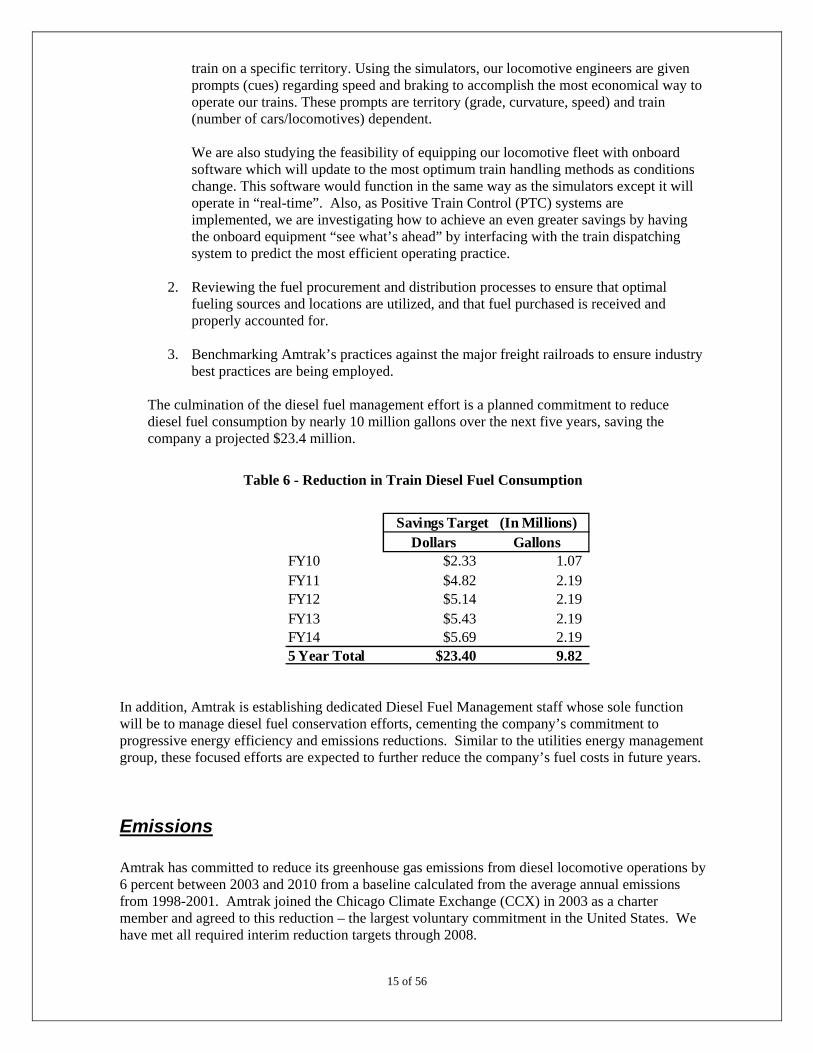
The culmination of the diesel fuel management effort is a planned commitment to reduce diesel fuel consumption by nearly 10 million gallons over the next five years, saving the company a projected $23.4 million.
Table 6 - Reduction in Train Diesel Fuel Consumption
Dollars GallonsFY10 $2.33 1.07FY11 $4.82 2.19FY12 $5.14 2.19FY13 $5.43 2.19FY14 $5.69 2.195 Year Total $23.40 9.82
Savings Target (In Millions)
In addition, Amtrak is establishing dedicated Diesel Fuel Management staff whose sole function will be to manage diesel fuel conservation efforts, cementing the company’s commitment to progressive energy efficiency and emissions reductions. Similar to the utilities energy management group, these focused efforts are expected to further reduce the company’s fuel costs in future years.
Emissions
15 of 56
Amtrak has committed to reduce its greenhouse gas emissions from diesel locomotive operations by 6 percent between 2003 and 2010 from a baseline calculated from the average annual emissions from 1998-2001. Amtrak joined the Chicago Climate Exchange (CCX) in 2003 as a charter member and agreed to this reduction – the largest voluntary commitment in the United States. We have met all required interim reduction targets through 2008.
CCX provides a voluntary exchange for trading greenhouse gas credits (mainly carbon dioxide) using a market-based system. Greenhouse gas credits available for trading by Amtrak are based on diesel fuel use in the 1998-2001 baseline period versus fuel use calculated in each individual year from 2003 to 2010. Fuel use is converted to tons of carbon dioxide released in the combustion of diesel fuel. Amtrak’s 1998-2001 baseline is approximately 800,000 metric tons of carbon dioxide.
Amtrak was successful in reducing its diesel fuel consumption below the target level for 2008. Total carbon dioxide emissions from diesel operations, verified by CCX, were 669,561 tons. The company was able to sell some greenhouse gas credits in 2008.
Diesel emissions were reduced by using:
Anti-idling practices Automatic Start/Stop installation – when ambient temperatures are above
40o F - locomotives shut down Aerodynamic improvements of rolling stock – reducing drag Consist/Locomotive management – reduces number of locomotives in each consist
(trainset) Locomotive upgrades and improved maintenance Locomotive engineer training – fuel saving operational training
For electric locomotive operations, Amtrak has begun implementing regenerative braking. A study has demonstrated that Acela trains return up to eight percent of the electric power used back to the catenary grid when braking. Regenerative braking is being implemented on Amtrak electric locomotives on the Northeast Corridor. Amtrak has also received grants from the Carl Moyer program in California (from the Bay Area Air Quality Management District (AQMD) and the South Coast AQMD) for GenSet Switcher locomotives for Oakland and Los Angeles. The U.S. EPA and State of Illinois have also awarded a grant for a GenSet Switcher for Chicago. When operating in 2010, these three GenSet Switchers (of the 53 in the Amtrak fleet) will reduce their diesel use by 60 percent and emissions by 70 percent.
Amtrak also uses solar power for over 50 lubricators for track curves (provides a grease to reduce friction) along the Northeast Corridor and a solar and wind turbine for signal power in the Chicago Rail Yard. A biodiesel fuel trial, sponsored by the FRA and State of Oklahoma DOT, is underway on the Heartland Flyer (Fort Worth – Oklahoma City).
Additional Greenhouse Gas Reduction Efforts
Carbonfund Amtrak partnered with Carbonfund in 2007 to offer passengers the opportunity to purchase carbon offsets for their travel on Amtrak. Carbonfund is a leading carbon reduction and offset non-profit organization that educates the public about climate issues and makes it easy and affordable for individuals businesses and organizations to reduce their climate impact. Through July 2009, Amtrak passengers have purchased 8,000,000 miles of offsets.
16 of 56
Climate Registry Amtrak recently joined The Climate Registry, a non-profit organization, founded to set consistent and transparent standards for businesses and governments to calculate, verify, and publicly report their greenhouse gas emissions. Over 40 states are members of the Climate Registry. As a member, Amtrak committed to comprehensive reporting standards for recording and managing greenhouse gas emissions throughout its system including those from diesel and electric locomotives, passenger rail cars, maintenance equipment, stations, offices and other facilities. Amtrak intends to use the data generated by this initiative to assess the effectiveness of its various environmental polices, determine what changes might be needed; compare itself with industry peers, and identify new opportunities to reduce emissions. Amtrak is the first railroad to join this registry.
Climate Counts Amtrak is participating in Climate Counts, a non-profit organization which provides an independent and verifiable assessment of a company’s commitment to reduce its impact on the environment and climate change. The group uses 22 specific criteria to produce a scorecard to rate how companies have measured their carbon footprint, reduced their impact on climate change, supported effective climate legislation and publicly disclosed their climate actions in a clear and comprehensive manner. Amtrak intends to use the scorecard to better understand its overall impact on climate change. Amtrak is also the first railroad to join this group.
Recycling Consistent with the company’s environmental stewardship commitments, Amtrak has budgeted $100,000 in FY10 to purchase additional recycling receptacles for stations and facilities, and approximately $500,000 annually for FY10 – 14 for increased recycling services. By the end of FY10 all café and lounge cars will be equipped with onboard recycling containers, and by the end of FY14 all shop scrap will be recycled, including scrap metal, used oil, and paper products.
Electrification Amtrak intends to explore electrification on selected routes, where it makes sense to do so, and to procure low-emission diesel and alternative fuels locomotives and equipment for those routes that do not merit immediate electrification. Electrification allows for efficient, low-emissions travel, and positions the company to quickly utilize new low- or no-emission energy generation as it becomes available. Amtrak currently derives about 12-15% of the power for its electrified Northeast Corridor from hydroelectric or other low-emissions sources. While Amtrak cannot currently attain a goal of carbon neutrality for rail travel (it does have a program for passengers to purchase carbon offsets so that they can have a zero carbon footprint journey), an electrified system could be the fastest method to a carbon-neutral system of rail travel as new technologies come online to generate electric power.
Healthier
17 of 56
To be healthier, we are undertaking initiatives that translate our values into financial and operational achievements. The company has set metrics and standards that will allow us to set goals and measure our progress toward them. We are improving our financial health by undertaking improvement programs for our trains, developing improved financial planning and cost allocation measures, and restructuring our debt. Concurrently, we will address operational issues
such as on-time performance that affect the financial and mechanical health of the organization. A determination to improve our business processes must inform our other decisions - and we must ensure that those improvements are measurable, visible, and enduring. The first component of health affects not simply the health of Amtrak, but the health of the nation and that is ridership. Growth in ridership is a major goal for Amtrak. As ridership grows on existing services, it provides the company with healthier financial indicators, as the company realizes the economies of scale that are inherent in the industry. As ridership growth contributes to national goals such as modal shifts, congestion mitigation, emissions reductions and reduction in demand for foreign oil, it translates into a nation that is fundamentally healthier and stronger.
State Supported Services Building upon existing and developing new partnerships with states to offer new and expand rail service in state corridors is a primary Amtrak objective over the next five years. Revenue in support of these corridors from state partners is budgeted to increase to $260.2 million in FY14, representing an increase of $68.7 million over FY10 levels. The expanded corridor services begin with two new routes in partnership with the Commonwealth of Virginia. Service between Washington, DC and Lynchburg, VA will be launched in October 2009, followed by service between Washington, DC and Richmond, VA that will begin in December 2009. The two services are expected to generate $20 million of passenger ticket revenue between FY10-14. Amtrak’s key objectives from FY10-14 in expanding state partnerships are:
Establish agreements for eight service expansions (frequency increases and/or route extensions) through state partnerships
Form at least two new state partnerships Increase ridership on state corridors and financial support from states as required by PRIIA
Under PRIIA, Section 209, Amtrak is required to work with the Department of Transportation and the Governors of all states with corridor service (defined as routes less than 750 miles) to establish, by October 2010, a standard methodology for allocating Amtrak capital and operating costs to state routes. This method will properly allocate capital and operating costs that directly benefit each route, along with a proportionate share of indirect costs that benefit multiple routes. The standard methodology must then be adopted and implemented by Amtrak and the states within five years. If the parties fail to agree on a methodology within the given timeframe, the Surface Transportation Board is tasked with determining a methodology and ensuring its implementation. Amtrak is committed to working closely with its state partners to determine an allocation methodology that fairly and equitably distributes and recovers the direct operating costs of the routes, proportional capital costs, as well as proportional shared costs of providing service on the state routes. However, because the timing of the requirement may cause the final implementation to fall outside of the FY10-14 period, and considering the many current unknowns including the economic conditions of the state partners, Amtrak cannot, at this time, speculate on the final outcome of those discussions or what the financial impact to the states or Amtrak will be. Accordingly, the FY10-14 budget contains no incremental revenues that may arise from the final successful development and implementation of new allocation methodology.
18 of 56

Reliability Ridership will not grow without reliable service. The first component of reliability is the functionality of the system; our equipment must be operable, and the tracks and infrastructure that carry it must be serviceable. Amtrak defines the desired condition as “state of good repair.” Every item of equipment or infrastructure has a useful life, and within that life, it should be maintained in appropriate operating condition. When it reaches the end of that useful life, it should be replaced. The concept of a state of good repair applies not only to track infrastructure and rolling stock, but also extends to the modernization of information technologies and management systems – not only to replace outdated and aging systems, but to realize the potential for revolutionary change that new systems can offer.
1. Infrastructure While Amtrak is not responsible for the maintenance of most of the national rail infrastructure, it is responsible for the condition and reliability of most of the Northeast Corridor between Boston, New York, and Washington, the Harrisburg and Springfield lines that connect with it, some of the stations and yard facilities in major urban hubs, and the line it owns in Michigan. The cost of this is substantial. In its report “Northeast Corridor State of Good Repair Spend Plan” (submitted to U.S. DOT in April 2009), Amtrak estimated that the SOGR backlog on Amtrak-owned/operated NEC infrastructure is about $5.5 billion in FY10 dollars. On top of this, the incremental investment needed to maintain infrastructure assets once SOGR has been achieved is estimated to be $330 million per year. It is important to maintain the infrastructure in a state of good repair to minimize infrastructure related malfunctions and associated train delays. This becomes critical as the number of trains approaches the capacity limits of the infrastructure, as it does on a many segments and terminal locations on the Northeast Corridor. When delays occur in a capacity constrained environment, there is little or no room to recover, and such delays frequently have a “cascading” effort across large portions of network. In addition, state of good repair is essential to provide a reliable foundation upon which to build additional capacity. Without it, the infrastructure will be unable to reliably support growth in services for Amtrak as well as commuter and freight users of the corridor. SOGR estimates are based, in large part, on component life cycle replacement costs. Amtrak’s infrastructure is considered in a state of good repair when each asset is maintained and replaced within its manufactured design (or useful) life. Site-specific anomalies that impact useful life are factored into SOGR and annual replacement calculations as well. For example, rail in curved track wears at a rate higher than rail in tangent track, thus reducing its average useful life. Other examples of factors that impact useful life and SOGR analyses are traffic density, freight traffic, passenger volumes, train speeds and weather. It is important to note that Amtrak reprioritizes SOGR spending when necessary to allow it to address safety and operability issues as they arise. A backlog of SOGR should not, therefore, be understood as an accumulation of disintegrating or unsafe structures; rather, it is a list of projects that have passed the end of their useful life but may continue to carry traffic safely, albeit at times with the additional burden of increased maintenance.
19 of 56
The infrastructure backlog includes:
more than 200 bridges, most dating to the turn of the last century; Baltimore’s B&P Tunnels dating to the post-Civil War period; many interlockings (junctions and crossovers) that are functionally obsolete; and electric traction systems relying on 1930s-era components
It also includes structural improvements to the NY tunnels and station backlog costs as reported in the February 2009 ADA Accessibility Report. In its April 2009 SOGR report to USDOT, Amtrak estimated that even with adequate funding, resources and additional equipment, it will take a minimum of 15 years to resolve the backlog while still maintaining a reliable level of rail service throughout the necessary construction. Continual under-funding will merely push the completion date out further, as the backlog increases and Amtrak is forced to play “catch-up” year after year. To achieve a 15-year SOGR plan for Amtrak’s infrastructure assets would require an average of $700 million per year – $330 million per year on average for the normalized replacement of assets and $370 million per year on average for addressing the SOGR backlog. The Passenger Rail Investment and Improvement Act (PRIIA) of 2008 requires Amtrak, in consultation with the Secretary of Transportation and the States that make up the Northeast Corridor (NEC), to prepare capital spending plan for infrastructure projects needed to return the railroad right-of-way, facilities, stations, and equipment of the NEC main line to a state-of-good-repair by 2018. In collaboration with the FRA, the Northeast states and railroads operating on the NEC, Amtrak is developing a NEC Master Plan which is managed by a working group of state and rail representatives under the direction of a steering committee of DOT secretaries or their designees to address the PRIIA requirements. The planning process is intended to develop long-range (2030) and intermediate service levels and capital plans for all users of the corridor including both Amtrak and non-Amtrak owned portions of “core” network from Boston to Richmond, VA and the Springfield, Albany and Harrisburg branch lines. The NEC is a critical commuter, freight and intercity rail transportation corridor; vital to addressing the energy, environmental, carbon control and economic development goals of the Northeast. The NEC Network’s goal is to:
provide reliable service and infrastructure, improve and expand service –from Maine to Virginia with every state and railroad
having expansion plans with more than 30 new rail services envisioned and an increase by at least 30% on total daily trains;
improve on time performance to 90% for Acela and 85% for other NEC services reduce trip times between Boston and New York to 3 hours and between New York
and Washington to approximately 2 hours; double intercity and commuter ridership region wide by 2030; and Identify freight railroads traffic shifts and traffic crunches and envisioned increased
freight use of the NEC.
20 of 56
21 of 56
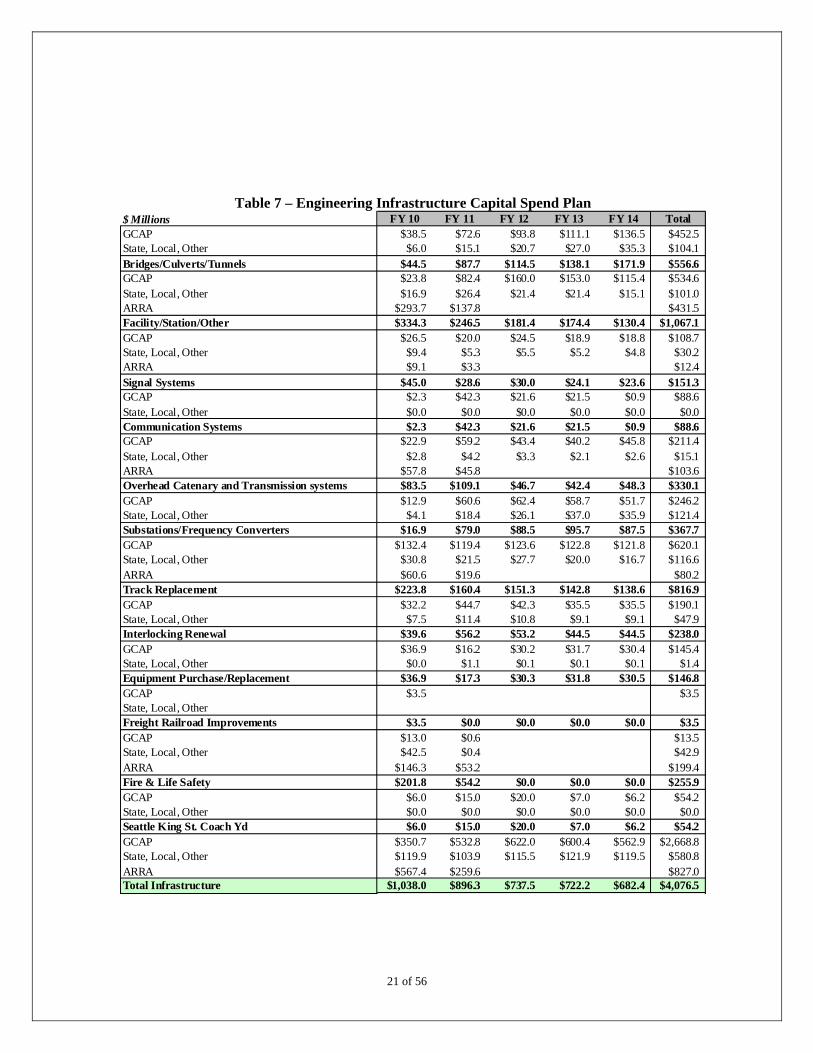
Table 7 – Engineering Infrastructure Capital Spend Plan $ Millions FY 10 FY 11 FY 12 FY 13 FY 14 TotalGCAP $38.5 $72.6 $93.8 $111.1 $136.5 $452.5State, Local, Other $6.0 $15.1 $20.7 $27.0 $35.3 $104.1Bridges/Culverts/Tunnels $44.5 $87.7 $114.5 $138.1 $171.9 $556.6GCAP $23.8 $82.4 $160.0 $153.0 $115.4 $534.6State, Local, Other $16.9 $26.4 $21.4 $21.4 $15.1 $101.0ARRA $293.7 $137.8 $431.5Facility/Station/Other $334.3 $246.5 $181.4 $174.4 $130.4 $1,067.1GCAP $26.5 $20.0 $24.5 $18.9 $18.8 $108.7State, Local, Other $9.4 $5.3 $5.5 $5.2 $4.8 $30.2ARRA $9.1 $3.3 $12.4Signal Systems $45.0 $28.6 $30.0 $24.1 $23.6 $151.3GCAP $2.3 $42.3 $21.6 $21.5 $0.9 $88.6State, Local, Other $0.0 $0.0 $0.0 $0.0 $0.0 $0.0Communication Systems $2.3 $42.3 $21.6 $21.5 $0.9 $88.6GCAP $22.9 $59.2 $43.4 $40.2 $45.8 $211.4State, Local, Other $2.8 $4.2 $3.3 $2.1 $2.6 $15.1ARRA $57.8 $45.8 $103.6Overhead Catenary and Transmission systems $83.5 $109.1 $46.7 $42.4 $48.3 $330.1GCAP $12.9 $60.6 $62.4 $58.7 $51.7 $246.2State, Local, Other $4.1 $18.4 $26.1 $37.0 $35.9 $121.4Substations/Frequency Converters $16.9 $79.0 $88.5 $95.7 $87.5 $367.7GCAP $132.4 $119.4 $123.6 $122.8 $121.8 $620.1State, Local, Other $30.8 $21.5 $27.7 $20.0 $16.7 $116.6ARRA $60.6 $19.6 $80.2Track Replacement $223.8 $160.4 $151.3 $142.8 $138.6 $816.9GCAP $32.2 $44.7 $42.3 $35.5 $35.5 $190.1State, Local, Other $7.5 $11.4 $10.8 $9.1 $9.1 $47.9Interlocking Renewal $39.6 $56.2 $53.2 $44.5 $44.5 $238.0GCAP $36.9 $16.2 $30.2 $31.7 $30.4 $145.4State, Local, Other $0.0 $1.1 $0.1 $0.1 $0.1 $1.4Equipment Purchase/Replacement $36.9 $17.3 $30.3 $31.8 $30.5 $146.8GCAP $3.5 $0.0 $0.0 $0.0 $0.0 $3.5State, Local, Other $0.0 $0.0 $0.0 $0.0 $0.0 $0.0Freight Railroad Improvements $3.5 $0.0 $0.0 $0.0 $0.0 $3.5GCAP $13.0 $0.6 $0.0 $0.0 $0.0 $13.5State, Local, Other $42.5 $0.4 $0.0 $0.0 $0.0 $42.9ARRA $146.3 $53.2 $199.4Fire & Life Safety $201.8 $54.2 $0.0 $0.0 $0.0 $255.9GCAP $6.0 $15.0 $20.0 $7.0 $6.2 $54.2State, Local, Other $0.0 $0.0 $0.0 $0.0 $0.0 $0.0Seattle King St. Coach Yd $6.0 $15.0 $20.0 $7.0 $6.2 $54.2GCAP $350.7 $532.8 $622.0 $600.4 $562.9 $2,668.8State, Local, Other $119.9 $103.9 $115.5 $121.9 $119.5 $580.8ARRA $567.4 $259.6 $827.0Total Infrastructure $1,038.0 $896.3 $737.5 $722.2 $682.4 $4,076.5

2. Fleet Equipment Amtrak is also responsible for the condition and reliability of its rolling stock fleet. At the end of FY 2009, the active equipment fleet will include 1,457 cars, 341 diesel and electric road locomotives, 22 non-powered control units, 20 Acela train sets, and 5 Talgo train sets. This fleet is a unique competitive advantage for Amtrak: it provides the basis for daily service and has the capability, if the national network is maintained, to provide “surges” of capacity in response to changes in demand, such as seasonal traffic or disaster relief needs. While the capacity of lines and terminals cannot be changed in the short term, the fleet provides the vital flexibility that allows Amtrak to develop or improve service on short timelines, and it is therefore a uniquely important asset. Equipment requires continual maintenance and cannot be purchased on the spur of the moment, and its configuration and operating qualities are long-term factors that can exert major influence on revenues and costs. For these reasons, the fleet requires detailed and careful management. The reliability objectives represented in Table 8 cannot be achieved without adequate funding for equipment overhaul programs.
Table 8 - Equipment Reliability: SOGR & Availability Ratios
FY09 FY10 FY11 FY12 FY13 FY14Cars
In State of Good Repair 89.8% 91.3% 94.0% 94.1% 95.7% 97.2%Average Availability 84.6% 86.0% 86.3% 86.5% 86.7% 86.9%
Diesel LocomotivesIn State of Good Repair 99.7% 100.0% 100.0% 100.0% 100.0% 100.0%Average Availability 87.1% 90.0% 90.2% 90.3% 90.5% 90.6%
Electric LocomotivesIn State of Good Repair 90.5% 100.0% 100.0% 100.0% 100.0% 100.0%Average Availability 75.7% 80.0% 80.0% 80.0% 80.0% 80.0%
Total FleetIn State of Good Repair 90.8% 92.7% 94.4% 94.5% 95.7% 96.9%Average Availability 84.7% 86.4% 86.7% 86.9% 87.1% 87.2%
SOGR percents represent portion of active fleet in a state of good repair To ensure that adequate rolling stock is in place to safely meet operating needs, Amtrak maintains the “System Five Year Fleet Plan.” In addition to operating requirements and state of good repair needs, this plan identifies “baseline” capacity needs and state of good repair requirements for the fleet and identifies the numbers and types of equipment that will be required to address projected growth on existing and planned services through 2014. It includes replacement requirements for equipment that has reached the end of its forty year lifespan. For the 2009-2014 periods, that includes the following equipment needs:
130 single-level long-distance cars (baggage, baggage-dormitory, dining and sleeping cars) 20 single-level cab cars 20 electric locomotives
22 of 56
Replacement of aging and/or retired heritage equipment and augmentation of the sleeper inventory in the single-level long distance fleet will enable Amtrak to more effectively operate the current
long distance network. It will also enable improved operating performance of long-distance trains by increasing inventory for sale, improving reliability, and supporting a viable baggage service. In addition to these baseline state-of-good-repair needs, a specification is in development for a single-level coach car, which can be utilized for either long-distance or corridor service. Orders will need to be placed in the near term, as funding sources are defined, for new single level corridor cars needed to replace the 470 Amfleet coaches that are approaching the end of their useful lives, and also to create a potential source of supply for passenger cars of this type for interested States seeking to expand or develop corridor service. Absent such actions, Amtrak anticipates a return to chronic capacity shortages in the Northeast Corridor served by this conventional fleet, which have only somewhat abated with the recent economic downturn. The requirements for system and route growth outside of the baseline need will be developed in partnership with states and in parallel with plans for route and service growth. Amtrak has formed the “Next Generation Corridor Equipment Pool Committee” in partnership with several state Departments of Transportation. This committee will develop specifications for the equipment that will serve developing and existing corridor routes, and it will work with the states to determine scales of need, financing mechanisms, and ownership models for the equipment pool. The Acela trainsets that serve the Northeast Corridor, and represent the only true High Speed Rail service currently in operation in the United States, are also capacity constrained due to increasing demand. While the equipment will not require replacement in the 2013 timeframe, the trainsets will need to be replaced in the mid-2020s. Design and planning work must be well underway by 2013 if that goal is to be realized, as these procurements are critical to meeting our 2 and 3 hour travel time goals on the corridor. In the meantime, we currently have the track capacity to add five or more trainsets to our current high-speed fleet, so Amtrak may seek to acquire additional Acela trainsets in the interim to augment current capacity and to serve as a bridge to evolving the current equipment to higher technologies available in the world market. Another item in our short term fleet plan is the conversion of our current AEM-7 locomotives. As mentioned above, we will be procuring 20 new electric locomotives to replace the outdated DC locomotives that are in use today. As they are taken out of service, Amtrak plans to convert these locomotives to cab cars, removing the power function and returning them to service as baggage / cab cars. Because equipment is an enduring asset, care must be taken to ensure that it will retain its qualities of comfort and attractiveness in hard service. The next round of equipment procurement must consider the following important qualities:
Mechanical durability and simplicity Incorporates the results of the latest safety research Compatibility with existing equipment Utility for a range of speeds and service types Attractiveness to the customer Pleasing appearance Comfortable interiors Improved amenities
Additional equipment needs will be addressed and explained in more detail in our comprehensive fleet strategy which will be released in February with our FY 2011 budget justification. This plan will contemplate our short and long term acquisition strategy.
23 of 56
Life-Cycle Progressive Maintenance (LCPM)
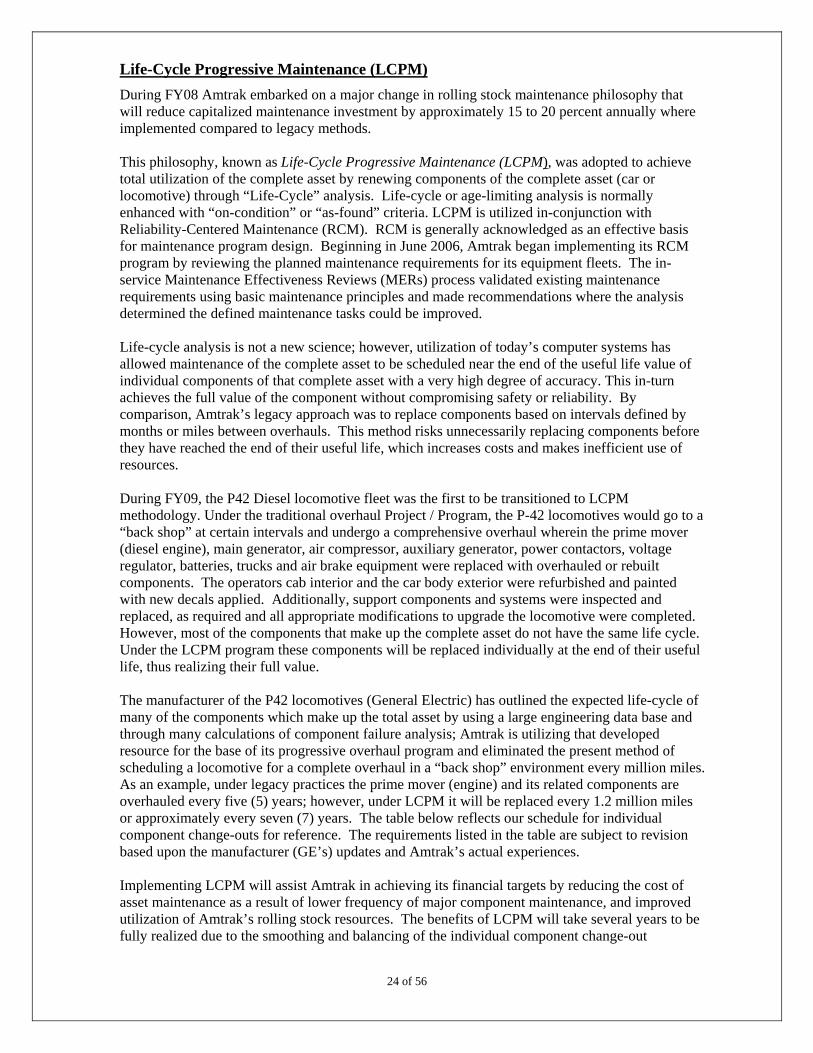
During FY08 Amtrak embarked on a major change in rolling stock maintenance philosophy that will reduce capitalized maintenance investment by approximately 15 to 20 percent annually where implemented compared to legacy methods. This philosophy, known as Life-Cycle Progressive Maintenance (LCPM), was adopted to achieve total utilization of the complete asset by renewing components of the complete asset (car or locomotive) through “Life-Cycle” analysis. Life-cycle or age-limiting analysis is normally enhanced with “on-condition” or “as-found” criteria. LCPM is utilized in-conjunction with Reliability-Centered Maintenance (RCM). RCM is generally acknowledged as an effective basis for maintenance program design. Beginning in June 2006, Amtrak began implementing its RCM program by reviewing the planned maintenance requirements for its equipment fleets. The in-service Maintenance Effectiveness Reviews (MERs) process validated existing maintenance requirements using basic maintenance principles and made recommendations where the analysis determined the defined maintenance tasks could be improved. Life-cycle analysis is not a new science; however, utilization of today’s computer systems has allowed maintenance of the complete asset to be scheduled near the end of the useful life value of individual components of that complete asset with a very high degree of accuracy. This in-turn achieves the full value of the component without compromising safety or reliability. By comparison, Amtrak’s legacy approach was to replace components based on intervals defined by months or miles between overhauls. This method risks unnecessarily replacing components before they have reached the end of their useful life, which increases costs and makes inefficient use of resources. During FY09, the P42 Diesel locomotive fleet was the first to be transitioned to LCPM methodology. Under the traditional overhaul Project / Program, the P-42 locomotives would go to a “back shop” at certain intervals and undergo a comprehensive overhaul wherein the prime mover (diesel engine), main generator, air compressor, auxiliary generator, power contactors, voltage regulator, batteries, trucks and air brake equipment were replaced with overhauled or rebuilt components. The operators cab interior and the car body exterior were refurbished and painted with new decals applied. Additionally, support components and systems were inspected and replaced, as required and all appropriate modifications to upgrade the locomotive were completed. However, most of the components that make up the complete asset do not have the same life cycle. Under the LCPM program these components will be replaced individually at the end of their useful life, thus realizing their full value. The manufacturer of the P42 locomotives (General Electric) has outlined the expected life-cycle of many of the components which make up the total asset by using a large engineering data base and through many calculations of component failure analysis; Amtrak is utilizing that developed resource for the base of its progressive overhaul program and eliminated the present method of scheduling a locomotive for a complete overhaul in a “back shop” environment every million miles. As an example, under legacy practices the prime mover (engine) and its related components are overhauled every five (5) years; however, under LCPM it will be replaced every 1.2 million miles or approximately every seven (7) years. The table below reflects our schedule for individual component change-outs for reference. The requirements listed in the table are subject to revision based upon the manufacturer (GE’s) updates and Amtrak’s actual experiences.
24 of 56
Implementing LCPM will assist Amtrak in achieving its financial targets by reducing the cost of asset maintenance as a result of lower frequency of major component maintenance, and improved utilization of Amtrak’s rolling stock resources. The benefits of LCPM will take several years to be fully realized due to the smoothing and balancing of the individual component change-out
schedules. During the FY10 to FY14 time-frame we anticipate that we will see fluctuation in the frequency of individual component replacement rates as we smooth and balance the individual component replacement schedules. Amtrak will continue to evaluate and implement LCPM with other fleet equipment maintenance in the future.
Table 9 – LCPM Replacement Schedule
COMPONENT LCPM REPLACEMENT SCHEDULEPrime Mover (Engine & associated parts) 7 years or 1.2 Million MilesTrucks 5 years (Polymer Bushings) & 10 year (Major)
Fuel Injection Nozzles 2 years
Air Compressor 8 years
Main Alternator / Generator Every Other Engine Change
Alternator Blower Motor 6 yearsGrid Blower Motor 7 years
Radiator Fan Motor 10 years
Equipment Blower 12 yearsTraction Motor 1.0 Million Miles
Radiator 15 years
HVAC On Failure
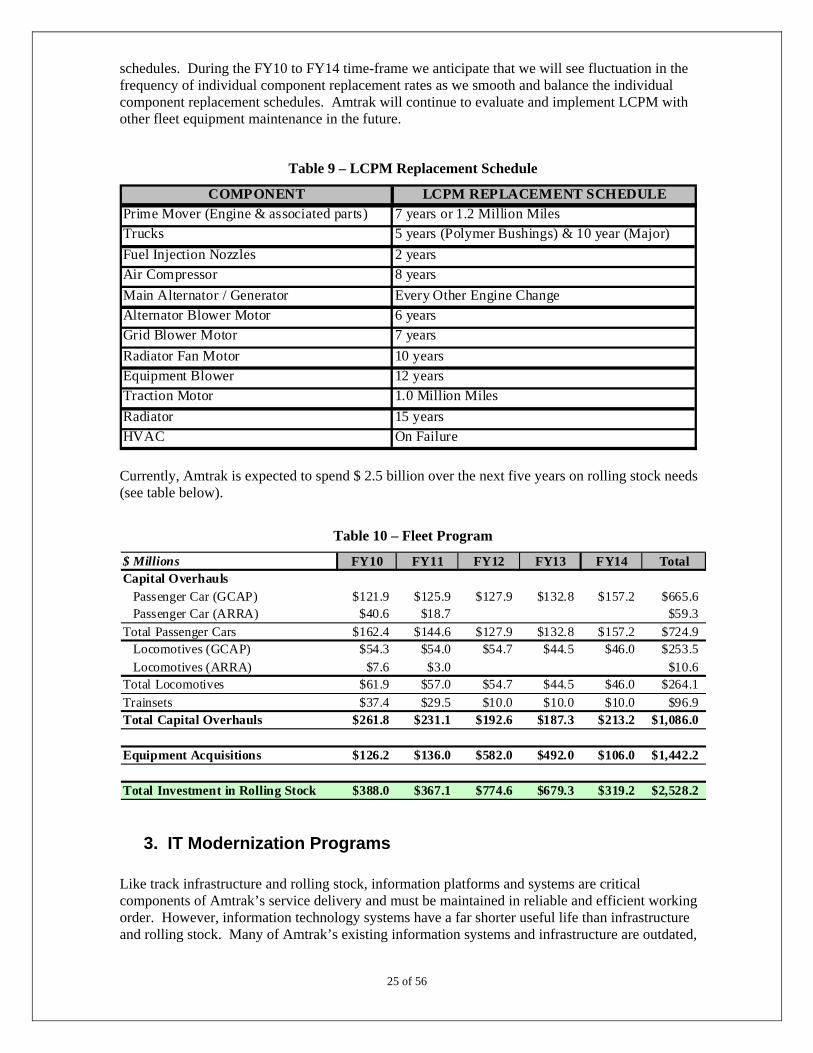
Currently, Amtrak is expected to spend $ 2.5 billion over the next five years on rolling stock needs (see table below).
Table 10 – Fleet Program
$ Millions FY10 FY11 FY12 FY13 FY14 TotalCapital Overhauls
Passenger Car (GCAP) $121.9 $125.9 $127.9 $132.8 $157.2 $665.6Passenger Car (ARRA) $40.6 $18.7 $59.3
Total Passenger Cars $162.4 $144.6 $127.9 $132.8 $157.2 $724.9Locomotives (GCAP) $54.3 $54.0 $54.7 $44.5 $46.0 $253.5Locomotives (ARRA) $7.6 $3.0 $10.6
Total Locomotives $61.9 $57.0 $54.7 $44.5 $46.0 $264.1
Trainsets $37.4 $29.5 $10.0 $10.0 $10.0 $96.9Total Capital Overhauls $261.8 $231.1 $192.6 $187.3 $213.2 $1,086.0
Equipment Acquisitions $126.2 $136.0 $582.0 $492.0 $106.0 $1,442.2
Total Investment in Rolling Stock $388.0 $367.1 $774.6 $679.3 $319.2 $2,528.2
3. IT Modernization Programs
25 of 56
Like track infrastructure and rolling stock, information platforms and systems are critical components of Amtrak’s service delivery and must be maintained in reliable and efficient working order. However, information technology systems have a far shorter useful life than infrastructure and rolling stock. Many of Amtrak’s existing information systems and infrastructure are outdated,
inefficient, lack technical support or upgrades and over time will become more prone to failure. Working with outdated technology places Amtrak at a competitive disadvantage, limits growth potential, and restricts the company’s ability to implement operational improvements. Furthermore, the increasing risk of failure of key systems must be addressed in order to ensure the uninterrupted continuity of operations. The company has developed a comprehensive and visionary plan to modernize all primary information technology (IT) infrastructure and systems. Implementation of this vision will require complete review and analysis of all of the company’s business practices at the most basic level, and will result in radical and forward-looking changes to business process and organizational structure. Such progress requires significant commitment and funding. The total cost to complete the IT modernization programs is currently projected to be approximately $530 million, representing 85% of total projected IT capital expenditures over the next five years. The FY10-14 Five Year Plan assumes this funding will be available. IT modernization commenced with targeted replacement or significant upgrades to some of the most critical applications, including Payroll and Human Resources systems (SAP), Quik-Trak, and Amtrak.com booking/ticketing applications. It also included Engineering implementing a world class asset and workforce management system (IBM-Maximo). These efforts addressed certain immediate needs and these applications will continue to be improved; however, these improvements occurred outside of the context of a fully integrated, comprehensive IT modernization plan. Amtrak recently created a comprehensive enterprise architecture which is serving as a strategic blueprint to guide IT modernization. There are four distinct strategic IT modernization programs outlined in the blueprint, as follows:
a. Strategic Asset Management Program (SAM) The Strategic Asset Management (SAM) program will integrate key operational, financial and human resources business processes and replace core outdated financial, work management, and other systems. Similar to many of the other outdated systems in Amtrak’s portfolio, these current legacy systems are either stand-alone or disparate aging applications that do not interface well with one another. The SAM program described above will include a complete replacement of the Amtrak Financial Information System and addresses the managerial accounting requirements mandated by the PRIIA. Operational areas are also included in the scope of the SAM project, including Transportation, Engineering, Mechanical, Procurement, and Materials Management systems and business processes. The integration of these key business processes is critical to improving financial and managerial information. The SAM effort also includes continued investment in the Human Capital Management systems and builds on earlier SAP implementation in Payroll and Human Resources. SAM will be implemented in three phases; the first phase has been approved by Amtrak’s Board of Directors and is currently underway. Through the end of FY09 the company will have invested nearly $34 million in the first phase and the FY10 capital budget includes approximately $87 million for additional work. The total investment for all three phases is approximately $370 million.
26 of 56
The company has projected the financial gains from a fully implemented SAM Program. A primary benefit will be improved inventory management that will allow the company to reduce on-hand stores of materials by an estimated $55 million. More significantly, a fully implemented SAM is projected to yield significant annual operating expense reductions as depicted below:
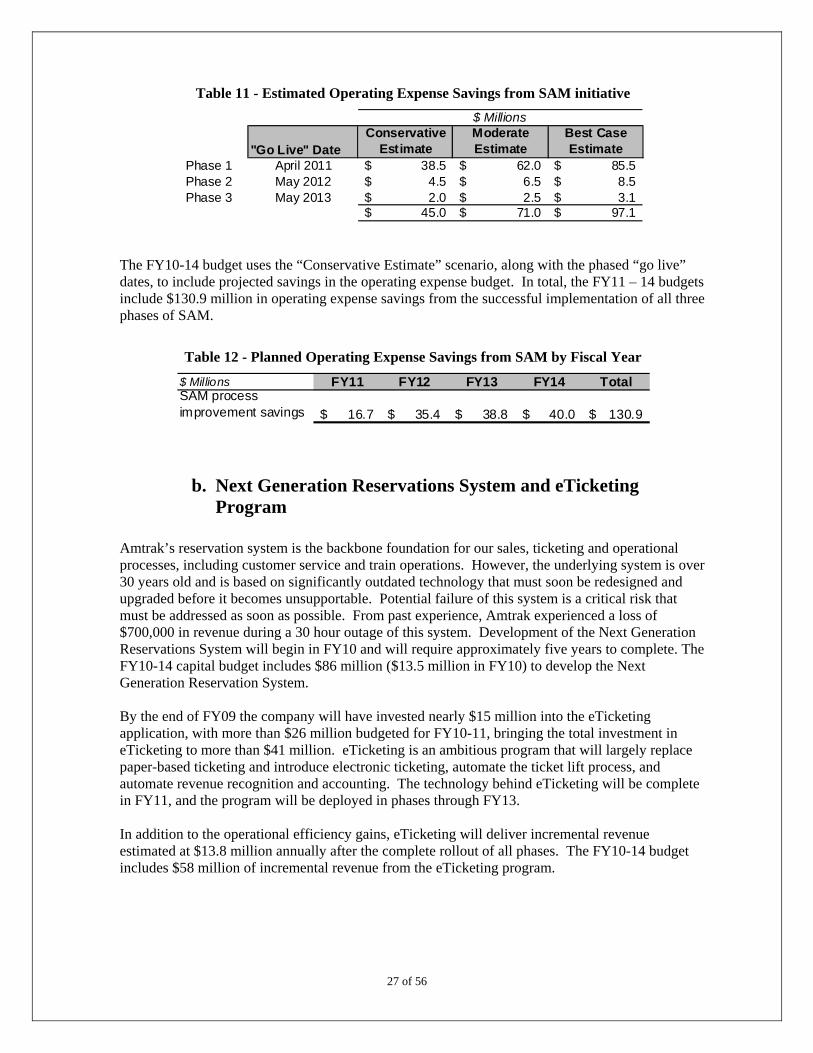
Table 11 - Estimated Operating Expense Savings from SAM initiative
"Go Live" DateConservative
EstimateModerate Estimate
Best Case Estimate
Phase 1 April 2011 38.5$ 62.0$ 85.5$ Phase 2 May 2012 4.5$ 6.5$ 8.5$ Phase 3 May 2013 2.0$ 2.5$ 3.1$
45.0$ 71.0$ 97.1$
$ Millions
The FY10-14 budget uses the “Conservative Estimate” scenario, along with the phased “go live” dates, to include projected savings in the operating expense budget. In total, the FY11 – 14 budgets include $130.9 million in operating expense savings from the successful implementation of all three phases of SAM.
Table 12 - Planned Operating Expense Savings from SAM by Fiscal Year
$ Millions FY11 FY12 FY13 FY14 TotalSAM process improvement savings 16.7$ 35.4$ 38.8$ 40.0$ 130.9$
b. Next Generation Reservations System and eTicketing Program
Amtrak’s reservation system is the backbone foundation for our sales, ticketing and operational processes, including customer service and train operations. However, the underlying system is over 30 years old and is based on significantly outdated technology that must soon be redesigned and upgraded before it becomes unsupportable. Potential failure of this system is a critical risk that must be addressed as soon as possible. From past experience, Amtrak experienced a loss of $700,000 in revenue during a 30 hour outage of this system. Development of the Next Generation Reservations System will begin in FY10 and will require approximately five years to complete. The FY10-14 capital budget includes $86 million ($13.5 million in FY10) to develop the Next Generation Reservation System. By the end of FY09 the company will have invested nearly $15 million into the eTicketing application, with more than $26 million budgeted for FY10-11, bringing the total investment in eTicketing to more than $41 million. eTicketing is an ambitious program that will largely replace paper-based ticketing and introduce electronic ticketing, automate the ticket lift process, and automate revenue recognition and accounting. The technology behind eTicketing will be complete in FY11, and the program will be deployed in phases through FY13. In addition to the operational efficiency gains, eTicketing will deliver incremental revenue estimated at $13.8 million annually after the complete rollout of all phases. The FY10-14 budget includes $58 million of incremental revenue from the eTicketing program.
27 of 56
c. Amtrak Information Modernization Program (AIM) The Amtrak Information Modernization Program (previously referred to as Enterprise Information Management System) is designed to make the critical information our managers need both reliable and easily accessible using modern solutions. Specific elements include new Enterprise Data Warehouse, Master Data Management, Identity Management, Application Integration and Train Communications Enterprise (TCE) technology. By the end of FY09, the company will have invested over $18 million into the first phase of AIM, with roughly $4 million of that funded by ARRA. The total cost to complete the first phase of AIM (scheduled for February 2011) is estimated to be $37.9 million, with $21 million funded by ARRA. This phase provides a firm foundation for these key information services; starting in FY11, we will begin the next phase which expands the breadth and depth of the shared services across the company and enables integrated real-time business processes. The second phase will occur between FY11 and FY14 and cost an additional $58.3 million, bringing the combined total investment to $96.9 million.
d. IT Infrastructure Improvement (ITII) Program The fourth major initiative focuses on achieving and maintaining a state of good repair for the Information Technology Infrastructure. This program includes establishment of redundant and energy efficient Data Centers, Voice and Data Network re-architecture resulting in improved reliability and throughput, and upgraded Desktop Support. Primary objectives of the program are to improve service levels, lower current costs and rationalize the delivery model for asset ownership, workforce consolidation and cross vendor communications. The program will ensure that the workstations, network and data center technologies are adequate to meet the current needs of the enterprise and are refreshed according to the product life cycle. By the end of FY10 the redesigned data center and network technologies will be deployed under new services agreements. ITII will deliver significant cost savings and avoidances, as well as dramatic improvements in service levels. Key benefits include:
Multiple data centers that assure mission critical applications are quickly recovered in
the event of a disaster that impacts the data center. Significant reductions in capital expenditures for infrastructure. Service providers will
provide infrastructure as part of their service agreements, precluding the need for investment of Amtrak capital dollars
28 of 56
Operating expense savings of $26.6 million over the first five years, compared to comparable current costs.

Table 13 - Technology Spend Plan
$ Millions FY10 FY11 FY12 FY13 FY14 TotalSAM Program (GCAP) $82.1 $91.3 $85.5 $66.9 $5.0 $330.8
SAM Program (ARRA) $4.5 $4.5Total SAM Program $86.6 $91.3 $85.5 $66.9 $5.0 $335.3
AIM Program (GCAP) $7.5 $31.7 $16.5 $6.5 $3.5 $65.7
AIM Program (ARRA) $14.2 $2.9 $17.1Total AIM Program $21.7 $34.6 $16.5 $6.5 $3.5 $82.8
Next Generation Reservations System $12.0 $17.0 $17.0 $17.0 $11.4 $74.4Next Gen Reservations - Stations $1.5 $4.1 $6.3 $11.9Total Next Generation Reservations $13.5 $21.1 $23.3 $17.0 $11.4 $86.3
eTicketing Program $16.7 $9.5 $26.2
Subtotal IT Modernization Programs $138.5 $156.5 $125.3 $90.4 $19.9 $530.7
PC & Infrastructure Maintenance $13.0 $11.5 $10.1 $10.1 $8.9 $53.6
Other IT Investments $15.5 $16.5 $7.2 $0.6 $0.6 $40.4
Total IT Investment $167.1 $184.4 $142.5 $101.1 $29.4 $624.6
Customer Service While Amtrak can offer the nation a wide range of environmental and efficiency benefits, those benefits depend in part on ridership growth – and ridership growth depends on customer satisfaction. To build our business, Amtrak must offer riders an experience that is convenient, competitive, and pleasant. Convenience and competitiveness are products of trip time and reliability, but the ease and attractiveness of the experience are products of a whole range of factors that fall under the rubric of improved customer service – such as accessibility, food service, comfort, attractiveness of surroundings, and the overall experience. Some of these improvements are products of investment in equipment and stations, while others are products of our efforts to ensure that our service is satisfactory – but they combine to leave an indelible and decisive impression on each of our customers. We must ensure that this impression is a favorable one.
Accessibility - Americans with Disabilities Accessibility is a key component of customer satisfaction, and it is becoming a competitive advantage for Amtrak. Persons with disabilities rely upon rail transportation and it is critical that we provide them with accessible facilities and equipment. We are eager and proud to serve these valued customers and in Amtrak’s continuing effort to improve our accessibility, we have instituted a “Mobility First” program to create barrier-free pathways (from streets/parking areas to trackside locations and onto trains) so mobility-impaired customers can access trains. At this time, 74% of our stations, serving 94% of our passengers, provide barrier-free service to passengers that require wheelchairs.
29 of 56

Amtrak serves 481 rail stations that are required by the ADA to be “readily accessible to and usable by individuals with disabilities, including individuals who use wheelchairs, as soon as practicable”, by July 26, 2010. Currently, only 48 stations are 100% ADA compliant. Despite significant improvements in accessibility and ADA compliance, Amtrak will not meet this deadline for full compliance, and has asked Congress to extend it. The total funding requirement to achieve ADA compliance for rail stations served by Amtrak and subject to the ADA is $1.56 billion, including bringing some already compliant facilities into a full state of good repair. If full funding is secured, it is estimated that the earliest practical date by which Amtrak will be able to achieve full compliance is September 2015. Amtrak presented an estimate of its needs to the Congress on February 1, 2009, in its report “Intercity Rail Stations Served by Amtrak: A Report on Accessibility and Compliance with the Americans with the Disabilities Act of 1990 (“Access Report”). This report, which was delivered pursuant to section 219 of the Passenger Rail Investment and Improvement Act of 2008, details the scope of Amtrak’s need and proposes the level of federal assistance necessary to attain full compliance. Amtrak has requested additional funding for ADA compliance efforts since 2005 and the company will continue to work with Congress in an effort to secure funding and to revise the compliance date. A major assumption of the ADA plan is that federal funds not currently appropriated will be available beginning in FY 2010. Other critical assumptions are that the current ADA regulations on platform boarding remain the law and that the FRA allows the necessary station and platform improvement work and projects to go forward. The “144 Plan” and Mobility First Amtrak plans to have all stations which it serves and are subject to the ADA accessible by the end of 2015. The first year’s funding level for FY 2010 approved by board of directors at $144 million, consistent with the FY10 grant request to Congress and the level of funding defined in the Access Report. The “144 Plan” will advance station/ADA designs and upgrades in more than 90 stations yielding improvements to the following station elements:
Platforms Pathways Structures Passenger Information Display Systems
The 144 Plan will likely be funded from Amtrak’s FY 2010 capital program. In response to the upcoming deadline and in order to address the most significant limiting factor to the use of Amtrak service, an immediate action plan was developed to accelerate the company’s current program to eliminate physical barriers to train access and boarding for mobility-impaired passengers (generally those with wheelchairs). This program – the Mobility First Program – is designed to eliminate as many of these barriers as soon as possible. ARRA funding is being used by Amtrak to make significant infrastructure investments, including $42 million of station-related investments that advance ADA compliance. The Mobility First component of this work, consisting of approximately $15 million, is concentrated on improving pathway access between streets and platforms with wheelchair lifts and/or mini-high platforms installed to provide access to trains from train-side platforms or pads.
30 of 56
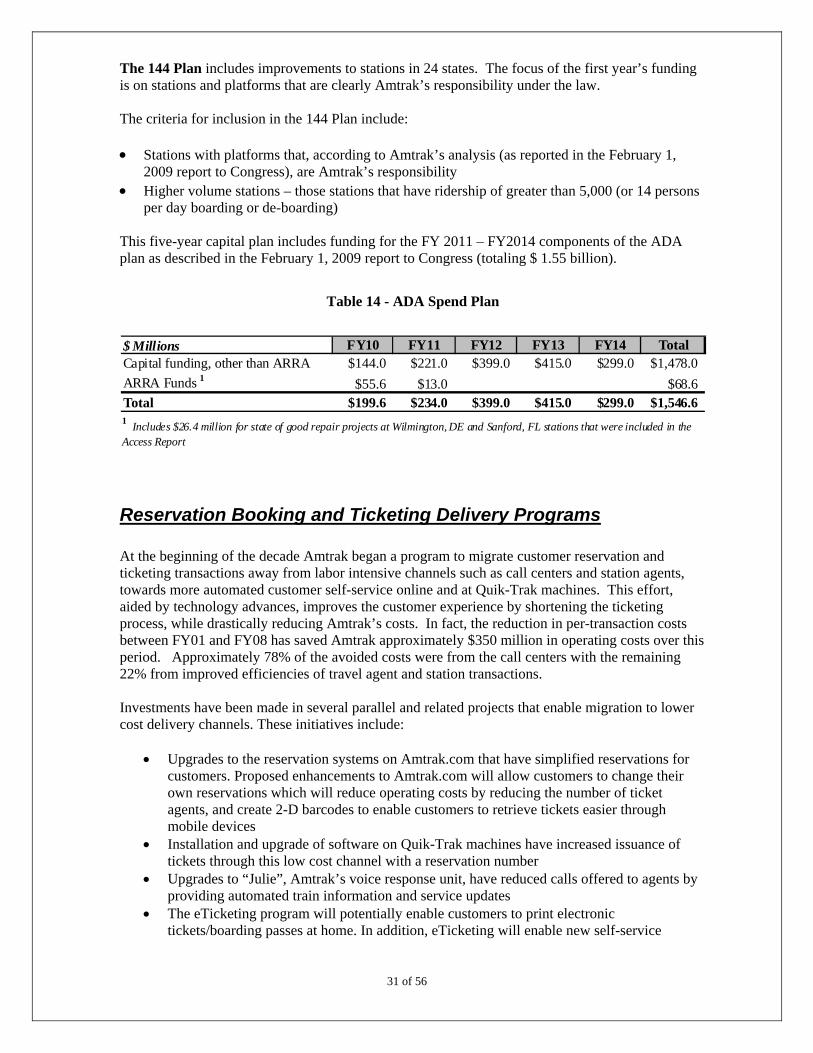
The 144 Plan includes improvements to stations in 24 states. The focus of the first year’s funding is on stations and platforms that are clearly Amtrak’s responsibility under the law. The criteria for inclusion in the 144 Plan include: Stations with platforms that, according to Amtrak’s analysis (as reported in the February 1,
2009 report to Congress), are Amtrak’s responsibility Higher volume stations – those stations that have ridership of greater than 5,000 (or 14 persons
per day boarding or de-boarding) This five-year capital plan includes funding for the FY 2011 – FY2014 components of the ADA plan as described in the February 1, 2009 report to Congress (totaling $ 1.55 billion).
Table 14 - ADA Spend Plan
$ Millions FY10 FY11 FY12 FY13 FY14 TotalCapital funding, other than ARRA $144.0 $221.0 $399.0 $415.0 $299.0 $1,478.0
ARRA Funds 1 $55.6 $13.0 $68.6Total $199.6 $234.0 $399.0 $415.0 $299.0 $1,546.61 Includes $26.4 million for state of good repair projects at Wilmington, DE and Sanford, FL stations that were included in the
Access Report
Reservation Booking and Ticketing Delivery Programs At the beginning of the decade Amtrak began a program to migrate customer reservation and ticketing transactions away from labor intensive channels such as call centers and station agents, towards more automated customer self-service online and at Quik-Trak machines. This effort, aided by technology advances, improves the customer experience by shortening the ticketing process, while drastically reducing Amtrak’s costs. In fact, the reduction in per-transaction costs between FY01 and FY08 has saved Amtrak approximately $350 million in operating costs over this period. Approximately 78% of the avoided costs were from the call centers with the remaining 22% from improved efficiencies of travel agent and station transactions. Investments have been made in several parallel and related projects that enable migration to lower cost delivery channels. These initiatives include:
Upgrades to the reservation systems on Amtrak.com that have simplified reservations for customers. Proposed enhancements to Amtrak.com will allow customers to change their own reservations which will reduce operating costs by reducing the number of ticket agents, and create 2-D barcodes to enable customers to retrieve tickets easier through mobile devices
Installation and upgrade of software on Quik-Trak machines have increased issuance of tickets through this low cost channel with a reservation number
Upgrades to “Julie”, Amtrak’s voice response unit, have reduced calls offered to agents by providing automated train information and service updates
31 of 56
The eTicketing program will potentially enable customers to print electronic tickets/boarding passes at home. In addition, eTicketing will enable new self-service
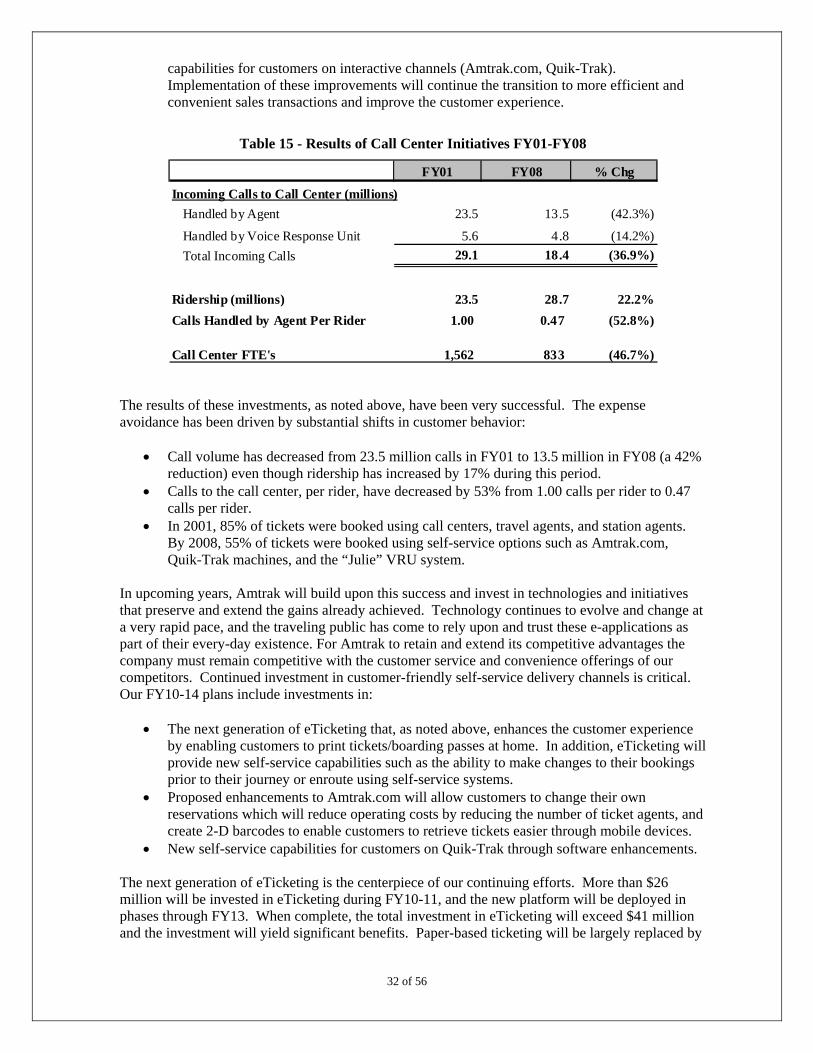
capabilities for customers on interactive channels (Amtrak.com, Quik-Trak). Implementation of these improvements will continue the transition to more efficient and convenient sales transactions and improve the customer experience.
Table 15 - Results of Call Center Initiatives FY01-FY08
FY01 FY08 % Chg
Incoming Calls to Call Center (millions)
Handled by Agent 23.5 13.5 (42.3%)
Handled by Voice Response Unit 5.6 4.8 (14.2%)
Total Incoming Calls 29.1 18.4 (36.9%)
Ridership (millions) 23.5 28.7 22.2%
Calls Handled by Agent Per Rider 1.00 0.47 (52.8%)
Call Center FTE's 1,562 833 (46.7%) The results of these investments, as noted above, have been very successful. The expense avoidance has been driven by substantial shifts in customer behavior:
Call volume has decreased from 23.5 million calls in FY01 to 13.5 million in FY08 (a 42% reduction) even though ridership has increased by 17% during this period.
Calls to the call center, per rider, have decreased by 53% from 1.00 calls per rider to 0.47 calls per rider.
In 2001, 85% of tickets were booked using call centers, travel agents, and station agents. By 2008, 55% of tickets were booked using self-service options such as Amtrak.com, Quik-Trak machines, and the “Julie” VRU system.
In upcoming years, Amtrak will build upon this success and invest in technologies and initiatives that preserve and extend the gains already achieved. Technology continues to evolve and change at a very rapid pace, and the traveling public has come to rely upon and trust these e-applications as part of their every-day existence. For Amtrak to retain and extend its competitive advantages the company must remain competitive with the customer service and convenience offerings of our competitors. Continued investment in customer-friendly self-service delivery channels is critical. Our FY10-14 plans include investments in:
The next generation of eTicketing that, as noted above, enhances the customer experience by enabling customers to print tickets/boarding passes at home. In addition, eTicketing will provide new self-service capabilities such as the ability to make changes to their bookings prior to their journey or enroute using self-service systems.
Proposed enhancements to Amtrak.com will allow customers to change their own reservations which will reduce operating costs by reducing the number of ticket agents, and create 2-D barcodes to enable customers to retrieve tickets easier through mobile devices.
New self-service capabilities for customers on Quik-Trak through software enhancements.
32 of 56
The next generation of eTicketing is the centerpiece of our continuing efforts. More than $26 million will be invested in eTicketing during FY10-11, and the new platform will be deployed in phases through FY13. When complete, the total investment in eTicketing will exceed $41 million and the investment will yield significant benefits. Paper-based ticketing will be largely replaced by

electronic ticketing and the ticket lift process will be automated, as will revenue recognition and accounting. Customers will experience far more flexible ticketing options and will get to their trains more quickly. Manual processes will be reduced and broader access to Amtrak e-ticketing will increase revenue. The FY10-14 budget contains $58 million of incremental ticket revenue from the eTicketing program.
Other Programs
1. Route Performance Improvement Program Each year the company targets a select group of train routes with customized Route Performance Improvement (RPI) programs designed to enhance the customer experience and service operations on these trains, with the objective of increasing customer satisfaction and growing ridership and revenue. Benefits from the FY09 RPI program are projected to increase ticket revenue by $10 million over the next five years. The RPI process is designed to improve bottom line performance on dedicated routes by:
• Analyzing and evaluating current performance of the route (P&L, On-time performance, Revenue & Ridership, Customer service scores, etc.) to determine best opportunities for improvement.
• Employing a collaborative management process and cross-functional teams, involving numerous departments in the development of an agreed upon action plan.
• Utilizing an agreed upon set of metrics to measure and determine effectiveness of each RPI initiative.
In each fiscal year, six routes (a combination of corridors and long distance) are identified for performance improvement. Most of the RPI routes involve an “in-year” discovery process to identify service barriers, marketing opportunities, product changes, mechanical process improvements, missing communication links, schedule changes, state partner considerations, etc. that can improve product/service quality. Marketing resources are redirected following the completion of the effort to create awareness and promote the route. Elevated concerted effort in service delivery, motivated management and crews, greater product quality and increased marketing resources drive ridership growth and improve the customer experience. The following trains have been included or planned for the RPI program since its inception. The FY10 routes are preliminary and may change in accordance with the selection criteria for long distance target routes as defined in PRIIA section 247.
Table 16 – Routes in the Performance Improvement Program
FY08 FY09 FY10Coast Starlight Empire Builder Cascades
Northeast Regional Empire Service & Adirondack California ZephyrHiawathas Lincoln Service Cardinal
San Joaquins Lake Shore Limited Silver ServiceCity of New Orleans Sunset Limited Southwest Chief
Auto Train Crescent Wolverines
33 of 56

2. Station and Facility Improvements This capital program is managed by the Transportation department and includes common support equipment to be deployed at all Amtrak stations. It also includes station improvement projects at a number of major stations (New York Penn, Chicago Union Station, and Washington Union Station) as well as improvements at a number of on and off corridor stations.
Table 17 – Station and Facility Improvements
$ Millions FY10 FY11 FY12 FY13 FY14 Total Station and Facility Improvements $27.4 $54.7 $38.3 $8.5 $6.8 $135.6
3. On Board Wi-Fi Amtrak completed an extensive mobile WiFi technology review in FY09 and began installation of WiFi on Acela Express. Providing WiFi access on Acela trains will enable passengers to browse the Internet and retrieve email, further differentiating Amtrak from other modes of transportation on the Northeast Corridor. Launch is anticipated in the second quarter of FY10. This service will initially be offered at no cost to our customers, though pricing may change depending on customer response, system performance, and costs. The goal for this offering is to drive competitive advantage that will result in additional ridership and revenue on Acela trains. As of the end of FY09 the company will have just begun deployment. This service is projected to drive incremental sales on Acela starting in FY10, with total incremental revenue of $4.3M budgeted between FY10-14. In addition to Acela, Amtrak is preparing to extend WiFi to other services, depending on market response. Amtrak has budgeted an additional $26.2 million for these investments in the period FY11-FY14, with the first most likely additional WiFi offering to be on the Northeast Regional.
4. Amtrak.com Enhancements In the first quarter of FY10, Amtrak will have re-launched its consumer website, Amtrak.com with a completely new look and new functionality, including substantially improved navigation features to make access to system information faster and more intuitive, full day availability to allow customers to sort on various criteria (such as price, schedule, or trip time), and much simplified ability to promote service offerings and upgrade options through information embedded into their schedule options results page. Immediately following that re-launch, we will begin to develop additional functionality to capitalize on the new site platform. This new functionality will include capabilities that Amtrak has been working toward for some time through the combined efforts of the e-Ticketing, Amtrak Guest Rewards and the customer relationship management (CRM) program. Specifically, this will include:
34 of 56
Ability to modify, exchange or refund bookings on Amtrak.com rather than having to speak with a call center or station agent (once e-Ticketing functionality is complete);
Single sign-on for Amtrak.com and Amtrak Guest Rewards customer profiles; Ability for customers to choose communication preferences so Amtrak can deliver
messages (service disruptions, promotions) in a variety of ways (Mobile, E-mail, etc.); Ability to present the customer’s full terms and conditions in initial availability call
(contingent on the “Reservation Systems Next Generation” project); Ability to sell travel insurance within the booking path; and Integration of destination information from third party vendor.
This functionality will be phased in over the course of the second half of FY10 and FY11, resulting in a better, more flexible information and reservations experience on line for our customers.
5. Additional Train Services
35 of 56
One of Amtrak’s key strategies is to forge new agreements to operate state-supported corridor services. Three such agreements begin in FY10 – for two new routes in Virginia, an additional train in North Carolina for the Piedmont service, and additional border crossings for the Cascades between Washington and Vancouver. For FY11-14, Amtrak is targeting expanded services with existing state partners, establishing two new state partnerships, and increasing both ridership and state cost recovery as required by PRIIA. Although specific state agreements are not yet identified, the Five Year Plan commits to incremental revenue and expense dollars as presented in Table 18. The figures in this table are amounts incremental to FY09 as the base year. Since state support dollars are intended to offset operating losses for providing the services, these additions are neutral to Amtrak’s operating budget.

Table 18 – State Services
$ MillionsTicket State Oper Ticket State Oper
Revenue Revenue Exp Net Revenue Revenue Exp NetFY10 $3.7 $3.3 $7.0 $0.0 $2.0 ($0.4) $1.7 $0.0FY11 $4.2 $3.3 $7.5 $0.0 $2.1 $0.7 $2.7 $0.0FY12 $4.2 $3.6 $7.7 $0.0 $2.1 $0.8 $2.8 $0.0
FY13 $4.2 $3.9 $8.0 $0.0 $2.1 $0.9 $2.9 $0.0FY14 $4.2 $4.0 $8.2 $0.0 $2.1 $0.9 $3.0 $0.0Five Year $20.4 $18.0 $38.4 $0.0 $10.2 $2.8 $13.1 $0.0
$ MillionsTicket State Oper Ticket State Oper
Revenue Revenue Exp Net Revenue Revenue Exp NetFY10 $0.6 $0.8 $1.4 ($0.0) $0.0 $1.4 $0.0 $1.4
FY11 $0.7 $0.8 $1.5 $0.0 $0.0 $7.9 $7.6 $0.3FY12 $0.7 $0.8 $1.5 $0.0 $0.0 $18.0 $18.2 ($0.2)
FY13 $0.7 $0.9 $1.6 $0.0 $0.0 $28.5 $29.1 ($0.6)FY14 $0.7 $0.9 $1.6 $0.0 $0.0 $67.8 $68.7 ($0.9)Five Year $3.4 $4.3 $7.7 $0.0 $0.0 $123.6 $123.6 $0.0
$ Millions
Ticket State OperRevenue Revenue Exp Net
FY10 $6.4 $5.0 $10.1 $1.4FY11 $6.9 $12.7 $19.3 $0.3
FY12 $6.9 $23.2 $30.3 ($0.2)FY13 $6.9 $34.1 $41.6 ($0.6)FY14 $6.9 $73.7 $81.5 ($0.9)Five Year $34.0 $148.8 $182.8 $0.0
Virginia Cascades (Washington)
Piedmont (N. Carolina) Future New Services TBD
Total New State Services
Food & Beverage Services In FY06, in response to Congressional concerns about financial losses of on-board Food & Beverage services, Amtrak embarked upon several improvement initiatives that have and continue to improve the cost recovery of the Food & Beverage operations. These improvement efforts include:
Simplified Dining Service was begun as pilot program in first quarter of FY06 and rolled-out completely by the third quarter. A re-design of the food service model on long distance trains, along with introduction of high-quality, labor-saving menu items and a move away from china and glassware resulted in reduction of on board service labor requirements. These changes have delivered expense savings of approximately $18 million per year.
36 of 56
The Automated On-board Credit Card Processing initiative provided an additional payment option for customers that resulted in an increase in both the number of revenue transactions and the average spend per transaction. In addition, the initiative also reduced
transactional errors and processing time. This initiative has delivered $1.5 million of expense or revenue improvement each year.
The Outsourced Revenue Collection initiative moved the management of food and
beverage sales and inventory processing to an outside service provider (utilizing Amtrak labor union employees), resulting in a $1.4 million cost decrease.
In FY09, Amtrak exercised its right to competitively bid the Food and Beverage
Managed Services Contract, which was awarded to the Aramark Corporation. In addition to providing improved operations to better serve our customers, the new agreement will produce savings of $18.4 million in FY10-14 compared to the former managed services provider.
This focus has result in meaningful improvements, consistent with Congressional requests. From FY06 to FY08:
Passenger Food & Beverage revenue increased by 17% from $79.8 million to $93.1 million. This revenue is budgeted to increase to $111 million by FY14.
During this period, the cost of food and beverage inventories, supplies, and commissary
services have been aggressively managed- increasing only 3% from $84.4 million to $86.9 million.
The cost of on-board Amtrak labor actually decreased by 3% from $92.5 million to $89.7
million, despite the rise in wage rates from new labor agreements, increases in train frequency and service levels, and significantly increased ridership.
In FY10-14 Amtrak will build on these improvements with the implementation of a new Food & Beverage Management System which will:
Automate and streamline the current F&B systems and business processes to provide more accurate on board sales and warehouse information to improve product availability aboard the trains to our customers
Enable on-board staff to focus on providing better customer service and increasing sales Increase employee productivity and job satisfaction by eliminating labor-intensive and
manual inventory accounting procedures Integrate the overall management of the business by providing a seamless back office
environment from which all reporting and transaction data will flow
Financial Performance
37 of 56
Amtrak is a government-supported business, and it must not lose sight of the responsibilities that come with taxpayer support. Our company has a positive responsibility to ensure that Federal and state money is spent in an economical and efficient manner that provides the nation with effective intercity passenger service and protects the investment the nation has made in its railroad. To this end, we must ensure that capital money is invested in those projects that return value and that sustain our infrastructure; operating funds must be spent efficiently, returning the maximum obtainable benefit for the lowest cost, consistent with the need to attract customers and develop new business.
38 of 56
PRIIA section 204(b)(13) requires Amtrak’s Five Year Plan to identify costs and benefits associated with “reform initiatives”. In recent years Amtrak’s work to improve services, business processes, and operating results were framed by the Strategic Reform Initiatives of 2005, an extensive list of proposed “reform” activities (SRIs) to be undertaken by the company. The company has continued to pursue numerous activities that improve operations and results, some of them within the original scope of the Strategic Reform Initiatives of 2005, and some outside of that scope. Some of the improvement initiatives have required capital investment, and others have been changes in operational methods and behavior. Although some of the early initiatives pursued in 2005 were suspended or modified due to unforeseen issues, Amtrak has continued to pursue improvement activities tied to the original SRIs. The FY10 – 14 Five Year Plan includes the investments and savings from improvement activities that were described in the preceding discussions. A summary report of the net impact for each can be found in the Appendix.
Key Performance Indicators (KPIs) Two of the basic measures of performance for Amtrak are costs and revenues per “seat-mile.” Cost per Seat Mile is CASM and Revenue per Seat Mile is RASM. Amtrak generates a certain number of daily seat miles, which can be augmented or decremented by fixed amounts if equipment is put into service or withdrawn from service. But the necessities of daily operation require a certain fixed level of expenditure if services are to be maintained, and the company therefore needs to both ensure that those expenses are kept low (consistent with the need to provide quality service), and that it maximizes the revenue generated by each seat. Another key indicator of financial performance is the cost recovery ratio (CRR) the percentage of operating costs that are paid out of operating revenues for core services. The company must aim to maximize this ratio, in order to minimize the impact on the Federal treasury and our state partners. Operating costs are an unavoidable component of any rail operation, the goal of minimizing those costs is important, and reflects on the efficiency of the company. As previously explained, the financial plan assumes ticket revenues based upon a conservative pace for economic recovery. This plan also assumes costs and benefits that were presented in the goal discussions above. The charts below provide the KPIs in two stages; the first assumes business as usual with the aforementioned assumption regarding economic recovery, and the second assumes implementation of the improvements also called initiatives. The improvement initiatives favorably impact the cost recovery ratio by 2.2%.
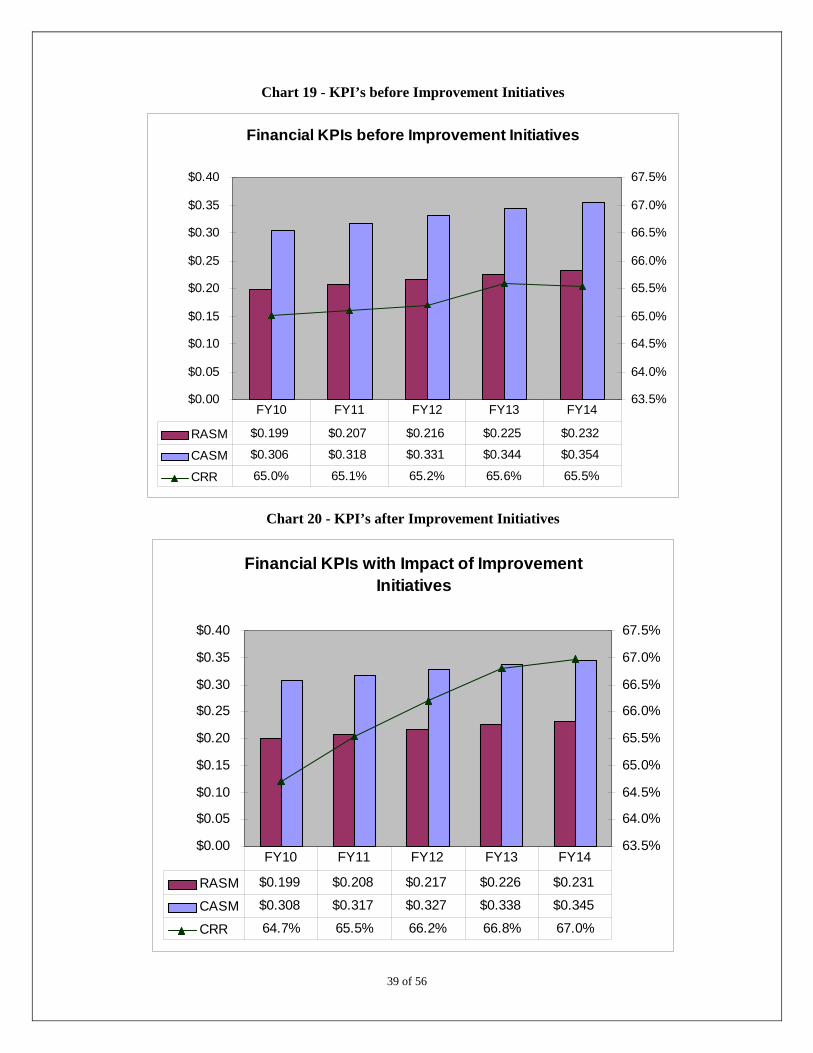
Chart 19 - KPI’s before Improvement Initiatives
Financial KPIs before Improvement Initiatives
$0.00
$0.05
$0.10
$0.15
$0.20
$0.25
$0.30
$0.35
$0.40
63.5%
64.0%
64.5%
65.0%
65.5%
66.0%
66.5%
67.0%
67.5%
RASM $0.199 $0.207 $0.216 $0.225 $0.232
CASM $0.306 $0.318 $0.331 $0.344 $0.354
CRR 65.0% 65.1% 65.2% 65.6% 65.5%
FY10 FY11 FY12 FY13 FY14
Chart 20 - KPI’s after Improvement Initiatives
39 of 56
Financial KPIs with Impact of Improvement Initiatives
$0.00
$0.05
$0.10
$0.15
$0.20
$0.25
$0.30
$0.35
$0.40
63.5%
64.0%
64.5%
65.0%
65.5%
66.0%
66.5%
67.0%
67.5%
RASM $0.199 $0.208 $0.217 $0.226 $0.231
CASM $0.308 $0.317 $0.327 $0.338 $0.345
CRR 64.7% 65.5% 66.2% 66.8% 67.0%
FY10 FY11 FY12 FY13 FY14
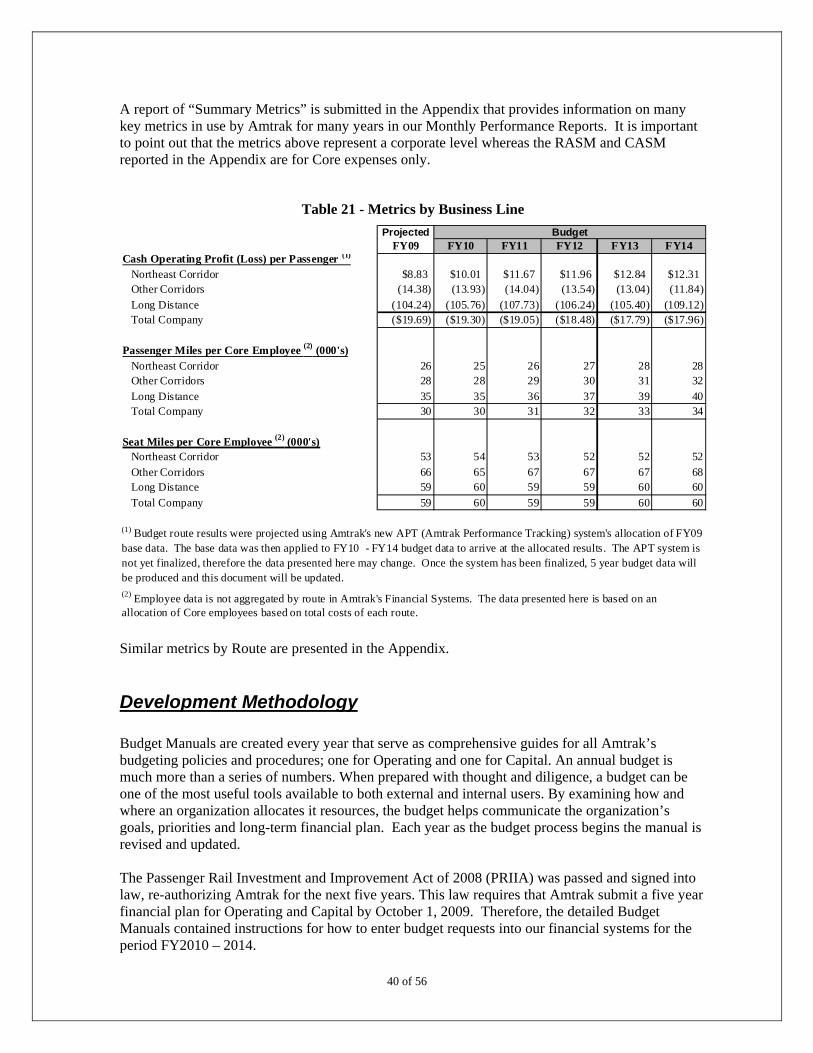
A report of “Summary Metrics” is submitted in the Appendix that provides information on many key metrics in use by Amtrak for many years in our Monthly Performance Reports. It is important to point out that the metrics above represent a corporate level whereas the RASM and CASM reported in the Appendix are for Core expenses only.
Table 21 - Metrics by Business Line
ProjectedFY09 FY10 FY11 FY12 FY13 FY14
Northeast Corridor $8.83 $10.01 $11.67 $11.96 $12.84 $12.31Other Corridors (14.38) (13.93) (14.04) (13.54) (13.04) (11.84)
Long Distance (104.24) (105.76) (107.73) (106.24) (105.40) (109.12) Total Company ($19.69) ($19.30) ($19.05) ($18.48) ($17.79) ($17.96)
Northeast Corridor 26 25 26 27 28 28Other Corridors 28 28 29 30 31 3
Long Distance 35 35 36 37 39 40Total Company 30 30 31 32 33 3
Northeast Corridor 53 54 53 52 52 52Other Corridors 66 65 67 67 67 6Long Distance 59 60 59 59 60 60
Total Company 59 60 59 59 60 6
(1) Budget route results were projected using Amtrak's new APT (Amtrak Performance Tracking) system's allocation of FY09 base data. The base data was then applied to FY10 - FY14 budget data to arrive at the allocated results. The APT system is not yet finalized, therefore the data presented here may change. Once the system has been finalized, 5 year budget data will be produced and this document will be updated.(2) Employee data is not aggregated by route in Amtrak's Financial Systems. The data presented here is based on an allocation of Core employees based on total costs of each route.
Budget
Cash Operating Profit (Loss) per Passenger
2
4
8
0
(1)
Passenger Miles per Core Employee (2) (000's)
Seat Miles per Core Employee (2) (000's)
Similar metrics by Route are presented in the Appendix.
Development Methodology Budget Manuals are created every year that serve as comprehensive guides for all Amtrak’s budgeting policies and procedures; one for Operating and one for Capital. An annual budget is much more than a series of numbers. When prepared with thought and diligence, a budget can be one of the most useful tools available to both external and internal users. By examining how and where an organization allocates it resources, the budget helps communicate the organization’s goals, priorities and long-term financial plan. Each year as the budget process begins the manual is revised and updated.
40 of 56
The Passenger Rail Investment and Improvement Act of 2008 (PRIIA) was passed and signed into law, re-authorizing Amtrak for the next five years. This law requires that Amtrak submit a five year financial plan for Operating and Capital by October 1, 2009. Therefore, the detailed Budget Manuals contained instructions for how to enter budget requests into our financial systems for the period FY2010 – 2014.
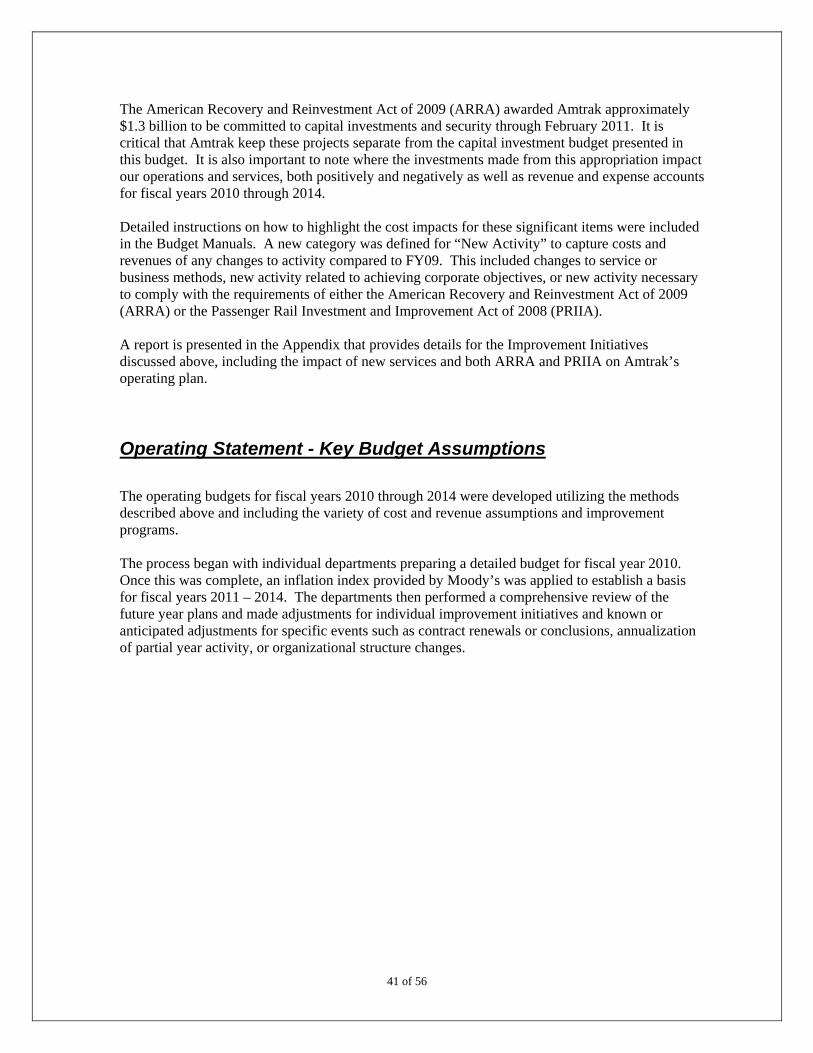
The American Recovery and Reinvestment Act of 2009 (ARRA) awarded Amtrak approximately $1.3 billion to be committed to capital investments and security through February 2011. It is critical that Amtrak keep these projects separate from the capital investment budget presented in this budget. It is also important to note where the investments made from this appropriation impact our operations and services, both positively and negatively as well as revenue and expense accounts for fiscal years 2010 through 2014. Detailed instructions on how to highlight the cost impacts for these significant items were included in the Budget Manuals. A new category was defined for “New Activity” to capture costs and revenues of any changes to activity compared to FY09. This included changes to service or business methods, new activity related to achieving corporate objectives, or new activity necessary to comply with the requirements of either the American Recovery and Reinvestment Act of 2009 (ARRA) or the Passenger Rail Investment and Improvement Act of 2008 (PRIIA). A report is presented in the Appendix that provides details for the Improvement Initiatives discussed above, including the impact of new services and both ARRA and PRIIA on Amtrak’s operating plan.
Operating Statement - Key Budget Assumptions
The operating budgets for fiscal years 2010 through 2014 were developed utilizing the methods described above and including the variety of cost and revenue assumptions and improvement programs. The process began with individual departments preparing a detailed budget for fiscal year 2010. Once this was complete, an inflation index provided by Moody’s was applied to establish a basis for fiscal years 2011 – 2014. The departments then performed a comprehensive review of the future year plans and made adjustments for individual improvement initiatives and known or anticipated adjustments for specific events such as contract renewals or conclusions, annualization of partial year activity, or organizational structure changes.
41 of 56
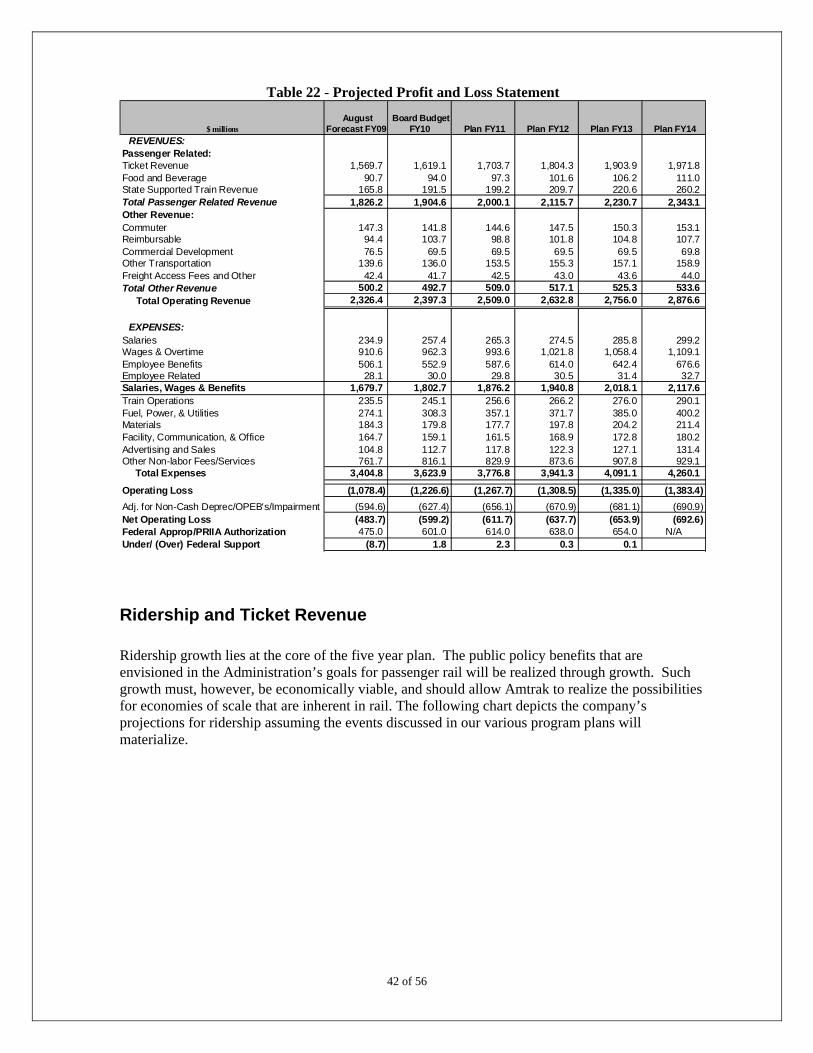
Table 22 - Projected Profit and Loss Statement
$ millions
REVENUES:Passenger Related:Ticket Revenue 1,569.7 1,619.1 1,703.7 1,804.3 1,903.9 1,971.8Food and Beverage 90.7 94.0 97.3 101.6 106.2 111.0State Supported Train Revenue 165.8 191.5 199.2 209.7 220.6 260.2Total Passenger Related Revenue 1,826.2 1,904.6 2,000.1 2,115.7 2,230.7 2,343.1Other Revenue:Commuter 147.3 141.8 144.6 147.5 150.3 153.1Reimbursable 94.4 103.7 98.8 101.8 104.8 107.7Commercial Development 76.5 69.5 69.5 69.5 69.5 69.8Other Transportation 139.6 136.0 153.5 155.3 157.1 158.9Freight Access Fees and Other 42.4 41.7 42.5 43.0 43.6 44.0Total Other Revenue 500.2 492.7 509.0 517.1 525.3 533.6
Total Operating Revenue 2,326.4 2,397.3 2,509.0 2,632.8 2,756.0 2,876.6
EXPENSES:Salaries 234.9 257.4 265.3 274.5 285.8 299.2Wages & Overtime 910.6 962.3 993.6 1,021.8 1,058.4 1,109.1Employee Benefits 506.1 552.9 587.6 614.0 642.4 676.6Employee Related 28.1 30.0 29.8 30.5 31.4 32.7Salaries, Wages & Benefits 1,679.7 1,802.7 1,876.2 1,940.8 2,018.1 2,117.6Train Operations 235.5 245.1 256.6 266.2 276.0 290.1Fuel, Power, & Utilities 274.1 308.3 357.1 371.7 385.0 400.2Materials 184.3 179.8 177.7 197.8 204.2 211.4Facility, Communication, & Office 164.7 159.1 161.5 168.9 172.8 180.2Advertising and Sales 104.8 112.7 117.8 122.3 127.1 131.4Other Non-labor Fees/Services 761.7 816.1 829.9 873.6 907.8 929.1 Total Expenses 3,404.8 3,623.9 3,776.8 3,941.3 4,091.1 4,260.1
Operating Loss (1,078.4) (1,226.6) (1,267.7) (1,308.5) (1,335.0) (1,383.4)
Adj. for Non-Cash Deprec/OPEB's/Impairment (594.6) (627.4) (656.1) (670.9) (681.1) (690.9)Net Operating Loss (483.7) (599.2) (611.7) (637.7) (653.9) (692.6)Federal Approp/PRIIA Authorization 475.0 601.0 614.0 638.0 654.0 N/AUnder/ (Over) Federal Support (8.7) 1.8 2.3 0.3 0.1
Plan FY13 Plan FY14 Plan FY12 Board Budget
FY10 August
Forecast FY09 Plan FY11
Ridership and Ticket Revenue Ridership growth lies at the core of the five year plan. The public policy benefits that are envisioned in the Administration’s goals for passenger rail will be realized through growth. Such growth must, however, be economically viable, and should allow Amtrak to realize the possibilities for economies of scale that are inherent in rail. The following chart depicts the company’s projections for ridership assuming the events discussed in our various program plans will materialize.
42 of 56

Chart 23 – Ridership Trends (millions)
0.
5.
10.
15.
20.
25.
30.
Ridership
TOTAL 25.8 28.7 27.2 27.5 28.5 29.7 30.7 31.4
Long Distance 3.8 4.2 4.4 4.2 4.3 4.5 4.7 4.8
State Supported 12.1 13.6 13.0 13.4 13.9 14.5 15.0 15.3
NEC 10.0 10.9 9.8 9.9 10.3 10.7 11.1 11.3
FY07 FY08FY09 Aug Fcst
FY10 Budget
FY11 Plan
FY12 Plan
FY13 Plan
FY14 Plan
Passenger Revenue, including ticket sales, was developed with the assistance of AECOM Consulting. AECOM employs a complex model that takes into account numerous factors such as population growth, shifts, and preferences, travel industry competition including the price of gasoline, economic conditions, service schedules, and proposed pricing actions. The synergy between favorable market conditions, weakened travel competition, and improved/expanded Amtrak train services resulted in continuous and significant Amtrak ticket revenue growth from 2003 through 2008. FY09 ticket revenues will fall short of FY08 levels by about 7% due to the recession, growing unemployment, continuing relatively low gasoline prices, and weakened consumer confidence which combined to reduce business and leisure travel in FY09. Amtrak is well positioned to support ridership, revenue and market share growth during FY10-FY14, with expected growth of ticket revenue by more than 20% over the five year period, exceeding $2 billion annually by FY14. This growth is attributed to several factors, including steady but modest market and demographic growth ($170-175 million), recovery from recession beginning in FY11 ($214 million), and continued targeted fare increases ($460 million). Disruptions due to replacement of the deteriorating concrete ties on the NEC will result in revenue decline of $60 million between FY10 and FY12, followed by a $40 million revenue gain in FY13-14 due to the restoration of schedules and trip times after replacement is completed.
43 of 56

In addition to these factors and other improvement initiatives previously discussed, the company is engaging in proactive efforts to increase passenger revenue, including:
Incremental Marketing Spending – Continued investments to leverage marketing capabilities will be critical to meeting top line revenue objectives. Driving Amtrak’s Air/Rail market share in the NEC above 60% in the Washington-New York market and above 50% in the New York-Boston market will remain a key objective, as will increasing market share of total trips in all high frequency corridors. To achieve those objectives of increasing ridership and market share, an additional $38.5M will be spent from FY10-14 to increase advertising and sales promotion to portray Amtrak as a viable transportation alternative to first time travelers. These expanded marketing elements are budgeted to contribute an incremental $66.0M of ticket revenue over this period.
Rail Europe Partnership - Rail Europe is the largest seller of tickets and passes on the European trains. Amtrak has established a relationship with Rail Europe that will enable Amtrak to sell tickets to the Rail Europe customer base, beginning in FY10. Revenue contribution from this channel is expected to $8.5M over the next five years. Launch of eTicketing - The eTicketing program will modernize customer reservations systems and ticketing procedures and transform ticket validation and revenue accounting from a paper based system to an electronic system. Incremental revenue contributions of $13.8M are expected annually after the complete rollout of all phases of this project in FY12 with total revenue contribution of $58.0M from FY10-14. Revenue Workbench - Enhancement of current web based decision support software to identify and analyze fare data for future departures based off of specific criteria. The enhancements in software will enable revenue analysts to review additional trains and contribute $1.8M in revenue from FY11-14.
44 of 56
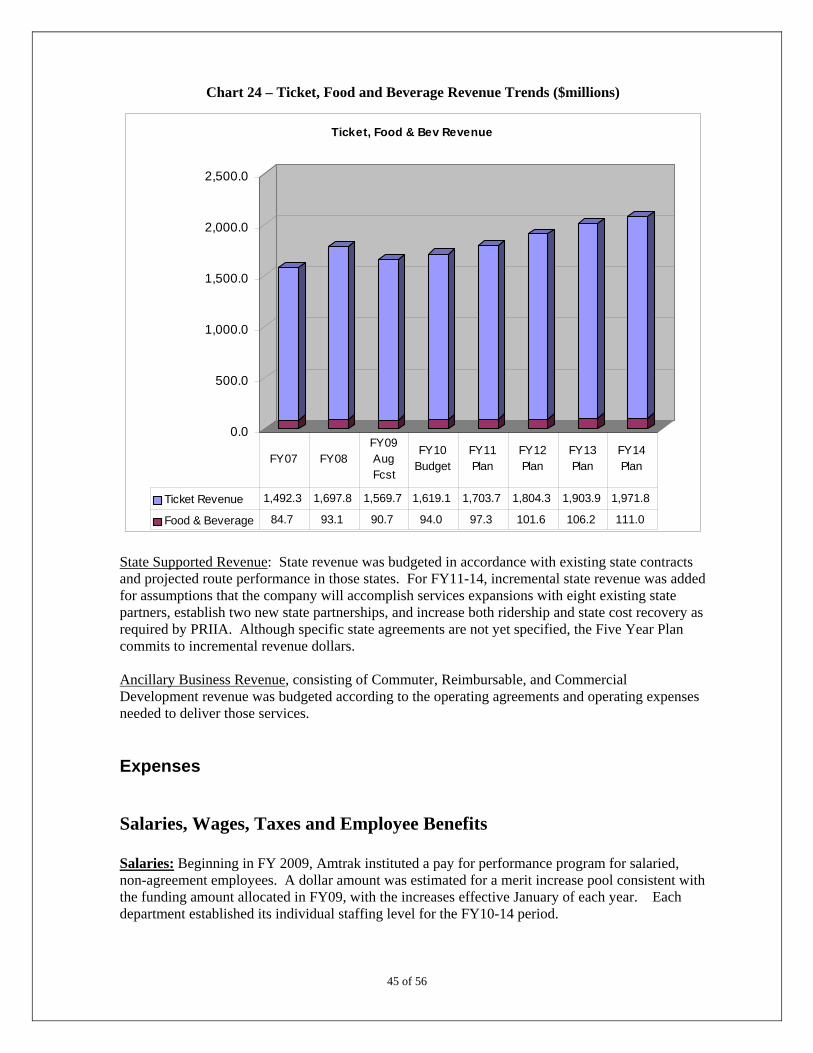
Chart 24 – Ticket, Food and Beverage Revenue Trends ($millions)
0.0
500.0
1,000.0
1,500.0
2,000.0
2,500.0
Ticket, Food & Bev Revenue
Ticket Revenue 1,492.3 1,697.8 1,569.7 1,619.1 1,703.7 1,804.3 1,903.9 1,971.8
Food & Beverage 84.7 93.1 90.7 94.0 97.3 101.6 106.2 111.0
FY07 FY08FY09 Aug Fcst
FY10 Budget
FY11 Plan
FY12 Plan
FY13 Plan
FY14 Plan
State Supported Revenue: State revenue was budgeted in accordance with existing state contracts and projected route performance in those states. For FY11-14, incremental state revenue was added for assumptions that the company will accomplish services expansions with eight existing state partners, establish two new state partnerships, and increase both ridership and state cost recovery as required by PRIIA. Although specific state agreements are not yet specified, the Five Year Plan commits to incremental revenue dollars. Ancillary Business Revenue, consisting of Commuter, Reimbursable, and Commercial Development revenue was budgeted according to the operating agreements and operating expenses needed to deliver those services.
Expenses
Salaries, Wages, Taxes and Employee Benefits Salaries: Beginning in FY 2009, Amtrak instituted a pay for performance program for salaried, non-agreement employees. A dollar amount was estimated for a merit increase pool consistent with the funding amount allocated in FY09, with the increases effective January of each year. Each department established its individual staffing level for the FY10-14 period.
45 of 56

Wages: Wage rates are governed by labor agreements through December 2009. After this time, new contracts must be reached to establish actual labor rates. Planned labor rates include all wage increases established by existing contracts. In addition, the planned rates assume an average wage increase in July 2010 based on guidance from Labor Relations and similar annual increases for FY11-14. Labor rates are applied to man-hours budgeted by individual departments to establish labor dollars. Generally, base man-hours in future years are budgeted equal to FY10, with adjustments for known and anticipated changes in activity, including service changes and improvement initiatives. Employee Benefits; Employee benefit costs were calculated using total planned payroll expense across all business activity including capital and reimbursable projects. Planning for tax and benefit costs was assisted by AON Consulting and was planned in accordance with projected participation in each plan and the projected costs of those plans. Railroad taxes were planned in accordance with the prevailing tax rates.
Chart 25 – Salaries, Wages, Taxes and Benefits ($millions)
$0.0
$200.0
$400.0
$600.0
$800.0
$1,000.0
$1,200.0
Salaries 234.9 257.4 265.3 274.5 285.8 299.2
Wages & OT 910.6 962.3 993.6 1,021.8 1,058.4 1,109.1
Employee Benefits 534.2 582.9 617.3 644.5 673.8 709.3
FY09 Aug Fcst
FY10 Budget
FY11 Plan
FY12 Plan
FY13 Plan
FY14 Plan
Fuel, Power and Utilities
46 of 56
Train Propulsion: Electricity to power electric locomotives operating in the NEC was budgeted in accordance with contractual power costs and projected consumption based on the service schedule. Amtrak’s existing contracts for electric propulsion power expire near the end of fiscal 2010, and the new contracts are expected to result in significantly higher rates. Accordingly, the FY11-14 budgets provide for cost increases between $27M and $30M annually compared to FY10, representing a rate increase of approximately 33% from FY10.
Gallon consumption of diesel fuel to power the off-corridor diesel locomotives was planned in accordance with the service schedule and historical per-mile consumption statistics. The basic price per gallon was developed using the Energy Information Agency’s (U.S. Department of Energy) long term outlook published in March 2009. Diesel fuel prices at Amtrak vary by geographic region due to the sourcing, delivery and transportation options available in each area, and these market variances were accounted for.
In FY08, the company embarked upon an initiative to improve diesel train fuel economy. These efforts have resulted in several conservation strategies, and as a result the FY10-14 budget was reduced by nearly 10 million gallons compared to previous consumptions standards.
Chart 26 – Diesel Fuel
$0.00
$0.50
$1.00
$1.50
$2.00
$2.50
$3.00
Co
st p
er G
allo
n
$0
$20
$40
$60
$80
$100
$120
$140
Co
st p
er B
arre
l
Diesel Cost PerGallon
$1.84 $2.14 $2.31 $2.47 $2.63 $2.80
Cost Per Barrel $57 $84 $93 $102 $110 $119
FY09 Aug Fcst
FY10 Budget
FY11 Plan
FY12 Plan
FY13 Plan
FY14 Plan
Utilities: FY10 utility budgets were developed with the assistance of energy management consultant AdvantageIQ (AIQ). During FY09, AIQ was retained to audit and process for payment the company’s utility bills and, as part of that effort, compiled an extensive database of Amtrak’s usage history and price agreements. That database was used to provide the company with a detailed, metric driven utility budget based on projected consumption and unit prices. In addition, the company is engaged in several energy conservation efforts that are reducing utility consumption. As a result, the FY10 utility budget is 4% less than FY09 for comparable operations. This reduction remains throughout the FY10-14 plan.
47 of 56
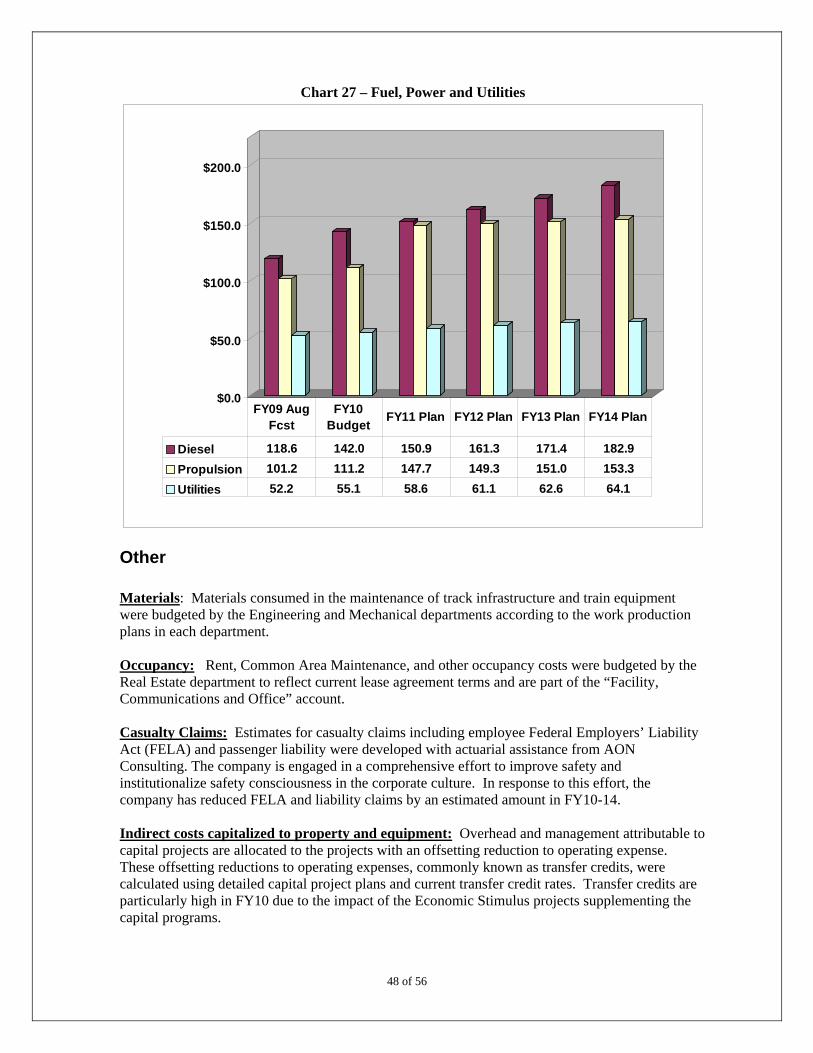
Chart 27 – Fuel, Power and Utilities
$0.0
$50.0
$100.0
$150.0
$200.0
Diesel 118.6 142.0 150.9 161.3 171.4 182.9
Propulsion 101.2 111.2 147.7 149.3 151.0 153.3
Utilities 52.2 55.1 58.6 61.1 62.6 64.1
FY09 Aug Fcst
FY10 Budget
FY11 Plan FY12 Plan FY13 Plan FY14 Plan
Other Materials: Materials consumed in the maintenance of track infrastructure and train equipment were budgeted by the Engineering and Mechanical departments according to the work production plans in each department. Occupancy: Rent, Common Area Maintenance, and other occupancy costs were budgeted by the Real Estate department to reflect current lease agreement terms and are part of the “Facility, Communications and Office” account. Casualty Claims: Estimates for casualty claims including employee Federal Employers’ Liability Act (FELA) and passenger liability were developed with actuarial assistance from AON Consulting. The company is engaged in a comprehensive effort to improve safety and institutionalize safety consciousness in the corporate culture. In response to this effort, the company has reduced FELA and liability claims by an estimated amount in FY10-14. Indirect costs capitalized to property and equipment: Overhead and management attributable to capital projects are allocated to the projects with an offsetting reduction to operating expense. These offsetting reductions to operating expenses, commonly known as transfer credits, were calculated using detailed capital project plans and current transfer credit rates. Transfer credits are particularly high in FY10 due to the impact of the Economic Stimulus projects supplementing the capital programs.
48 of 56
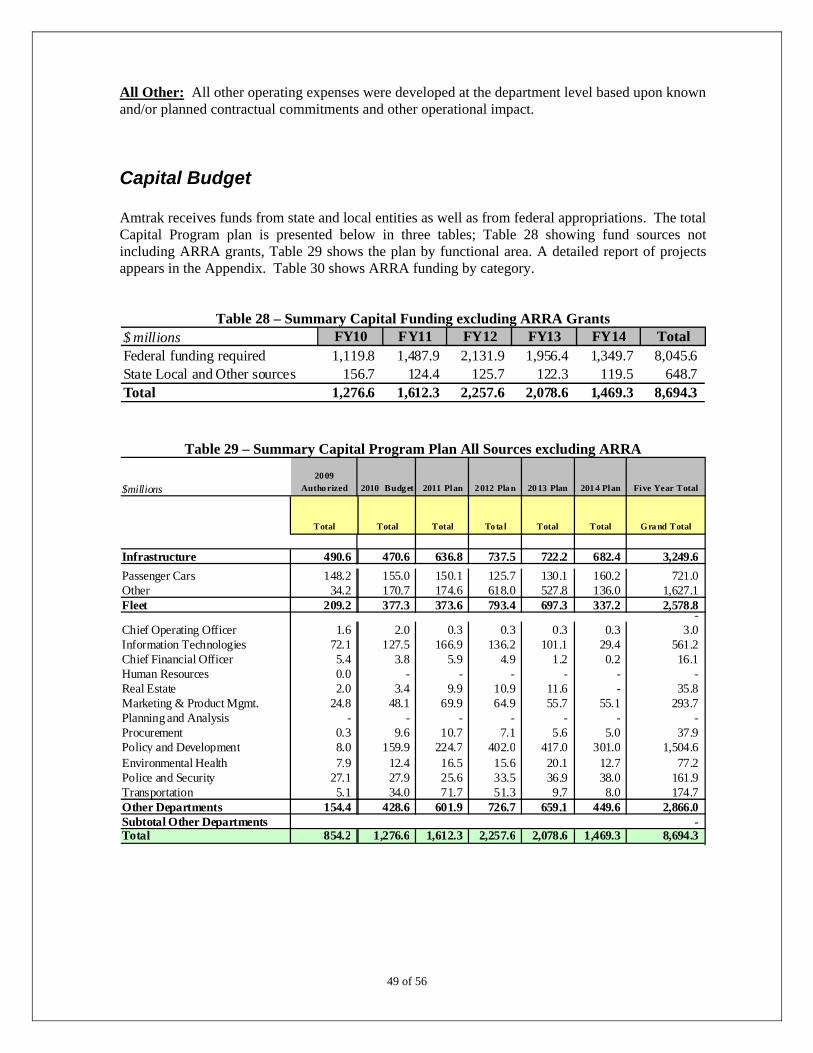
All Other: All other operating expenses were developed at the department level based upon known and/or planned contractual commitments and other operational impact.
Capital Budget Amtrak receives funds from state and local entities as well as from federal appropriations. The total Capital Program plan is presented below in three tables; Table 28 showing fund sources not including ARRA grants, Table 29 shows the plan by functional area. A detailed report of projects appears in the Appendix. Table 30 shows ARRA funding by category.
Table 28 – Summary Capital Funding excluding ARRA Grants $ millions FY10 FY11 FY12 FY13 FY14 TotalFederal funding required 1,119.8 1,487.9 2,131.9 1,956.4 1,349.7 8,045.6 State Local and Other sources 156.7 124.4 125.7 122.3 119.5 648.7 Total 1,276.6 1,612.3 2,257.6 2,078.6 1,469.3 8,694.3
Table 29 – Summary Capital Program Plan All Sources excluding ARRA
$millions
Total Total Total Tota l Total Total Gra nd Total
Infrastructure 490.6 470.6 636.8 737.5 722.2 682.4 3,249.6 Passenger Cars 148.2 155.0 150.1 125.7 130.1 160.2 721.0 Other 34.2 170.7 174.6 618.0 527.8 136.0 1,627.1 Fleet 209.2 377.3 373.6 793.4 697.3 337.2 2,578.8
- Chief Operating Officer 1.6 2.0 0.3 0.3 0.3 0.3 3.0 Information Technologies 72.1 127.5 166.9 136.2 101.1 29.4 561.2 Chief Financial Officer 5.4 3.8 5.9 4.9 1.2 0.2 16.1 Human Resources 0.0 - - - - - - Real Estate 2.0 3.4 9.9 10.9 11.6 - 35.8 Marketing & Product Mgmt. 24.8 48.1 69.9 64.9 55.7 55.1 293.7 Planning and Analysis - - - - - - - Procurement 0.3 9.6 10.7 7.1 5.6 5.0 37.9 Policy and Development 8.0 159.9 224.7 402.0 417.0 301.0 1,504.6 Environmental Health 7.9 12.4 16.5 15.6 20.1 12.7 77.2 Police and Security 27.1 27.9 25.6 33.5 36.9 38.0 161.9 Transportation 5.1 34.0 71.7 51.3 9.7 8.0 174.7 Other Departments 154.4 428.6 601.9 726.7 659.1 449.6 2,866.0 Subtotal Other Departments - Total 854.2 1,276.6 1,612.3 2,257.6 2,078.6 1,469.3 8,694.3
2010 Budget2009
Autho rized 2011 Plan 2012 Pla n 20 13 Plan 201 4 Plan Five Year Total
49 of 56
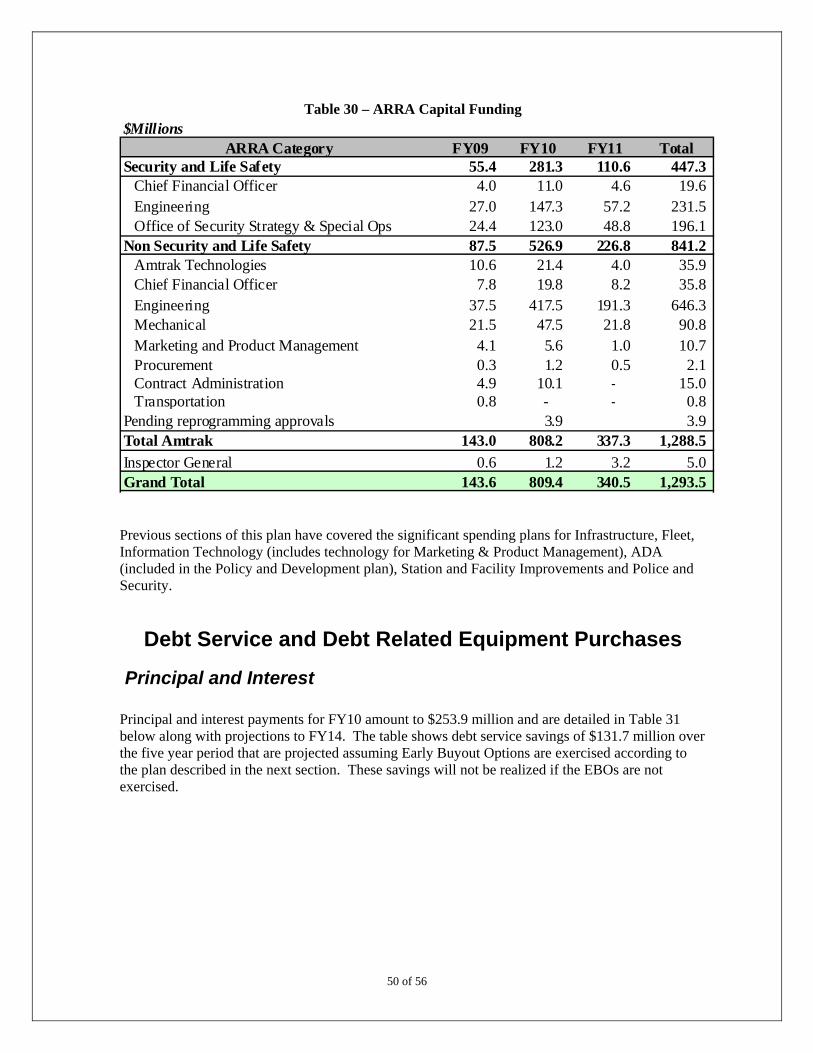
Table 30 – ARRA Capital Funding
$MillionsARRA Category FY09 FY10 FY11 Total
Security and Life Safety 55.4 281.3 110.6 447.3 Chief Financial Officer 4.0 11.0 4.6 19.6 Engineering 27.0 147.3 57.2 231.5 Office of Security Strategy & Special Ops 24.4 123.0 48.8 196.1
Non Security and Life Safety 87.5 526.9 226.8 841.2 Amtrak Technologies 10.6 21.4 4.0 35.9 Chief Financial Officer 7.8 19.8 8.2 35.8 Engineering 37.5 417.5 191.3 646.3 Mechanical 21.5 47.5 21.8 90.8 Marketing and Product Management 4.1 5.6 1.0 10.7 Procurement 0.3 1.2 0.5 2.1 Contract Administration 4.9 10.1 - 15.0 Transportation 0.8 - - 0.8
Pending reprogramming approvals 3.9 3.9 Total Amtrak 143.0 808.2 337.3 1,288.5
Inspector General 0.6 1.2 3.2 5.0 Grand Total 143.6 809.4 340.5 1,293.5
Previous sections of this plan have covered the significant spending plans for Infrastructure, Fleet, Information Technology (includes technology for Marketing & Product Management), ADA (included in the Policy and Development plan), Station and Facility Improvements and Police and Security.
Debt Service and Debt Related Equipment Purchases
Principal and Interest
50 of 56
Principal and interest payments for FY10 amount to $253.9 million and are detailed in Table 31 below along with projections to FY14. The table shows debt service savings of $131.7 million over the five year period that are projected assuming Early Buyout Options are exercised according to the plan described in the next section. These savings will not be realized if the EBOs are not exercised.
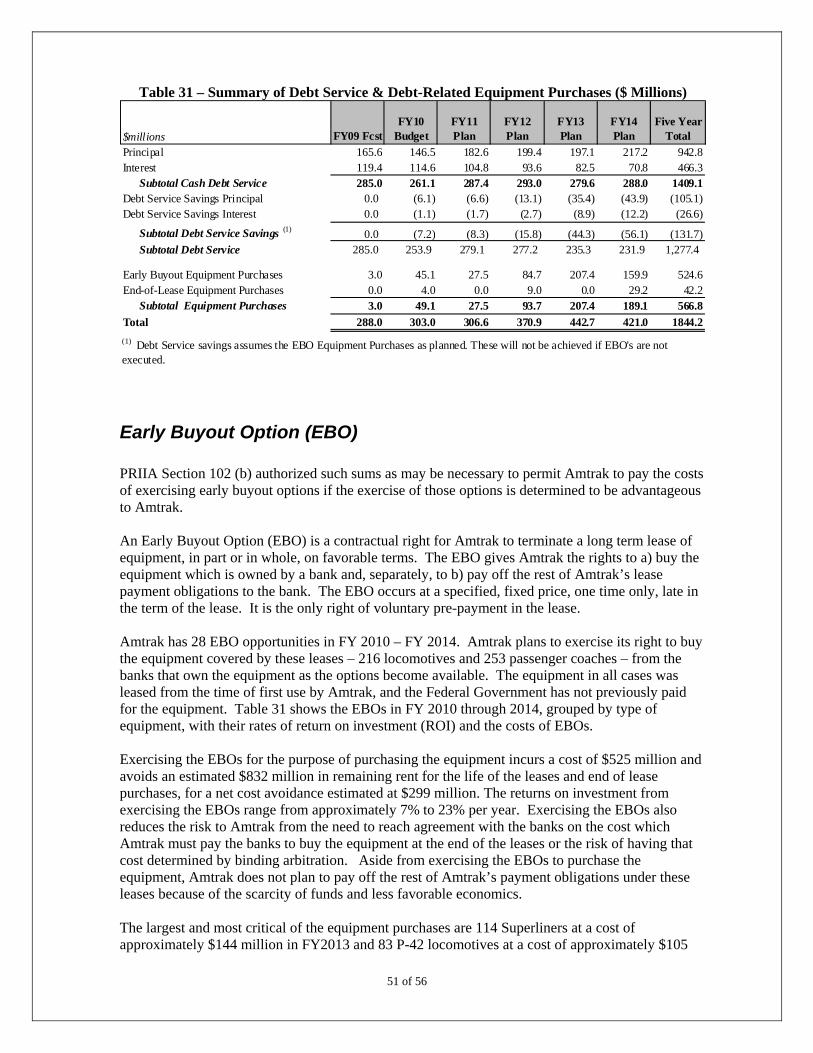
Table 31 – Summary of Debt Service & Debt-Related Equipment Purchases ($ Millions)
$millions FY09 FcstFY10
BudgetFY11 Plan
FY12 Plan
FY13 Plan
FY14 Plan
Five Year Total
Principal 165.6 146.5 182.6 199.4 197.1 217.2 942.8Interest 119.4 114.6 104.8 93.6 82.5 70.8 466.3
Subtotal Cash Debt Service 285.0 261.1 287.4 293.0 279.6 288.0 1409.1Debt Service Savings Principal 0.0 (6.1) (6.6) (13.1) (35.4) (43.9) (105.1)Debt Service Savings Interest 0.0 (1.1) (1.7) (2.7) (8.9) (12.2) (26.6)
Subtotal Debt Service Savings (1) 0.0 (7.2) (8.3) (15.8) (44.3) (56.1) (131.7)Subtotal Debt Service 285.0 253.9 279.1 277.2 235.3 231.9 1,277.4
Early Buyout Equipment Purchases 3.0 45.1 27.5 84.7 207.4 159.9 524.6End-of-Lease Equipment Purchases 0.0 4.0 0.0 9.0 0.0 29.2 42.2
Subtotal Equipment Purchases 3.0 49.1 27.5 93.7 207.4 189.1 566.8
Total 288.0 303.0 306.6 370.9 442.7 421.0 1844.2
(1) Debt Service savings assumes the EBO Equipment Purchases as planned. These will not be achieved if EBO's are not executed.
Early Buyout Option (EBO) PRIIA Section 102 (b) authorized such sums as may be necessary to permit Amtrak to pay the costs of exercising early buyout options if the exercise of those options is determined to be advantageous to Amtrak. An Early Buyout Option (EBO) is a contractual right for Amtrak to terminate a long term lease of equipment, in part or in whole, on favorable terms. The EBO gives Amtrak the rights to a) buy the equipment which is owned by a bank and, separately, to b) pay off the rest of Amtrak’s lease payment obligations to the bank. The EBO occurs at a specified, fixed price, one time only, late in the term of the lease. It is the only right of voluntary pre-payment in the lease. Amtrak has 28 EBO opportunities in FY 2010 – FY 2014. Amtrak plans to exercise its right to buy the equipment covered by these leases – 216 locomotives and 253 passenger coaches – from the banks that own the equipment as the options become available. The equipment in all cases was leased from the time of first use by Amtrak, and the Federal Government has not previously paid for the equipment. Table 31 shows the EBOs in FY 2010 through 2014, grouped by type of equipment, with their rates of return on investment (ROI) and the costs of EBOs. Exercising the EBOs for the purpose of purchasing the equipment incurs a cost of $525 million and avoids an estimated $832 million in remaining rent for the life of the leases and end of lease purchases, for a net cost avoidance estimated at $299 million. The returns on investment from exercising the EBOs range from approximately 7% to 23% per year. Exercising the EBOs also reduces the risk to Amtrak from the need to reach agreement with the banks on the cost which Amtrak must pay the banks to buy the equipment at the end of the leases or the risk of having that cost determined by binding arbitration. Aside from exercising the EBOs to purchase the equipment, Amtrak does not plan to pay off the rest of Amtrak’s payment obligations under these leases because of the scarcity of funds and less favorable economics.
51 of 56
The largest and most critical of the equipment purchases are 114 Superliners at a cost of approximately $144 million in FY2013 and 83 P-42 locomotives at a cost of approximately $105
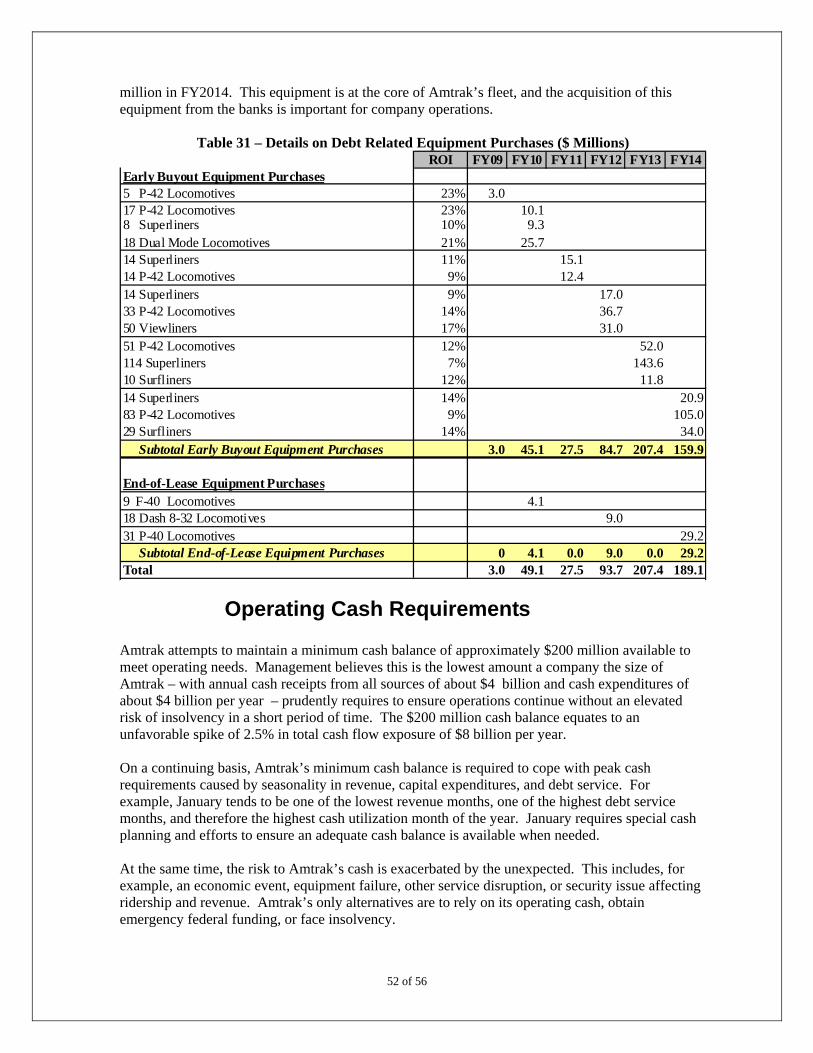
million in FY2014. This equipment is at the core of Amtrak’s fleet, and the acquisition of this equipment from the banks is important for company operations.
Table 31 – Details on Debt Related Equipment Purchases ($ Millions)
ROI FY09 FY10 FY11 FY12 FY13 FY14Early Buyout Equipment Purchases5 P-42 Locomotives 23% 3.017 P-42 Locomotives 23% 10.18 Superliners 10% 9.318 Dual Mode Locomotives 21% 25.714 Superliners 11% 15.114 P-42 Locomotives 9% 12.414 Superliners 9% 17.033 P-42 Locomotives 14% 36.750 Viewliners 17% 31.051 P-42 Locomotives 12% 52.0114 Superliners 7% 143.610 Surfliners 12% 11.814 Superliners 14% 20.983 P-42 Locomotives 9% 105.029 Surfliners 14% 34.0 Subtotal Early Buyout Equipment Purchases 3.0 45.1 27.5 84.7 207.4 159.9
End-of-Lease Equipment Purchases9 F-40 Locomotives 4.118 Dash 8-32 Locomotives 9.031 P-40 Locomotives 29.2 Subtotal End-of-Lease Equipment Purchases 0 4.1 0.0 9.0 0.0 29.2Total 3.0 49.1 27.5 93.7 207.4 189.1
Operating Cash Requirements Amtrak attempts to maintain a minimum cash balance of approximately $200 million available to meet operating needs. Management believes this is the lowest amount a company the size of Amtrak – with annual cash receipts from all sources of about $4 billion and cash expenditures of about $4 billion per year – prudently requires to ensure operations continue without an elevated risk of insolvency in a short period of time. The $200 million cash balance equates to an unfavorable spike of 2.5% in total cash flow exposure of $8 billion per year. On a continuing basis, Amtrak’s minimum cash balance is required to cope with peak cash requirements caused by seasonality in revenue, capital expenditures, and debt service. For example, January tends to be one of the lowest revenue months, one of the highest debt service months, and therefore the highest cash utilization month of the year. January requires special cash planning and efforts to ensure an adequate cash balance is available when needed. At the same time, the risk to Amtrak’s cash is exacerbated by the unexpected. This includes, for example, an economic event, equipment failure, other service disruption, or security issue affecting ridership and revenue. Amtrak’s only alternatives are to rely on its operating cash, obtain emergency federal funding, or face insolvency.
52 of 56
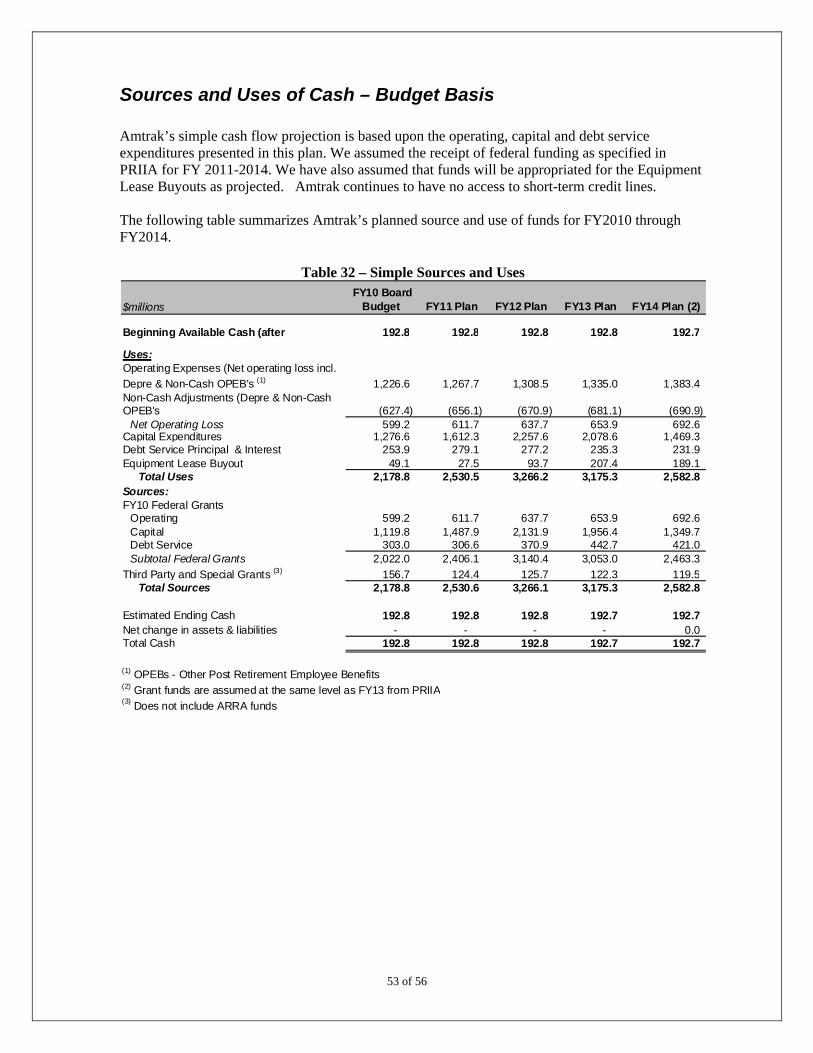
Sources and Uses of Cash – Budget Basis Amtrak’s simple cash flow projection is based upon the operating, capital and debt service expenditures presented in this plan. We assumed the receipt of federal funding as specified in PRIIA for FY 2011-2014. We have also assumed that funds will be appropriated for the Equipment Lease Buyouts as projected. Amtrak continues to have no access to short-term credit lines. The following table summarizes Amtrak’s planned source and use of funds for FY2010 through FY2014.
Table 32 – Simple Sources and Uses
53 of 56
$millionsFY10 Board
Budget FY11 Plan FY12 Plan FY13 Plan FY14 Plan (2)
Beginning Available Cash (after 192.8 192.8 192.8 192.8 192.7
Uses:Operating Expenses (Net operating loss incl.
Depre & Non-Cash OPEB's (1) 1,226.6 1,267.7 1,308.5 1,335.0 1,383.4 Non-Cash Adjustments (Depre & Non-Cash OPEB's (627.4) (656.1) (670.9) (681.1) (690.9)
Net Operating Loss 599.2 611.7 637.7 653.9 692.6 Capital Expenditures 1,276.6 1,612.3 2,257.6 2,078.6 1,469.3 Debt Service Principal & Interest 253.9 279.1 277.2 235.3 231.9 Equipment Lease Buyout 49.1 27.5 93.7 207.4 189.1
Total Uses 2,178.8 2,530.5 3,266.2 3,175.3 2,582.8 Sources:FY10 Federal Grants
Operating 599.2 611.7 637.7 653.9 692.6 Capital 1,119.8 1,487.9 2,131.9 1,956.4 1,349.7 Debt Service 303.0 306.6 370.9 442.7 421.0 Subtotal Federal Grants 2,022.0 2,406.1 3,140.4 3,053.0 2,463.3
Third Party and Special Grants (3) 156.7 124.4 125.7 122.3 119.5 Total Sources 2,178.8 2,530.6 3,266.1 3,175.3 2,582.8
Estimated Ending Cash 192.8 192.8 192.8 192.7 192.7 Net change in assets & liabilities - - - - 0.0 Total Cash 192.8 192.8 192.8 192.7 192.7
(1) OPEBs - Other Post Retirement Employee Benefits(2) Grant funds are assumed at the same level as FY13 from PRIIA(3) Does not include ARRA funds

54 of 56
This page intentionally left blank.
55 of 56
National Railroad Passenger Corporation
AMTRAK
FY2010-2014 FIVE YEAR FINANCIAL PLAN
Appendix
Profit and Loss Statement by year by major account Capital Program Projections Net Impact of Improvement Initiatives Summary Metrics Summary Table of Business Line Metrics Projected Cash Operating Profit (Loss) per Passenger Projected Passenger Miles per Core Employee Allocation Projected Seat Miles per Core Employee Allocation

56 of 56
This page intentionally left blank.

$ millionsREVENUES:
Passenger Related:Ticket Revenue 1,569.7 1,619.1 1,703.7 1,804.3 1,903.9 1,971.8Food and Beverage 90.7 94.0 97.3 101.6 106.2 111.0State Supported Train Revenue 165.8 191.5 199.2 209.7 220.6 260.2Total Passenger Related Revenue 1,826.2 1,904.6 2,000.1 2,115.7 2,230.7 2,343.1Other Revenue:Commuter 147.3 141.8 144.6 147.5 150.3 153.1Reimbursable 94.4 103.7 98.8 101.8 104.8 107.7Commercial Development 76.5 69.5 69.5 69.5 69.5 69.8Other Transportation 139.6 136.0 153.5 155.3 157.1 158.9Freight Access Fees and Other 42.4 41.7 42.5 43.0 43.6 44.0Total Other Revenue 500.2 492.7 509.0 517.1 525.3 533.6
Total Operating Revenue 2,326.4 2,397.3 2,509.0 2,632.8 2,756.0 2,876.6
EXPENSES:Salaries 234.9 257.4 265.3 274.5 285.8 299.2Wages & Overtime 910.6 962.3 993.6 1,021.8 1,058.4 1,109.1Employee Benefits 506.1 552.9 587.6 614.0 642.4 676.6Employee Related 28.1 30.0 29.8 30.5 31.4 32.7Salaries, Wages & Benefits 1,679.7 1,802.7 1,876.2 1,940.8 2,018.1 2,117.6Train Operations 235.5 245.1 256.6 266.2 276.0 290.1Fuel, Power, & Utilities 274.1 308.3 357.1 371.7 385.0 400.2Materials 184.3 179.8 177.7 197.8 204.2 211.4Facility, Communication, & Office 164.7 159.1 161.5 168.9 172.8 180.2Advertising and Sales 104.8 112.7 117.8 122.3 127.1 131.4Other Non-labor Fees/Services 761.7 816.1 829.9 873.6 907.8 929.1 Total Expenses 3,404.8 3,623.9 3,776.8 3,941.3 4,091.1 4,260.1
Operating Loss (1,078.4) (1,226.6) (1,267.7) (1,308.5) (1,335.0) (1,383.4)
Adj. for Non-Cash Deprec/OPEB's/Impairment (594.6) (627.4) (656.1) (670.9) (681.1) (690.9)Net Operating Loss (483.7) (599.2) (611.7) (637.7) (653.9) (692.6)Federal Approp/PRIIA Authorization 475.0 601.0 614.0 638.0 654.0 N/AUnder/ (Over) Federal Support (8.7) 1.8 2.3 0.3 0.1
National Railroad Passenger Corporation (Amtrak)Summary Financial
Multi Year Plan FY2010 - 2014
Plan FY13 Plan FY14 Plan FY12 Board
Budget FY10
gForecast
FY09 Plan FY11
Five Year Plan - Appendix 1 of 8

Amtrak Five Year Plan FY2010-FY2014Projected Capital Programs - Not Including ARRA Grant Funds
Federal & Amtrak
Third Party & Special Grants Total
Federal & Amtrak
Third Party & Special Grants Total
Federal & Amtrak
Third Party & Special Grants Total
Federal & Amtrak
Third Party & Special Grants Total
Federal & Amtrak
Third Party & Special Grants Total
Federal & Amtrak
Third Party & Special Grants Total
Federal & Amtrak
Third Party & Special Grants
Grand Total
InfrastructureBridges/Culverts/Tunnels 55.8 8.1 63.9 38.5 6.0 44.5 72.6 15.1 87.7 93.8 20.7 114.5 111.1 27.0 138.1 136.5 35.3 171.9 452.5 104.1 556.6 Facility/Station/Other 22.6 17.9 40.5 23.8 16.9 40.7 82.4 26.4 108.7 160.0 21.4 181.4 153.0 21.4 174.4 115.4 15.1 130.4 534.6 101.0 635.6 Signal Systems 10.3 19.7 30.0 26.5 9.4 35.9 20.0 5.3 25.3 24.5 5.5 30.0 18.9 5.2 24.1 18.8 4.8 23.6 108.7 30.2 138.9 Communication Systems 0.6 - 0.6 2.3 - 2.3 42.3 - 42.3 21.6 - 21.6 21.5 - 21.5 0.9 - 0.9 88.6 - 88.6 Overhead Catenary & Trans. Systems 35.9 5.2 41.1 22.9 2.8 25.7 59.2 4.2 63.4 43.4 3.3 46.7 40.2 2.1 42.4 45.8 2.6 48.3 211.4 15.1 226.5 Substations/Frequency Converters 20.4 9.0 29.4 12.9 4.1 16.9 60.6 18.4 79.0 62.4 26.1 88.5 58.7 37.0 95.7 51.7 35.9 87.5 246.2 121.4 367.7 Track Replacement 150.2 15.4 165.6 132.4 30.8 163.2 119.4 21.5 140.9 123.6 27.7 151.3 122.8 20.0 142.8 121.8 16.7 138.6 620.1 116.6 736.7 Interlocking Renewal 16.6 9.7 26.3 32.2 7.5 39.6 44.7 11.4 56.2 42.3 10.8 53.2 35.5 9.1 44.5 35.5 9.1 44.5 190.1 47.9 238.0 Equipment Purchase/Replacement 21.0 - 21.0 36.9 - 36.9 16.2 1.1 17.3 30.2 0.1 30.3 31.7 0.1 31.8 30.4 0.1 30.5 145.4 1.4 146.8 Freight Railroad Improvements 3.9 - 3.9 3.5 - 3.5 - - - - - - - - - - - - 3.5 - 3.5 Fire & Life Safety 6.4 53.2 59.6 13.0 42.5 55.5 0.6 0.4 1.0 - - - - - - - - - 13.5 42.9 56.5 Seattle King St. Coach Yd 3.0 - 3.0 6.0 - 6.0 15.0 - 15.0 20.0 - 20.0 7.0 - 7.0 6.2 - 6.2 54.2 - 54.2 Wilmington Delaware Station Improv. 3.4 2.3 5.7 - - - - - - - - - - - - - - - - - - Subtotal Infrastructure 350.2 140.4 490.6 350.7 119.9 470.6 532.8 103.9 636.8 622.0 115.5 737.5 600.4 121.9 722.2 562.9 119.5 682.4 2,668.8 580.8 3,249.6
- - - Fleet - - - AMFLEET PROGRAMS 69.9 - 69.9 44.5 - 44.5 41.5 - 41.5 46.2 - 46.2 46.5 - 46.5 60.0 - 60.0 238.7 - 238.7 SUPERLINERS 28.4 1.3 29.7 52.4 (0.0) 52.4 53.2 - 53.2 45.5 - 45.5 44.8 - 44.8 65.1 - 65.1 261.0 (0.0) 261.0 HORIZON/SURFLINER PROGRAMS 15.3 - 15.3 9.8 0.0 9.8 18.1 - 18.1 15.5 - 15.5 16.2 - 16.2 15.4 - 15.4 75.0 0.0 75.0 VIEWLINER PROGRAMS 8.3 - 8.3 6.9 - 6.9 7.8 - 7.8 8.5 - 8.5 8.5 - 8.5 7.8 - 7.8 39.5 - 39.5 TALGO PROGRAMS 0.9 - 0.9 2.0 - 2.0 - - - - - - - - - - - - 2.0 - 2.0 Acela Programs 18.4 - 18.4 37.4 - 37.4 29.5 - 29.5 10.0 - 10.0 10.0 - 10.0 10.0 - 10.0 96.9 - 96.9 Heritage Programs 5.3 - 5.3 1.9 0.0 1.9 - - - - - - 4.0 - 4.0 2.0 - 2.0 7.9 0.0 7.9 Equipment Design & Engineering 0.2 - 0.2 - - - - - - - - - - - - - - - - - - Subtotal Passenger Cars 146.6 1.3 147.9 155.0 0.0 155.0 150.1 - 150.1 125.7 - 125.7 130.1 - 130.1 160.2 - 160.2 721.0 0.0 721.0 Acquisitions - - - 126.2 - 126.2 136.0 - 136.0 582.0 - 582.0 492.0 - 492.0 106.0 - 106.0 1,442.2 - 1,442.2 Locomotives 26.1 - 26.1 51.5 - 51.5 49.0 - 49.0 49.7 - 49.7 39.5 - 39.5 41.0 - 41.0 230.7 - 230.7 Wreck Repair - - - - - - 4.0 - 4.0 4.0 - 4.0 4.0 - 4.0 4.0 - 4.0 16.0 - 16.0 Facility Improvements 10.1 - 10.1 16.5 (0.0) 16.5 17.0 - 17.0 12.5 - 12.5 12.5 - 12.5 12.5 - 12.5 71.0 (0.0) 71.0 Non Passenger Equipment 8.2 - 8.2 3.0 - 3.0 1.3 - 1.3 8.2 - 8.2 8.8 - 8.8 3.0 - 3.0 24.2 - 24.2 Mechanical IT Projects 4.1 - 4.1 4.3 (0.0) 4.3 2.5 - 2.5 2.5 - 2.5 2.5 - 2.5 2.5 - 2.5 14.3 (0.0) 14.3 Mandatory Projects 2.9 - 2.9 4.1 - 4.1 5.0 - 5.0 5.0 - 5.0 5.0 - 5.0 5.0 - 5.0 24.1 - 24.1 General Safety & Reliability 9.9 - 9.9 16.6 0.0 16.6 8.8 - 8.8 3.8 - 3.8 3.0 - 3.0 3.0 - 3.0 35.2 0.0 35.2 Subtotal Fleet 207.9 1.3 209.2 377.3 (0.0) 377.3 373.6 - 373.6 793.4 - 793.4 697.3 - 697.3 337.2 - 337.2 2,578.8 (0.0) 2,578.8
- - - Other Departments - - - Chief Operating Officer 1.6 (0.0) 1.6 2.0 - 2.0 0.3 - 0.3 0.3 - 0.3 0.3 - 0.3 0.2 0.0 0.3 3.0 0.0 3.0 Information Technologies 68.1 4.1 72.1 127.5 (0.0) 127.5 166.9 0.0 166.9 136.2 0.0 136.2 101.1 0.0 101.1 29.4 - 29.4 561.2 (0.0) 561.2 Chief Financial Officer 4.6 0.9 5.4 3.8 0.0 3.8 5.9 - 5.9 4.9 (0.0) 4.9 1.2 0.0 1.2 0.2 - 0.2 16.1 0.0 16.1 Human Resources 0.0 - 0.0 - - - - - - - - - - - - - - - - - - Real Estate 1.8 0.2 2.0 3.4 - 3.4 9.9 - 9.9 10.9 - 10.9 11.6 - 11.6 - - - 35.8 - 35.8 Marketing & Product Mgmt. 11.5 13.3 24.8 45.5 2.7 48.1 69.9 - 69.9 64.9 - 64.9 55.7 - 55.7 55.1 - 55.1 291.0 2.7 293.7 Planning and Analysis - - - - - - - - - - - - - - - - - - - - - Procurement 0.3 - 0.3 9.6 - 9.6 10.7 (0.0) 10.7 7.1 - 7.1 5.6 - 5.6 5.0 - 5.0 37.9 (0.0) 37.9 Policy and Development 2.0 6.0 8.0 151.4 8.5 159.9 224.0 0.7 224.7 402.0 - 402.0 417.0 - 417.0 301.0 - 301.0 1,495.4 9.2 1,504.6 Environmental Health 7.9 - 7.9 12.4 - 12.4 16.5 - 16.5 15.6 - 15.6 20.1 - 20.1 12.7 - 12.7 77.2 - 77.2 Police and Security 4.6 22.4 27.1 2.3 25.6 27.9 5.9 19.8 25.6 23.4 10.2 33.5 36.4 0.4 36.9 38.0 - 38.0 105.9 56.0 161.9 Transportation 5.1 0.0 5.1 34.0 0.0 34.0 71.7 - 71.7 51.3 - 51.3 9.7 - 9.7 8.0 - 8.0 174.7 0.0 174.7 Subtotal Other Departments 107.5 46.9 154.4 391.8 36.8 428.6 581.5 20.5 601.9 716.5 10.2 726.7 658.7 0.4 659.1 449.6 0.0 449.6 2,798.1 67.9 2,866.0 Total 665.6 188.6 854.2 1,119.8 156.7 1,276.6 1,487.9 124.4 1,612.3 2,131.9 125.7 2,257.6 1,956.4 122.3 2,078.6 1,349.7 119.5 1,469.3 8,045.6 648.7 8,694.3
2013 Plan 2014 Plan Five Year Total 2009 Authorized 2010 Budget 2011 Plan 2012 Plan
Five Year Plan - Appendix 2 of 8
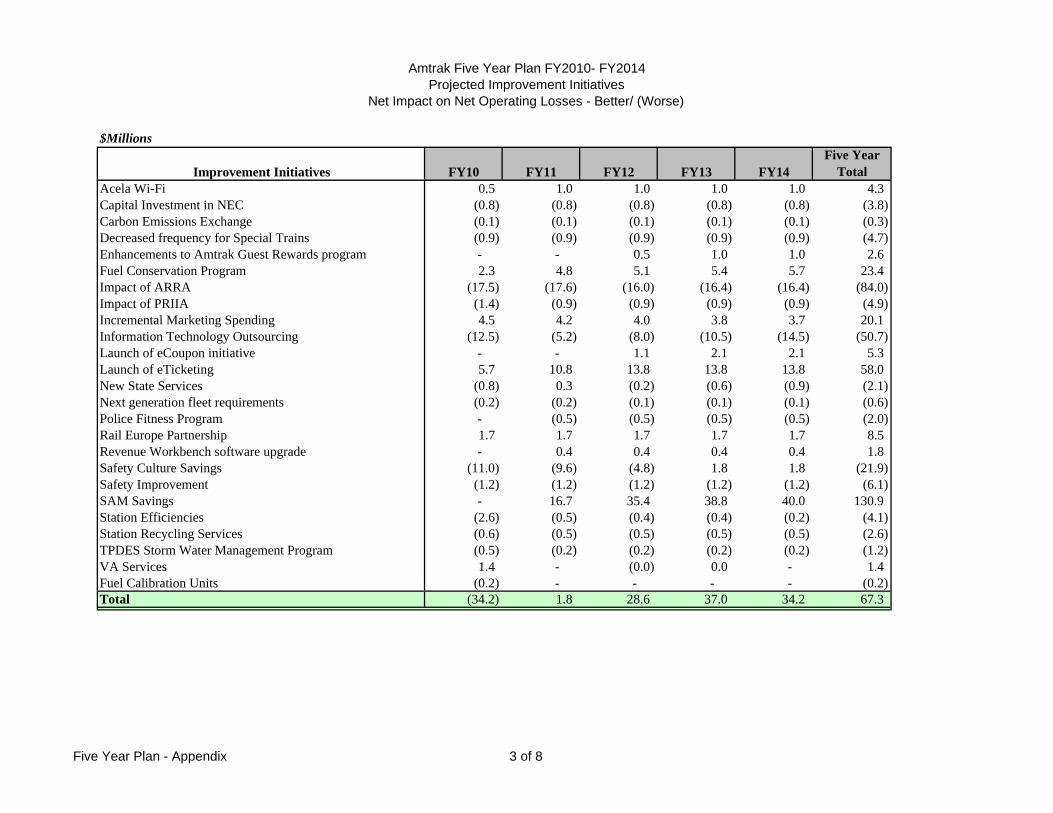
Amtrak Five Year Plan FY2010- FY2014Projected Improvement Initiatives
Net Impact on Net Operating Losses - Better/ (Worse)
$Millions
Improvement Initiatives FY10 FY11 FY12 FY13 FY14Five Year
TotalAcela Wi-Fi 0.5 1.0 1.0 1.0 1.0 4.3 Capital Investment in NEC (0.8) (0.8) (0.8) (0.8) (0.8) (3.8) Carbon Emissions Exchange (0.1) (0.1) (0.1) (0.1) (0.1) (0.3) Decreased frequency for Special Trains (0.9) (0.9) (0.9) (0.9) (0.9) (4.7) Enhancements to Amtrak Guest Rewards program - - 0.5 1.0 1.0 2.6 Fuel Conservation Program 2.3 4.8 5.1 5.4 5.7 23.4 Impact of ARRA (17.5) (17.6) (16.0) (16.4) (16.4) (84.0) Impact of PRIIA (1.4) (0.9) (0.9) (0.9) (0.9) (4.9) Incremental Marketing Spending 4.5 4.2 4.0 3.8 3.7 20.1 Information Technology Outsourcing (12.5) (5.2) (8.0) (10.5) (14.5) (50.7) Launch of eCoupon initiative - - 1.1 2.1 2.1 5.3 Launch of eTicketing 5.7 10.8 13.8 13.8 13.8 58.0 New State Services (0.8) 0.3 (0.2) (0.6) (0.9) (2.1) Next generation fleet requirements (0.2) (0.2) (0.1) (0.1) (0.1) (0.6) Police Fitness Program - (0.5) (0.5) (0.5) (0.5) (2.0) Rail Europe Partnership 1.7 1.7 1.7 1.7 1.7 8.5 Revenue Workbench software upgrade - 0.4 0.4 0.4 0.4 1.8 Safety Culture Savings (11.0) (9.6) (4.8) 1.8 1.8 (21.9) Safety Improvement (1.2) (1.2) (1.2) (1.2) (1.2) (6.1) SAM Savings - 16.7 35.4 38.8 40.0 130.9 Station Efficiencies (2.6) (0.5) (0.4) (0.4) (0.2) (4.1) Station Recycling Services (0.6) (0.5) (0.5) (0.5) (0.5) (2.6) TPDES Storm Water Management Program (0.5) (0.2) (0.2) (0.2) (0.2) (1.2) VA Services 1.4 - (0.0) 0.0 - 1.4 Fuel Calibration Units (0.2) - - - - (0.2) Total (34.2) 1.8 28.6 37.0 34.2 67.3
Five Year Plan - Appendix 3 of 8
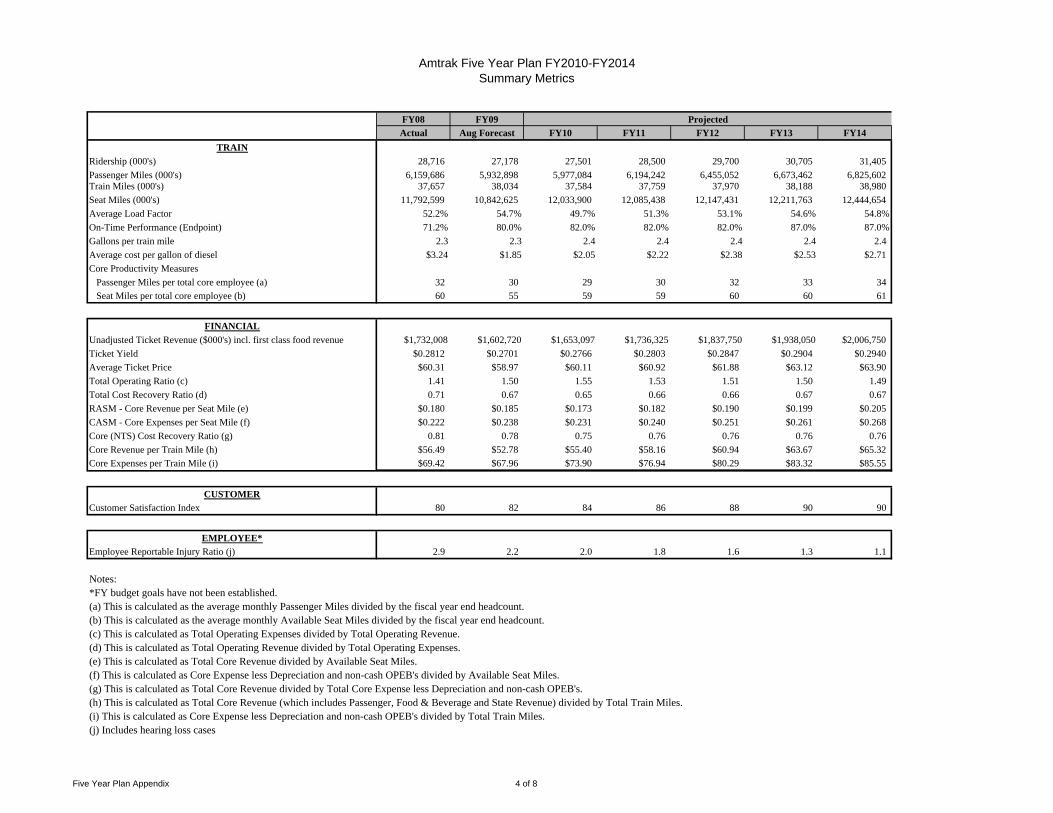
Amtrak Five Year Plan FY2010-FY2014Summary Metrics
FY08 FY09
Actual Aug Forecast FY10 FY11 FY12 FY13 FY14
TRAIN
Ridership (000's) 28,716 27,178 27,501 28,500 29,700 30,705 31,405
Passenger Miles (000's) 6,159,686 5,932,898 5,977,084 6,194,242 6,455,052 6,673,462 6,825,602Train Miles (000's) 37,657 38,034 37,584 37,759 37,970 38,188 38,980
Seat Miles (000's) 11,792,599 10,842,625 12,033,900 12,085,438 12,147,431 12,211,763 12,444,654
Average Load Factor 52.2% 54.7% 49.7% 51.3% 53.1% 54.6% 54.8%
On-Time Performance (Endpoint) 71.2% 80.0% 82.0% 82.0% 82.0% 87.0% 87.0%
Gallons per train mile 2.3 2.3 2.4 2.4 2.4 2.4 2.4
Average cost per gallon of diesel $3.24 $1.85 $2.05 $2.22 $2.38 $2.53 $2.71
Core Productivity Measures
Passenger Miles per total core employee (a) 32 30 29 30 32 33 34
Seat Miles per total core employee (b) 60 55 59 59 60 60 61
FINANCIAL
Unadjusted Ticket Revenue ($000's) incl. first class food revenue $1,732,008 $1,602,720 $1,653,097 $1,736,325 $1,837,750 $1,938,050 $2,006,750
Ticket Yield $0.2812 $0.2701 $0.2766 $0.2803 $0.2847 $0.2904 $0.2940
Average Ticket Price $60.31 $58.97 $60.11 $60.92 $61.88 $63.12 $63.90
Total Operating Ratio (c) 1.41 1.50 1.55 1.53 1.51 1.50 1.49
Total Cost Recovery Ratio (d) 0.71 0.67 0.65 0.66 0.66 0.67 0.67
RASM - Core Revenue per Seat Mile (e) $0.180 $0.185 $0.173 $0.182 $0.190 $0.199 $0.205
CASM - Core Expenses per Seat Mile (f) $0.222 $0.238 $0.231 $0.240 $0.251 $0.261 $0.268
Core (NTS) Cost Recovery Ratio (g) 0.81 0.78 0.75 0.76 0.76 0.76 0.76
Core Revenue per Train Mile (h) $56.49 $52.78 $55.40 $58.16 $60.94 $63.67 $65.32
Core Expenses per Train Mile (i) $69.42 $67.96 $73.90 $76.94 $80.29 $83.32 $85.55
CUSTOMER
Customer Satisfaction Index 80 82 84 86 88 90 90
EMPLOYEE*
Employee Reportable Injury Ratio (j) 2.9 2.2 2.0 1.8 1.6 1.3 1.1
Notes:*FY budget goals have not been established.(a) This is calculated as the average monthly Passenger Miles divided by the fiscal year end headcount.(b) This is calculated as the average monthly Available Seat Miles divided by the fiscal year end headcount.(c) This is calculated as Total Operating Expenses divided by Total Operating Revenue.(d) This is calculated as Total Operating Revenue divided by Total Operating Expenses.(e) This is calculated as Total Core Revenue divided by Available Seat Miles.(f) This is calculated as Core Expense less Depreciation and non-cash OPEB's divided by Available Seat Miles.(g) This is calculated as Total Core Revenue divided by Total Core Expense less Depreciation and non-cash OPEB's.(h) This is calculated as Total Core Revenue (which includes Passenger, Food & Beverage and State Revenue) divided by Total Train Miles.(i) This is calculated as Core Expense less Depreciation and non-cash OPEB's divided by Total Train Miles.(j) Includes hearing loss cases
Projected
Five Year Plan Appendix 4 of 8

ProjectedFY09 FY10 FY11 FY12 FY13 FY14
Northeast Corridor $8.83 $10.01 $11.67 $11.96 $12.84 $12.31Other Corridors (14.38) (13.93) (14.04) (13.54) (13.04) (11.84) Long Distance (104.24) (105.76) (107.73) (106.24) (105.40) (109.12) Total Company ($19.69) ($19.30) ($19.05) ($18.48) ($17.79) ($17.96)
Northeast Corridor 26 25 26 27 28 28Other Corridors 28 28 29 30 31 32Long Distance 35 35 36 37 39 40Total Company 30 30 31 32 33 34
Northeast Corridor 53 54 53 52 52 52Other Corridors 66 65 67 67 67 68Long Distance 59 60 59 59 60 60Total Company 59 60 59 59 60 60
National Railroad Passenger Corporation (Amtrak)
Summary Table of Business Line Metrics
(1) Budget route results were projected using Amtrak's new APT (Amtrak Performance Tracking) system's allocation of FY09 base data. The base data was then applied to FY10 - FY14 budget data to arrive at the allocated results. The APT system is not yet finalized, therefore the data presented here may change. Once the system has been finalized, 5 year budget data will be produced and this document will be updated.(2) Employee data is not aggregated by route in Amtrak's Financial Systems. The data presented here is based on an allocation of Core employees based on total costs of each route.
Budget
Cash Operating Profit (Loss) per Passenger (1)
Passenger Miles per Core Employee (2) (000's)
Seat Miles per Core Employee (2) (000's)
Five Year Plan - Appendix 5 of 8

Route Train FY10 FY11 FY12 FY13 FY14 FY14
RT01 Acela $30.66 $33.39 $35.47 $36.08 $37.90 $37.48
RT05 Regional (2) (1.15) (0.75) 0.28 0.45 0.95 0.40 NEC Spine 8.83 10.01 11.67 11.96 12.84 12.31
RT03 Ethan Allen Express (26.91) (22.57) (22.54) (21.79) (20.71) (17.56) RT04 Vermonter (17.17) (11.17) (11.59) (10.52) (9.23) (4.02) RT07 Maple Leaf (20.76) (23.38) (23.62) (22.63) (21.90) (23.15) RT09 The Downeaster (2.68) (2.51) (2.67) (2.48) (2.12) (0.95) RT12 New Haven - Springfield (36.19) (41.66) (40.23) (41.31) (41.97) (43.18) RT14 Keystone Service (20.82) (22.18) (22.03) (21.90) (21.79) (21.48) RT15 Empire Service (21.57) (23.55) (23.55) (22.94) (22.50) (23.52) RT20 Chicago-St.Louis (20.88) (18.77) (19.14) (18.48) (17.86) (14.89) RT21 Hiawathas (16.32) (17.63) (17.90) (17.54) (17.18) (16.52) RT22 Wolverines (33.40) (36.81) (36.98) (36.44) (36.11) (37.41) RT23 Illini (23.90) (24.47) (24.89) (24.40) (23.88) (22.45) RT24 Illinois Zephyr (29.07) (28.96) (29.36) (28.89) (28.40) (26.10) RT29 Heartland Flyer (26.34) (29.73) (30.31) (29.90) (29.27) (25.30) RT35 Pacific Surfliner (8.10) (8.70) (8.81) (8.41) (8.02) (6.98) RT36 Cascades (4.27) (1.68) (3.03) (2.49) (1.78) 0.86 RT37 Capitols (10.65) (10.45) (10.35) (10.05) (9.64) (7.91) RT39 San Joaquins (9.19) (8.06) (8.12) (7.18) (6.21) (2.26) RT40 Adirondack (16.17) (19.17) (19.24) (18.04) (16.73) (12.32) RT41 Blue Water (20.20) (18.94) (19.05) (18.28) (17.39) (12.74) RT47 New York-Newport News 3.84 10.45 10.77 11.73 12.63 12.23 RT54 Hoosier State (102.06) (103.76) (104.08) (103.81) (104.05) (106.86) RT56 Kansas City-St.Louis (1.43) (2.85) (3.26) (2.23) (1.17) 5.89 RT57 Pennsylvanian (22.42) (25.28) (25.15) (24.56) (24.20) (25.29) RT65 Pere Marquette (11.41) (10.57) (10.57) (9.92) (9.22) (6.35) RT66 Carolinian (13.64) (13.11) (13.02) (11.57) (10.39) (9.65) RT67 Piedmont (21.44) (17.66) (17.27) (16.67) (16.40) (15.37)
State Supported Routes (14.38) (13.93) (14.04) (13.54) (13.04) (11.84) RT16 Silver Star (114.32) (119.92) (121.59) (120.86) (120.70) (124.45) RT18 Cardinal (122.65) (128.82) (129.51) (129.02) (129.24) (133.11) RT19 Silver Meteor (109.11) (113.41) (114.74) (113.66) (113.08) (116.96) RT25 Empire Builder (88.85) (81.97) (84.30) (82.43) (81.10) (84.32) RT26 Capitol Limited (74.05) (80.37) (81.36) (80.13) (79.40) (82.34) RT27 California Zephyr (129.01) (133.58) (137.52) (135.62) (134.57) (139.05) RT28 Southwest Chief (140.02) (144.24) (148.87) (146.97) (145.80) (150.62) RT30 City of New Orleans (87.88) (87.97) (88.89) (87.49) (86.77) (89.83) RT32 Texas Eagle (98.15) (100.75) (102.46) (100.84) (100.19) (103.64) RT33 Sunset Limited (415.80) (418.85) (425.98) (423.80) (424.80) (436.59) RT34 Coast Starlight (79.83) (81.33) (82.90) (81.71) (81.08) (84.12) RT45 Lake Shore Limited (77.64) (72.86) (73.35) (72.25) (71.62) (74.27) RT48 Palmetto (69.15) (69.09) (68.88) (68.71) (68.50) (70.93) RT52 Crescent (116.98) (125.31) (126.53) (125.66) (125.34) (129.42) RT63 Auto Train (56.89) (56.77) (59.12) (54.69) (51.00) (55.04)
Long Distance Routes (104.24) (105.76) (107.73) (106.24) (105.40) (109.12) - - - -
All Routes (19.69)$ (19.30)$ (19.05)$ (18.48)$ (17.79)$ (17.96)$
National Railroad Passenger Corporation (Amtrak)
Five Year Projected Cash Operating Profit (Loss) per Passenger (1)
(1) Budget route results were projected using Amtrak's new APT (Amtrak Performance Tracking) system's allocation of FY09 base data. The base data was then applied to FY10 - FY14 budget data to arrive at the allocated results. The APT system is not yet finalized, therefore the data presented here may change. Once the
t h b fi li d 5 b d t d t ill b d d d thi d t ill b d t d(2) Includes new Virginia State Service.
Projected
6 of 8
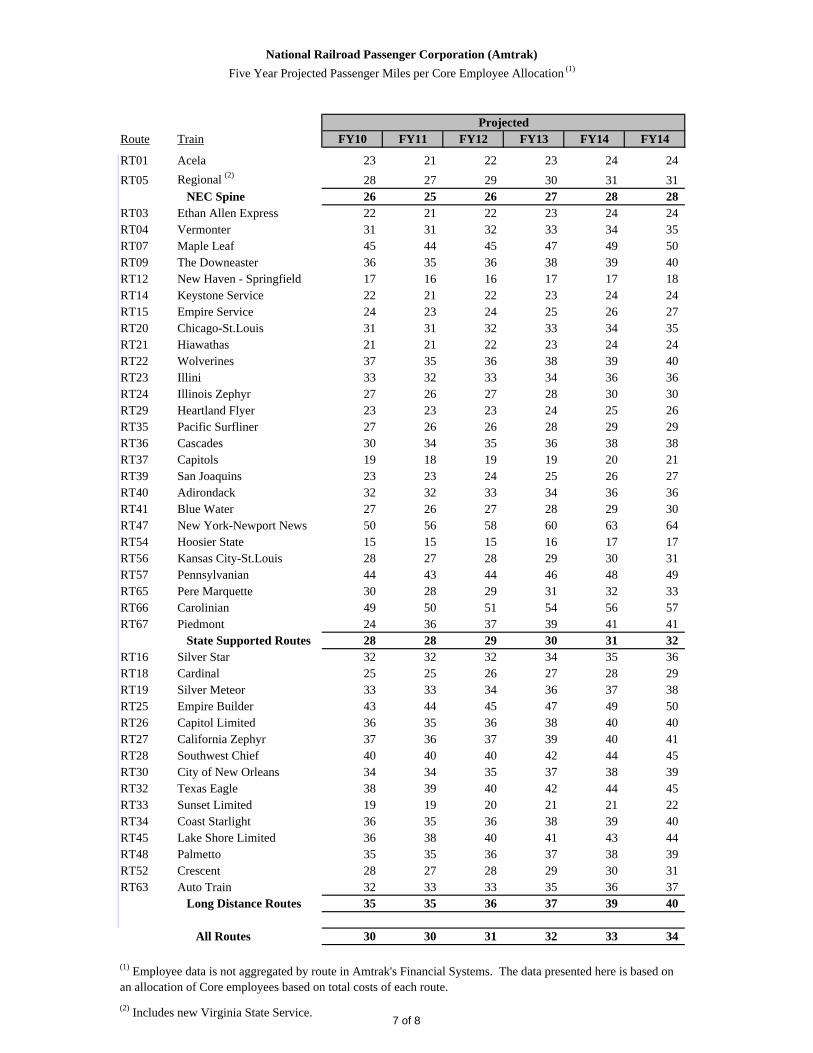
Route Train FY10 FY11 FY12 FY13 FY14 FY14
RT01 Acela 23 21 22 23 24 24
RT05 Regional (2) 28 27 29 30 31 31 NEC Spine 26 25 26 27 28 28
RT03 Ethan Allen Express 22 21 22 23 24 24 RT04 Vermonter 31 31 32 33 34 35 RT07 Maple Leaf 45 44 45 47 49 50 RT09 The Downeaster 36 35 36 38 39 40 RT12 New Haven - Springfield 17 16 16 17 17 18 RT14 Keystone Service 22 21 22 23 24 24 RT15 Empire Service 24 23 24 25 26 27 RT20 Chicago-St.Louis 31 31 32 33 34 35 RT21 Hiawathas 21 21 22 23 24 24 RT22 Wolverines 37 35 36 38 39 40 RT23 Illini 33 32 33 34 36 36 RT24 Illinois Zephyr 27 26 27 28 30 30 RT29 Heartland Flyer 23 23 23 24 25 26 RT35 Pacific Surfliner 27 26 26 28 29 29 RT36 Cascades 30 34 35 36 38 38 RT37 Capitols 19 18 19 19 20 21 RT39 San Joaquins 23 23 24 25 26 27 RT40 Adirondack 32 32 33 34 36 36 RT41 Blue Water 27 26 27 28 29 30 RT47 New York-Newport News 50 56 58 60 63 64 RT54 Hoosier State 15 15 15 16 17 17 RT56 Kansas City-St.Louis 28 27 28 29 30 31 RT57 Pennsylvanian 44 43 44 46 48 49 RT65 Pere Marquette 30 28 29 31 32 33 RT66 Carolinian 49 50 51 54 56 57 RT67 Piedmont 24 36 37 39 41 41
State Supported Routes 28 28 29 30 31 32 RT16 Silver Star 32 32 32 34 35 36 RT18 Cardinal 25 25 26 27 28 29 RT19 Silver Meteor 33 33 34 36 37 38 RT25 Empire Builder 43 44 45 47 49 50 RT26 Capitol Limited 36 35 36 38 40 40 RT27 California Zephyr 37 36 37 39 40 41 RT28 Southwest Chief 40 40 40 42 44 45 RT30 City of New Orleans 34 34 35 37 38 39 RT32 Texas Eagle 38 39 40 42 44 45 RT33 Sunset Limited 19 19 20 21 21 22 RT34 Coast Starlight 36 35 36 38 39 40 RT45 Lake Shore Limited 36 38 40 41 43 44 RT48 Palmetto 35 35 36 37 38 39 RT52 Crescent 28 27 28 29 30 31 RT63 Auto Train 32 33 33 35 36 37
Long Distance Routes 35 35 36 37 39 40
All Routes 30 30 31 32 33 34
National Railroad Passenger Corporation (Amtrak)
Five Year Projected Passenger Miles per Core Employee Allocation (1)
(1) Employee data is not aggregated by route in Amtrak's Financial Systems. The data presented here is based on an allocation of Core employees based on total costs of each route.
(2) Includes new Virginia State Service.
Projected
7 of 8

Route Train FY10 FY11 FY12 FY13 FY14 FY14
RT01 Acela 39 38 38 38 38 38
RT05 Regional (2) 62 65 64 63 63 63 NEC Spine 53 54 53 52 52 52
RT03 Ethan Allen Express 55 54 54 54 54 54 RT04 Vermonter 71 67 66 66 67 67 RT07 Maple Leaf 86 84 83 84 84 84 RT09 The Downeaster 106 107 106 106 107 107 RT12 New Haven - Springfield 36 34 35 34 34 34 RT14 Keystone Service 59 58 58 57 58 58 RT15 Empire Service 72 70 70 70 70 70 RT20 Chicago-St.Louis 67 63 63 63 64 64 RT21 Hiawathas 53 51 51 52 53 55 RT22 Wolverines 68 67 66 67 67 67 RT23 Illini 67 64 64 64 64 64 RT24 Illinois Zephyr 60 58 58 58 58 58 RT29 Heartland Flyer 50 51 51 52 53 56 RT35 Pacific Surfliner 80 78 78 78 79 79 RT36 Cascades 55 62 63 64 65 69 RT37 Capitols 67 67 67 67 67 67 RT39 San Joaquins 62 62 62 62 63 64 RT40 Adirondack 46 46 46 46 46 46 RT41 Blue Water 39 40 40 40 40 40 RT47 New York-Newport News 86 83 124 124 125 125 RT54 Hoosier State 40 39 39 39 39 39 RT56 Kansas City-St.Louis 73 71 70 71 71 71 RT57 Pennsylvanian 60 57 57 57 58 57 RT65 Pere Marquette 42 42 42 42 42 42 RT66 Carolinian 65 65 64 65 65 65 RT67 Piedmont 60 105 109 110 111 111
State Supported Routes 66 65 67 67 67 68 RT16 Silver Star 53 53 53 53 53 53 RT18 Cardinal 44 45 45 45 45 45 RT19 Silver Meteor 54 55 54 55 55 55 RT25 Empire Builder 72 73 72 72 72 72 RT26 Capitol Limited 52 52 52 52 52 52 RT27 California Zephyr 69 69 68 69 69 69 RT28 Southwest Chief 66 66 64 65 65 65 RT30 City of New Orleans 54 53 53 53 54 54 RT32 Texas Eagle 70 73 73 73 73 73 RT33 Sunset Limited 34 34 34 34 34 34 RT34 Coast Starlight 59 60 59 59 60 59 RT45 Lake Shore Limited 60 60 60 60 60 60 RT48 Palmetto 72 70 70 70 70 70 RT52 Crescent 54 54 54 54 54 54 RT63 Auto Train 51 51 50 51 51 51
Long Distance Routes 59 60 59 59 60 60
All Routes 59 60 59 59 60 60
National Railroad Passenger Corporation (Amtrak)
Five Year Projected Seat Miles per Core Employee Allocation (1)
(1) Employee data is not aggregated by route in Amtrak's Financial Systems. The data presented here is based on an allocation of Core employees based on total costs of each route.
(2) Includes new Virginia State Service.
Projected
8 of 8