national energy outlook of the netherlands 2014 - irenairena.org/eventdocs/session 1d_michiel...
TRANSCRIPT
www.ecn.nl
National energy outlook of the Netherlands 2014Michiel Hekkenberg and Martijn Verdonk
Abu Dhabi3 June 2015

Content
• ECN• Context• Goal and approach• National Energy Outlook
Modeling System• Results• Conclusion
2

Energy research centre of the Netherlands
• Strategic & Technological studiesCreating insights in energy technology and policy
• Problem solvingUsing knowledge, technology, and facilities to solve our clients’ issues
• Technology developmentDeveloping technology into prototypes and industrial application
• Not for profit organisationTier-1-supplier for Dutch government on energy policy
3

The Dutch energy context
• Fossil fuels dominant, gas exporting• Energy ports and refineries• Energy intensive industries & refineries
make up 12,4% of GDP• Densely populated; modest available area
for renewable energy• Small share renewable energy (2.3% in
2005, to 4.5% in 2013)• Significant installed wind power capacity
Photo Ad Meskens
Photo Rik Schuiling
4
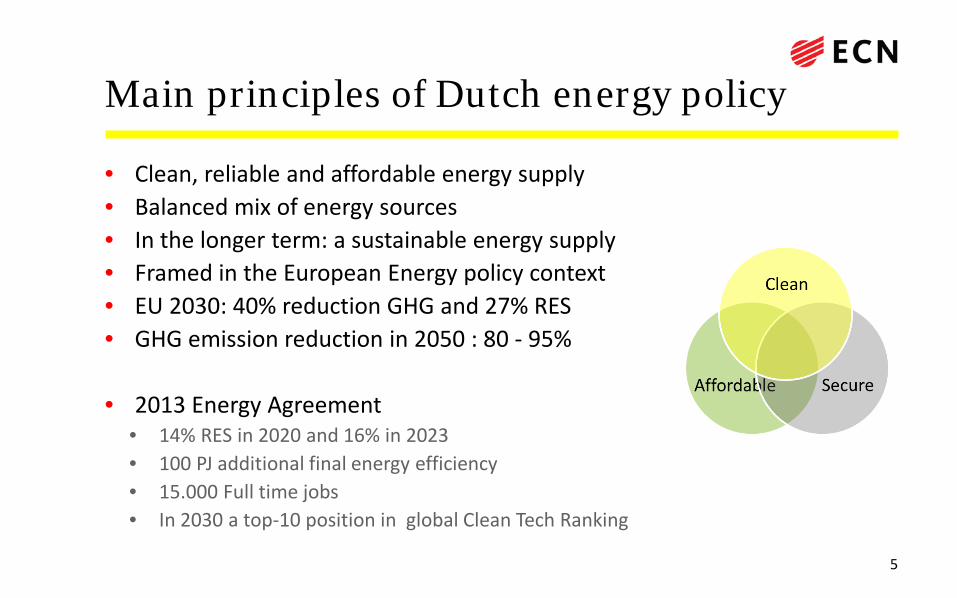
Main principles of Dutch energy policy
• Clean, reliable and affordable energy supply• Balanced mix of energy sources• In the longer term: a sustainable energy supply• Framed in the European Energy policy context• EU 2030: 40% reduction GHG and 27% RES• GHG emission reduction in 2050 : 80 - 95%
• 2013 Energy Agreement • 14% RES in 2020 and 16% in 2023• 100 PJ additional final energy efficiency• 15.000 Full time jobs• In 2030 a top-10 position in global Clean Tech Ranking
5
National Energy Outlook (NEO)
• Goal– Providing a factual, complete, integrally consistent, quantitative overview of the
current state of affairs of and future expectations for the Dutch energy system, embedded in the developments in the surrounding world
• Use– Data for reporting obligations– Observed distances to targets mark areas for increased policy attention– Reference baseline for policy assessments
– Set of up-to-date energy models available for additional analyses
6
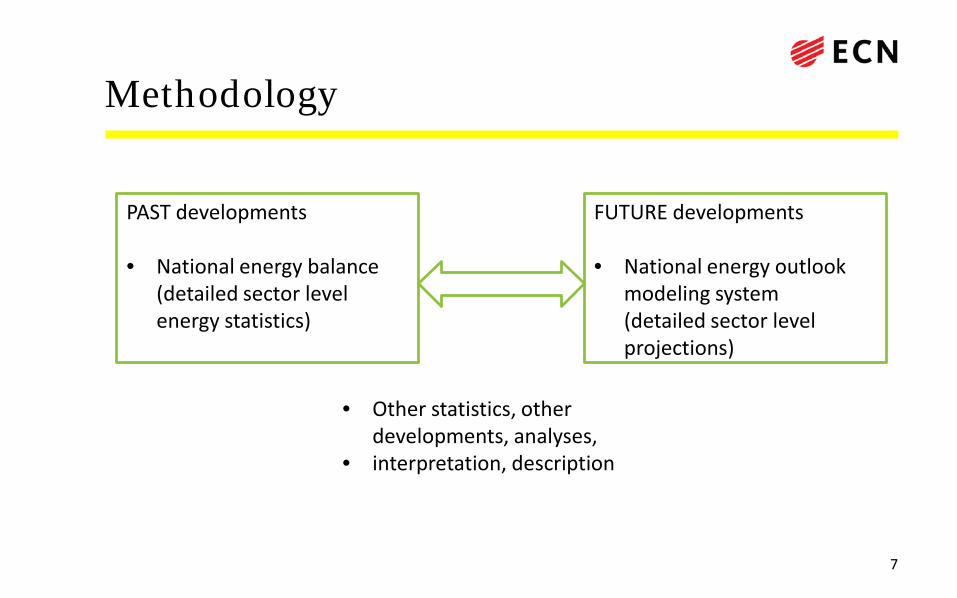
Methodology
PAST developments
• National energy balance(detailed sector level energy statistics)
FUTURE developments
• National energy outlook modeling system(detailed sector level projections)
• Other statistics, otherdevelopments, analyses,
• interpretation, description
7
Methodology
• External developments– Energy prices– Economic development– Development and policy in neighbouring countries
• Two variants of policy and measures– Existing policies and measures– Intended policies and measures
• Uncertainties: margins
8
Data and cooperation
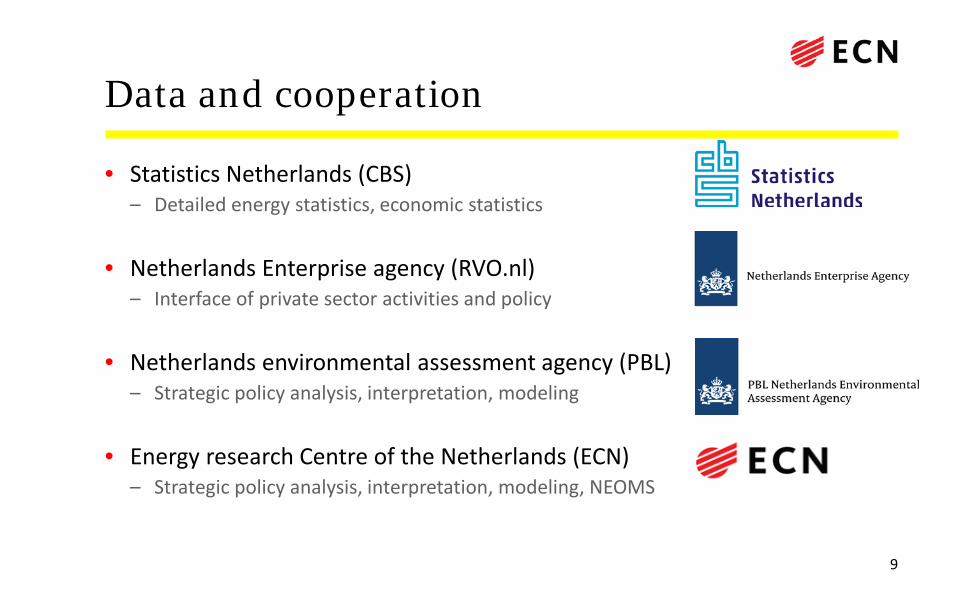
• Statistics Netherlands (CBS)– Detailed energy statistics, economic statistics
• Netherlands Enterprise agency (RVO.nl)– Interface of private sector activities and policy
• Netherlands environmental assessment agency (PBL)– Strategic policy analysis, interpretation, modeling
• Energy research Centre of the Netherlands (ECN)– Strategic policy analysis, interpretation, modeling, NEOMS
9
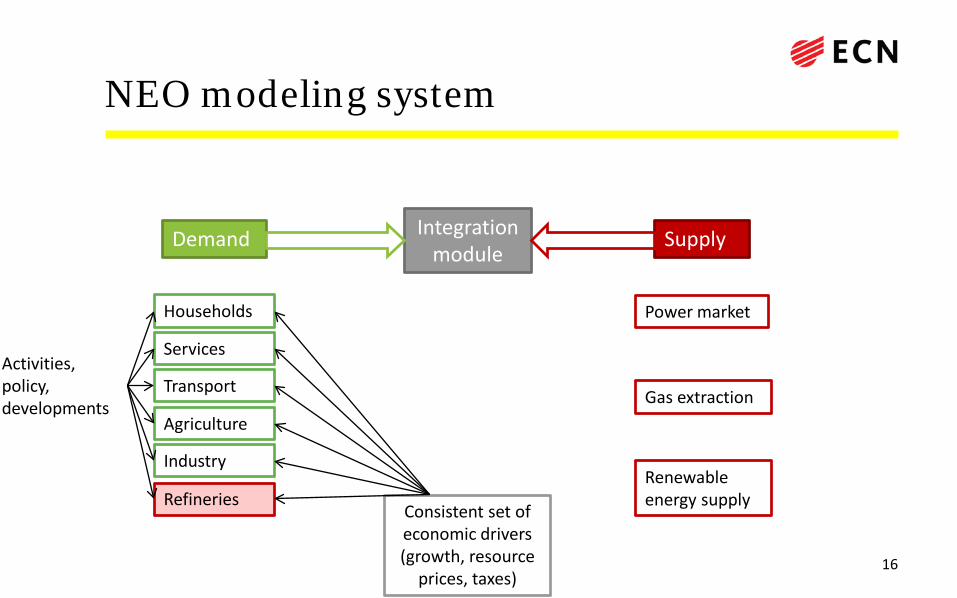
NEO modeling system
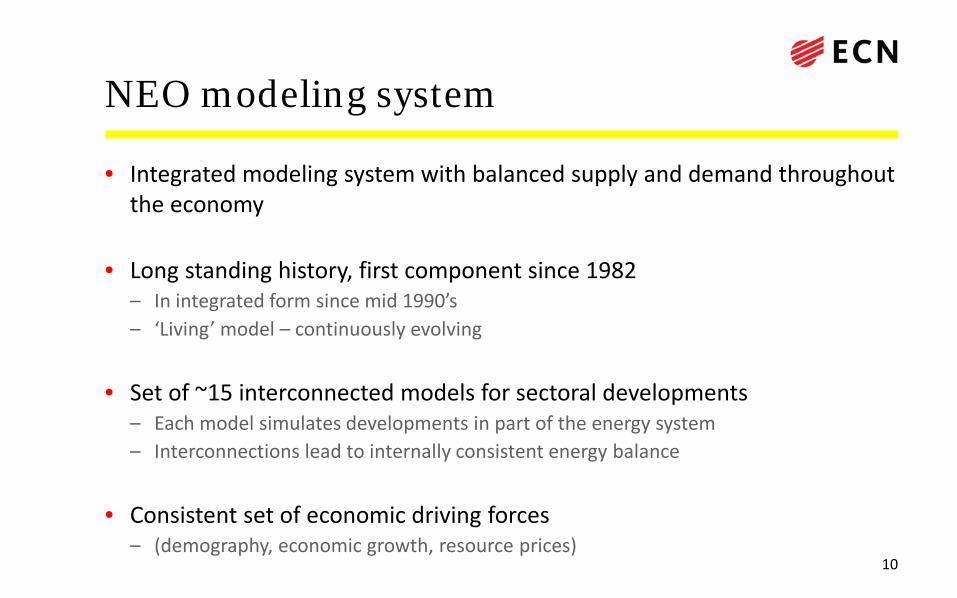
• Integrated modeling system with balanced supply and demand throughoutthe economy
• Long standing history, first component since 1982– In integrated form since mid 1990’s– ‘Living’ model – continuously evolving
• Set of ~15 interconnected models for sectoral developments– Each model simulates developments in part of the energy system– Interconnections lead to internally consistent energy balance
• Consistent set of economic driving forces– (demography, economic growth, resource prices)
10

NEO modeling system
Integration module
Households
Services
Transport
Industry
Agriculture
Refineries
Power market
Gas extraction
Renewableenergy supply
Activities, policy, developments
Activities, policy, developments
Consistent set of economic drivers(growth, resource
prices, taxes)
Database
Prices
SupplyDemand
Postprocessing
Import / export
EVA, investments, employment
11

NEO modeling system
Integration module
SupplyDemand
12
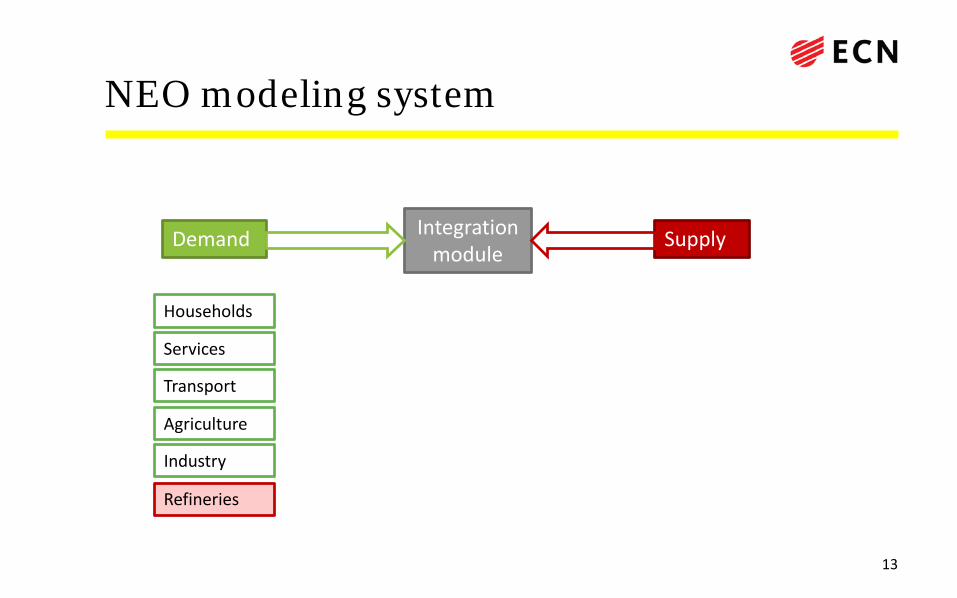
NEO modeling system
Integration module
Households
Services
Transport
Industry
Agriculture
Refineries
SupplyDemand
13

NEO modeling system
Integration module
Households
Services
Transport
Industry
Agriculture
Refineries
Power market
Gas extraction
Renewableenergy supply
SupplyDemand
14

NEO modeling system
Integration module
Households
Services
Transport
Industry
Agriculture
Refineries
Power market
Gas extraction
Renewableenergy supply
Consistent set of economic drivers(growth, resource
prices, taxes)
SupplyDemand
15
NEO modeling system
Integration module
Households
Services
Transport
Industry
Agriculture
Refineries
Power market
Gas extraction
Renewableenergy supply
Activities, policy, developments
Consistent set of economic drivers(growth, resource
prices, taxes)
SupplyDemand
16

NEO modeling system
Integration module
Households
Services
Transport
Industry
Agriculture
Refineries
Power market
Gas extraction
Renewableenergy supply
Consistent set of economic drivers(growth, resource
prices, taxes)
SupplyDemand
17

NEO modeling system
Integration module
Households
Services
Transport
Industry
Agriculture
Refineries
Power market
Gas extraction
Renewableenergy supply
Consistent set of economic drivers(growth, resource
prices, taxes)
Prices
SupplyDemand
Prices
18
NEO modeling system
Integration module
Households
Services
Transport
Industry
Agriculture
Refineries
Power market
Gas extraction
Renewableenergy supply
Consistent set of economic drivers(growth, resource
prices, taxes)
Prices
SupplyDemand
Prices
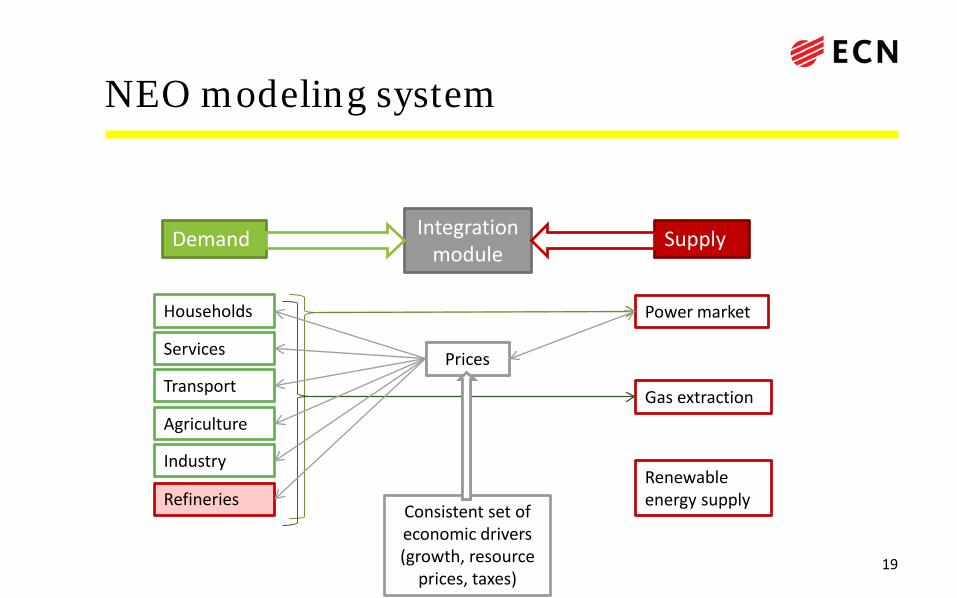
19
NEO modeling system
Integration module
Households
Services
Transport
Industry
Agriculture
Refineries
Power market
Gas extraction
Renewableenergy supply
Consistent set of economic drivers(growth, resource
prices, taxes)
Prices
SupplyDemand
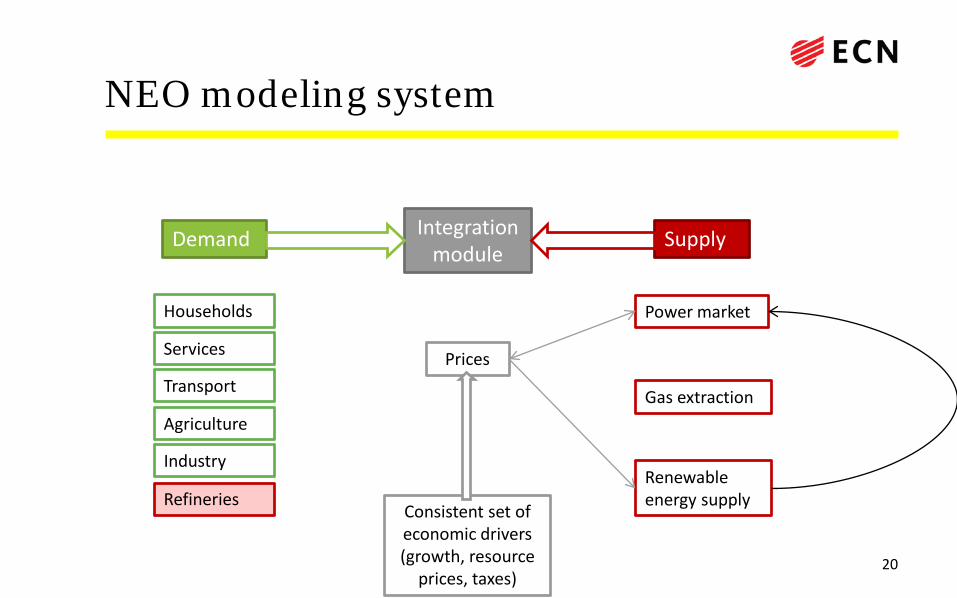
20

NEO modeling system
Integration module
Households
Services
Transport
Industry
Agriculture
Refineries
Power market
Gas extraction
Renewableenergy supply
Consistent set of economic drivers(growth, resource
prices, taxes)
Prices
SupplyDemand
21

NEO modeling system
Integration module
Households
Services
Transport
Industry
Agriculture
Refineries
Power market
Gas extraction
Renewableenergy supply
Consistent set of economic drivers(growth, resource
prices, taxes)
Prices
SupplyDemand
Activities, policy, developments
22
NEO modeling system
Integration module
Households
Services
Transport
Industry
Agriculture
Refineries
Power market
Gas extraction
Renewableenergy supply
Consistent set of economic drivers(growth, resource
prices, taxes)
Prices
SupplyDemand
Activities, policy, developments
Import / export
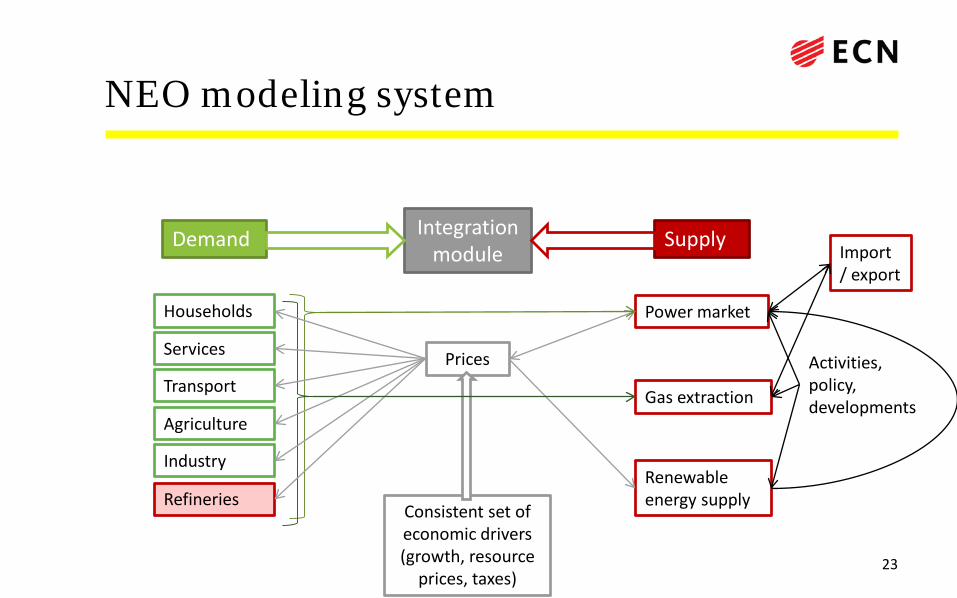
23

NEO modeling system
Integration module
Households
Services
Transport
Industry
Agriculture
Refineries
Power market
Gas extraction
Renewableenergy supply
Consistent set of economic drivers(growth, resource
prices, taxes)
SupplyDemandImport / export
24

NEO modeling system
Integration module
Households
Services
Transport
Industry
Agriculture
Refineries
Power market
Gas extraction
Renewableenergy supply
Activities, policy, developments
Activities, policy, developments
Consistent set of economic drivers(growth, resource
prices, taxes)
Prices
SupplyDemandImport / export
25

NEO modeling system
Integration module
Households
Services
Transport
Industry
Agriculture
Refineries
Power market
Gas extraction
Renewableenergy supply
Activities, policy, developments
Activities, policy, developments
Consistent set of economic drivers(growth, resource
prices, taxes)
Database
Prices
SupplyDemand
Postprocessing
Import / export
EVA, investments, employment
26
Submodels: simulating investment decisions
• Submodels are also used stand alone for sectoral policy assessments
E.g. Energy use in Households• ‘Micro data’ on dwelling types, energy bills, household types and historic
investments• Allows modeling investment decisions for future investments
– Existing dwellings: replacement decisions for boilers, windows, etc. following costsand observed investment behaviour
– New dwellings: building code mandates energy efficiency measures – package dependent on investment costs
• Similar detail for other sectors
27

Submodels: simulating power market
E.g. Power market model• Covers entire NW-European power market• Data on technical and economic performance of individual plants• CHP in industry and agriculture• Renewable energy production from various sources
• Hourly match of demand and supply
• Resulting power mix and hourly commodity trading price
28

Results:Energy transition in NL becomes visible
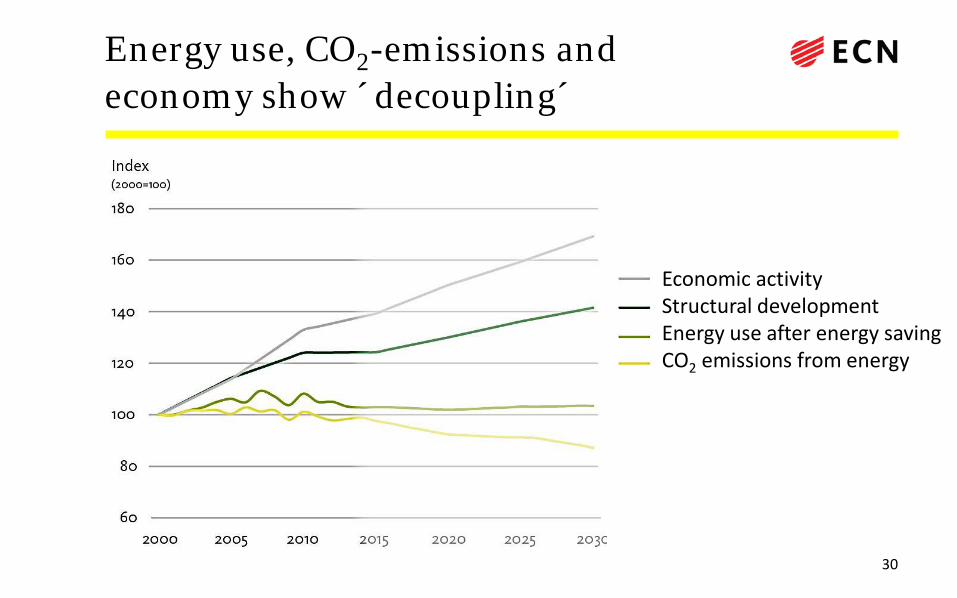
Energy use, CO2-emissions andeconomy show ´decoupling´
Economic activityStructural developmentEnergy use after energy savingCO2 emissions from energy
30

Regulations work!
Average electricity use of households declines
AppliancesVentilation and air-conditioningElectronicsLightingSpace heating and tap waterOther
Electricity use (kWh)
31

Energy efficiency: Not all goals within reach (yet)
• Energy savings pace 2010-2020– Existing policy 1,0% p.a (0,7 – 1,2%)– Intented policiy 1.2% p.a. (1,0 – 1,4%) – After 2020 drop to 0,7% p.a.
• EU Energy efficiency directive– Existing policy: probably uncompliant– Intented policy: probably compliant
• Energy agreement 100 PJ additional– Out of reach yet
32

Substantial growth of renewableenergy, big uncertainties
Share in final energy use(percent)
Intended policy and measuresExisting policy and measures
Statistics Short term projection
33

Electricity productionCapacity (GW) Production (TWh)
Biomass & hydroSolar PV
WindGas decentr.
Gas centr.Coal
NuclearBiomass & hydroSolar PV
WindGas decentr.
Gas centr.Coal
Nuclear
34

Greenhouse gas emissionsdeclining
GHG emissions (Mt CO2-eq)
Industry CO2Agriculture CO2Transport CO2Built environment CO2Other GHG agricultureOther GHG remaining
35

The Netherlands becomes gas importing country
Historic consumptionExisting policyIntended policy
Continental shelf
Other territorialGroningen
Gas production and consumption (bln m3 Geq)
36

Investments generatesubstantial employment
Employment (x1000 fte)
Conventional + infra, inv & trickle downRenewables and energy saving,
inv &trickle downRenewables exploitationInfrastructure exploitationConventional exploitation
37

Conclusion
• Energy transition in the Netherlands becomes visible
– Decoupling economic growth – energy use – greenhouse gas emission– Greenhouse gas target within easy reach– Renewable energy: substantial growth, big uncertainties– Energy savings: point of attention– Concept of ‘the Netherlands gasland’ under pressure– Growth energy related employment through investments

Inspirations, suggestions, questions?

Thank you for your attention
ECN Policy StudiesRadarweg 60 P.O. Box 11043 NT Amsterdam 1755 ZG PettenThe Netherlands The Netherlands
T +31 88 515 83 05 [email protected] +31 88 515 44 80 www.ecn.nl
Michiel Hekkenbergwww.ecn.nl/nev