national community health performance-based financing: design and implementation of supply-side...
TRANSCRIPT

National Community Health Performance-based Financing:design and implementation of supply-side modelPBF workshop Bujumbura February 16th, 2011
Ludwig De Naeyer (MSH)
Rwanda CPBF Interventions Second generation of PBF to address
remaining barriers for achieving improved MCH outcomes and TB outcomes Choice and unit fee based on national
priorities and expected quantities mainly for preventive activities
CHW cooperatives receive incentives payment for: Timely submission of quality SIScom
reports Offer for 5 MCH-indicators and 2 TB-
indicators
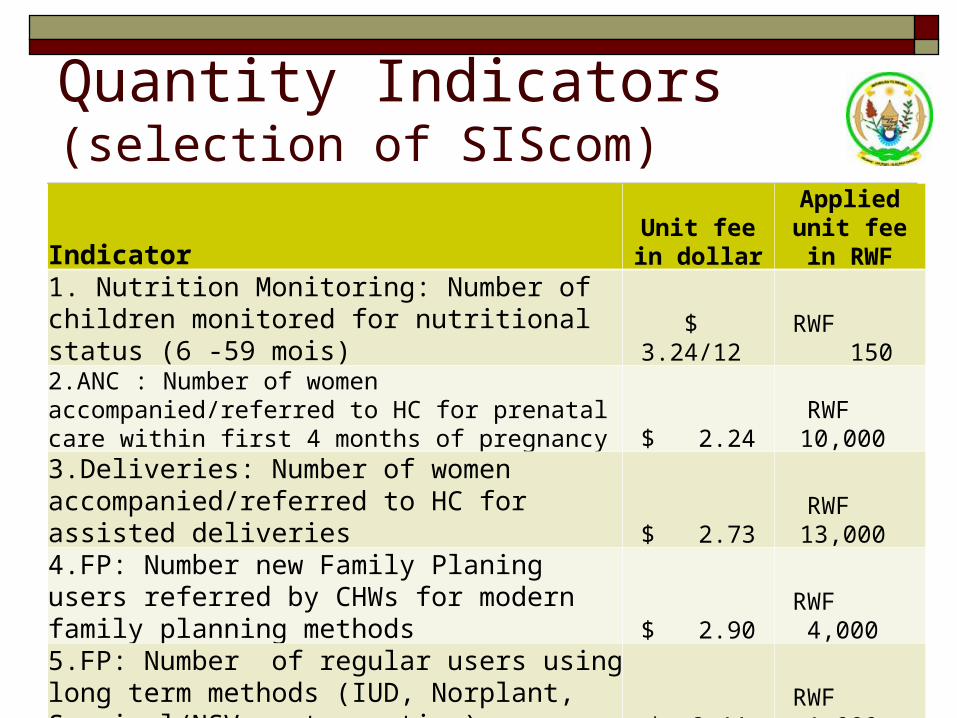
Quantity Indicators (selection of SIScom)
IndicatorUnit fee in
dollarApplied unit fee in RWF
1. Nutrition Monitoring: Number of children monitored for nutritional status (6 -59 mois) $ 3.24/12 RWF 150 2.ANC : Number of women accompanied/referred to HC for prenatal care within first 4 months of pregnancy $ 2.24 RWF 10,000 3.Deliveries: Number of women accompanied/referred to HC for assisted deliveries $ 2.73 RWF 13,000 4.FP: Number new Family Planing users referred by CHWs for modern family planning methods $ 2.90 RWF 4,000 5.FP: Number of regular users using long term methods (IUD, Norplant, Surgical/NSV contraception) $ 2.11 RWF 1,000 6.Nb of TB suspects examined referred by CHW $ 45 RWF 26,550 7.Nb of TB patients followed by CHW per month $ 51/6 RWF 5,000
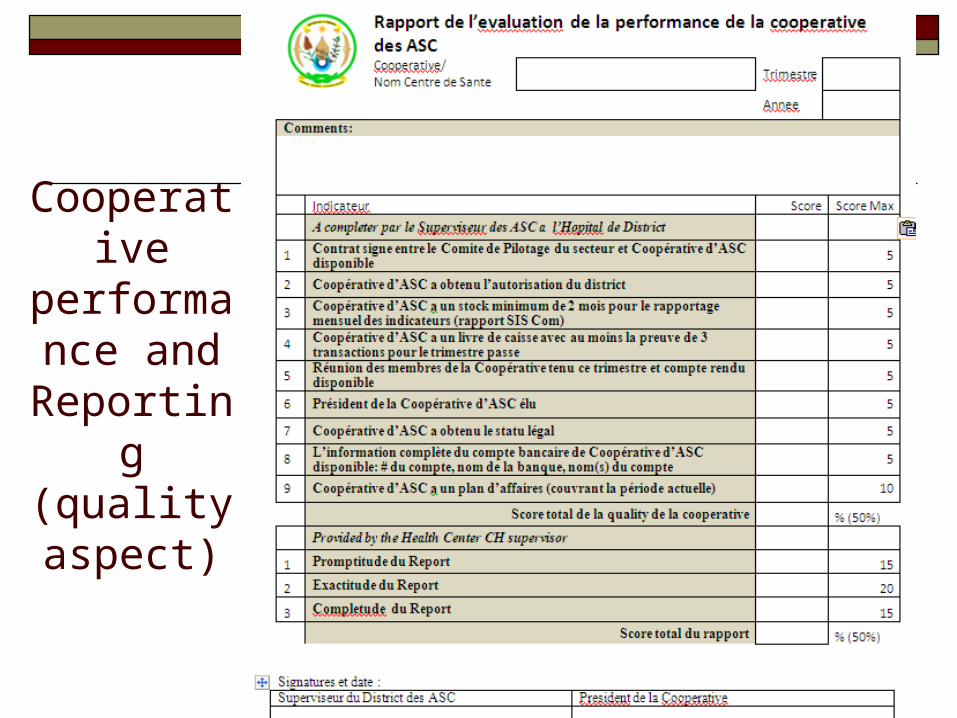
Cooperative
performance and Reportin
g(quality aspect)
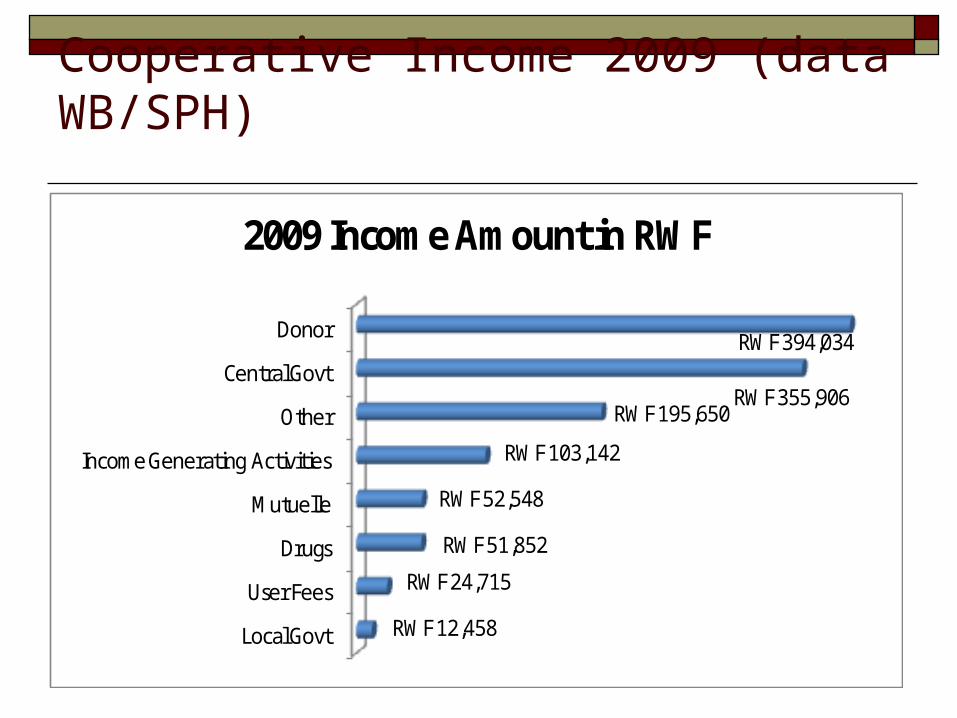
Cooperative Income 2009 (data WB/SPH)
Local Govt
User Fees
Drugs
Mutuelle
Income Generating Activities
Other
Central Govt
Donor
RWF 12,458
RWF 24,715
RWF 51,852
RWF 52,548
RWF 103,142
RWF 195,650RWF 355,906
RWF 394,034
2009 Income Amount in RWF
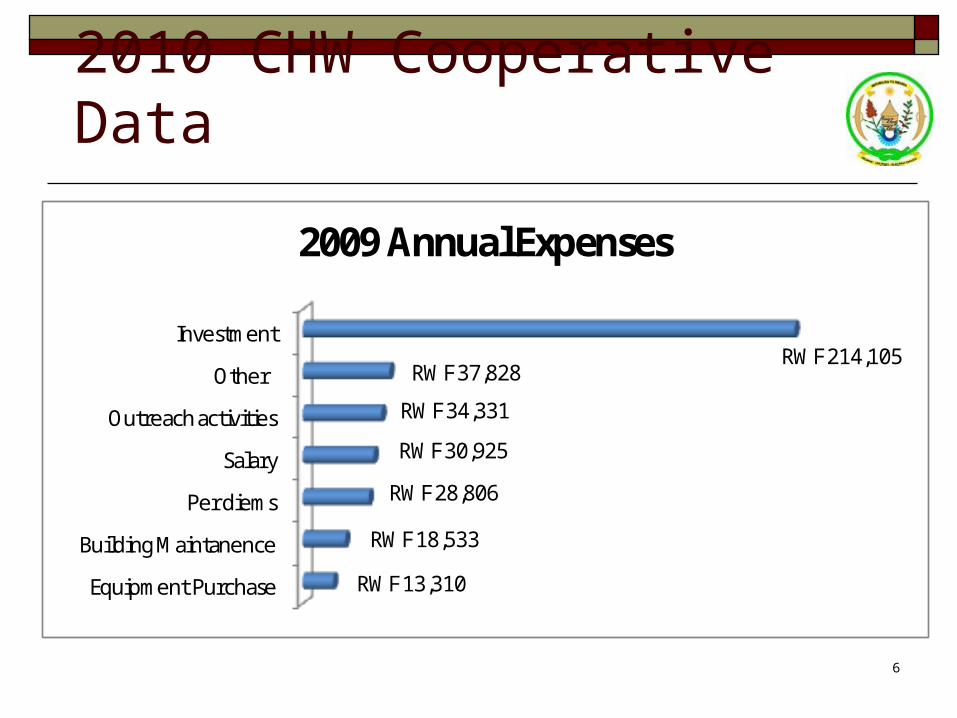
2010 CHW Cooperative Data
Equipment Purchase
Building Maintanence
Per diems
Salary
Outreach activities
Other
Investment
RWF 13,310
RWF 18,533
RWF 28,806
RWF 30,925
RWF 34,331
RWF 37,828RWF 214,105
2009 Annual Expenses
6
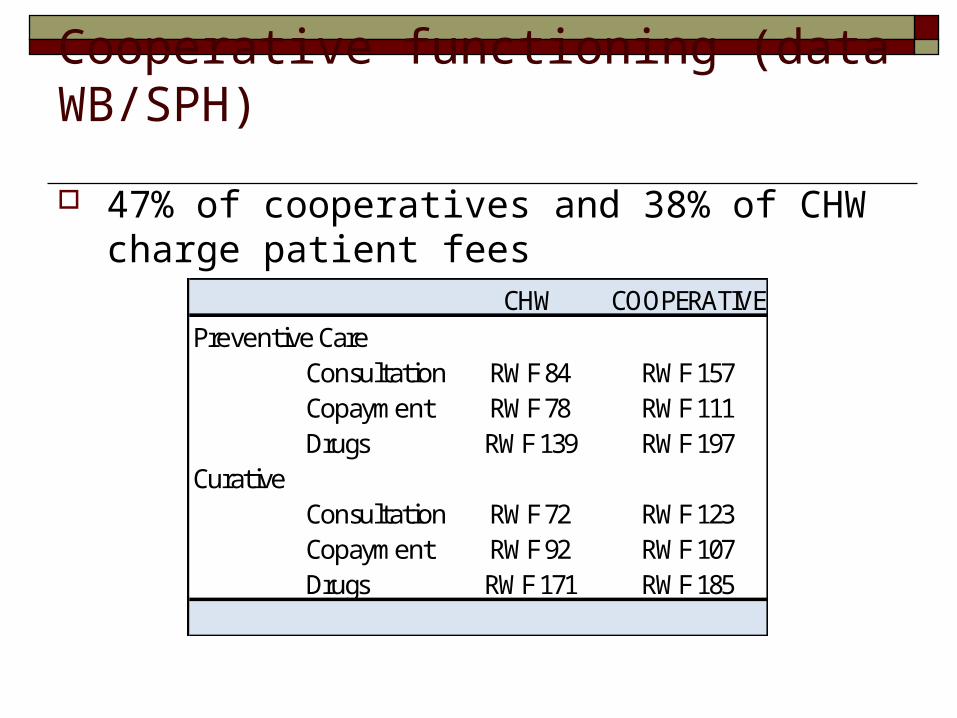
Cooperative functioning (data WB/SPH)
47% of cooperatives and 38% of CHW charge patient fees
CHW COOPERATIVEPreventive Care
Consultation RWF 84 RWF 157Copayment RWF 78 RWF 111Drugs RWF 139 RWF 197
CurativeConsultation RWF 72 RWF 123Copayment RWF 92 RWF 107Drugs RWF 171 RWF 185
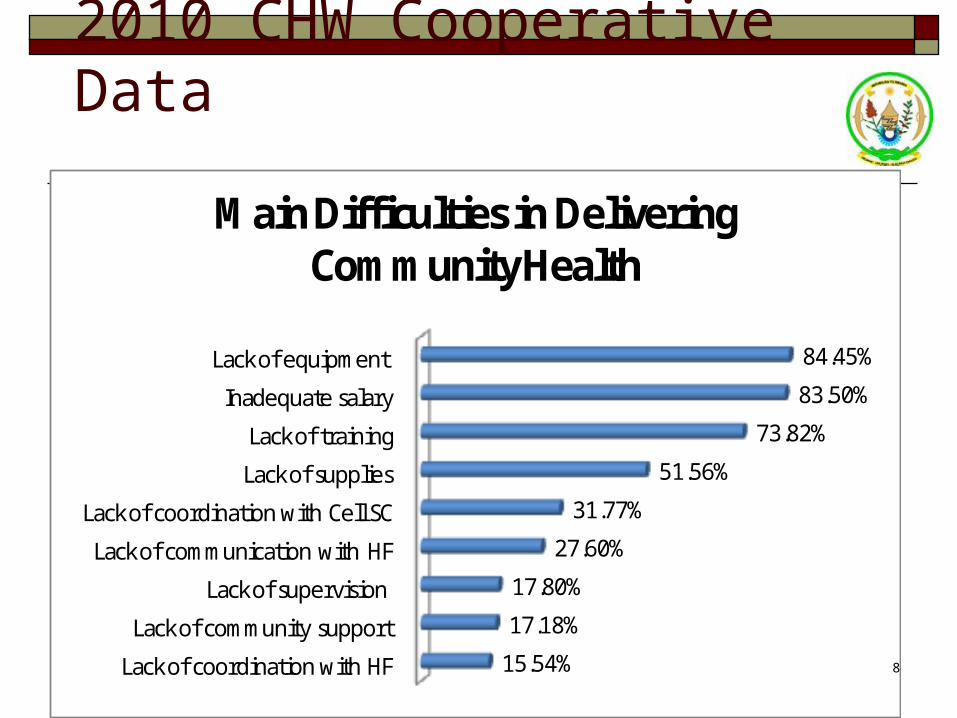
2010 CHW Cooperative Data
Lack of coordination with HF
Lack of community support
Lack of supervision
Lack of communication with HF
Lack of coordination with Cell SC
Lack of supplies
Lack of training
Inadequate salary
Lack of equipment
15.54%
17.18%
17.80%
27.60%
31.77%
51.56%
73.82%
83.50%
84.45%
Main Difficulties in Delivering Community Health
8
Data validation and control Payment per unit reported so
possibility of gaming Still mainly paper based Done by HC supervisor
monthly External audits planned but
not performed yet

PBF-Payment for cooperative Quarterly via HC-account
After validation of the data by sector steering committee (members are HC-head, the supervisor of the CHWs at the HC, the in charge of social affairs and a member of the civil society)
Two parts: Maximum amount for reporting depends on the
target population of the cooperative. This is adjusted by the quality score.
Productivity (i.e. offer services) = unit fee * Quantity
First payment made for October – November 2010: average of 3700 $ for indicator and 900 $ for report Cooperatives use earnings for income generating
activities and for dividend for CHWs.

Cooperatives Reporting: 97% for 2010 to date out of 427 HC and Dispensaries

Cooperative performance reports
Started during the last quarter 2010 (n=261) Average
quality score: 82%
Contrat signe entre le Comite de Pilotage du secteur et Coopérative d'ASC disponible 4.3 Coopérative d'ASC a obtenu l'autorisation du district 4.2
Coopérative d'ASC a un stock minimum de 2 mois pour le rapportage mensuel des indicateurs (rapport SIS Com) 4.9 Coopérative d'ASC a un livre de caisse avec au moins la preuve de 3 transactions pour le trimestre passe 4.3 Réunion des membres de la Coopérative tenu ce trimestre et compte rendu disponible 4.7 Président de la Coopérative d'ASC élu 4.8 Coopérative d'ASC a obtenu le statu légal 1.4
L'information complète du compte bancaire de Coopérative d'ASC disponible: # du compte, nom de la banque, nom(s) du compte 4.9
Coopérative d'ASC a un plan d'affaires (couvrant la période actuelle) 7.1 Promptitude du Rapport 13.9 Exactitude du Rapport 14.4 Complétude du Rapport 13.3
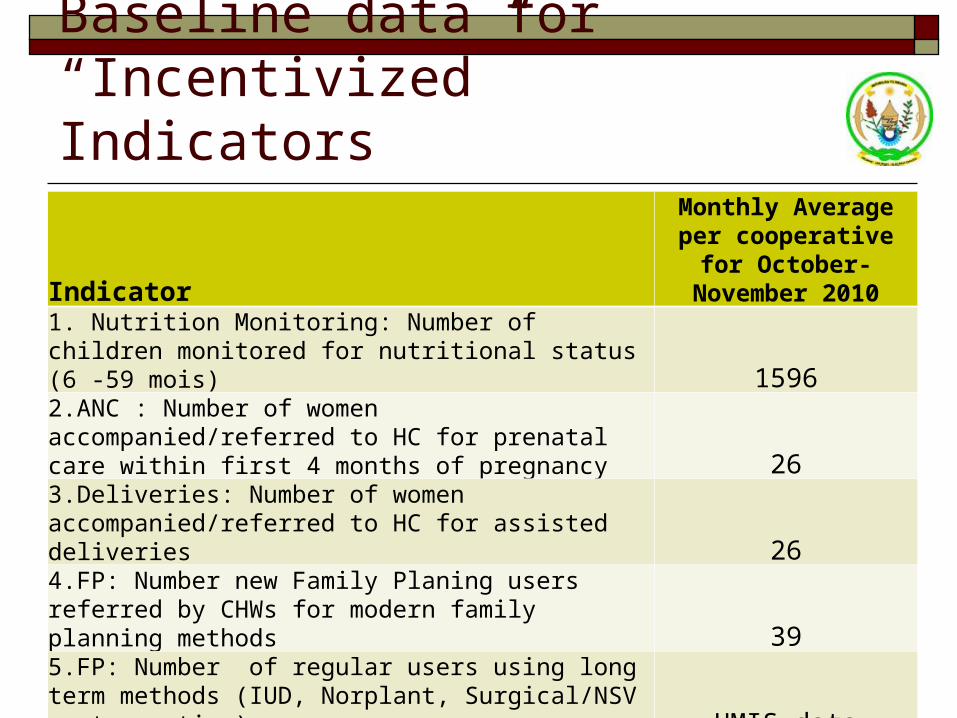
Baseline data for “Incentivized” Indicators
Indicator
Monthly Average per cooperative for October-
November 20101. Nutrition Monitoring: Number of children monitored for nutritional status (6 -59 mois) 15962.ANC : Number of women accompanied/referred to HC for prenatal care within first 4 months of pregnancy 263.Deliveries: Number of women accompanied/referred to HC for assisted deliveries 264.FP: Number new Family Planing users referred by CHWs for modern family planning methods 395.FP: Number of regular users using long term methods (IUD, Norplant, Surgical/NSV contraception) HMIS data
6.Nb of (TRUE) TB suspects examined referred by CHW Nl. HMIS data/ SIS: 4
7.Nb of TB patients followed by CHW (total fee) 4

Lessons learnt / challenges PBF incentives ensured rapid increase in
SISCom reporting In the presence of a strong monitoring system
PBF can be introduced for cooperatives to stimulate and reward activities of CHWs at community level.
Quarterly payments are feasible and will hopefully lead to an increase of MCH and TB-activities. The results of this intervention will be assessed by an independent unit through an Impact Evaluation study.
Data quality supervision and external audits still need to be introduced to verify data quality

2010 CHW Cooperative Data
In the past 12 months, how many times was performance assessed? Members (internal): 3.97 Members (external): 1.18 Cooperative (external): 0.52
Yes27%
No73%
Is Member Compensation Linked to Performance
Assessment?
16