national bank of poland - nbp.pl · national bank of poland economic institute bureau of world...
TRANSCRIPT

National Bank of Poland
Economic Institute Bureau of World Economy and European Economic Integration
Analysis of economic situation in the countries
of Central and Eastern Europe
July 2011

2
3
Table of contents:
Executive summary 5
Countries of Central and Eastern Europe 6
Bulgaria 12
Czech Republic 16
Estonia
Euro adoption impact on the inflation in Estonia
22
25
Lithuania 27
Latvia
Poland
32
37
Romania 42
Slovakia 47
Slovenia 52
Hungary 57
Annexes:
Széll Kálmán Plan 63
Foreign currency loans in Central and Eastern Europe – a Hungarian approach 66
Statistical Annex 69
Prepared by:
Marcin Grela Marcin Humanicki
Marcin Kitala (Bureau of Public Finance, Institutions and Regulations, EI, NBP) Tomasz Michałek
Wojciech Mroczek (coordination) Ewa Rakowska
Approved by: Ewa Rzeszutek
Małgorzata Golik (Bureau of Public Finance, Institutions and Regulations, EI, NBP) Jarosław Jakubik
This report has been prepared for information purposes on the basis of various research sources independent from the National Bank of Poland.

4
General information on CEE countries
Area
(km2)
Population GDP
(km2)
GDP per capita
thous. persons per km2 by nominal
exchange rates
by purchasing
power parity
Bulgaria 110,879 7,564 68 36,034 4,700 10,600
Czech Republic 78,867 10,507 133 145,049 13,800 19,500
Estonia 45,227 1,340 30 14,501 10,800 15,900
Lithuania 65,300 3,329 51 27,410 8,300 14,200
Latvia 64,559 2,248 35 17,970 8,000 12,600
Poland 312,685 38,167 122 353,667 9,300 15,200
Romania 238,391 21,462 90 121,942 5,700 11,000
Slovakia 49,035 5,425 111 65,906 12,100 18,100
Slovenia 20,273 2,047 101 35,974 17,600 21,200
Hungary 93,028 10,014 108 98,446 9,800 15,700
source: Eurostat
Gross domestic product growth rate (in %; seasonally adjusted)
2010 2011 2010 2011
2010 Q2 2009 Q3 2009 Q4 2010 Q1 2010 Q2 2009 Q3 2009 Q4 2010 Q1
q/q y/y
Bulgaria 1.7 0.7 0.5 0.6 -0.4 0.0 3.8 3.4
Czech Republic 0.6 0.8 0.5 0.9 2.3 2.6 2.7 2.8
Estonia 2.2 1.2 2.5 2.4 3.1 5.4 6.8 8.6
Lithuania 1.0 0.3 1.8 3.5 1.2 1.6 4.6 6.8
Latvia 0.4 1.5 0.9 0.3 -2.8 2.6 3.5 3.2
Poland 1.1 1.2 0.8 1.0 3.6 4.6 3.9 4.3
Romania 0.2 -0.7 0.1 0.7 -0.5 -2.1 -0.6 0.3
Slovakia 0.8 0.9 0.9 1.0 4.3 3.9 3.4 3.6
Slovenia 0.9 0.3 0.5 0.3 1.3 1.4 1.9 2.1
Hungary 0.1 0.8 0.5 0.7 0.5 2.3 2.6 2.2
source: Eurostat

Analysis of economic situation in the countries of Central and Eastern Europe – Executive summary
National Bank of Poland – July 2011 5
Executive summary
The economies of Central and Eastern Europe (CEE) entered the path of recovery in 2010, stimulated by external
demand. As a result of steadily accelerating exports, the CEE economies significantly rebounded. GDP in the region
climbed up to 2.3% and 3.4% respectively in 2010 and 2011 Q1.
Exports growth contributed to the increase in inventories (category with statistically the largest positive impact on
economic growth) and expenditure on machinery and equipment in export-oriented enterprises, where capacity
utilisation grew the most. An increase in a number of foreign orders helped gradually stabilise the labour market
situation – principally due to halting the downward trend in the employment in the manufacturing sector. Consequently,
2010 saw exports soar up to win an all-time high share in regional GDP (57.5%), though, its impact then was not strong
enough to stimulate domestic demand. Wage growth stood at a very low level. Lending to private sector remained very
weak and decline in the construction sector persisted in some countries. Fiscal consolidation, undertaken by ever more
countries in the region, also had a dampening impact on demand. Additionally, in effect of a flagging domestic demand,
growth was lower in imports than in exports (the real growth in imports surpassed that in exports only in two countries,
i.e. in Poland and in Lithuania,).
However, the growth in the CEE exports was lower than in other major regions, which reflects a declining CEE share in
global exports. This happened for the first time since 1999 (when the exports in the region declined in the aftermath of
the Russian crisis). Most recently, however, the CEE share in the global exports has pursued a steady growth, to attain
4.0% in 2009, according to WTO data. In effect of the exports from CEE rising less than global exports in 2010 this
share ebbed down to 3.9%.
A lower growth in the CEE exports vis-a-vis other regions may be explained by a lower growth in demand in the major
export markets, i.e. EU-15 states. Demand in EU-15 grew below the average global level (this being primarily
attributable to the aggravation of debt crisis). Besides, it predominantly reflected the demand of the export sector (due
to a relatively buoyant economic growth in non-European countries). Given the character of economic links between EU-
15 and CEE countries, which to a large extent link mother companies with branches of corporations situated in CEE,
export recovery in CEE concentrated in intermediate goods. Meanwhile, exports grew at a slower pace in consumer and
capital goods.
High growth in intermediate goods occurred particularly in exports to Germany. A strong recovery sent the value of
exports in this category above the level of 2008. It means that corporate links were re-instated in this case. Strongly
export-oriented German economy, especially onto the strong growing markets, i.e. to emerging Asia, is the main link
between CEE and global economy. Global recovery also stimulated the reconstruction of trade in intermediate goods
between CEE countries. CEE-intra trade amounts for nearly 20% of their total foreign trade turnover.

Analysis of economic situation in the countries of Central and Eastern Europe –
Countries of Central and Eastern Europe
National Bank of Poland – July 2011 6
COUNTRIES OF CENTRAL AND EASTERN EUROPE
Foreign trade boosts economic activity in CEE
countries
Labour market in stagnation
Inflation grows, stimulated by supply factors
Further fall in the ULC
Decliining of external imbalances
The CEE currencies exchange rates fluctuate, as
debt crisis escalates in the euro area
Varying monetary policies
Further fiscal consolidation
Growth to accelerate in 2011 and 2012
Economic growth
CEE countries have been recovering since the beginning of
2010. GDP growth gained momentum by each consecutive
quarter. GDP for the region rose by 2.3% and 3.4%,
respectively in 2010 and 2011 Q1.
The pace of economic recovery in the region was, however,
diverse. Economies which followed the path of relatively
balanced growth in the pre-crisis period reached the highest
economic growth rates in 2010. Accordingly, they could
earlier resume a path of economic recovery. The highest
GDP growth in 2010 was observed in Slovakia (4.0%) and
Poland (3.8%). Meanwhile, the efforts undertaken for fiscal
consolidation negatively affected economic recovery in the
Czech Republic. Positive growth occurred also in most
countries which even prior to the outbreak of the global
crisis had come through acute internal problems, i.e. in
Estonia, Slovenia, Lithuania, Hungary and Bulgaria. Just the
opposite situation prevails in those countries which persist in
their struggle with serious internal and external imbalances.
GDP in the CEE region in 2010 shrank only in Latvia (-0.6%)
and Romania (-1.3%).
In 2011 Q1 for the first time since 2008 the average annual
GDP growth was positive in all 10 countries, to amount to
3.4% for the entire region. It was the highest in Estonia
(8.6%) and Lithuania (6.8%)1, and the lowest, albeit
already positive in Romania (0.3%).
Regional economic activity was primarily boosted by
external demand and inventories rebuilding. Domestic
demand – most specifically private consumption – had also
had a rising impact on the growth.
Rebound in foreign trade, following the severe decline at the
turn of 2008 and 2009, became the driving force of an
economic recovery in the Central and Eastern Europe both
in 2010 and in 2011 Q1. The value of regional exports
resumed its pre-crisis levels already in 2010 Q2, whereas
GDP reached that level in 2011 Q1. The lag occurred due to
1 Baltic states, most specifically Estonia and Lithuania showed a large boost in annual GDP growth both in 2010 and in 2010 Q1, which resulted primarily from a very low base effect in 2009.
a considerably slower rate of growth of domestic demand,
especially in fixed capital formation in the region.
Already at the beginning of 2010 the CEE countries showed
a rapid exports expansion, as trade accelerated within the
regional and global production networks. The increase in
exports of consumer goods was partially due to fiscal
stimulation programmes in EU-15 states (especially new car
subsidies) as well as to the shift in the imports structure
towards cheaper products from the CEE region. These
tendencies resulted in a prompt (in most countries, two-
digit) increase in exports in 2010.
As of 2010 Q2 a rapid growth in exports has coincided with
equally fast, at times even faster, growth in imports. Those
tendencies were related on the one hand to growing
demand of export-oriented sector and the rebuilding of
inventories (primarily reflected in the growing import of
intermediate goods), and on the other hand with the
intensifying domestic demand. Accordingly, both the imports
and the exports rose at a similar pace in 2010, thereby
limiting the positive impact of net exports to GDP growth.
In 2011 Q2 as a result of further strong external demand, in
particular in rapidly developing German and emerging Asian
economies, export continued to grow rapidly, whereas
growth in imports lost some of its momentum. Therefore,
net exports expanded its contribution to annual GDP growth
to 1.0 pp.
Table 1.1 GDP and its components (in % y/y)
2009 2010 Q3 2010 Q4 2010 Q1 2011
GDP -3.4 2.8 2.9 3.0 3.5
Private consumption -3.5 1.2 1.7 1.5 1.8
Public consumption 1.3 1.2 1.6 1.7 -0.3
Fixed capital formation -11.7 -2.6 -3.1 0.0 3.2
Exports -10.3 14.5 13.5 13.3 14.4
Imports -16.3 14.4 12.9 13.7 12.7
source: Eurostat
2010 saw inventories accumulation across the region,
following a strong decline, especially visible at the turn of
2008 and 2009. In terms of the entire region, the change in
inventories contributed 2.6 pp. to GDP growth, i.e. made the
highest contribution among all the categories of national
accounts. In 2011 Q1 the growth in inventories slowed
down considerably to reach only 0.6 pp. In other words, the
process of their rebuilding in the CEE countries appears to
come to an end.
GDP growth recorded a positive contribution in 2010, also
from consumption, both private and public. Private
consumption in quarter-to-quarter terms rose in each
quarter of 2010 and in 2011 Q1. Most of positive growth in
private consumption in 2010 stemmed from its significant
growth in Poland (by 3.0% y/y). Aside from Poland,
household spending edged up only in the Czech Republic
and Slovenia, while in other countries of the region they

Analysis of economic situation in the countries of Central and Eastern Europe –
Countries of Central and Eastern Europe
National Bank of Poland – July 2011 7
decreased compared with 2009. In 2011 Q1 regional growth
in private consumption rose to 1.8% y/y. Poland was joined
by the Baltic states, where private consumption grew at 3.6-
5.5% y/y2. In turn, in the Czech Republic, Romania,
Slovakia and Hungary, household consumption expenditure
declined in 2011 Q1 when compared to the end of 2010.
A growth in consumption in the region was additionally
inhibited by a very slow improvement on the labour markets
of the CEE countries. Bank lending also proceeded very
slowly (in the Baltic countries and Hungary, both in 2010
and in 2011 Q1 loans to the private sector continued to
decrease). In addition, the countries of the region entered a
process of fiscal consolidation, which further inhibited the
growth in household income3.
Fiscal tightening most specifically impacted public
consumption. Even though throughout the region, both in
2010 and in 2011 Q1, its annual growth rate was positive, it
primarily reflected strong growth in public consumption in
Poland.
Fiscal tightening was particularly evident in countries that in
previous years had received financial assistance from
international institutions under the auspices of the IMF and
the EU (Hungary, Latvia, Romania). These countries
committed themselves to reducing the budget deficit, both
via reduction in expenditure and increase in tax revenues.
This significantly contained domestic demand, especially
consumption, in these countries
In 2010 Q4, following 7 consecutive quarters of decline,
expenditure on fixed investments in the region showed an
increase. The growth consolidated in 2011 Q1 to spread
across the region. It resulted from an increase in capacity
utilization in mainly export-oriented enterprises. An increase
in expenditure on machinery and equipment coincided with
a decline in construction investment. Low commercial credit
growth also hampered new investment.
As external demand substantially increased and the process
of rebuilding inventories continued, it fuelled a strong
increase in industrial activity in the CEE countries. Industrial
output rose in 2010 in all countries of the region. It mainly
affected the production of transport vehicles, machinery and
equipment as well as durable consumer goods, i.e.
production increased the most in export-oriented sectors.
From the beginning of 2011 the process slowed down
somewhat, but persistently high demand from rapidly
2 Very slow consumer demand recovery was reflected in retail trade data. Both in 2010 and in the first four months of 2011 retail sales in the region grew very slowly, whilst in Latvia, Romania and Hungary it continued its downward trend. Only in Poland, Estonia and Lithuania did it show a clear increase. 3 Following a period of growth in the first half of 2010 indicators of consumer confidence in the CEE countries resumed a path of decline in the second half of 2010 and in early 2011. Consumer optimism declined, primarily in the aftermath of the deteriorating assessment of the current and prospective financial situation of households in the context of rising inflation and the continuing stagnation in the labour market.
developing major euro area economies, especially Germany,
continued to stimulate growth in industrial production4.
Labour market
Labour markets in the CEE countries neither in 2010 nor in
2011 Q1 showed signs of significant improvement.
Harmonised unemployment rate has remained near its
highest level in recent years. It even increased in
comparison with the end of 2009 in Bulgaria, Romania,
Slovenia and Hungary. Unemployment markedly declined in
2010 only in Estonia and Latvia, remaining however at the
highest levels in the region.
Data on employment in the region also imply a stagnation in
the labour market in 2010. The number of employees in the
whole group of the CEE countries increased only slightly last
year (0.2%). Bulgaria, the Czech Republic, Slovenia and
Lithuania reported further reduction in employment. Despite
the increase in industrial activity, employment in this sector
declined in 2010, similarly as the employment in agriculture,
while a growth occurred in the service sector
Inflation and labour costs
Rising energy and food prices were the main driving force
behind inflation growth in the CEE countries in the second
half of 2010 and first half of 2011. In July 2010, the annual
HICP inflation in the region amounted to 2.5%, to climb to
4.6% in May 2011. Although similar trends prevailed among
the CEE countries, the level of inflation in individual
countries varied widely. The lowest growth in consumer
prices in May 2011 could be observed in the Czech Republic
(2.0%), the highest in Romania (8.5%).
Food prices decisively impacted inflation in the region and
fuelled its growth. Between July 2010 and May 2011, their
contribution to the annual HICP growth rate increased by
1.5 pp., and its gradual increase could be observed
throughout this period. In the second half of 2010 a growth
in energy prices also gained a considerable momentum.
However, they started to stabilize at the beginning of 2011.
On the other hand, core inflation, which remained low
through 2010, started to slowly growth in the first half of
2011. This hike resulted from increases in rates of indirect
taxes in early 2011 and a spill-over of high food and energy
prices to other groups of goods and services. Meanwhile,
demand pressure remained low, due to persistent negative
impact of labour market conditions.
Following a strong decline in 2009, average wage in most of
the CEE region entered a rising path in 2010. This trend
persisted in 2011 Q1.5 The increase in nominal wages was
not high and for the whole region it was lower than the rate
4 The increase in external demand, particularly the growing number of foreign orders has encouraged a significant improvement in sentiment among manufacturers in 2010. Its level was maintained during the first months of 2011 r 5 The average wage in the economy decreased in 2011 Q1 (annualized) only in Estonia and Romania.

Analysis of economic situation in the countries of Central and Eastern Europe –
Countries of Central and Eastern Europe
National Bank of Poland – July 2011 8
of inflation. which means that in real terms wages in the
region in 2010 and 2011 Q1 slid further down.
Economic recovery at the turn of 2010 and 2011, coupled
with continuing unfavourable situation in the labour
markets, contributed to further decrease in unit labour costs
growth (ULC). Although in the second half of 2010 nominal
wages in CEE countries slowly began to rise, their increase
was not as significant as the increase in labour productivity
in this period.
Balance of payments
Following a very rapid decrease in the current account
deficits in the CEE countries, in some of them, including the
Baltic countries and Hungary, even a large surplus being
posted, this process definitely slowed down in 2010. The
current account deficit across the region decreased in 2010
to 1.7% of GDP (compared with 2.1% of GDP in 2009),
which resulted from its decline in Bulgaria, Romania and
Hungary. In other countries, current accounts balances
deteriorated last year. In 2011 Q1 the current account
deficit further declined in most countries (except Poland and
the Baltic states). Both in 2010 and in 2011 Q1 this
improvement resulted primarily from a decrease in the
goods account deficit.
As with the current account balance in 2010, the trade
balance improved only in Bulgaria, Hungary and the Baltic
states. In other countries in 2010 a marked boost in imports
translated into a lower balance of trade in goods and
services. In 2011 Q1 foreign trade balance increased further
in the Czech Republic and Slovakia, which resulted in a
further decline in the deficit in goods and services account.
Since the beginning of 2010 a trend has been reversed in
the income account. Higher corporate profits, as well as the
increasing involvement of foreign investors in debt
instruments of the CEE countries, resulted in a greater
outflow of income from foreign investments, which
increased the deficit in this account.
2010 and 2011 Q1 also saw a persistent decline in foreign
capital inflow to the CEE markets. This trend affected the
other investment account. Inflow of foreign loans and
credits continued to wane, additionally the residents of the
CEE countries has been gradually moving their savings to
financial institutions outside the region. Meanwhile the
inflow of FDIs and portfolio investment intensified. The
inflow of portfolio investment, which reached historically
high levels in the largest economies of the region (Poland,
the Czech Republic, and also Slovenia) in late 2009 and
2010, clearly weakened in the second half of 2010 and 2011
Q1.
Exchange rates and interest rates
Following a depreciation of the currencies of the region in
2010 Q4 (debt crisis in peripheral countries of the euro area
intensified the risk in financial markets), in 2011 Q1 they
appreciated. Only Polish zloty continued to depreciate
against the euro, because of the negative assessment of
changes in the public finance in Poland.
As a result of increased concern about the sovereign debt
crisis in Greece, in May 2011 the risk aversion returned with
even greater impact to the world's financial markets.
Investors withdrew from euro-denominated assets and the
European currency weakened against the major currencies
of the world. This process took on even greater intensity on
the currency markets of the CEE countries. This resulted in a
weakening of the currencies of the region (with the
exception of the Czech crown) against the euro, and even
more against the U.S. dollar and Swiss franc in May and
June 2011.
The speculations concerning devaluation of the Baltic states
currencies, especially the Latvian lat, ended in 2010. These
countries managed to increase their global competitiveness
through the so-called “internal devaluation”, i.e. depreciation
of the real exchange rate via an decrease in inflation and
labour costs. However, due to a rapid rise in inflation in the
Baltic states as of mid-2010, the real effective currency rate
in those countries began to strengthen again.
In 2010 and the first half of 2011 the countries of the region
which adopted a direct inflation targeting diversified their
monetary policy stance. In Poland and Hungary, in response
to rapidly rising inflation, central banks opted for a series of
interest rate hikes. The National Bank of Hungary at the
turn of 2010 and 2011, raised its policy rate three times (a
total of 75 bps), while the National Bank of Poland between
January and June 2011 did so four times (a total of 100
bps). The Czech National Bank did not decide in that period
to change interest rates, which remain at a record low
(0.75%). Those decisions were explained by the need to
support weak economic growth, especially in view of
tightening fiscal policy. Inflation forecast for the Czech
Republic indicated it should not significantly deviate from
the target in the forthcoming quarters (less than 2% y/y).
Fiscal policy
The level of fiscal imbalance in the CEE countries in 2010
remained high and reached the average level of 6.1% of
GDP (except Estonia6) as compared to 7.1% of GDP in
2009. In half of the CEE countries the deficit outturn was
lower7 than forecasted in their individual
Convergence/Stability Programmes (Update 2010),
thanks to gradual improvement on the revenue side,
maintenance of spending discipline and the
implementation of additional consolidation measures
during the year (the Czech Republic, Slovenia). The fiscal
target for 2010 was exceeded in Bulgaria (3.2 pp.),
Slovakia (2.4 pp. of GDP), Poland (by 1.0 pp. of GDP),
6 Estonia was the only EU state with a general government surplus in 2010. It amounted to 0.1% of GDP against the budget deficit at 1.7% of GDP in 2009. 7 In Estonia by 2.3 pp. of the GDP (i.a. due to the sale of CO2 emission rights), in Lithuania and Latvia, respectively by: 1.0 and 0.8 pp. of the GDP, in the Czech Republic 0.6 pp. of the GDP, and in Slovenia by 0.1 pp. of the GDP.

Analysis of economic situation in the countries of Central and Eastern Europe –
Countries of Central and Eastern Europe
National Bank of Poland – July 2011 9
Hungary (0.4. pp. of GDP) and Romania (by 0.1 pp. of
GDP).
In 2011 further reduction of general government deficit
in the countries of the region will be continued.
Compared to 2010, it is forecasted to decrease on
average by 2.1 pp. of GDP (excluding Estonia). A
substantial adjustment is anticipated in Hungary (about 6
pp. of GDP), most of which will stem from one-off
measures. This year funded pension funds shall transfer
to the government assets (ca. 10% of GDP) for persons
who have opted to discontinue their membership. The
planned magnitude of the budget deficit reduction in
2011 will be significant also in Latvia (3.2 pp. of GDP),
Slovakia (3.0 pp. of GDP) and Poland (2.3 pp. of GDP),
with the two latter countries having commenced the
process of fiscal consolidation only this year. Despite the
continuation of the adjustment measures a the general
government deficit in Slovenia will ebb down marginally
this year (0.1 pp. of GDP), as a result of the government
decision to recapitalize one of Slovenian commercial
banks (0.7% of GDP).
The deadline for reducing budget deficit below the
reference value (3% of GDP) imposed under excessive
deficit procedure (EDP) is 2011 for Hungary and Bulgaria,
2012 for Poland, Romania and the Baltic states (except
Estonia) and 2013 for the Czech Republic, Slovakia and
Slovenia. The consolidation measures planned by the CEE
countries for the upcoming years are concentrated
mainly on the expenditure side. They concern, i.a.,
rationalization of public sector employment, social
transfers review and keeping wages in public
administration or pension benefits frozen (e.g. Bulgaria,
the Czech Republic, Latvia, Slovenia). The general
government balance will also improve from the
anticipated economic recovery. Achievement of fiscal
targets enshrined in the Convergence/Stability
Programmes is burdened with risk associated with
adoption of the planned measures (parliamentary
elections, lack of details concerning proposed changes),
or the optimistic macroeconomic assumptions (according
to EC's assessment this applies to the Czech Republic,
Slovakia and Slovenia).
In order to support the consolidation of public finances,
the countries of the region intend to strengthen the
institutional framework of the general government,
through, inter alia, the introduction of fiscal rules (mainly
expenditure and public debt limits) or the appointment of
independent fiscal councils (Bulgaria, Czech Republic,
Slovakia)8.
With the projected improvement of economic situation,
ongoing consolidation activities, and the assumption of
lack of support to the banking system, public debt in the
coming years will grow at a slower pace, whilst in Poland,
8 Since 2010, the budget councils have operated in Romania and Slovenia, and since the end of 2008 in Hungary (in 2010 the rules concerning appointing its members were amended, and a separate analytical office was dissolved).
Lithuania, Romania and Hungary it will decrease
compared to 2011. Only in Hungary public debt is to
exceed its reference value (60% of GDP).
Forecasts
According to the European Commission (EC) Spring 2011
forecasts, economic recovery observed in the CEE countries
in 2010 and 2011 Q1 will continue in the coming quarters.
GDP growth in 2011 should be positive in all countries of the
region, possibly exceeding 4% y/y in Poland, Estonia and
Lithuania. In almost all economies in the region the GDP
growth rate is going to be higher than in 2010, only in the
Czech Republic and Slovakia it can decrease due to the
effects of fiscal consolidation. The average GDP growth for
the entire region in 2011 is expected to amount to 3.2%. In
2012, the EC anticipates a further acceleration of economic
growth in the region to 3.6%. Though GDP growth may ebb
down slightly in Poland, Estonia and Lithuania, i.e. the
fastest growing economies in 2011, it should increase in all
other countries across the region.
Compared with the Autumn 2010 forecasts, the EC raised its
expectations for the region, primarily due to steadily sound
shape of the euro area economy, especially Germany, which
allows to maintain a relatively high growth of exports in the
CEE countries.
The forecast improvement in economic recovery will
coincide with the changes in the structure of economic
growth. The contribution of domestic demand will increase,
while that of net exports and changes in inventories will be
declining.
The Commission anticipates domestic demand should
recover already in 2011. Both private consumption and
capital formation should increase across the region. Private
consumption is to grow in 2011 amidst a moderate pace of
improvement in the labour market. The unemployment rate
is going to drop slightly, and employment in the region's
economies grow, but with the exception of the Baltic states,
this should not be a big change. The recovery in private
consumption is to be continued also in 2012, when the
labour market is also anticipated to improve faster.
According to the latest EC forecasts, public consumption, in
turn, should drop in 2011, due to restrictions on public
spending. It is expected that the process of fiscal
consolidation may slow down in 2012, which will translate in
the increase in consumer spending of the public sector in
most of the region.
Fixed capital formation is also projected to accelerate in
2011, partially due to a low base effect from 2010 (this is
particularly evident in the Baltic states). In 2012, the high
rate of investment should be continued. Growth in fixed
capital formation is going to bear upon both the investment
in buildings and investment in machinery and equipment.
Expected growth of exports and imports in the coming years
should continue to be relatively high, but considerably lower
than that observed in 2010, as a result of the forecasted

Analysis of economic situation in the countries of Central and Eastern Europe –
Countries of Central and Eastern Europe
National Bank of Poland – July 2011 10
slowdown in world trade. In turn, a growth in domestic
demand in the CEE countries is supposed to trigger imports.
The latter should develop at the same pace as exports,
which in turn will have a dampening impact on the
contribution of net exports to GDP growth in 2011 and 2012
in most of the region (with the exception of the Czech
Republic and Slovakia).
Strong impact of rising energy and food prices on inflation
growth, observed in the first half of 2011, should expire in
2012. It will be reflected in a decline in HICP growth in the
region. An additional factor in lowering inflation in the region
will be the fading away of base effects, which stemmed
from increases in indirect taxes and administered prices in
many countries of the region at the beginning of 2011. On
the other hand, as the situation on the labour market
improves, the demand pressure intensifies, which may fuel
the rise in core inflation.
Deteriorating foreign trade balance along with the increasing
income account deficit are likely to be major factors in the
current account deficit widening (or reducing the surplus in
the Baltic states) in 2011 and 2012. According to the
European Commission in 2012, all countries of the region
will show the current account deficit. Opposite trends will
only occur in the Czech Republic and Slovakia, where the
current account deficits are to slightly decrease in the
upcoming years due to the expected increase in the foreign
trade surpluses.

Analysis of economic situation in the countries of Central and Eastern Europe –
Countries of Central and Eastern Europe
National Bank of Poland – July 2011 11
GDP growth rates (in %, y/y)
Contribution to GDP growth in CEE countries (in pp, y/y)
HICP and its components (in %, y/y)
HICP (in %, y/y)
Current account and its components (in % of GDP, 4-quarter moving
average)
Financial account balance and its components (in % of GDP, 4-quarter moving average)
Unemployment rate (%)
General government deficit (in % of GDP)
Source: Eurostat, CSOs

Analysis of economic situation in the countries of Central and Eastern Europe – Bulgaria
National Bank of Poland – July 2011 12
BULGARIA
Economic growth
In the second half of 2010, Bulgaria's economy began to
gradually recover from the 2009 recession. Rapid GDP
growth in 2010 Q4 resulted in a positive (0.3%) growth
rate in the whole 2010. Economic growth in 2011 Q1
points to a continuation of the recovery. GDP growth, as
in 2010, was predominantly based on net exports as a
result of both a high growth in exports and a subdued
growth in imports. In early 2011, domestic demand -
investment expenditures and private consumption - also
positively contributed to GDP growth. In the case of
investment expenditures it was the first positive
contribution to growth after nearly two years of
investments contraction.
Table 2.1
Contribution to GDP growth (in %, y/y)
2009 2010 Q3 2010 Q4 2010 Q1 2011
GDP -5.5 0.1 0.0 3.8 3.4
Private consumption -7.5 -1.3 -0.7 0.8 0.7
Public consumption -6.5 -1.0 -2.8 0.2 -2.3
Fixed capital formation -17.6 -16.5 -21.2 -1.0 1.6
Exports -11.2 16.2 27.6 15.1 20.1
Imports -21.0 4.5 5.3 10.7 8.6
source: Eurostat
The subsequent quarters of 2010 reduced the scale of
decline in private consumption. Over 2010, private
consumption in Bulgaria was decreasing as compared to
2009. Nevertheless, already in 2010 Q4, it edged up
slightly, which was upheld in 2011 Q1. The biggest
increases in consumption expenditures were recorded in
the case of food, while the deepest decline affected
spending on maintenance and households equipment.
The main causes behind consumption sluggish growth
were a further growth in the savings rate (including
precautionary savings) and high unemployment.
The persistent weakness in private consumption fed into
a relatively low growth rate of imports. Which, combined
with a high exports growth rate, resulted in a large
positive contribution of net exports to GDP growth. The
strong increase in exports reflected primarily a rebuilding
of intermediate goods trade, stemming from an
improving economic situation of Bulgaria's major trading
partners, namely Germany and Turkey.
At the beginning of 2011, for the first time in 9 quarters,
investments increased. The largest increase in
investment spending took place in manufacturing, where
a rapid growth in exports contributed to increases in
capacity utilization. Investment growth was also fuelled
by some recovery on the corporate credit market.
In 2011 Q1, as in the previous year, a restrictive fiscal
policy had a negative impact on GDP growth.
Data on retail sales, which were falling until the end of
2010, seem to confirm a significant share of the base
effect in private consumption growth recorded in 2010
Q4. In 2011 Q1, thanks to a buoyant growth in the sales
of textiles and fuels, retail sales increased by 2% q/q,
even though annual growth dynamics remained negative.
The continuing negative sales annual growth rate was
mainly due to persistent declines in the sales of audio-
visual equipment, computers and other household
equipment. After marked increases in the second half of
2010 consumer confidence indicators have fallen back in
2011 Q1 to levels observed at the turn of 2010 Q3 and
2010 Q4. While consumer sentiment indicator
deteriorated, the unemployment rate rose temporarily at
the beginning of 2011.
Industrial output, dependent to a large extend on
external demand, appeared to exhibit a growth trend in
2010. It grew most markedly in petrochemical, paper,
chemical and automotive industries. Business confidence
rose in 2010 to stabilise in 2011 Q1; it improved in most
sectors except for services.
Labour market
High unemployment rate was one of the main reasons
behind the decline in private consumption; in 2010, it
rose from 8.8% to 11.4%. It was only in 2011 Q1 that
the unemployment rate stabilised, reflecting mainly the
waning of negative seasonal factors from 2010 Q4. No
improvement should be anticipated on the Bulgarian
labour market soon, which still suffers significant declines
in employment (by 4.4% y/y in 2010 Q4) - deepest in the
whole CEE region. In addition, a significant share of long-
term unemployment and a relatively inflexible labour
markets make the discouraged worker effect very likely.
A marked unemployment growth and negative growth of
employment contributed to the decline in unit labour
costs throughout 2010 and early this year. Nominal
wages declined during this period, i.a. in the processing
industry, which contributed to its competitiveness. Wages
grew only in the public sector, education, healthcare,
financial services and credit services.
Inflation and labour costs
In 2011 Q1 HICP resumed the rise initiated in 2010 and
stabilized at 4.6% in March. Food and energy prices
contributed the most to inflation growth both in 2010 and
2011. Nonetheless last year, in addition to these external
factors, a significant contribution came from internal
factors such as increases in excise duties on tobacco
products and increases in some administered prices.
However, core inflation, reflecting i.a. the weakness of
domestic demand and a decline in unit labour costs, had
no significant effect on the leading inflation index during
this period. Data for April and May indicate a decline in
Analysis of economic situation in the countries of Central and Eastern Europe – Bulgaria
National Bank of Poland – July 2011 13
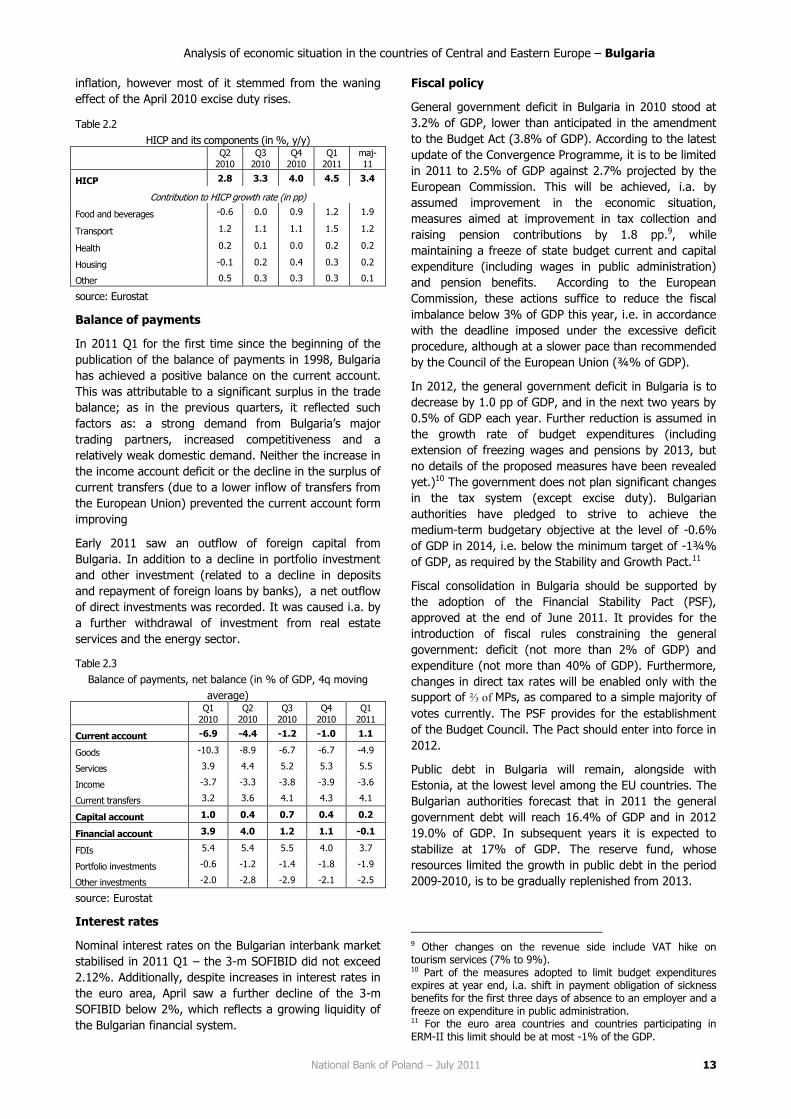
inflation, however most of it stemmed from the waning
effect of the April 2010 excise duty rises.
Table 2.2
HICP and its components (in %, y/y)
Q2
2010 Q3
2010 Q4
2010 Q1
2011 maj-11
HICP 2.8 3.3 4.0 4.5 3.4
Contribution to HICP growth rate (in pp)
Food and beverages -0.6 0.0 0.9 1.2 1.9
Transport 1.2 1.1 1.1 1.5 1.2
Health 0.2 0.1 0.0 0.2 0.2
Housing -0.1 0.2 0.4 0.3 0.2
Other 0.5 0.3 0.3 0.3 0.1
source: Eurostat
Balance of payments
In 2011 Q1 for the first time since the beginning of the
publication of the balance of payments in 1998, Bulgaria
has achieved a positive balance on the current account.
This was attributable to a significant surplus in the trade
balance; as in the previous quarters, it reflected such
factors as: a strong demand from Bulgaria’s major
trading partners, increased competitiveness and a
relatively weak domestic demand. Neither the increase in
the income account deficit or the decline in the surplus of
current transfers (due to a lower inflow of transfers from
the European Union) prevented the current account form
improving
Early 2011 saw an outflow of foreign capital from
Bulgaria. In addition to a decline in portfolio investment
and other investment (related to a decline in deposits
and repayment of foreign loans by banks), a net outflow
of direct investments was recorded. It was caused i.a. by
a further withdrawal of investment from real estate
services and the energy sector.
Table 2.3
Balance of payments, net balance (in % of GDP, 4q moving
average)
Q1
2010
Q2
2010
Q3
2010
Q4
2010
Q1
2011
Current account -6.9 -4.4 -1.2 -1.0 1.1
Goods -10.3 -8.9 -6.7 -6.7 -4.9
Services 3.9 4.4 5.2 5.3 5.5
Income -3.7 -3.3 -3.8 -3.9 -3.6
Current transfers 3.2 3.6 4.1 4.3 4.1
Capital account 1.0 0.4 0.7 0.4 0.2
Financial account 3.9 4.0 1.2 1.1 -0.1
FDIs 5.4 5.4 5.5 4.0 3.7
Portfolio investments -0.6 -1.2 -1.4 -1.8 -1.9
Other investments -2.0 -2.8 -2.9 -2.1 -2.5
source: Eurostat
Interest rates
Nominal interest rates on the Bulgarian interbank market
stabilised in 2011 Q1 – the 3-m SOFIBID did not exceed
2.12%. Additionally, despite increases in interest rates in
the euro area, April saw a further decline of the 3-m
SOFIBID below 2%, which reflects a growing liquidity of
the Bulgarian financial system.
Fiscal policy
General government deficit in Bulgaria in 2010 stood at
3.2% of GDP, lower than anticipated in the amendment
to the Budget Act (3.8% of GDP). According to the latest
update of the Convergence Programme, it is to be limited
in 2011 to 2.5% of GDP against 2.7% projected by the
European Commission. This will be achieved, i.a. by
assumed improvement in the economic situation,
measures aimed at improvement in tax collection and
raising pension contributions by 1.8 pp.9, while
maintaining a freeze of state budget current and capital
expenditure (including wages in public administration)
and pension benefits. According to the European
Commission, these actions suffice to reduce the fiscal
imbalance below 3% of GDP this year, i.e. in accordance
with the deadline imposed under the excessive deficit
procedure, although at a slower pace than recommended
by the Council of the European Union (¾% of GDP).
In 2012, the general government deficit in Bulgaria is to
decrease by 1.0 pp of GDP, and in the next two years by
0.5% of GDP each year. Further reduction is assumed in
the growth rate of budget expenditures (including
extension of freezing wages and pensions by 2013, but
no details of the proposed measures have been revealed
yet.)10 The government does not plan significant changes
in the tax system (except excise duty). Bulgarian
authorities have pledged to strive to achieve the
medium-term budgetary objective at the level of -0.6%
of GDP in 2014, i.e. below the minimum target of -1¾%
of GDP, as required by the Stability and Growth Pact.11
Fiscal consolidation in Bulgaria should be supported by
the adoption of the Financial Stability Pact (PSF),
approved at the end of June 2011. It provides for the
introduction of fiscal rules constraining the general
government: deficit (not more than 2% of GDP) and
expenditure (not more than 40% of GDP). Furthermore,
changes in direct tax rates will be enabled only with the
support of ⅔ of MPs, as compared to a simple majority of
votes currently. The PSF provides for the establishment
of the Budget Council. The Pact should enter into force in
2012.
Public debt in Bulgaria will remain, alongside with
Estonia, at the lowest level among the EU countries. The
Bulgarian authorities forecast that in 2011 the general
government debt will reach 16.4% of GDP and in 2012
19.0% of GDP. In subsequent years it is expected to
stabilize at 17% of GDP. The reserve fund, whose
resources limited the growth in public debt in the period
2009-2010, is to be gradually replenished from 2013.
9 Other changes on the revenue side include VAT hike on tourism services (7% to 9%). 10 Part of the measures adopted to limit budget expenditures expires at year end, i.a. shift in payment obligation of sickness benefits for the first three days of absence to an employer and a freeze on expenditure in public administration. 11 For the euro area countries and countries participating in ERM-II this limit should be at most -1% of the GDP.
Analysis of economic situation in the countries of Central and Eastern Europe – Bulgaria
National Bank of Poland – July 2011 14
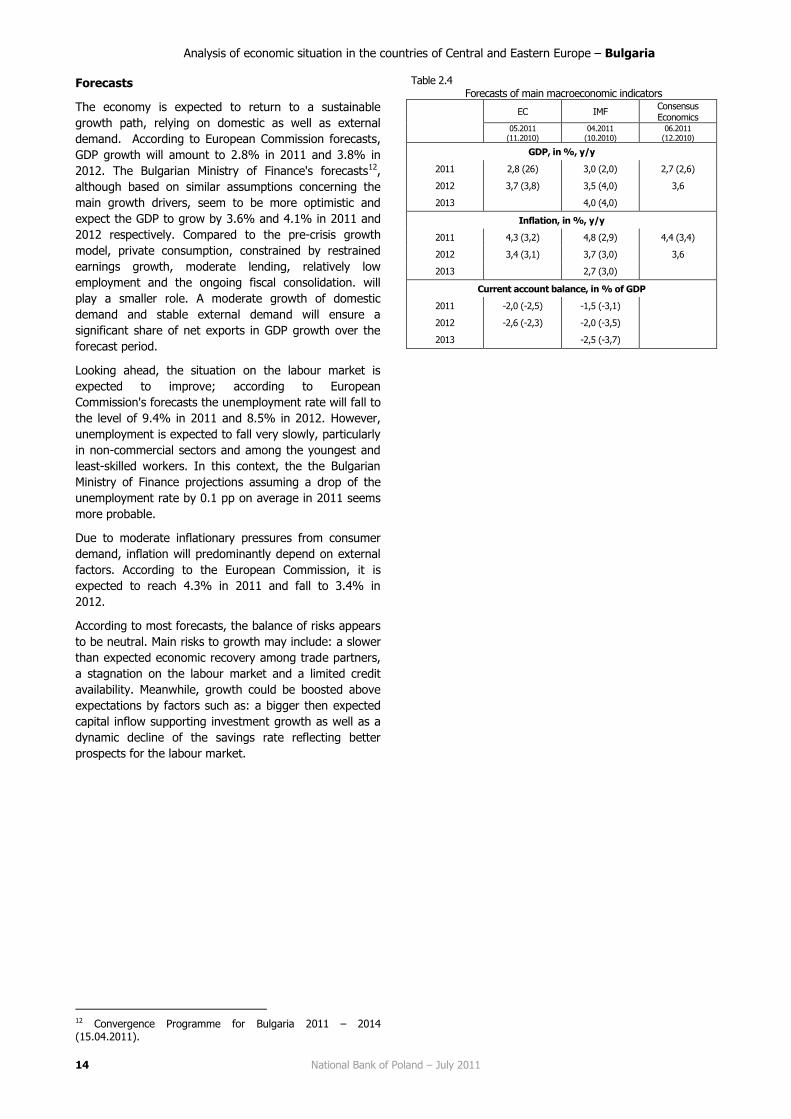
Forecasts
The economy is expected to return to a sustainable
growth path, relying on domestic as well as external
demand. According to European Commission forecasts,
GDP growth will amount to 2.8% in 2011 and 3.8% in
2012. The Bulgarian Ministry of Finance's forecasts12,
although based on similar assumptions concerning the
main growth drivers, seem to be more optimistic and
expect the GDP to grow by 3.6% and 4.1% in 2011 and
2012 respectively. Compared to the pre-crisis growth
model, private consumption, constrained by restrained
earnings growth, moderate lending, relatively low
employment and the ongoing fiscal consolidation. will
play a smaller role. A moderate growth of domestic
demand and stable external demand will ensure a
significant share of net exports in GDP growth over the
forecast period.
Looking ahead, the situation on the labour market is
expected to improve; according to European
Commission's forecasts the unemployment rate will fall to
the level of 9.4% in 2011 and 8.5% in 2012. However,
unemployment is expected to fall very slowly, particularly
in non-commercial sectors and among the youngest and
least-skilled workers. In this context, the the Bulgarian
Ministry of Finance projections assuming a drop of the
unemployment rate by 0.1 pp on average in 2011 seems
more probable.
Due to moderate inflationary pressures from consumer
demand, inflation will predominantly depend on external
factors. According to the European Commission, it is
expected to reach 4.3% in 2011 and fall to 3.4% in
2012.
According to most forecasts, the balance of risks appears
to be neutral. Main risks to growth may include: a slower
than expected economic recovery among trade partners,
a stagnation on the labour market and a limited credit
availability. Meanwhile, growth could be boosted above
expectations by factors such as: a bigger then expected
capital inflow supporting investment growth as well as a
dynamic decline of the savings rate reflecting better
prospects for the labour market.
12 Convergence Programme for Bulgaria 2011 – 2014 (15.04.2011).
Table 2.4 Forecasts of main macroeconomic indicators
EC IMF
Consensus Economics
05.2011 (11.2010)
04.2011 (10.2010)
06.2011 (12.2010)
GDP, in %, y/y
2011 2,8 (26) 3,0 (2,0) 2,7 (2,6)
2012 3,7 (3,8) 3,5 (4,0) 3,6
2013 4,0 (4,0)
Inflation, in %, y/y
2011 4,3 (3,2) 4,8 (2,9) 4,4 (3,4)
2012 3,4 (3,1) 3,7 (3,0) 3,6
2013 2,7 (3,0)
Current account balance, in % of GDP
2011 -2,0 (-2,5) -1,5 (-3,1)
2012 -2,6 (-2,3) -2,0 (-3,5)
2013 -2,5 (-3,7)

Analysis of economic situation in the countries of Central and Eastern Europe – Bulgaria
National Bank of Poland – July 2011 15
Contribution to GDP growth (in pp, y/y)
HICP and its components (in %, y/y)
Retail sales (in %, y/y) and consumer sentiment index
Industrial production (in %, y/y) and business sentiment index
Current account and its components (in % of GDP, 4-quarter moving
average)
Financial account balance and its components (in % of GDP, 4-quarter moving average)
Unemployment rate (%) and employment growth rate (in %, y/y)
General government debt and deficit (in % of GDP)
Source: Eurostat, CSOs

Analysis of economic situation in the countries of Central and Eastern Europe – Czech Republic
National Bank of Poland – July 2011 16
CZECH REPUBLIC
Economic growth
In 2010, the Czech economy entered the recovery process.
Real GDP, after declining by 4.1% in 2009, increased by
2.3% in 2010. The upward trend also continued in 2011 Q1.
Most of GDP growth in the Czech Republic in 2010 resulted
from the inventories rebuilding. This was seen especially in
the second half of last year, when this category contributed
3.5 pp. to annual average GDP growth. Private consumption
edged up in the first three quarters of 2010, only to resume
a fall in Q4. Large falls in fixed capital formation in 2010 Q1
were not fully compensated for in subsequent quarters of
last year. Hence, for another year domestic demand had a
dampening impact on GDP growth in the Czech Republic.
Positive contribution of foreign trade observed in the first
half of last year decreased markedly in the second half of
2010.
Both private and public consumption edged up slightly in the
Czech Republic in 2010. Private consumption grew only in in
the first three quarters of last year, as a result of gradual
improvement in labour market conditions and growth in
households disposable income. However, in 2010 Q4,
household consumption expenditure declined. This was
probably the result of inflation, which translated into a fall in
real disposable income, and of increasing savings rate in the
Czech Republic. Public sector expenditure rose only in the
first half of 2010. In the second half of 2010 the
government already started to implement the plan of fiscal
tightening, which resulted in a decrease in spending. In
2011 Q1, both private and public consumption still declined
in annual terms.
Table 3.1 GDP and its components (in % y/y)
2009 2010 Q3 2010 Q4 2010 Q1 2011
GDP -4.1 2.3 2.6 2.7 2.8
Private consumption -0.3 0.0 0.0 0.6 -0.4
Public consumption 4.2 -0.1 -0.7 -2.4 -1.2
Fixed capital formation -9.2 -3.1 0.0 -0.1 3.8
Exports -10.8 18.0 16.4 16.8 15.6
Imports -10.6 18.0 19.2 17.4 13.2
source: Eurostat
Fixed capital formation in the Czech Republic in 2010
declined again. This was the third consecutive year of falling
investment. Decline was wide-ranged, affecting most
markedly investment in transport (-15%) and machinery
and equipment (-8%). In 2011 Q1, however, a marked
acceleration of investment could already be seen in the
Czech Republic.
The main growth driver in 2010 was a marked increase in
inventories. This increase was mainly due to increased
demand in the export sector, which replenished stocks
strongly depleted during crisis. In 2011 Q1, the positive
contribution of inventories to GDP growth disappeared.
Foreign trade intensified in the Czech Republic since early
2010. The strong recovery in exports was due to the
growing demand in quickly recovering economies of major
trading partners (mainly German, Polish and Slovak). The
second half of 2010 witnessed the acceleration of imports,
mainly intermediate goods. As a result, the contribution of
net exports to GDP growth for all the 2010 was relatively
small. Meanwhile, in 2011 Q1 import growth slowed while
export growth remained similar to that observed in previous
quarters. Thus, the contribution of net exports to GDP
markedly increased.
After a clear drop in retail sales in 2010 Q4, retail trade
resumed its growth in 2011 Q1 in the Czech Republic
(1.9%). In both cases, the changes in the volume of retail
trade turnover were primarily affected by sales of fuels.
Retail sale of other categories of goods did not change
significantly during this period. Both in 2010 and in the first
four months of 2011 the number of newly registered cars in
the Czech Republic markedly increased, respectively by
4.7% and 3.7% y/y.
The rise in inflation in the second half of 2010 was a primary
reason for decline in consumer confidence in the Czech
Republic. The trend persisted over the first months of 2011
when it was additionally fuelled by worsening economic
outlook for the country in the next 12 months.
Stimulated by external demand, industrial output grew
rapidly in 2010, to rise by 9% over the whole year in
comparison with 2009. A particularly rapid growth in output
was observed in the case of electrical and electronic
equipment and cars (over 20% y/y). In the period January-
April 2011, the growth rate of industrial output in the Czech
Republic remain high. Persistently, machinery and transport
equipment continued to account for most of this rise.
Additionally, output soared in the chemical, wood and paper
industries. On the other hand, rising fuel prices and
declining demand limited the output in the petrochemical
industry.
The growth of industrial production in 2010 in the Czech
Republic was backed up by continued improvement of
business sentiment. It resulted mainly from a larger number
of orders, especially foreign orders. Moreover, ever more
businesses declared the intention to increase employment,
especially in industry. In the first four months of 2011 the
declining portfolio of orders, and deteriorating output
outlook in the Czech Republic put an end to a business
sentiment growth.
Labour market
After a slight increase in 2010 Q4 (due to the amendment of
the regulations concerning the right to unemployment
benefit) the harmonised unemployment rate in the Czech
Republic resumed a gradual decline from the beginning of
2011 to reach 6.9% in April as against 7.2% in December
2010.
Analysis of economic situation in the countries of Central and Eastern Europe – Czech Republic
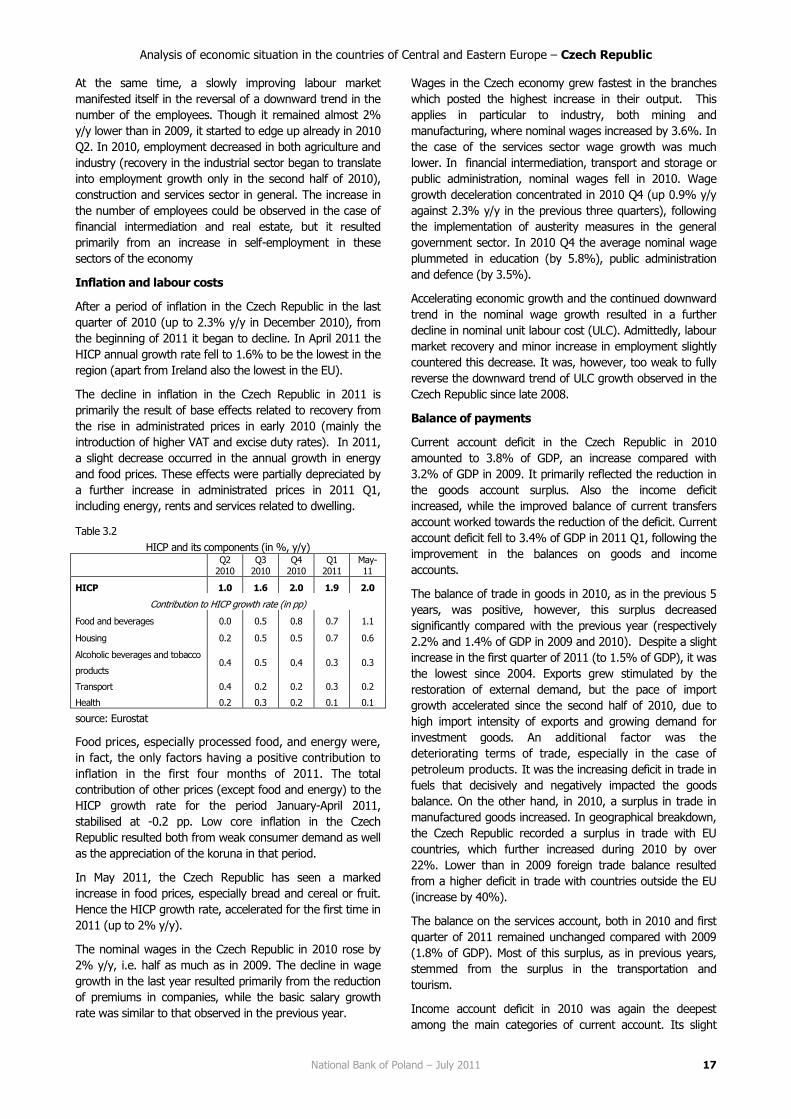
National Bank of Poland – July 2011 17
At the same time, a slowly improving labour market
manifested itself in the reversal of a downward trend in the
number of the employees. Though it remained almost 2%
y/y lower than in 2009, it started to edge up already in 2010
Q2. In 2010, employment decreased in both agriculture and
industry (recovery in the industrial sector began to translate
into employment growth only in the second half of 2010),
construction and services sector in general. The increase in
the number of employees could be observed in the case of
financial intermediation and real estate, but it resulted
primarily from an increase in self-employment in these
sectors of the economy
Inflation and labour costs
After a period of inflation in the Czech Republic in the last
quarter of 2010 (up to 2.3% y/y in December 2010), from
the beginning of 2011 it began to decline. In April 2011 the
HICP annual growth rate fell to 1.6% to be the lowest in the
region (apart from Ireland also the lowest in the EU).
The decline in inflation in the Czech Republic in 2011 is
primarily the result of base effects related to recovery from
the rise in administrated prices in early 2010 (mainly the
introduction of higher VAT and excise duty rates). In 2011,
a slight decrease occurred in the annual growth in energy
and food prices. These effects were partially depreciated by
a further increase in administrated prices in 2011 Q1,
including energy, rents and services related to dwelling.
Table 3.2
HICP and its components (in %, y/y)
Q2
2010 Q3
2010 Q4
2010 Q1
2011 May-11
HICP 1.0 1.6 2.0 1.9 2.0
Contribution to HICP growth rate (in pp)
Food and beverages 0.0 0.5 0.8 0.7 1.1
Housing 0.2 0.5 0.5 0.7 0.6
Alcoholic beverages and tobacco
products 0.4 0.5 0.4 0.3 0.3
Transport 0.4 0.2 0.2 0.3 0.2
Health 0.2 0.3 0.2 0.1 0.1
source: Eurostat
Food prices, especially processed food, and energy were,
in fact, the only factors having a positive contribution to
inflation in the first four months of 2011. The total
contribution of other prices (except food and energy) to the
HICP growth rate for the period January-April 2011,
stabilised at -0.2 pp. Low core inflation in the Czech
Republic resulted both from weak consumer demand as well
as the appreciation of the koruna in that period.
In May 2011, the Czech Republic has seen a marked
increase in food prices, especially bread and cereal or fruit.
Hence the HICP growth rate, accelerated for the first time in
2011 (up to 2% y/y).
The nominal wages in the Czech Republic in 2010 rose by
2% y/y, i.e. half as much as in 2009. The decline in wage
growth in the last year resulted primarily from the reduction
of premiums in companies, while the basic salary growth
rate was similar to that observed in the previous year.
Wages in the Czech economy grew fastest in the branches
which posted the highest increase in their output. This
applies in particular to industry, both mining and
manufacturing, where nominal wages increased by 3.6%. In
the case of the services sector wage growth was much
lower. In financial intermediation, transport and storage or
public administration, nominal wages fell in 2010. Wage
growth deceleration concentrated in 2010 Q4 (up 0.9% y/y
against 2.3% y/y in the previous three quarters), following
the implementation of austerity measures in the general
government sector. In 2010 Q4 the average nominal wage
plummeted in education (by 5.8%), public administration
and defence (by 3.5%).
Accelerating economic growth and the continued downward
trend in the nominal wage growth resulted in a further
decline in nominal unit labour cost (ULC). Admittedly, labour
market recovery and minor increase in employment slightly
countered this decrease. It was, however, too weak to fully
reverse the downward trend of ULC growth observed in the
Czech Republic since late 2008.
Balance of payments
Current account deficit in the Czech Republic in 2010
amounted to 3.8% of GDP, an increase compared with
3.2% of GDP in 2009. It primarily reflected the reduction in
the goods account surplus. Also the income deficit
increased, while the improved balance of current transfers
account worked towards the reduction of the deficit. Current
account deficit fell to 3.4% of GDP in 2011 Q1, following the
improvement in the balances on goods and income
accounts.
The balance of trade in goods in 2010, as in the previous 5
years, was positive, however, this surplus decreased
significantly compared with the previous year (respectively
2.2% and 1.4% of GDP in 2009 and 2010). Despite a slight
increase in the first quarter of 2011 (to 1.5% of GDP), it was
the lowest since 2004. Exports grew stimulated by the
restoration of external demand, but the pace of import
growth accelerated since the second half of 2010, due to
high import intensity of exports and growing demand for
investment goods. An additional factor was the
deteriorating terms of trade, especially in the case of
petroleum products. It was the increasing deficit in trade in
fuels that decisively and negatively impacted the goods
balance. On the other hand, in 2010, a surplus in trade in
manufactured goods increased. In geographical breakdown,
the Czech Republic recorded a surplus in trade with EU
countries, which further increased during 2010 by over
22%. Lower than in 2009 foreign trade balance resulted
from a higher deficit in trade with countries outside the EU
(increase by 40%).
The balance on the services account, both in 2010 and first
quarter of 2011 remained unchanged compared with 2009
(1.8% of GDP). Most of this surplus, as in previous years,
stemmed from the surplus in the transportation and
tourism.
Income account deficit in 2010 was again the deepest
among the main categories of current account. Its slight

Analysis of economic situation in the countries of Central and Eastern Europe – Czech Republic
National Bank of Poland – July 2011 18
deterioration in 2010 resulted from the growing imbalance
in direct and portfolio investment income. Meanwhile the
deficit in remittances declined, which was associated with
lower salaries paid to foreign workers in the Czech Republic.
In 2011 Q1 income account deficit decreased slightly.
Current transfers were balanced in 2010 and 2011 Q1
(compared with the deficit reaching 0.3% of GDP in 2009).
This resulted primarily from a surplus in the account of
government transfers, while a deficit persisted in private
transfers.
Table 3.3
Balance of payments, net balance (in % of GDP, 4q moving
average)
Q1
2010 Q2
2010 Q3
2010 Q4
2010 Q1
2011
Current account -3.0 -2.5 -3.9 -3.8 -3.4
Goods 2.4 2.3 1.7 1.4 1.5
Services 1.8 2.0 1.9 1.8 1.8
Income -6.9 -6.5 -7.3 -7.0 -6.7
Current transfers -0.4 -0.3 -0.1 0.0 0.0
Capital account 0.8 0.9 1.2 0.7 0.7
Financial account 3.8 3.1 6.5 5.0 4.8
FDIs 1.4 1.7 4.1 2.6 2.1
Portfolio investments 4.7 4.3 5.8 4.3 2.6
Other investments -2.3 -2.9 -3.3 -1.8 0.1
source: Eurostat
Inflow of foreign capital to the Czech Republic in 2010 and
2011 Q1 maintained the upward trend observed since mid-
2009, to reach 5% of GDP for the whole year as compared
to 4.3% of GDP in 2009. The increase was particularly
marked in direct investment, which soared more than
fivefold. This rise was primarily due to a growth in
reinvested earnings, which accounted for almost 2/3 of the
total inflow of direct investment. Most of the inflow was
directed into the in the metallurgical and retail trade
companies.
Mainly due to a decline in 2010 Q4 the inflow of portfolio
investments slowed down, and may signify a wane in
foreign investors' interest in the Czech government bonds,
much sought for in 2009 and 2010. The preliminary data as
of 2011 Q1 apparently confirm the outflow of portfolio
investment from the Czech Republic for the first time since
2008.
The 2010 saw an increase in the other investment deficit. It
resulted on the one hand from the need to repay loans
taken out abroad, on the other, from the growing deposits
of Czech residents in foreign financial institutions. In turn,
2011 Q1 witnessed a small inflow of other investments into
the banking sector, mainly in the form of deposits, which
partly compensated for lower interest in government bonds.
Interest rates and exchange rate
Since May 2010, when the Czech National Bank (CNB) cut
its main interest rate (2W Repo Rate) to its lowest ever level
of 0.75%. It remained at this level until May 2011. The CNB
decided not to raise interest rates, even though the move
was made both the ECB and central banks in the region.
The CNB explained this by low inflation forecast for the
coming quarters (near the inflation target - less than 2%),
while economic growth is expected to remain low. Interest
rates on the interbank market during this period were very
stable. Between May 2010 and May 2011, the 3M PRIBOR
virtually stabilised around 1.19-1.22%.
As discussions about the continuation of financial assistance
between Hungary and the IMF collapsed and information
emerged about the financial problems of the euro area
peripheral countries, turbulence developed in European
financial markets in the second half of 2010, and investors
started losing confidence in Czech assets. This was
manifested by an increase in government bond yields (10-
year bond yields rose from 3.3% in August 2010 to 4.1% in
January 2011). Yields on Czech bonds remained at an
elevated level (3.9-4.1%) from January to April 2011,
despite abating concerns related to the debt crisis in the
euro area. This again followed from global factors, especially
political instability in North African countries and a rapid rise
in oil prices. Bond yields markedly declined in May 2011 (by
about 20 bps).
Between January-May 2011 the development of the Czech
koruna (CZK) exchange rate reflected both the situation in
global financial markets and domestic monetary policy bias.
During this period, CZK strengthened against the euro by
3%. Yet the appreciation only took place in January, when
risk aversion among investors due to the said crisis slowly
weakened. Political turmoil in North Africa, on the one hand,
and an increase in the negative spread between interest
rates in the Czech Republic and the euro area (by the
decision of the ECB to raise interest rates) on the other
hand, stopped the appreciation of the koruna in the
following months of 2011.
Fiscal policy
Czech general government deficit fell from 5.9% in 2009
to 4.7% of GDP in 2010 (against 5.1% projected by the
government). Its reduction resulted from implemented
measures focused on the revenue side (such as increase
in VAT, excise, property taxes, a minimum social
insurance and health contributions base), accompanied
by reductions in social spending, freezing the indexation
of pensions and current expenditures (including wages in
public administration) cuts. In addition, the Czech
government withdrew measures related to the anti-crisis
package.
In 2011 fiscal imbalance in the Czech Republic is to reach
4.2% of GDP (4.4% of GDP according to the EC
forecast). Its reduction, compared with the previous
year, will result from the changes affecting mainly the
expenditure side. These include, among others, cuts
applied to wages in the public administration (by 10%13)
and social benefits14
In the following years the Czech authorities plans to
improve the general government balance by about 0.6 pp
of GDP annually in 2012 and 2013 and by 0.9 pp of GDP
13 Apart from teachers, whose wages are to increase by 3.5%. 14 I.a. birth allowances, social and unemployment benefit.

Analysis of economic situation in the countries of Central and Eastern Europe – Czech Republic
National Bank of Poland – July 2011 19
in 2014. The medium-term budgetary objective
(structural deficit at 1.0% of GDP) would be achieved in
2016. Adoption of pension and health care reform is to
affect revenue and expenditure side in future years.
From 2013 a voluntary funded pension pillar is going to
be introduced. The part of the pension contribution to be
transferred to the fund from the PAYG scheme was set
up at 3%15. The resulting loss of state budget revenues
is to be offset by increases in VAT rates. In 2012, the
reduced VAT rate is to rise from 10% to 14%, while the
base rate will remain at its current level (20%). Since
2013, only one rate of VAT at 17.5% will be applicable.16
The effect of the pension reform is to be neutral in the
coming years, with a reduced VAT rate hike before a
launch of the voluntary pension funds will temporarily
reduce the budget deficit by ca. 0.6% of GDP. Parallely,
the retirement age for men and women is going to be
gradually raised and made equal (up to ca. 67 years in
2041). Currently there are also other changes under
discussion aimed at ensuring the sustainability of the
pension system in the Czech Republic, including further
raising of the retirement age,17 reducing the discretionary
indexation of benefits and phasing out of the early
retirement system. The health care reform is planned as
of 2012 to allow charges for increased treatment
standard, higher fees for hospital stays and for visits to a
specialist doctor without a referral from a general
practitioner.
In subsequent years, amendments to the tax system18
are going to involve increasing the taxation of income
from gambling, the introduction of incentives in the CIT
(regarding the dividend, the exemption of investment
and pension funds), while limiting them within the PIT
(only child tax credit will be increased). The principles of
paying social security contributions by self-employed
persons also will be affected, and the taxation on
employee benefits is to be more favourable than before.
As a result of their adoption, the general government
balance will show a small improvement in 2012 (by about
0.2% of GDP), while in subsequent years it will
deteriorate (by about 0.2% of GDP in 2013 and 0.6% of
GDP in 2014).
Moreover, in the Czech Republic in 2012-2014 wages in
public administration are to be maintained at the level of
2011 (except teachers and health sector). Budgetary
savings in 2013 will also stem from a review of spending
of individual ministries (planned cuts of 5%) and changes
in the system of public procurement. Reducing the
budget deficit within the deadline set by the EDP (i.e. by
15 An employee shall pay also additional contribution from his own pocket, in the amount of 2% or 3% of his wages. 16 Furthermore the threshold for registration as a VAT payer will be reduced (from CZK 1 mil to CZK 0.75 mil). 17 After 2041 the pension age would be raised by 2 months every year (no upper limit is envisaged). 18 Additionally the rates of PIT, contributions for social and health security will be converted due to a change in the reference base for their assessment. At present it is gross wage plus contributions for social and health security. After the change it will be only gross wage.
2013) may require additional consolidation measures. In
the opinion of the EC, macro-economic assumptions of
the Czech authorities for the years 2013-2014 are too
optimistic, and the pace of fiscal tightening over the
period 2010-2013 is below the recommended level (i.e.
1% of GDP annually).
The Czech government is considering strengthening the
institutional framework of public finances, with the
possibility of establishing a fiscal council.
Czech public debt is projected to increase from 38.5% of
GDP to 42.0% of GDP in 2014, The government plans to
reduce the borrowing needs of the sector, with the
introduction of a treasury single account.
Forecasts
Recent CNB projections show a marked decline in GDP
growth in 2011. The greatest impact will be attributable to
the tightening of fiscal policy, which directly or indirectly will
affect domestic demand. Fixed capital formation is expected
to decline due to the limitations of public investment and the
fading of the effect associated with the installation of
photovoltaic cells in the second half of 2010. Inventory
rebuilding, which used to strongly support economic growth
in 2010, will stop. Private consumption is going to continue
its growth at a slow pace, due to anticipated persistent
stagnation in the labour market, especially in the public
sector. Employment growth, which was observed at the
beginning of 2011 resulted from a low base effect and in
subsequent quarters it will come to a halt. Also a decline in
public consumption is forecast. Most of the growth in the
Czech economy will come from net exports.
The increase in GDP growth in the Czech Republic (to a level
comparable to that observed in 2010) is expected in 2012,
when domestic demand, especially households
consumption, should increase as a result of improved labour
market conditions.
In 2011 Q2, inflation should edge up in the Czech Republic.
Both the overall and core inflation rate should slightly
exceed the value of CNB inflation target (2%). Both
measures of inflation are expected to oscillate around 2% in
the second half of 2011 and 2012. Inflation rise will be
mainly stimulated by the growing pressure associated with
an increase in wages (especially in 2012) and additional
increases in administered prices (especially energy prices).
The anticipated appreciation of the koruna and the expected
declines in the growth rate of energy and food prices should
operate in the opposite direction.
Current account deficit in 2011 and 2012 may increase
considerably. This will be linked to the likely deterioration in
the income account balance, only partially compensated by
an increase in the surplus in foreign trade.

Analysis of economic situation in the countries of Central and Eastern Europe – Czech Republic
National Bank of Poland – July 2011 20
Table 3.4
Forecasts of main macroeconomic indicators
ČNB EC OECD IMF
05.2011
(11.2010)
05.2011
(11.2010)
05.2011
(11.2010)
04.2011
(10.2010)
GDP, in %, y/y
2011 2011 1,5 (1,2) 2,0 (2,3) 2,4 (2,8)
2012 2012 2,8 (2,5) 2,9 (3,1) 3,5 (3,2)
2013 2013
Inflation, in %, y/y
2011 1,9 (1,9) 2,3 (2,1) 2,2 (1,9) 2,0 (2,0)
2012 2,2 (2,0) 2,5 (2,2) 3,1 (1,7) 2,0 (2,0)
2013 2,0 (2,0)
Current account balance, in % of GDP
2011 -4,0 (-2,2) -2,5 (-1,5) -3,0 (-0,8) -1,8 (-0,6)
2012 -4,3 (-2,5) -1,9 (-1,1) -3,4 (-0,7) -1,2 (-0,6)
2013 -0,9 (-0,6)
ČNB – Inflation Report, Česká Národní Banka.

Analysis of economic situation in the countries of Central and Eastern Europe – Czech Republic
National Bank of Poland – July 2011 21
Contribution to GDP growth (in pp, y/y)
HICP and its components (in %, y/y)
Retail sales (in %, y/y) and consumer sentiment index
Industrial production (in %, y/y) and business sentiment index
Current account and its components (in % of GDP, 4-quarter moving
average)
Financial account balance and its components (in % of GDP, 4-quarter moving average)
Unemployment rate (%) and employment growth rate (in %, y/y)
General government debt and deficit (in % of GDP)
Source: Eurostat, CSOs

Analysis of economic situation in the countries of Central and Eastern Europe – Estonia
National Bank of Poland – July 2011 22
ESTONIA
Economic growth
Despite a strong downturn during the crisis (GDP lost a
total of 19% in 2008-2009 in real terms), Estonia's
economy relatively quickly emerged from recession, to
grow at 3.1% y/y in 2010. Although the first signs of
recovery occurred already in the first half of 2010, GDP
markedly accelerated only in the second half of 2010,
mainly as a result of recovery in the economies of major
trading partners (mainly Sweden, Finland and Germany)
which stimulated foreign demand19.
Whereas Estonia's foreign trade intensified already in
early 2010, the volume of trade in goods significantly
increased only in Q3 and 4. Throughout 2010 exports
increased by 21.7% and imports rose by 21.0%, which in
turn resulted in a positive contribution of net exports to
GDP growth.
In contrast to foreign trade, domestic demand for most
of 2010 remained weak, showing no signs of recovery.
Growth impulse for Estonian economy at that time came
from the corporate sector. Over the first three quarters of
2010 the companies continued a process of rebuilding
inventories, which supported economic activity.
However, in 2010 Q4 the role of the latter clearly fell in
favour of increasing investment, which had trended
downwards as from 2007 Q3. Yet, despite the growth
recorded during the period October to December last
year, their growth rate in the whole 2010 was negative (-
9.2% y/y).
Table 4.1 GDP and its components (in % y/y)
2009 2010 Q3 2010 Q4 2010 Q1 2011
GDP -13.9 3.1 5.4 6.8 8.6
Private consumption -18.9 -1.9 0.9 2.6 5.0
Public consumption -0.5 -2.1 -1.7 -1.4 1.2
Fixed capital formation -34.4 -9.2 -8.8 11.7 12.0
Exports -11.2 21.7 24.5 36.8 38.7
Imports -26.8 21.5 29.8 32.5 38.3
source: Eurostat
Both private and public consumption had a dampening
effect on the economy of Estonia in 2010. Private
consumption fell by 1.9% y/y in 2010, mainly due to the
ongoing process of "debt reduction" of households, high
unemployment and wages lower than last year, although
consumer spending accelerated slightly in the second half
of 2010. The general government expenditures
decreased in all quarters of last year, i.a. due to the
ongoing fiscal consolidation.
According to preliminary estimates, Estonia's GDP rose by
8.5% y/y in 2011 Q1. In other words, Estonian economy
climbed upwards for the fourth consecutive quarter.
Economic upturn resulted this time from domestic
demand, not like last year, from foreign trade, whose
19 Those countries’ share in the exports of goods from Estonia ranges within 35-40%.
contribution has clearly diminished as a result of a
significant acceleration in imports growth relative to
previous quarters. This resulted from a marked revival of
business investment activity, as evidenced by the second
consecutive quarter of a double-digit growth in fixed
capital formation (indirectly due to a low reference base
in 2010) and rising inventories.
GDP growth in 2001 Q1 also reflected the improving
private consumption, largely contributed to by rising
transport and housing costs. In the first four months of
2010 retail sales in Estonia continued their upward trend,
but remained below the level prior to the outbreak of the
global financial crisis. On the other hand, according to a
survey of the European Commission, consumer sentiment
deteriorated in the period January-May this year,
primarily weakened by the growing concerns about
future financial position of households and developments
in the domestic labour market.
Exports continued to grow at a rapid pace in 2011 Q1.
On the other hand, industrial output, which continued
upwards, started to level off over the first three months
of 2011, to slow down in annual terms in April. This may
represent a gradual deceleration of the two-digit growth
in exports.
Labour market
The global financial crisis and subsequent recession
triggered Estonian labour market adjustments. These
were not only exceptionally large in terms of scale, but
also occurred in a relatively short period of time. On the
one hand it confirms a high flexibility of the Estonian
labour market, while on the other hand it reflects active
measures taken by the government in 2009-2010, to
boost employment and evade a growth in
unemployment, mainly a long-term one.
The unemployment rate reached its maximum (18.8%) in
2010 Q1, putting an end to a steady rise – since 2008 Q2
– in the number of the unemployed. More recently the
unemployment rate has declined, to reach 14.5% in 2010
Q4. According to preliminary data of the first three
months of 2011 it continued to tumble down, to average
13.8%.
High unemployment was reflected in the sustained
negative employment growth in the economy of Estonia
for the most part of 2010. In 2010 Q4 the number of
employees edged up (0.6% y/y), along with a strong
rebound in export-oriented industrial sectors.
Throughout 2010, employment fell by 4.8% y/y as
against a decline of 10% y/y in 2009. The largest
declines occurred in industry (-9.7% y/y), while the scale
of redundancy in the service sector was relatively low (-
2.7% y/y).

Analysis of economic situation in the countries of Central and Eastern Europe – Estonia
National Bank of Poland – July 2011 23
Inflation and labour costs
In 2010, the annual HICP inflation rate in Estonia was
2.7% as against 0.2% in 2009. Most of its growth
stemmed from global factors, such as rapidly growing oil
and food prices. As a result of rising prices in foreign
markets, domestic energy prices last year hiked by
11.5% y/y, and transport prices grew by 6.6% y/y. Core
inflation, i.e. after excluding the prices of energy, food,
alcoholic beverages and tobacco products, remained low
in 2010 (0.4% y/y). Meanwhile, the upside pressure on
prices of goods and services resulting from wage hikes in
2010, played a much smaller role. In 2010 Q1 nominal
wages were falling across all the economy, while in
subsequent quarters, they began to rise, to increase by
0.9% y/y throughout the year (after falling by 4.6% y/y
in 2009)20.
Table 4.2
HICP and its components (in %, y/y)
Q2
2010
Q3
2010
Q4
2010
Q1
2011
May-
11
HICP 2.9 3.1 5.0 5.2 5.5
Contribution to HICP growth rate (in pp)
Food and beverages 0.3 0.9 2.2 2.5 2.6
Alcoholic beverages and tobacco
products 0.3 0.5 0.6 0.5 0.7
Housing 0.7 0.7 0.9 0.7 0.6
Restaurants and hotels -0.1 0.0 0.0 0.2 0.5
Transport 1.1 0.5 0.6 0.7 0.5
source: Eurostat
In the first four months of 2011, the annual inflation rate
in Estonia remained above 5.0%, mainly due to the
impact of above-mentioned global factors. In addition,
some increase in consumer goods prices in Estonia, also
stemmed from the introduction of the euro this year.
(see Box 1). The monthly inflation growth in this period
averaged 0.6% as against 0.4% in the second half of
2010.
In 2011 Q1 the domestic factors, i.e. wage hikes, had
higher than before upward impact on inflation in Estonia,
as these gained momentum for the fourth quarter in a
row (4.5% y/y against 3.9% y/y in 2010 Q4), mainly in
the manufacturing sector.
Balance of payments
In 2010, for the second time in a row, Estonia recorded a
surplus on the current account, although this time it was
slightly lower in nominal terms. Along with a higher gross
domestic product last year this also resulted in a lower
ratio in relation to GDP (3.9% versus 4.5% in 2009).
Most of the growth in the current account may be
attributable to a lower deficit on trade in goods (down
60% y/y to the level of 1994) and a surplus on services,
which remained at a level similar to 2009. The positive
balance on trade in goods reflected a faster growth in
exports (35% y/y) than in imports (27% y/y), whereas
20 Wages grew specially in industry (5.2% y/y) and construction (3.7% y/y), whereas they declined in the sectors of financial services and public administration (respectively by 8.0% y/y and 2.4% y/y).
the growth in both categories was mainly fuelled by
markedly higher than in 2009 sales in machinery and
equipment, i.e. the most important category of goods in
Estonian foreign trade.
In turn, lower current account surplus in 2010 compared
to 2009 was due to a double increase in the income
deficit, including particularly deficit on investment by
non-residents. Income payments on foreign direct
investment in Estonia in the form of reinvested profits,
which increased threefold, played a key role here. The
balance on current transfers in 2010 remained virtually
unchanged.
Table 4.3
Balance of payments, net balance (in % of GDP, 4q moving
average)
Q1 2010 Q2 2010 Q3 2010 Q4 2010 Q1 2011
Current account 4.1 3.8 3.9 3.5 3.0
Goods -3.5 -3.8 -3.1 -1.7 -1.6
Services 9.8 9.4 9.5 9.1 8.6
Income -3.8 -3.7 -4.2 -5.6 -6.0
Current transfers 1.7 1.9 1.7 1.8 2.0
Capital account 3.5 3.6 3.3 1.6 1.1
Financial account -6.8 -6.2 -7.6 -11.4 -10.3
FDIs 2.9 6.3 8.2 7.3 7.3
Portfolio investments -10.2 -9.5 -9.8 -3.0 -1.9
Other investments 0.4 -3.0 -6.0 -15.9 -15.7
source: Eurostat
The financial account of Estonian balance of payments
adopted more negative values in 2010 relative to 2009,
primarily due to a strong outflow of capital in the form of
so-called other investments. This resulted, on the one
hand, from reducing reserve requirements for Estonian
banks in the second half of 2010. Thus released funds
were next transferred abroad, to be - most of them -
placed in the form of deposits. On the other hand, the
liabilities of Estonian banks from non-residents' deposits
recorded a decline. This had a dampening impact on
foreign liabilities in Estonian balance of payments. Inflow
of direct investment in 2010, significantly higher than in
2009, failed to put a halt on the exodus from Estonia of
capital from other investment.
According to preliminary data, in 2011 Q1 the current
account recorded a deficit for the first time in eight
quarters. It originated mainly from a doubling of the
negative balance on income of non-residents, compared
with the corresponding period last year, not netted by a
declining goods deficit. As it was in 2010 Q1, the financial
account recorded a negative balance, i.e. foreign capital
flowed out of Estonia. This was due to a reduced non-
residents' commitment under the so-called other
investment, both short- and long-term.
Interest rates and exchange rate
On 1 January 2011, Estonia became a new member of
the euro area, joining other 16 EU states which use the
common euro currency21. The exchange rate from the
21 The first two weeks of January saw a gradual withdrawal of Estonian kroon. Accordingly, the two currencies were in a parallel circulation. For the sake of customers’ convenience

Analysis of economic situation in the countries of Central and Eastern Europe – Estonia
National Bank of Poland – July 2011 24
Estonian kroon to euro has been irrevocably set at EEK
15.6466, i.e. central parity in ERM II, which Estonia
joined on 28 June 2004.
Fiscal policy
Estonia was the only country in the European Union,
which in 2010 recorded a general government surplus
(0.1% of GDP). The fiscal balance was affected by a
significant one-off revenue related to the sale of carbon
emission permits (about 1.1% of GDP). Increasing
exports boosted economic recovery, yet failed to
translate into a significant increase in budget revenues,
because of the tax preferences in this sector.
According to the EC’s spring forecast, Estonia is the only
country where fiscal balance will deteriorate over 2011-
2012. However, the general government deficit will not
exceed the reference value (3% of GDP). Its increase will
stem from i.a. the realisation of investment suspended in
previous years (including a one-off environmental
investment growth in the amount of revenue from the
sale of carbon emission permits) and expiration of
temporary consolidation measures adopted in 2009-2010.
As of 2012, the contribution transferred to pension funds
will be restored to its full amount, thus resuming the
level before mid-2009. Caps on public sector wages and
limits on debt incurred by local governments will also
terminate, and pensions will again be subject to
indexation.
Pursuant to a fiscal strategy adopted by the Estonian
government in April 2010 the ratio of government
revenues to GDP will be reduced below the pre-crisis
levels by 2015. The 2014 should generate fiscal surplus.
On the expenditure side a reduction in pension benefits,
amending the rules of remuneration of public sector
employees, and reducing the rate of current expenditure
are envisaged. In the mid-2010, overhaul of the social
security system will be performed with the aim to
develop measures improving its efficiency. Starting from
2015, the PIT rate is going to be reduced by 1 pp (but
tax relief will be limited as from 2012), and in 2014 social
and health insurance contribution assessment base will
be capped. OECD appealed to Estonia to introduce multi-
year expenditure limits and to establish an independent
fiscal council. The ruling coalition plans to introduce a
statutory ban on budget deficit in the years of economic
growth.
Estonia's public debt in the coming years will remain
among the lowest among EU member states. According
to government estimates, the it will decrease from 6.6%
of GDP in 2010 to 5.4% of GDP in 2015. The Estonian
authorities plan to finance the budget deficit in the
subsequent years with reserve funds. Since 2013, their
level is to be gradually rebuilt.
retailers since 1 July 2010 started to quote price in both currencies and were committed to do so until 20 June 2011.
Forecasts
In the opinion of the European Commission, Estonia's
economic growth will accelerate significantly over the
next two years. According to the forecast of April 2010,
the GDP will rise in 2011 by 4.9%, only to slow down to
4.0% in 2012. Moreover, its structure should consolidate,
mainly due to the growing importance of domestic
demand, including particularly the rebuilding of private
consumption and higher business investment.
The former will be stimulated, i.a., by anticipated
improvement in the labour market, as well as rising wage
growth. Even though household savings should fall over
the forecast horizon, following an unexpectedly strong
growth during the crisis, they will remain positive due to
the ongoing process of "deleveraging" in the household
sector. In turn, the investment activity of enterprises will
be driven primarily by satisfactory foreign demand
growth prospects and rising profits of domestic firms.
The European Commission expects a significant increase
this year mainly in the replacement investments.
Estonia's GDP growth in 2011-2012 will also benefit from
higher public sector investment, particularly
infrastructure investments, resulting from increased
absorption of EU structural funds.
On the other hand, foreign demand over the forecast
horizon will play an increasingly smaller role in the
growth of Estonia's economic activity. This will be the
result, i.a., of the expected slowdown of global economy,
which would undoubtedly translate into a decline in
global trade. Moreover, it is anticipated that in 2012 net
exports will negatively affect Estonian economic growth.
The European Commission expects that in the years
2011-2012 global commodity prices will continue to
shape inflation in Estonia. In 2011, this category is
expected to increase to 4.7%, and in 2012 it will return
to the level of 2010 (2.8%).
The surplus in the current account deficit will gradually
decline over the forecast horizon, mainly because of the
growing deficit in trade in goods. In relation to GDP it will
amount to 1.8% and 0.1% respectively in 2011 and
2012.
Table 4.4 Forecasts of main macroeconomic indicators
EP EC OECD IMF
06.2011
(10.2010)
05.2011
(11.2010)
05.2011
(11.2010)
04.2011
(10.2010)
GDP, in %, y/y
2011 6,0 (4,3) 4,9 (4,4) 5,9 (3,4) 3,3 (3,5)
2012 4,2 (3,8) 4,0 (3,5) 4,7 (4,1) 3,7 (3,4)
2013 4,2 3,7 (3,3)
Inflation, in %, y/y
2011 4,7 (2,7) 4,7 (3,6) 4,6 (3,4) 4,7 (2,0)
2012 2,5 (1,7) 2,8 (2,3) 3,0 (2,5) 2,1 (2,0)
2013 2,9 2,5 (2,5)
Current account balance, in % of GDP
2011 1,7 (-2,6) 1,8 (1,4) 3,2 3,3 (3,4)
2012 1,0 (-2,8) 0,1 (0,9) 0,7 3,1 (1,6)
2013 -0,2 1,4 (-0,4)
EP - Estonian Economy and Monetary Policy, Bank of Estonia

Analysis of economic situation in the countries of Central and Eastern Europe – Estonia
National Bank of Poland – July 2011 25
Box 1
Euro changeover effects on inflation in Estonia22
In May 2010, i.e. four months from the time when Estonia became the 17th full member of the euro area,
the Eurostat has published a preliminary estimate of the impact of the changeover on prices of consumer goods and services in this country. Calculations were based on changes in HICP inflation in the period from
December 2010 to March 2011. The following table summarizes the annual and monthly inflation dynamics in Estonia, the euro area and throughout the European Union.
Table 1 Inflation rates (measured by HICP) in Estonia, euro area and European Union
Month Estonia EU Euro area
(y-o-y, %) (m-o-m, %) (y-o-y, %) (m-o-m, %) (y-o-y, %) (m-o-m, %)
Dec-10 5.4 0.5 2.7 0.6 2.2 0.6
Jan-11 5.1 0.0 2.8 -0.4 2.3 -0.7
Feb-11 5.5 0.7 2.9 0.5 2.4 0.4
Mar-11 5.1 0.8 3.1 1.1 2.7 1.4
According to a preliminary assessment, the total (one-off) impact of the euro changeover on HICP inflation
in Estonia during the period from December 2010 to March 2011 as a whole is likely to be between 0.2 and 0.3 pp. This estimate is in line with the experience of countries who had previously adopted the common
currency: Slovenia in 2007 (0.3 pp.)., Cyprus and Malta in 2008 and Slovakia in 2009 (0.3 pp).
Eurostat, with a view to assess the euro changeover impact on consumer price inflation in Estonia, has
identified such price increases, which were of "unusual" character. In the above period those "unusual" price
increases where seen, in particular for cleaning services, recreational and cultural services, hairdressing services and repair services related to dwellings. Besides, during the period December 2010 to March 2011
unusual price increases were observed for services related to road transport, but their weight in the statistical consumer basket is too low to have a significant influence on a higher HICP inflation rate.
According to Eurostat, the euro changeover effects in Estonia seem to be noticeable, although their scale
was not large enough to drive permanently headline inflation in the country.
22 Euro changeover and inflation in Estonia, Eurostat, May 2011.

Analysis of economic situation in the countries of Central and Eastern Europe – Estonia
National Bank of Poland – July 2011 26
Contribution to GDP growth (in pp, y/y)
HICP and its components (in %, y/y)
Retail sales (in %, y/y) and consumer sentiment index
Industrial production (in %, y/y) and business sentiment index
Current account and its components (in % of GDP, 4-quarter moving
average)
Financial account balance and its components (in % of GDP, 4-quarter moving average)
Unemployment rate (%) and employment growth rate (in %, y/y)
General government debt and deficit (in % of GDP)
Source: Eurostat, CSOs

Analysis of economic situation in the countries of Central and Eastern Europe – Lithuania
National Bank of Poland – July 2011 27
LITHUANIA
Economic growth
From 2010 Q2, the Lithuanian economy has recovered
after a deep crisis of 2009. The economic growth
achieved last year was attributable to growing exports
associated with improvement in global economic climate
and intensive rebuilding of inventories. At the end of
2010 and early 2011 domestic demand, especially
investment, started to increase its contribution to GDP
growth.
Private consumption declined in 2010, for the second
consecutive year, due to a negative growth in wages,
loans for households, reductions in social benefits and an
increase in indirect taxes. Consolidation of fiscal policy
also resulted in a decrease of public spending.
The 2010 saw a marked improvement in fixed capital
formation, which had been in a negative figures since the
second half of 2008. Reversing the downward trend in
2010 Q4 was a result of increasing expenditure on
machinery and equipment and investments in the
residential construction sector. Since 2010 Q4 Lithuanian
companies have also improved their profitability.
Table 5.1 GDP and its components (in % y/y)
2009 2010 Q3 2010 Q4 2010 Q1 2011
GDP -14.8 1.3 1.6 4.6 6.8
Private consumption -16.9 -4.5 -3.4 -1.6 5.5
Public consumption -1.2 -3.4 -3.6 -3.1 1.0
Fixed capital formation -39.1 0.0 20.2 17.3 38.3
Exports -14.3 17.4 21.5 25.3 19.5
Imports -29.4 17.9 20.2 31.4 26.7
source: Eurostat
During 2010, due to a growth in imports exceeding that
of exports, net exports decreased its stimulating role in
the growth of the GDP. From 2010 Q3, its contribution
was negative. The economic recovery among the main
trade partners of Lithuania: Germany, Russia, other Baltic
states and Poland favoured maintaining the high growth
of exports, particularly petroleum products, capital
goods, pharmaceuticals and transport services. At the
same time, imports accelerated following the economic
recovery and a growth in investment.
The economic growth accelerated in 2011 Q1, while
showing a similar structure as prevailed in the Lithuanian
economy before the crisis. The largest positive
contribution to GDP growth in this period came from
fixed investment (partly due to increase in infrastructure
investment) and private consumption, while the
deepening trade deficit led to the reduction of scale
growth.
Declining scale of fiscal consolidation, some
improvements on the labour market and increased
transfers from abroad boosted revenue and, in effect,
stimulated private consumption. By contrast, a further
negative impact on consumption came from a stagnant
domestic credit market. Demand for loans was also
limited by low income and uncertainty associated with
the labour market and financial outlook.
In 2011 Q1 due to faster growth in imports than in
exports negative contribution of net exports enlarged. As
in previous quarters, the intermediate goods were the
most important import goods. Increase occurred also in
the imports of capital and consumer goods associated
with the growth in household expenditure. Exports also
grew but at a slower pace. Its growth was supported by
increasing demand from eastern neighbours23 and the EU
countries. In 2011 Q1, fuel exports grew due to an
increase in their prices in world markets. Strong external
demand led to significant increase in capacity utilisation
in the export-oriented companies.
The continuous growth in household spending is
reflected in the annual growth in retail sales, which has
been on a rise since early 2011. In April, it rose to 7.3%,
mainly due to increased sales of motor vehicles and
clothing, as well as household appliances.
After a rapid increase at the beginning of 2011,
consumers' optimism slightly decreased in the following
months, mainly due to high food and energy prices. April
2010 brought about improvement in sub-indices
describing expectations about the employment and
households financial situation. On the other hand
inflation expectations and plans for major purchases
deteriorated.
Industrial output continued its the upward trend started
in 2010 Q2. Increasing foreign demand caused its growth
to 14.8% y/y in 2011 Q1. The highest annual growth rate
occurred in furniture, leather and metal products
manufacturing.
The increase in industrial output was associated with
improved business sentiment in Lithuania. The growing
optimism of businesses in 2011 Q1, is illustrated by a
better growth outlook in industrial output, and next by
outlook for competitiveness, employment and portfolio of
orders.
Following a deep slump24 in the first half of 2010 the
situation on the real estate market shows stabilization.
The end of the year saw new investment projects
(construction output grew at ca. 16% y/y in 2010 Q4 -
23 According to WIIW Institute total exports of Lithuania to Russia, Ukraine and Belarus grew by 55% in 2010 in nominal terms. The 2011 saw a high demand of Belarus citizens for second-hand Western cars imported i.a. from Lithuania due to the anticipated growth in customs duties in Belarus in July (following the establishment of customs union with Russia and Kazakhstan). 24 In 2010 Q1 construction sector output fell by ca. 43%, continuing an abrupt downward trend of 2009 (declines by ca. 40-50% occurred through 2009).

Analysis of economic situation in the countries of Central and Eastern Europe – Lithuania
National Bank of Poland – July 2011 28
2011 Q1), whereas mortgage loans also became more
available. On the other hand, many construction projects,
abandoned during the crisis, remained so in 2010. Rental
prices also recorded a further decline.
Labour market
In 2010, the unemployment rate in Lithuania reached its
historical maximum (17.8%)25 and, despite relatively
rapid GDP growth, it remained high. According to the
Lithuanian Statistical Office, in 2011 Q1 unemployment
reached 17.2%. Given a difficult situation in the labour
market, unemployment reduction may result from
growing emigration.26
In 2010 Its scale was not big - 5.1% in 2010 compared
to 6.8% in 2009 During the year, the number of
unemployed who have registered their own business has
almost doubled. As of 2010 Q4 employment increased in
some industries, such as transport, information and
communication as well as in financial intermediation and
insurance services.
Inflation and labour costs
Following disinflation in 2010 Q1, consumer prices in
Lithuania accelerated in 2010 Q2, primarily fuelled by
supply factors (high food and energy prices). Only in
January 2011, the upward trend was disrupted by the
low base effect.
In May 2011, as a result of further increases in
commodity prices, food27 and administered prices, HICP
inflation reached 5.0% y/y - the highest level since April
2009
Table 5.2 HICP and its components (in %, y/y)
Q2
2010
Q3
2010
Q4
2010
Q1
2011
May-
11
HICP 0.5 1.8 2.9 3.2 5.0
Contribution to HICP growth rate (in pp)
Food and beverages -0.5 0.3 1.2 1.9 2.8
Housing 0.1 0.8 1.7 0.9 0.9
Transport 0.7 0.6 0.6 0.8 0.8
Restaurants and hotels -0.4 -0.4 -0.3 -0.3 0.1
Restaurants and hotels -0.2 -0.2 -0.1 0.0 0.1
source: Eurostat
Core inflation in 2010 due to low demand pressure remained negative. However, it started to grow at the end of the year due to a faster recovery in the economy and buoyant consumption In March 2011, it bottomed at
25 Long-term unemployed who sought work for over a year accounted for ca. 40% of total unemployed. Most of them displayed low qualifications. It is essential to conduct reforms in order to lower structural unemployment. 26 In 2011 Q1, 14 thous. people migrated from Lithuania. At year end this figure may grow to 60-65 thous. (with the population of ca. 2.9 m). Source: Spis dowodzi kurczenia się Litwy [The Census shows Lithuania shrinking], Dziennik Gazeta Prawna 16.05. 2011 Opening the labour market in Germany and Austria since 1 May 2011, and of Switzerland since June will prompt up further migration. 27 Food prices hikes accounted for ca. 2/3 of inflation growth in 2011 Q1.
zero, and a month later reached a positive growth (0.1%).
In 2010 Q4, for the first time since early 2009, wages
increased in annual terms (the growth was higher in the
case of export sector workers). Negative impact on real
wage growth came from rising inflation. Thus, unlike
before the outbreak of the crisis - falling real wages
(4.3%) coincided with an improvement in labour
productivity (5.7%). Along with economic recovery this
moderated unit labour costs (ULC).
Balance of payments
The current account surplus dropped to 1.8% of GDP in
2010 (from 2.6% a year earlier). This decline resulted
from the increase in the deficit on the income (cashing of
earning profits by foreign investors) and goods accounts.
Meanwhile current transfers (partially due to the inflow of
EU funds and remittances) and services (as a result of
revenue growth from transport, tourism, construction)
surpluses increased. In 2011 Q1 the current account
recorded a deficit, mainly due to a further deterioration
on goods and income accounts.
In 2011 Q1 despite the recovery in the transport sector,
due to increased foreign demand28, growth in exports of
services was low. Continued upward trend persisted in
exports of goods, primarily stimulated by exports of oil-
related products (approximately 22.5% of the total value
of exports in 2010) and fertilizers. The crisis did not
affect the reorientation of exports - Russia, Germany,
Latvia and Poland remained the major receivers of
Lithuanian goods. However, growth occurred in the
export to the Middle East.
Table 5.3 Balance of payments, net balance (in % of GDP, 4q moving
average)
Q1 2010 Q2 2010 Q3 2010 Q4 2010 Q1 2011
Current account 4.5 5.3 4.0 1.8 1.5
Goods -3.5 -3.5 -4.0 -4.3 -4.6
Services 2.2 2.7 3.3 3.6 3.2
Income 1.4 1.1 0.0 -2.5 -2.8
Current transfers 4.3 5.0 4.7 5.1 5.7
Capital account 3.2 3.2 2.5 1.7 1.0
Financial account -8.0 -8.6 -6.7 -4.6 -4.1
FDIs -0.8 -1.3 0.7 1.4 1.6
Portfolio investments 7.8 8.1 8.5 5.1 -1.0
Other investments -13.8 -15.3 -14.6 -8.9 -3.1
source: Eurostat
As of 2010 Q3 the scale of the foreign capital outflow
decreased, reflected in the declining deficit in other
investments (mainly due to lower repayment of liabilities
by the Lithuanian banking sector). From 2010 Q3, FDI
posted a net inflow, mainly as a result of higher
reinvested earnings. After the record inflows of portfolio
investments during 2010, 2011 Q1 saw their outflow, due
to increased investment in foreign debt securities.
However, foreign investors were still interested in
28 Transport accounts for ca. 2/3 of the services exports value.
Analysis of economic situation in the countries of Central and Eastern Europe – Lithuania
National Bank of Poland – July 2011 29
Lithuanian government bonds - in 2011 Q1, Lithuania
issued a tranche of USD-denominated Eurobonds.
Interest rates and exchange rate
Interest rates on the interbank market in the second half
of 2010 and early 2011 remained stable and low thanks
to financial system stabilisation and economic rebound -
3M VILIBOR ranged between 1.4% - 1.7% (in the first
week of April it was 1.4%). In subsequent weeks, the
rate rose to 1.66% (mid-May) due to monetary policy
tightening in the euro area.29
In the last months of 2010 the effective exchange rate of
the lit strengthened (the lit appreciated against the
currencies of trading partners and inflation rose since the
second half of 2010).
Fiscal policy
The fiscal imbalance in Lithuania remained at a high level
last year (7.1% of GDP as compared to 9.5% of GDP in
2009) in spite of continuation of consolidation measures,
and is going to be limited to 5.3% of GDP in 2011.
Consolidation measures pursued this year include the
extension of the freeze of wages in the public
administration, as well as pension and disability benefits
and a reduction of contributions transferred to open
pension funds.30
In 2012, i.e. within the period stipulated in the excessive
deficit procedure, the budget deficit in Lithuania is
planned to stand at 2.8% of GDP, and in the next two
years it is expected to decrease at 1 pp. of GDP per year.
The authorities plan to perform an expenditure review
(including social transfers) next year, introduce measures
to reduce pension benefits, improve the efficiency of
state enterprises. However, the latest update of the
Convergence Programme of Lithuania does not contain
further details of proposals in this regard. Next year will
see the expiry of temporary reduction of pensions (5%)
and wages in the public sector, while the government
may decide to extend them. According to the IMF
estimates Lithuania should launch additional
consolidation measures (ca. 1¼ pp of GDP) to achieve
the fiscal target for 2012, for example by introducing
taxation on property and motor vehicles. Due to the
parliamentary elections scheduled for the autumn 2012
their adoption seems unlikely.
Lithuania's public debt, with projected improved
economic situation should gradually decrease, to reach
35.4% of GDP in 2014, as compared to 38.2% of GDP in
2010.
29 On a small Lithuanian interbank market, a change in liquidity position of one bank may already impact interest rates. 30 Originally reduction in contributions transferred in Lithuania to open pension funds from 5.5% to 2% was implemented temporarily for 2009-2010. At the end of 2010 it was decided that this rate will remain at the reduced level. Once the fiscal situation improves, the contributions are to be restored at full amount.
Forecasts
According to the Bank of Lithuania, GDP growth in 2011
may reach 5.6%, and a year later - 4.8% (this is a
significant increase in the forecasts as compared with
November last year).
In 2011, most of buoyant economic growth will stem
from investment rebuilding. The Bank of Lithuania
expects that investment will increase this year by 17.9%.
The fastest increase will occur in private investment in
fixed assets.31 An additional incentive for public
investment will derive from the expected increase in the
use of EU funds (financing of infrastructure projects and
support for the growth of energy efficiency).
Additionally, household expenditure is anticipated to
resume a positive growth, while exports growth is
expected to slow down. In subsequent years, the
reconstruction of national consumption will stem from the
expected improvement in the labour market32 (lower
unemployment, higher employment), consumer
sentiment (possible reduction in savings rate), the
gradual renewal of credit and reduction the scale of fiscal
consolidation. Consumption will grow, fostered by lower
debt burden than in the neighbouring Baltic states. The
autumn parliamentary elections may possibly further
weaken fiscal restrictions in 2012. However, a relatively
low real wage growth will have opposite impact.
Export will grow thanks to the continuous prosperity
among the recipient countries of Lithuanian exports,
including the former USSR countries. The pace of export
growth may be lower due to saturation of the target
markets, lowering the competitiveness due to rising
commodity prices and high base effect. Along with the
reconstruction of domestic demand, imports of goods
and services will also accelerate.
Threats to growth are associated with a possible further
increase in emigration and negative demographics. An
increase in labour productivity associated with
investment weakening may not be sufficient to
compensate all the outflow of labour force. Higher than
expected increase in energy prices is another downside
risk to economic growth. Possible reduction in global risk
aversion, along with improving economic situation in
Lithuania will contribute to higher capital inflows.
Unemployment is expected to decrease in 2011-2012,
most likely remaining relatively high. This would be
related to low wages, often lower than unemployment
benefits, which promotes the growth of employment in
the informal economy.33
31 According to a survey conducted by the Lithuanian Institute of Free Market (LFMI) enterprises in 2011 intend to reinvest more (ca. ¼ of their earnings), and they also anticipate a growth in margins. 32 It will however develop slowly due to a persistently high structural undemployement. 33 LFMI respondents assessed the size of grey economy at 28% of Lithuanian GDP In 2010. A similar proportion is anticipated for 2011.

Analysis of economic situation in the countries of Central and Eastern Europe – Lithuania
National Bank of Poland – July 2011 30
According to the Bank of Lithuania forecasts the average
annual inflation in 2011 may reach 3.8%,34 continuously
shaped by supply-side factors associated with high oil,
gas35 and food prices on global markets. Along with the
improvement in GDP and growth in domestic demand in
Lithuania, prices of industrial products and services may
also increase. Additional pressure may come from the
expected expansion in lending to the private sector.
Increased inflation may weaken the purchasing power of
households, especially low-income ones. According to the
Bank of Lithuania, in 2012 inflation should remain at
3.9%. Core inflation over the forecast horizon of the will
gradually increase along with closing of the output gap.
Bank of Lithuania expects the current account deficit of
1.2% of GDP in 2011, mainly due to growing deficit in
the goods. The opposite effect will stem from the inflow
of current transfers. Expected further steepening in the
deficit in goods (reduced growth rate of exports) is
expected to increase the current account deficit in 2012
to 1.8% of GDP.
Table 5.4 Forecasts of main macroeconomic indicators
LB EC IMF
Consensus Economics
05.2011 (11.2010)
05.2011 (11.2010)
04.2011 (10.2010)
06.2011 (12.2010)
GDP, in %, y/y
2011 5,6 (3,1) 5,0 (2,8) 4,6 (3,1) 4,7 (2,7)
2012 4,8 4,7 (3,2) 3,8 (2,6) 3,8
3,7 (3,3)
Inflation, in %, y/y
2011 3,8 (2,3) 3,2 (2,3) 3,1 (1,3) 3,8 (2,0)
2012 3,9 2,4 (2,7) 2,9 (1,3) 2,9
2,7 (1,5)
Current account balance, in % of GDP
2011 -1,2 (-0,4) 0,2 (1,3) -0,9 (0,2)
2012 -1,8 -0,6 (1,0) -2,9 (-0,6)
-3,0 (-1,8)
LB - Lietuvos bankas
34 Keeping inflation at low levels is particularly important in connection with plans to adopt the euro in Lithuania in 2014. 35 Price rise for gas supplies to Lithuania, planned by Gazprom may also be a growth factor.

Analysis of economic situation in the countries of Central and Eastern Europe – Lithuania
National Bank of Poland – July 2011 31
Contribution to GDP growth (in pp, y/y)
HICP and its components (in %, y/y)
Retail sales (in %, y/y) and consumer sentiment index
Industrial production (in %, y/y) and business sentiment index
Current account and its components (in % of GDP, 4-quarter moving
average)
Financial account balance and its components (in % of GDP, 4-quarter moving average)
Unemployment rate (%) and employment growth rate (in %, y/y)
General government debt and deficit (in % of GDP)
Source: Eurostat, CSOs

Analysis of economic situation in the countries of Central and Eastern Europe – Latvia
National Bank of Poland – July 2011 32
LATVIA
Economic growth
Since the second half of 2010, the Latvian economy has
been again in a growth phase. However, this increase failed
to offset the decline of the first 6 months of that year,
resulting in 2010 being the third consecutive year of decline
in Latvian GDP. The upward trend persisted in 2011 Q1, but
the pace of recovery was slower here than in other Baltic
states.
Table 6.1 GDP and its components (in % y/y)
2009 2010 Q3 2010 Q4 2010 Q1 2011
GDP -18.0 -0.3 2.6 3.5 3.2
Private consumption -22.5 -0.1 3.5 5.8 3.6
Public consumption -9.2 -11.0 -6.1 -9.1 0.2
Fixed capital formation -37.7 -19.5 -11.8 0.1 14.5
Exports -13.9 10.3 15.4 13.7 15.1
Imports -34.2 8.6 12.8 15.8 18.8
source: Eurostat
Since the beginning of 2010, the annual growth in private
consumption in Latvia increased to achieve positive values
already in the second half of 2010. Throughout 2010, the
contribution of private consumption to GDP growth
remained however slightly negative (-0.1 pp.). The
increasing growth in consumption was mainly due to the low
base from 2009, when it fell by as much as 22.5%.
Consumption growth was slowing down by fiscal
consolidation, which continued for another year and
changed the behaviour of consumers (building savings at
the expense of reduced consumption). Continuation of fiscal
tightening was much more evident in the case of public
consumption. In 2010, it declined by as much as 11%,
which means the second consecutive year of strong decline
in public consumption. 2011 Q1 brought about a further
growth in private consumption and also a slight increase in
public consumption.
Gross fixed capital formation remained in 2010 the category
with the highest negative impact on GDP growth. As
compared to the corresponding period of 2009, the
investments were nearly 20% lower. The second half of
2010 apparently reversed the downward trend in
investments that had taken place in Latvia since 2007.
Whereas their annual growth gained momentum in 2010
Q3, it remained negative. In the next quarter for the first
time since 2007 there was a rise in investment in annual
terms. It accelerated even further in the first quarter of
2011. Fixed capital formation boost in the second half of
2010 and 2011 Q1 concentrated in the investments in
manufacturing and warehouse facilities, which could forerun
hikes in other categories of investment in the coming
quarters. However, it seems that in order to fully exploit the
investment potential of Latvia, the return of foreign
investors seem to be necessary. Regaining their confidence,
however, depends on a successful completion of the process
of economic reforms, particularly fiscal consolidation.
The limiting factor of domestic demand growth in Latvia in
2010, was a continuous fall in the lending of commercial
banks. The value of loans to both households and private
enterprises featured a steady decrease, which does not
indicate lending to recover in Latvia in a short term. A small
increase in the number of loans was visible only for the
public sector, both general government sector and state-
owned enterprises.
GDP growth was positively impacted by only one category of
national accounts, namely inventories. Their contribution to
annual GDP growth, however, decreased significantly in the
second half of 2010 (it amounted to respectively 6.6 and 3.0
pp. in the first and second half of 2010). In other words, the
process of rebuilding stocks by Latvian companies begins to
slow down, which should also be observed in 2011 Q1.
Exports remained a driving force of the Latvian economy in
2010, propped up mainly by the growing demand from the
EU-15. The increase in exports, demand for raw materials,
and slowly rebuilding domestic demand brought about a
growth in imports in the second half of last year. As a result,
the contribution of net exports to GDP growth in the second
half of the year began to fall, to turn negative in Q4. As a
result of a rapid growth in imports in 2011 Q1, the negative
contribution of net exports increased further.
After a period of a strong decline in 2009, retail sales in
Latvia began to rise slightly in early 2010. This increase
concentrated in durable goods, e.g. in 2010, the number of
newly registered cars rose by more than 32% y/y. The
increase in retail sale in Latvia was disproportionately high in
relation to the scale of improvement on the labour market in
2010. The structure of consumer spending in this period
(especially on durable goods) suggests that the increase in
consumer expenditure in Latvia was caused by major
purchases, financed from the funds saved during the crisis.
This trend reversed in 2010 Q4, when the continuation and
even exacerbation of fiscal tightening was announced. This
information rapidly dampened consumption sentiment
among Latvians. In addition, higher energy and food prices
resulted in reduction in households real disposable income.
In 2010 Q4 and 2011 Q1, the value of retail sales
decreased, which affected especially durable goods.
Indicators of consumer optimism developed similarly. The
first three quarters of 2010 saw its rise. Most of this growth
reflected the rise in the sub-indices describing the condition
of Latvian economy (current and expected in the upcoming
months), as well as households’ financial standing. In Q4
this trend reversed, which resulted mainly from a decrease
in expectations about future income and financial situation
of households.

Analysis of economic situation in the countries of Central and Eastern Europe – Latvia
National Bank of Poland – July 2011 33
The volume of industrial production sold in 2010 was more
than 13% higher than in the corresponding period of 2009.
The increase in industrial output was primarily a result of the
increase in external demand. For this reason, the biggest
increase in production was observed in the case of capital
and intermediate goods (such as paper, wood products,
metals, machinery and equipment as well as means of
transport). In 2010 Q4, output growth declined, and its
value even decreased in 2011 Q1. This was due to the
weakening of both domestic and foreign demand, which
was most noticeable in the chemical and rubber industries,
as well as in electrical equipment manufacture.
Business confidence index in Latvia, which had been
increasing rapidly until 2010 Q2, halted in the second half of
2010. Whereas the industrial trade portfolios continued to
expand in the second half of 2010 and 2011 Q1, their
growth decelerated. At the same time, entrepreneurs voiced
increasing concerns about prospective output in view of a
growth in of current inventories.
Labour market
The situation in the labour market in Latvia gradually
improved during 2010. Between 2009 Q4 and 2010 Q4 the
harmonised unemployment rate fell from over 20% to
17.2%. Despite this improvement, it remained among the
highest in the region (along with Lithuania), and also
throughout the EU (along with Spain).
As of 2010 Q2, the downward trend in employment, which
could be observed in Latvia since early 2008, has been
reversed. In 2010 Q3 and Q4, the annual growth rate of
employment was positive for the first time since mid-2008
(2.1% y/y in 2010 Q4). Employment growth could be
observed in almost all sectors of the economy. The number
of employed increased both in industry, construction and in
most services. It declined only in the public administration,
which was an effect of continued fiscal tightening. Lack of a
clear recovery in the retail trade also caused a further
decline of employment in this sector
Inflation and labour costs
Annual HICP inflation rate in Latvia in January-July 2010
was negative, and the lowest in the region. In the second
half of 2010, as in other CEE countries, the growth of
consumer prices soared, to amount to 2.4% in December.
In the first four months of 2011 inflation in Latvia continued
to increase, to reach 4.8% in May 2011.
Table 6.2 HICP and its components (in %, y/y)
Q2
2010 Q3
2010 Q4
2010 Q1
2011 May-11
HICP -2.3 -0.3 1.7 3.8 4.8
Contribution to HICP growth rate (in pp)
Food and beverages -0.5 0.4 1.5 2.1 2.6
Housing -0.6 0.6 0.7 1.2 1.0
Transport 0.5 0.4 0.7 0.8 0.8
Restaurants and hotels -0.4 -0.4 -0.2 -0.1 0.3
Restaurants and hotels -0.6 -0.5 -0.2 0.0 0.2
source: Eurostat
The increase in inflation in Latvia in the second half of 2010
was mainly caused by the supply-side factors - rising food
and energy prices. Inflation in 2010 received also a boost
from increases in administrated prices (especially heat
energy and gas). January 2011 saw a surge in inflation in
Latvia, due to VAT increase (from 21% to 22%). As
estimated by the Bank of Latvia, in its effect, the inflation
rate rose by 1.3 pp. Additionally, in 2011, energy and food
prices continued their rapid growth.
Increase in VAT, rising prices of energy and fuels, which
began to be translated into other categories of goods and
services. Along with visible improvement in the labour
market it began to translate into an increase in core inflation
in Latvia. Although still negative in 2011, it rose significantly
over late 2010 to reach -0.3% in April 2011,up from -2.6%
in December 2010.
A downward trend in nominal wages in Latvia persisted in
2010. An average wage fell by 5.5% compared to 2009.
Decline affected both industry and services sector. Public
finance austerity plan weighted on the wages in this sector,
which used to rank among highest in the whole economy.
Wage declines occurred mainly in the first half of last year,
while in the second half wages already started to increase
slowly. Q4 saw even nominal wage edge slightly up in
annual terms (0.1%).
Growth in unit labour cost (ULC) in Latvia accelerated in the
second half of 2010, but still remained negative. Despite
wages rising in Latvia in the second half of last year, labour
productivity continued to grow at a faster pace.
Balance of payments
The current account surplus in Latvia, after reaching a
record 10.6% of GDP in the first quarter of 2010 (moving
average for 4 quarters), decreased significantly in the
subsequent quarters of 2010. Throughout 2010, it already
amounted to only 3.6% of GDP, whereas 2010 Q4 shifted
current account into deficit, for the first time since 2008.
The deficit further increased in 2011 Q1.
Foreign trade turnover in Latvia grew significantly in
2010. Rise in exports (28%) and imports (20%) reduced
goods deficit from 7.1% in 2009 to 6.4% of GDP in 2010.
Growing demand from major trading partners of Latvia,
as well as increase in the competitiveness of Latvian
exports (internal devaluation) primarily contributed to
rapid restoration of exports, which grew most in wood and
paper industry, metallurgical, chemical industries,
manufacturing of machinery and equipment and electronic
devices. Following the increase in exports, demand
intensified for intermediate and capital goods, which
especially in the second half of 2010, resulted in a marked
increase in imports of these goods. In 2011 Q1 the deficit
on the goods account rose as a result of faster growth in
imports than in exports.
Both the services and current transfers accounts in 2010,
consistently showed a surplus, which remained broadly
stable over the year. The surpluses continued at the same
level also in 2011 Q1.

Analysis of economic situation in the countries of Central and Eastern Europe – Latvia
National Bank of Poland – July 2011 34
Most of decline in the positive current account balance came
from a rapid income account deterioration. In 2009 its
balance amounted to 6.3% of GDP, and in 2010 only 0.2%
of GDP, to reach already a deficit (-1.0% of GDP) in 2011
Q1. This resulted from an increase in foreign-owned
enterprises’ profits, which led to the growing outflow of
income from foreign investments in 2010 and 2011 Q1.
Table 6.3 Balance of payments, net balance (in % of GDP, 4q moving
average)
Q1 2010 Q2 2010 Q3 2010 Q4 2010 Q1 2011
Current account 10.6 8.6 6.5 3.6 2.0
Goods -6.2 -6.0 -6.0 -6.4 -6.5
Services 6.1 6.3 6.3 6.2 6.1
Income 6.8 4.7 2.7 0.2 -1.0
Current transfers 3.9 3.6 3.5 3.6 3.4
Capital account 2.5 2.2 2.3 1.6 0.9
Financial account -14.0 -10.6 -8.8 -5.3 -2.9
FDIs -0.5 0.5 0.3 1.4 3.5
Portfolio investments 0.8 0.7 0.5 -0.8 -2.8
Other investments -2.8 2.2 -2.9 -1.0 -4.8
source: Eurostat
The year 2010 significantly reduced the scale of foreign
capital outflow from Latvia. The outflow of capital was due
to repayment of long-term liabilities by Latvian businesses
(both in the financial and non-financial sector), showed on
the other investment account (-1.0% of GDP in 2010). On
the other hand, the scale of related capital outflow was far
smaller than in the two preceding years. The balance of
portfolio investments, which had shown a surplus in 2009,
decline markedly in 2010. Foreign direct investments were
the only category where the inflow to Latvia in 2010 was far
greater than the outflow. Net inflow of direct investment
increased especially in the second half of 2010, when the
inflow of capital transfers was supplemented by reinvested
earnings. In 2011 Q1 foreign capital again resumed its
outflow from Latvia. Although the inflow of direct
investment grew at the same time portfolio and other
investments deficit widened, among others due to a much
smaller transfer of funds under the Cohesion Fund,
compared with 2010 Q1.
Interest rates
As other Baltic states, Latvia experienced a considerable
decrease in interest rates on the interbank market, resulting
primarily from its over-liquidity. The 3M Rigibor rate
decreased from almost 8% in early 2010 to less than 1% in
December. In the first five months of 2011 interest rates
remained low. In May, 3M Rigibor fell to its historical low of
0.79%. Following a strong decline in 2010 (from 15.5% in
January to 7% in December), yields on Latvian bonds have
remained at a low level also to date in 2011, which can be
regarded as signs of stabilization on Latvian financial
markets.
After a real effective exchange rate depreciation in 2010 (as
a result of the so-called. "internal devaluation") in 2011, the
lat has started to appreciate against the currencies of major
trading partners. Over December 2010 - April 2011 CPI-
deflated REER appreciated by 2.5%. This resulted primarily
from the rapid growth in inflation in Latvia, as of early 2011.
Fiscal policy
In 2010, fiscal consolidation in Latvia continued , in
accordance with the terms of the EU and IMF assistance
package. In 2010 the general government deficit
amounted to 7.7% of GDP as compared to 9.7% of GDP
in 2009. The total magnitude of the consolidation
measures was ca. 4.0% of the GDP (distributed evenly
on the revenue and the expenditure side), accompanied
by a negative impact on fiscal balance related to
providing support to the banking system (2.3% of GDP
compared to 1.1% of GDP in 2009).
In mid-April 2011 Latvian Parliament amended the
Budget Act for 2011. Accordingly, the general
government deficit target was set at 4.2% of GDP
compared to 5.4% of GDP planned before and the limit
of 6.0% of GDP, set forth in the EU and IMF assistance
package. The revised budget reflected the concerns of
the IMF and the European Commission about budget
execution in 2011, i.a. as a result of optimistic economic
assumptions and expected growth of tax revenues due to
combating smuggling and shadow economy. Budgetary
revenue estimates were adjusted upwards (about ¾% of
GDP), followed by a slight increase in expenditure
limits36 (0.2% of GDP). At the same time it was decided
to raise the excise tax and VAT on natural gas (from 12%
to 22%)37, and maintain cuts on social security
payments (till 2012), sickness, maternity and
unemployment benefits(to 2014).
Thanks to improving fiscal situation in Latvia the scale of
consolidation measures in subsequent years could be
reduced. The general government deficit is to be reduced
below 3% of GDP in 2012 (2.5% of GDP), i.e. the
deadline imposed under excessive deficit procedure. The
proposed adjustment measures for 2012, estimated at
ca. 1.1-1.3% of GDP, include the further sealing of the
tax system and property tax increases, limiting
expenditure on salaries and subsidies (i.a. airport in Riga,
support of the social activities carried out by local
government units) and debt incurred by local
government sector related to infrastructure projects. In
addition, no indexation of pension and disability benefits
will be implemented before late 2013. The government of
Latvia is not planning currently to postpone further the
increase in the rate of contribution transferred to funded
36 Supporting producers of bio-components in the amount payable for 2010. 37 Measures entered in force mid-year. The changes also apply to increases in game tax rates and to eliminating the reduced VAT rate on natural gas. The list of measures in force since 2011 includes an increase in VAT (standard rate from 21% to 22%, reduced rate from 10% to 12%; followed by abolishment of some preferences in VAT), property tax, excise duties (including the elimination of tax relief for bio-components) and the rates of social security contributions paid by employees (from 9% to 11%). By contrast, the rate of personal income was reduced (from 26% to 25%).
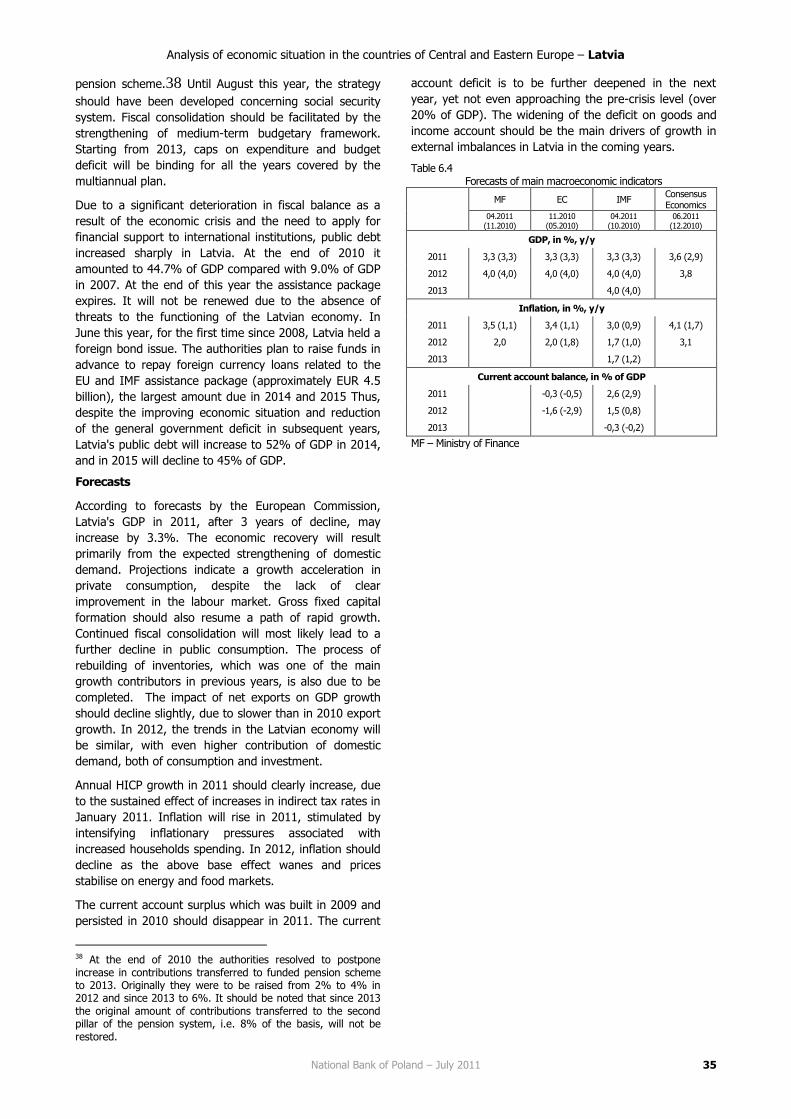
Analysis of economic situation in the countries of Central and Eastern Europe – Latvia
National Bank of Poland – July 2011 35
pension scheme.38 Until August this year, the strategy
should have been developed concerning social security
system. Fiscal consolidation should be facilitated by the
strengthening of medium-term budgetary framework.
Starting from 2013, caps on expenditure and budget
deficit will be binding for all the years covered by the
multiannual plan.
Due to a significant deterioration in fiscal balance as a
result of the economic crisis and the need to apply for
financial support to international institutions, public debt
increased sharply in Latvia. At the end of 2010 it
amounted to 44.7% of GDP compared with 9.0% of GDP
in 2007. At the end of this year the assistance package
expires. It will not be renewed due to the absence of
threats to the functioning of the Latvian economy. In
June this year, for the first time since 2008, Latvia held a
foreign bond issue. The authorities plan to raise funds in
advance to repay foreign currency loans related to the
EU and IMF assistance package (approximately EUR 4.5
billion), the largest amount due in 2014 and 2015 Thus,
despite the improving economic situation and reduction
of the general government deficit in subsequent years,
Latvia's public debt will increase to 52% of GDP in 2014,
and in 2015 will decline to 45% of GDP.
Forecasts
According to forecasts by the European Commission,
Latvia's GDP in 2011, after 3 years of decline, may
increase by 3.3%. The economic recovery will result
primarily from the expected strengthening of domestic
demand. Projections indicate a growth acceleration in
private consumption, despite the lack of clear
improvement in the labour market. Gross fixed capital
formation should also resume a path of rapid growth.
Continued fiscal consolidation will most likely lead to a
further decline in public consumption. The process of
rebuilding of inventories, which was one of the main
growth contributors in previous years, is also due to be
completed. The impact of net exports on GDP growth
should decline slightly, due to slower than in 2010 export
growth. In 2012, the trends in the Latvian economy will
be similar, with even higher contribution of domestic
demand, both of consumption and investment.
Annual HICP growth in 2011 should clearly increase, due
to the sustained effect of increases in indirect tax rates in
January 2011. Inflation will rise in 2011, stimulated by
intensifying inflationary pressures associated with
increased households spending. In 2012, inflation should
decline as the above base effect wanes and prices
stabilise on energy and food markets.
The current account surplus which was built in 2009 and
persisted in 2010 should disappear in 2011. The current
38 At the end of 2010 the authorities resolved to postpone increase in contributions transferred to funded pension scheme to 2013. Originally they were to be raised from 2% to 4% in 2012 and since 2013 to 6%. It should be noted that since 2013 the original amount of contributions transferred to the second pillar of the pension system, i.e. 8% of the basis, will not be restored.
account deficit is to be further deepened in the next
year, yet not even approaching the pre-crisis level (over
20% of GDP). The widening of the deficit on goods and
income account should be the main drivers of growth in
external imbalances in Latvia in the coming years.
Table 6.4 Forecasts of main macroeconomic indicators
MF EC IMF
Consensus Economics
04.2011 (11.2010)
11.2010 (05.2010)
04.2011 (10.2010)
06.2011 (12.2010)
GDP, in %, y/y
2011 3,3 (3,3) 3,3 (3,3) 3,3 (3,3) 3,6 (2,9)
2012 4,0 (4,0) 4,0 (4,0) 4,0 (4,0) 3,8
2013 4,0 (4,0)
Inflation, in %, y/y
2011 3,5 (1,1) 3,4 (1,1) 3,0 (0,9) 4,1 (1,7)
2012 2,0 2,0 (1,8) 1,7 (1,0) 3,1
2013 1,7 (1,2)
Current account balance, in % of GDP
2011 -0,3 (-0,5) 2,6 (2,9)
2012 -1,6 (-2,9) 1,5 (0,8)
2013 -0,3 (-0,2)
MF – Ministry of Finance
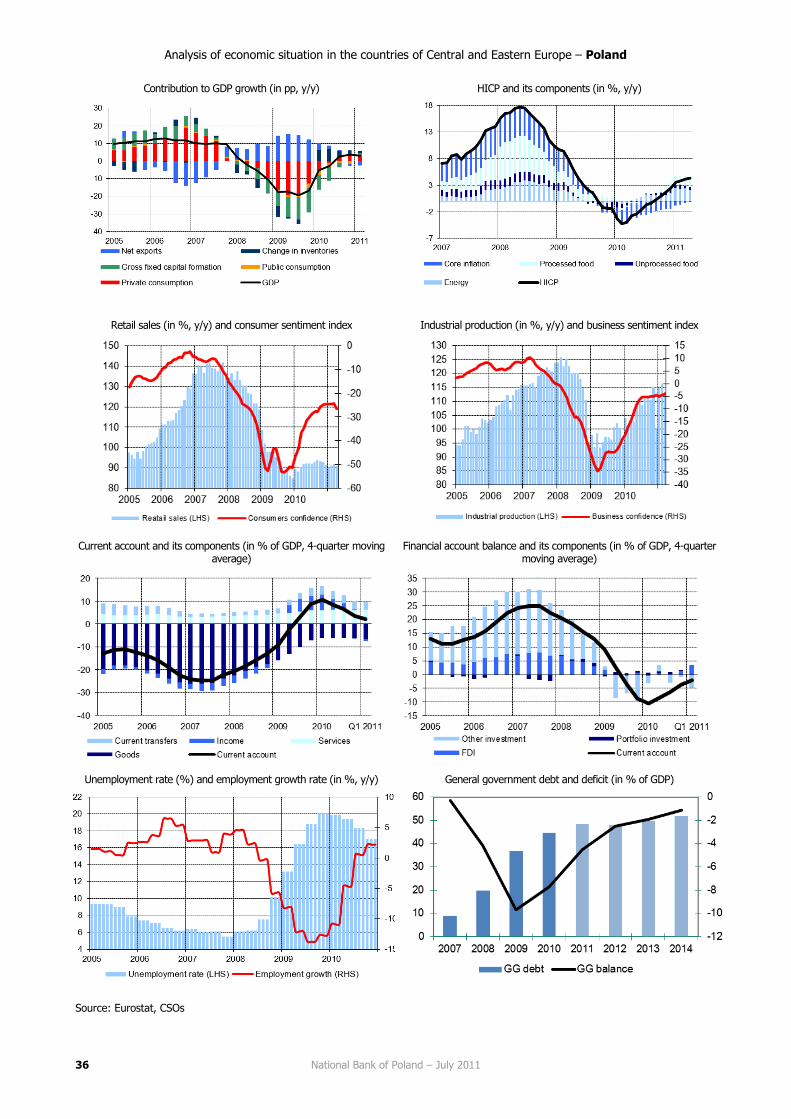
Analysis of economic situation in the countries of Central and Eastern Europe – Poland
National Bank of Poland – July 2011 36
Contribution to GDP growth (in pp, y/y)
HICP and its components (in %, y/y)
Retail sales (in %, y/y) and consumer sentiment index
Industrial production (in %, y/y) and business sentiment index
Current account and its components (in % of GDP, 4-quarter moving
average)
Financial account balance and its components (in % of GDP, 4-quarter moving average)
Unemployment rate (%) and employment growth rate (in %, y/y)
General government debt and deficit (in % of GDP)
Source: Eurostat, CSOs

Analysis of economic situation in the countries of Central and Eastern Europe – Poland
National Bank of Poland – July 2011 37
POLAND
Economic growth
In 2010, the GDP in Poland grew by 3.8%, which, apart
from Slovakia, was the fastest in the region However, the
GDP growth composition differed significantly from other
countries in Central and Eastern Europe. Private
consumption played important role in the recovery. While
external demand contributed to growth to a lesser
extent.
Table 7.1 GDP and its components (in % y/y)
2009 2010 Q3 2010 Q4 2010 Q1 2011
GDP 1.8 3.8 4.6 3.9 4.3
Private consumption 2.2 3.1 3.5 3.5 3.5
Public consumption 1.9 4.0 3.7 4.9 2.1
Fixed capital formation -0.8 -1.0 0.4 1.7 6.8
Exports -9.5 10.0 8.5 7.3 5.8
Imports -13.5 11.6 9.5 11.3 6.2
source: Eurostat
Economic growth in Poland in 2010, was in 50% due to
the increase in household spending. The GDP growth of
3.0% y/y was the fastest in the region, whose average
GDP growth decreased for the second consecutive year
by 1.4%. Along with Sweden, the GDP growth was the
fastest in the entire European Union. The growth in
private consumption accelerated significantly in the
second half of 2010 and was close to its long-run
average. The growth in consumer demand can be
attributed to an improvement in disposable income of
households, which resulted from surge in compensation
of employees. Public sector expenditure also accelerated
compared with 2009.
In 2010, gross fixed capital formation fell at a similar
pace as in the previous year. Significant reduction in
gross fixed capital formation throughout the year came
from adverse weather conditions in 2010 Q1. However,
fall in investments reversed in the second half of 2010.
This was due to a rapid acceleration in investments of
the general government, large and medium-sized
companies. In 2010 Q4, gross investment growth was
stimulated i.a. by housing. In the beginning of 2010,
enterprises started to rebuild their inventories, as a result
of which the contribution of the stock increases to GDP
growth was then positive and significant (greater than of
other components of GDP).
The upward trend in exports has continued since 2009
Q4. However, in the second half of 2010, this trend
weakened, which was due to slower the growth in
demand among major export partners. In late 2009 they
implemented fiscal austerity measures, which.in turn
contributed indirectly to deceleration in household
expenditures. Since consumer goods account for over
30% of exports to the EU-15 countries, i.e. much more
than the average in other CEE countries, this fiscal
tightening in the Western European economies s likely to
exerted a severe impact on demand for Polish exports.
Due to the recovery of external demand, industry was
the fastest growing economic sector in 2010. Other
export-related industries also experienced rapid growth,
including in particular transport.
Given a high contribution of imports in the output for
foreign markets, the rise in exports (as well as stock
rebuilding) stimulated import demand. It started to
increase on an annual basis in the beginning of 2010. In
addition, the growth of imports in the second half of
2010 was also stimulated by the acceleration of
consumer demand. As a result, imports grew faster than
exports, which caused trade deficit to widen and a net
exports to contribute negatively to GDP growth. Thus,
Poland ranked among a few EU countries, with imports
rising faster than exports. This was due to faster
economic growth in Poland compared to a vast majority
of its trading partners. In addition, faster import growth
derived from the appreciation of the zloty, which took
place in the whole of 2010.
Relatively fast GDP growth persisted in 2011 Q1.
Domestic demand remained the main factor of economic
growth, fuelled by accelerated growth of investments,
sustained growth in consumption and further increase in
inventories .
The growth of private consumption remained relatively
rapid in 2011 Q1, even though inflation was high,
consumer loans had been declining and there had been
some intertemporal substitution in consumer demand
between late 2010 and early 2011 because of anticipated
VAT rates changes as of 2011. Presumably, the labour
market improvement may have significantly impacted
consumption growth as well. Meanwhile, public
consumption slowed down significantly.
Investments continued to recover in 2011 Q1. At the
same time, companies continued to rebuild their
inventories, so that this category retained a positive
contribution to GDP growth. On the other hand, a
slowdown occurred in both exports and imports, with
much stronger deceleration in the growth of imports. As
a result, net exports decreased their negative
contribution to GDP growth.
In the period from January to April 2011, retail sales
gained further momentum. Throughout the period the
sales boosted in certain categories of durable goods
(furniture, electronics, household appliances) and non-
durable goods other than necessities, which can reflect a
broad-based revival in consumer demand.
Economic studies indicate still relatively weak consumer
confidence. Since early 2011, all (except for changes in
the level of unemployment) components of consumer
confidence indicators have been lower than previous
year. In particular, consumers systematically decreased

Analysis of economic situation in the countries of Central and Eastern Europe – Poland
National Bank of Poland – July 2011 38
their willingness to make major purchases. Relatively
weak sentiment, however, did not translate into
slowdown in private consumption, which seems can be
attributed to an improvement in the labour market.
Data on industrial production growth and trade portfolio
point to an improvement in the sector, although recently
these indicators have somewhat declined. Also the recent
drop in PMI may indicate that the recovery in industry
might have weakened somewhat.
Labour market
As economic growth rebounded, demand for labour
increased, and employment growth accelerated. In 2011
Q1, employment rose by 2.1% (against an increase of
1.1% in 2010 Q4). Seasonally-adjusted harmonised
unemployment rate was 9.3% in April down 0.2 pp from
December 2010. As unemployment rate levelled off, the
number of newly registered unemployed trended down.
Inflation and labour costs
The Harmonised Index of Consumer Prices (HICP) in
year-on-year terms has clearly accelerated since early
2011. In January 2011, primarily due to increases in VAT
rates, inflation rose to 3.5% (from 2.9% in December
2010). Higher inflation in the following months originated
from steadily rising food prices, which was largely due to
an unfavourable supply situation in the domestic market
for fruits, vegetables and cereals and a strong upward
trend in prices of agricultural and energy commodities in
global markets. The growth in inflation also drew from
increases in administered prices of energy for
households. In May 2011, the annual HICP rose to 4.3%.
Core inflation (excluding food and energy prices)
increased from 1.1% y/y to 2.0% y/y. The growth rate
was fuelled by price increases in most groups of goods
and services. In January and February, it was associated
with the above-mentioned rise in VAT rates, as well as
the increase in administered prices of services related to
housing. In the following months, the acceleration of
core inflation was mainly due to higher prices of clothing
and footwear, as well as the increase in prices of services
in restaurants and hotels (partly linked to rising food
prices) and prices of transport services (partly associated
with an increase in fuel prices), and in May this year, also
with an increase in the prices of medical services.
Table 7.2 HICP and its components (in %, y/y)
Q2
2010 Q3
2010 Q4
2010 Q1
2011 maj-11
HICP 2.5 2.1 2.7 3.6 4.3
Contribution to HICP growth rate (in pp)
Food and beverages 0.2 0.6 1.0 1.3 1.8
Housing 0.5 0.6 0.7 0.9 1.0
Transport 0.5 0.2 0.4 0.5 0.5
Alcoholic beverages and tobacco
products 0.7 0.4 0.4 0.4 0.3
Other 0.3 0.2 0.1 0.2 0.3
source: Eurostat
Acceleration of inflation observed since 2010 Q4 may
indicate the increasing demand pressures in the
economy.
After a clear acceleration in 2010 Q4, the growth rate of
nominal wages in the economy declined in 2011 Q1. The
pace of wage growth in enterprises in this period
remained moderate. Amidst high inflation, real wage
growth in the economy and the corporate sector
oscillated around zero.
Due to the faster increase in the number of the
employed, labour productivity in the economy in 2011 Q1
grew slower than in previous quarters. The parallel
decline in wage growth, however, resulted in a decline in
unit labour costs as against 2010 Q4. However, this
growth was significantly faster than in the previous four
quarters.
In April 2011 – for the first time since July 2009 – unit
labour costs in industry rose in year-on-year terms. Unit
labour costs in industry decelerated their fall mostly
because labour productivity rose more slowly in recent
months and wages markedly accelerated in April.
Balance of payments
As the economy continued to recover, the negative
current account widened, affected mainly by a growing
trade deficit in goods. The wider foreign trade deficit
reflected a higher demand for imported goods amidst
economic recovery and also, to some extent,
deteriorating terms-of-trade (due to a higher import
prices of raw materials). Sound corporate earnings, in
turn, translated into higher income of foreign owners,
and a revenue deficit in the current account.
The deficit in current account (in terms of four
consecutive quarters) increased to 4.5% of GDP in 2010
(compared to 3.9% in 2009). At the end of 2011 Q1, the
deficit widened to reach 4.6% of GDP.
At the same time, increased use of EU funds to finance
investment projects accounted for a strong inflow of
funds onto the capital account.
Table 7.3 Balance of payments, net balance (in % of GDP, 4q moving
average)
Q1 2010 Q2 2010 Q3 2010 Q4 2010 Q1 2011
Current account -3.8 -3.8 -4.3 -4.5 -4.6
Goods -1.7 -1.9 -2.0 -2.4 -2.5
Services 1.0 0.9 0.9 0.7 0.8
Income -3.8 -3.6 -3.8 -3.6 -3.6
Current transfers 0.7 0.8 0.7 0.8 0.6
Capital account 1.4 1.3 1.6 1.8 1.9
Financial account 9.7 9.8 9.7 8.0 8.6
FDIs 2.4 2.2 1.3 0.7 0.3
Portfolio investments 5.5 5.4 5.8 5.4 3.9
Other investments 1.8 2.2 2.7 2.1 4.5
source: Eurostat
According to the financial account, in 2010 Q4, net inflow
of capital to the Polish was dominated by portfolio
investment, with shares and equities playing an
important role. However, in 2011 Q1 most of net capital

Analysis of economic situation in the countries of Central and Eastern Europe – Poland
National Bank of Poland – July 2011 39
flowed to companies in the form of so-called other
investments. Data for 2010 Q4 and 2011 Q1, indicate a
high foreign direct investment inflows to Poland. Polish
direct investment abroad increased at that time.
Interest rates and exchange rate
Since early 2011, the MPC(l?) raised NBP policy rates four
times by a total of 1.00 pp., taking the reference rate to
4.50%. Interest rate increases, each by 0.25 pp. took
place at meetings in January, April, May and June 2011.
NBP interest rate increases translated into a
corresponding increase in the interbank market rates. At
the same time a tendency prevailed to reduce the spread
between the interest rate on interbank deposits and the
OIS (Overnight Index Swap) rate. Though the spread
narrowed, the interbank market continuously
underperformed, and banks took a primary recourse to
interbank operations with the shortest maturities.
In the first half of 2011, nominal exchange rate of the
zloty appreciated against the U.S. dollar by 7.2%, while it
weakened against the euro and Swiss franc by
respectively 0.5% and 2.9%. The Swiss franc, considered
a safe and stable currency also strengthened against the
U.S. dollar and the euro.
After the interim depreciation in mid-March, amidst
higher insecurity in the financial markets in the aftermath
of natural disasters in Japan, the zloty was gradually
strengthening. The zloty appreciation was fuelled by the
NBP interest rate increases and the launch by the
Ministry of Finance of the programme to exchange a part
of transfers from the European Union on the currency
market. In the second half of May and in June 2011, the
zloty weakened due to increased concerns about the
fiscal situation in some euro area countries and the
related sale of high-beta currencies, including the zloty.
Fiscal policy
In 2010, the general government deficit in Poland
deteriorated further, from 7.3% to 7.9% of the GDP.
Along with Slovakia, Poland posted last year the largest
fiscal imbalance among the CEE-countries. This situation
was attributable to lower than expected current taxes on
income and wealth (including greater than expected
impact of economic slowdown on corporate tax
settlements) and higher ratio of public spending in
relation to GDP, especially marked in capital expenditure,
co-financed by EU funds and the amounts disbursed to
mitigate the effects of floods.
In 2011 the general government deficit in Poland is
expected to decline to 5.6% of GDP, whereas in 2012 it
will drop by almost a half, to 2.9% of GDP. Over the next
two years, the fiscal imbalance reduction is estimated at
0.5% of GDP each year. Consolidation measures on the
revenue side concern in particular reduction of
contribution transferred to the second pillar of the
pension scheme39 and implementation of temporary
changes in the VAT (i.e. increase of rates in 2013 by 1
pp;40 exclusion of VAT deduction on the purchase of
passengers cars classified as goods vehicles and fuel
consumed by them until 2013). With a view to
constraining government spending, temporary
expenditure rule will be implemented. It will cap growth
of central budget discretionary and new mandatory
spending items at the level not exceeding CPI+1 pp. This
rule will be effective until the correction of the excessive
deficit. A permanent expenditure rule is now under
preparation, which will aim at stabilizing the general
government balance at the level of medium-term
budgetary objective (i.e. maintaining the structural deficit
below 1% of GDP). Adjustment on the expenditure side
will also stem, i.a., from freezing the wages in central
government sector in 2011 and 2012 (except teachers).
Fiscal balance will also improve due to the phasing out of
early retirement and the introduction of rules for
disciplining local government units.41 The recent
Convergence Programme announced the reform of the
provisioning system for the uniformed services and social
security for farmers.
The European Commission and the IMF suggest that the
achievement of budgetary target in 2012 will require
additional adjustment measures. Among the changes, the
Fund proposes, i.a., the alignment of disability benefits
with the pension formula,, as well as changes in the their
indexation mechanism, reduction of tax expenditures and
streamlining public administration employment.
In 2010, the general government debt in Poland
amounted to 55.0% of GDP against 50.9% in 2009.
Within the horizon of the forecast presented in the latest
Update of the Polish Convergence Programme it will be
gradually decreased (to 50.8% of GDP in 201442), as a
result of budgetary improvement and significant
privatization receipts in 2011-2012.
Forecasts
In comparison with the projection of October 2010
presented in the previous "Analysis of the economic
situation in the countries of Central and Eastern Europe"
in July 2011, the National Bank of Poland lowered
economic growth projections for the next two years and
at the same time increased the inflation forecast.
The National Bank of Poland anticipates that a relatively
rapid recovery in domestic demand, which used to boost
growth in 2010, will be sustained also this year.
According to European Commission forecasts published in
39Previously, it amounted to 7.3% of gross wage. Since May 2010, it has been at 2.3%, and will gradually grow in subsequent years, to reach the target of 3.5% in 2017. 40 The exception here are basic food products, with the tax rate of 5% as of 2011, as against 7% previously. Following 2013, this rate will be maintained. 41 The new Public Finance Act of 2009 prohibits a current deficit (since 2011) and provides for individual debt ratios since 2014. 42 According to the domestic methodology the ratio of public debt to GDP – over the forecast horizon – is expected to run lower than 50% (i.e. the 1st prudential threshold).

Analysis of economic situation in the countries of Central and Eastern Europe – Poland
National Bank of Poland – July 2011 40
May 2011, economic growth in Poland will continue in
2011 to be among the highest in the region. By contrast,
in the years 2012-2013 the NBP anticipates a reduction in
GDP growth in Poland. This decline will stem from the
measures implemented to lower the public finance
deficit, smaller absorption of EU transfers, reduced rate
of consumption growth and the completion of the
rebuilding of stocks.
In 2011, despite relatively high growth of nominal wage
bill, the growth in real disposable income of households
will remain low, which will result from high CPI inflation
and lower growth rate of social transfers in this period.
Growth in private consumption this year will therefore be
financed largely from a fall in the saving rate. In the
years 2012-2013, despite a slowdown in consumption
growth, it will remain a important contributor to GDP
growth. A moderate growth in disposable income of
households, including payroll fund (the limited effect of
improving the situation in the labour market) will have a
dampening impact on the growth in consumption during
this period.
After the reduction in 2010, the investment rate will
increase slightly in the years 2011-2013. In 2011, most
of investment growth will remain traceable to growth in
expenditures in the public sector, financed in a
substantial part from the inflow of EU structural funds. In
the years 2012-2013 the absorption of EU funds and the
expenditure of the public finance sector to co-finance it
are likely to decrease, leading to a significant reduction in
a growth of public investment. The increase in gross
fixed capital formation will be supported, especially since
2012, by a growing corporate investment demand. A
gradual increase in business investment will be
encouraged by a growing capacity utilization and
relatively low cost of ownership of capital.
The consumer prices in 2011 will grow significantly faster
than last year, fuelled by supply factors, like a rapid
increase in food and energy prices and the change of
VAT rates as of January 2011. It is expected that as of
2012 Q2, inflation will decrease to a level close to the
amount of the inflation target. The rate of inflation in the
medium and long projection horizon will obtain an
upward impact from rising labour costs. By contrast,
moderate domestic demand and declining growth in
global prices of agricultural raw materials and energy will
suppress the growth of inflation.
Both GDP and inflation forecasts are subject to risks, on
the one hand due to the forecast strength of economic
activity in countries that have the greatest impact on the
Polish economy, on the other hand - changes in fiscal
policy. In consequence of the excessive deficit procedure,
whereby Poland has to reduce the public finance deficit
below 3% in 2012, further adjustments may increase
revenues and reduce expenditures in this sector in the
years 2012-2013.
Table 7.4
Forecasts of main macroeconomic indicators (co to za January???)
NBP EC OECD IMF
07.2011 (10.2010)
05.2011 (11.2010)
05.2011 (11.2010)
04.2011 (10.2010)
GDP, in %, y/y
2011 4,0 (4,3) 4,0 (3,49) 3,9 (4,0) 3,8 (3,7)
2012 3,2 (4,2) 3,7 (4,2) 3,8 (4,3) 3,6 (3,9)
2013 2,9 3,7 (4,2)
Inflation, in %, y/y
2011 4,0 (3,0) 3,8 (2,9) 4,2 (2,5) 4,1 (2,7)
2012 2,7 (3,0) 3,2 (3,0) 3,1 (3,1) 2,9 (3,0)
2013 2,4 2,6 (2,9)
Current account balance, in % of GDP
2011 -4,1 (-3,3) -4,5 (-3,2) -3,9 (-2,6)
2012 -4,1 (-3,7) -4,8 (-3,8) -4,2 (-2,9)
2013 -4,4 (-2,7)
MNB – Report on Inflation, National Bank of Hungary

Analysis of economic situation in the countries of Central and Eastern Europe – Romania
National Bank of Poland – July 2011 41
Contribution to GDP growth (in pp, y/y)
HICP and its components (in %, y/y)
Retail sales (in %, y/y) and consumer sentiment index
Industrial production (in %, y/y) and business sentiment index
Current account and its components (in % of GDP, 4-quarter moving
average)
Financial account balance and its components (in % of GDP, 4-quarter moving average)
Unemployment rate (%) and employment growth rate (in %, y/y)
General government debt and deficit (in % of GDP)
Source: Eurostat, CSOs

Analysis of economic situation in the countries of Central and Eastern Europe – Romania
National Bank of Poland – July 2011 42
ROMANIA
Economic growth
After two subsequent years of decline in economic
activity (2009-2010), in 2011 Q1, for the second
consecutive quarter Romania posted an increase in GDP
in quarterly terms, which probably constitutes the end of
recession in this economy.
2010 was the second consecutive year in Romania, in
which private consumption dropped. This was due mainly
to the fiscal consolidation,43 low growth in loans and a
decline in real wages.
The expenditure of the government sector in 2010 was
reduced due to restrictive fiscal policy to nearly the
greatest extent among all the countries of the region.
Part of the consolidation activities (among others the
decrease in wages in the public sector by 25%) took
place in the second half of 2010, contributing to the
prolongation of recession in a period when the majority
of CEE countries were already experiencing economic
recovery.
Table 8.1 GDP and its components (in % y/y)
2009 2010 Q3 2010 Q4 2010 Q1 2011
GDP -6.3 -1.3 -2.1 -0.6 0.3
Private consumption -7.6 -1.5 -1.2 -1.3 -0.4
Public consumption -1.1 -3.6 -0.2 -5.7 -6.2
Fixed capital formation -6.5 -13.1 -7.2 -4.5 -4.9
Exports -9.1 14.3 12.1 18.0 21.2
Imports -15.4 12.4 9.3 13.6 12.3
source: Eurostat
Fixed capital formation continued a downward trend
mainly because of very low construction investment
outlays (annual growth of value added in this sector was
negative throughout the 2010). On the other hand,
investments in machinery increased, which was to a large
extent the result of a low base effect in 2009 (when
expenditure on machinery and means of transport posted
the deepest drop alongside the Baltic states) and of
improved business sentiment.
The only category which made invariably a positive
contribution to GDP growth in 2010 was a change in
inventories. Coupled with the increase in external
demand, it stimulated economic activity, particularly in
the industrial manufacturing sector.
In 2010, order book and exports increased hand in hand
with external demand. The recovery of investment
demand was accompanied by an increase in the import
volume of goods and services, whose growth was higher
than that of exports, which in turn translated into
negative contribution of foreign trade to GDP growth.
The recovery in imports took place mainly due to the
43 According to the WIIW institute, consolidation measures led to a decrease of GDP in the order of at least 1% per year.
increasing demand on capital and intermediate goods
triggered by increasing demand from the export-oriented
sector and rebuilding of inventories.
In 2011 Q1, for the first time since 2008, GDP increased
in annual terms (by 0.3%). This was due to the renewed
improvement of the foreign trade balance and continued
increase in inventories. On the other hand, the main
categories of domestic demand continued to weaken.
Exports of goods and services was the only category
whose volume exceeded (and significantly at that) the
pre-crisis level. In 2011 Q1 the growth of exports
continued to accelerate, and it was markedly bigger than
in the other countries of the region. At the same time,
the growth of imports to Romania weakened.
High external demand and the rebuilding of inventories
influenced the growth of Romania's industrial production
in 2011. In annual terms it remained above 4% for
almost the entire 2010, and in 2011 Q1 it increased to
more than 10%. The production of motor vehicles,
electrical appliances and metals exceeded the pre-crisis
level. The quick growth of industrial production was
accompanied by improvement of business sentiment. In
2011 Q1 there was a significant rise in the level of sub-
indices describing the expected number of orders,
competitive position and the volume of output. They
were only slightly lower than in the period preceding the
drop of activity in industry of October 2008.
At the same time the scale of drop in domestic
consumption was smaller, which was probably linked with
the increase in wages in the public sector by 15% (in
February 2011) and the reduction of unemployment rate.
In 2011 Q1 the negative growth in retail sales also
moderated due to the increasing demand on durable
goods. The downward trend in the sales of passenger
cars (where the scale of decrease from 2009 to 2010 Q1
exceeded 40%) stopped as well, propped up by the
policy of support to the automotive industry carried out
by the government.44 The slow stabilization in consumer
demand is also indicated by a moderate improvement in
consumer sentiment. Since the beginning of 2011 there
has been an improvement in the sub-indices describing
the assessment of future financial situation of
households, planned major purchases and situation on
the labour market.
44 The so-called Rable Programme. Its objective is the renewal of the car fleet in the country by writing-off old cars. A system of vouchers (worth RON 3.8 thousand each) granted for the scrapping of over 10 year-old cars enables the holder of max. 3 vouchers to buy a new car or sell the vouchers. In 2011 the programme is being continued. In the opinion of the Romanian Association of Car Producers and Importers (APIA), the initiative has achieved its objectives. According to government data, within the framework of the programme, ca. 63 thousand cars were bought, almost half of which having been manufactured in Romania (in total ca. 94.5 thousand new cars were registered). http://www.gov.ro/ and ACEA.
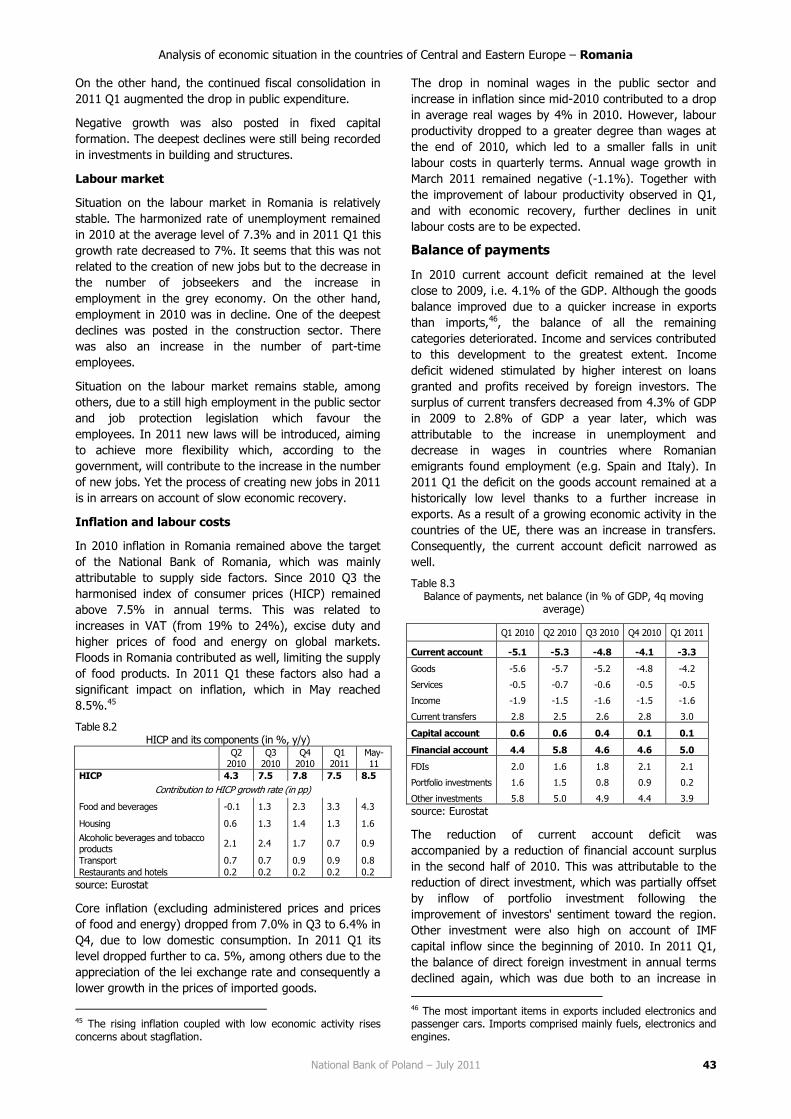
Analysis of economic situation in the countries of Central and Eastern Europe – Romania
National Bank of Poland – July 2011 43
On the other hand, the continued fiscal consolidation in
2011 Q1 augmented the drop in public expenditure.
Negative growth was also posted in fixed capital
formation. The deepest declines were still being recorded
in investments in building and structures.
Labour market
Situation on the labour market in Romania is relatively
stable. The harmonized rate of unemployment remained
in 2010 at the average level of 7.3% and in 2011 Q1 this
growth rate decreased to 7%. It seems that this was not
related to the creation of new jobs but to the decrease in
the number of jobseekers and the increase in
employment in the grey economy. On the other hand,
employment in 2010 was in decline. One of the deepest
declines was posted in the construction sector. There
was also an increase in the number of part-time
employees.
Situation on the labour market remains stable, among
others, due to a still high employment in the public sector
and job protection legislation which favour the
employees. In 2011 new laws will be introduced, aiming
to achieve more flexibility which, according to the
government, will contribute to the increase in the number
of new jobs. Yet the process of creating new jobs in 2011
is in arrears on account of slow economic recovery.
Inflation and labour costs
In 2010 inflation in Romania remained above the target
of the National Bank of Romania, which was mainly
attributable to supply side factors. Since 2010 Q3 the
harmonised index of consumer prices (HICP) remained
above 7.5% in annual terms. This was related to
increases in VAT (from 19% to 24%), excise duty and
higher prices of food and energy on global markets.
Floods in Romania contributed as well, limiting the supply
of food products. In 2011 Q1 these factors also had a
significant impact on inflation, which in May reached
8.5%.45
Table 8.2 HICP and its components (in %, y/y)
Q2
2010 Q3
2010 Q4
2010 Q1
2011 May-11
HICP 4.3 7.5 7.8 7.5 8.5
Contribution to HICP growth rate (in pp)
Food and beverages -0.1 1.3 2.3 3.3 4.3
Housing 0.6 1.3 1.4 1.3 1.6
Alcoholic beverages and tobacco products
2.1 2.4 1.7 0.7 0.9
Transport 0.7 0.7 0.9 0.9 0.8
Restaurants and hotels 0.2 0.2 0.2 0.2 0.2
source: Eurostat
Core inflation (excluding administered prices and prices
of food and energy) dropped from 7.0% in Q3 to 6.4% in
Q4, due to low domestic consumption. In 2011 Q1 its
level dropped further to ca. 5%, among others due to the
appreciation of the lei exchange rate and consequently a
lower growth in the prices of imported goods.
45 The rising inflation coupled with low economic activity rises concerns about stagflation.
The drop in nominal wages in the public sector and
increase in inflation since mid-2010 contributed to a drop
in average real wages by 4% in 2010. However, labour
productivity dropped to a greater degree than wages at
the end of 2010, which led to a smaller falls in unit
labour costs in quarterly terms. Annual wage growth in
March 2011 remained negative (-1.1%). Together with
the improvement of labour productivity observed in Q1,
and with economic recovery, further declines in unit
labour costs are to be expected.
Balance of payments
In 2010 current account deficit remained at the level
close to 2009, i.e. 4.1% of the GDP. Although the goods
balance improved due to a quicker increase in exports
than imports,46, the balance of all the remaining
categories deteriorated. Income and services contributed
to this development to the greatest extent. Income
deficit widened stimulated by higher interest on loans
granted and profits received by foreign investors. The
surplus of current transfers decreased from 4.3% of GDP
in 2009 to 2.8% of GDP a year later, which was
attributable to the increase in unemployment and
decrease in wages in countries where Romanian
emigrants found employment (e.g. Spain and Italy). In
2011 Q1 the deficit on the goods account remained at a
historically low level thanks to a further increase in
exports. As a result of a growing economic activity in the
countries of the UE, there was an increase in transfers.
Consequently, the current account deficit narrowed as
well.
Table 8.3 Balance of payments, net balance (in % of GDP, 4q moving
average)
Q1 2010 Q2 2010 Q3 2010 Q4 2010 Q1 2011
Current account -5.1 -5.3 -4.8 -4.1 -3.3
Goods -5.6 -5.7 -5.2 -4.8 -4.2
Services -0.5 -0.7 -0.6 -0.5 -0.5
Income -1.9 -1.5 -1.6 -1.5 -1.6
Current transfers 2.8 2.5 2.6 2.8 3.0
Capital account 0.6 0.6 0.4 0.1 0.1
Financial account 4.4 5.8 4.6 4.6 5.0
FDIs 2.0 1.6 1.8 2.1 2.1
Portfolio investments 1.6 1.5 0.8 0.9 0.2
Other investments 5.8 5.0 4.9 4.4 3.9
source: Eurostat
The reduction of current account deficit was
accompanied by a reduction of financial account surplus
in the second half of 2010. This was attributable to the
reduction of direct investment, which was partially offset
by inflow of portfolio investment following the
improvement of investors' sentiment toward the region.
Other investment were also high on account of IMF
capital inflow since the beginning of 2010. In 2011 Q1,
the balance of direct foreign investment in annual terms
declined again, which was due both to an increase in
46 The most important items in exports included electronics and passenger cars. Imports comprised mainly fuels, electronics and engines.

Analysis of economic situation in the countries of Central and Eastern Europe – Romania
National Bank of Poland – July 2011 44
Romanian investment abroad and a decrease in foreign
direct investment in Romania, coupled with the reduction
of net portfolio investment.
Interest rates and exchange rate
Since May 2010 the National Bank of Romania kept the
central bank interest rate at the level of 6.25%. Despite
inflation remaining above the target, the bank did not
decide to raise interest rates on account of low internal
demand. Due to higher inflation, no interest rate
reductions are expected in the second half of the year,
when the base effect wanes following the VAT rise.
However, in March the reserve requirement ratio was
reduced, which may contribute to an increase in loan
growth.47 Even though monetary policy was eased no
more, the interest rate on loans and deposits in the
banking sector remained in 2010 on a low level. Similarly
in 2011, when high liquidity on the interbank market was
accompanied by a reduction of the ROBOR 1M rate to ca.
4.4% in March 2011.
The exchange rate of the Romanian lei (RON)
depreciated since September 2010 till the end of 2010.
Its fluctuations were cushioned by occasional
interventions by the central bank, resulting in the
exchange rate remaining near the 2009 level. In January-
April 2011 the exchange rate of the RON against the euro
began to strengthen again, due to the improvement in
external position, reduction of political tensions and
fulfilment of obligations given to the IMF.48 However, due
to concerns about the impact of debt crisis in Greece, the
exchange rate of the lei depreciated once again in May
and June 2011.
Fiscal policy
As a result of deteriorating public finances, in 2010
Romania undertook determined steps aimed at reducing
the general government deficit below the level of 6.8%
of GDP, as required under the IMF, EU and World Bank
assistance package. The Budget Act for 2010 was revised
twice. The amendments primarily introduced wage cuts
47 The reserve requirement rate in the case of loans in foreign currency (with maturity of up to 2 years) was reduced in April 2011 from 25% to 20%, in the case of loans in domestic currency it remained unchanged at 15%. The dependence on foreign crediting was one of the reasons behind a deepening recession in Romanian economy in 2008-2009. At present, consumption is once again financed by foreign financing. 48 Romanian authorities resigned from the last tranche of the lMF loan package granted in 2009, on account of high reserves of the central bank and the improvement of economic situation. Romania also obtained a two-year preventive credit line in the amount of EUR 3.5 bn from the IMF, EUR 1.4 bn from the EU and EUR 0.4 bn from the World Bank. The programme is aiming at supporting structural reforms (among others more effective implementation of EU funds, restructuring and privatization of state enterprises in the energy and transport sector as well as reducing public indebtedness towards the private sector), as well as improving the trust of foreign investors and has been devised as a financial backup in case of future economic shocks. The programme will be accompanied by government actions aiming at reducing the budget deficit to 4.4% of GDP in 2011 and 3% of GDP in 2012. The repayment of the IMF loan will take place in 2012-2015, the repayment of interest begins in 2011.
in the public sector by 25% and a significant increase in
VAT rate from 19% to 24% as well as raised the
transfers from state enterprises. As a result the general
government deficit amounted last year to 6.4% of GDP
against 9.8% of GDP in 2009, with Eurostat expressing
its reservations to this figure.49
In 2011, the fiscal deficit in the Romania is anticipated to
amount 4.9% of GDP. State budget expenditure for 2011
was frozen. Pension and disability benefits will not be
indexed again, while wages in the public sector will
increase by 15% as compared with a 25% cut in mid-
2010. Simultaneously, additional annual remunerations,
as well as other fringe benefits were abolished.
Restrictions concerning the employment of new civil
servants (1 new employee for each 7 employees leaving
the job) will still be binding. The government is also
planning to reduce the social security insurance
contributions by 2 pp since the 2nd half of 2011 with the
level of PIT, CIT and VAT taxation frozen for the next
three years.
Romania's general government deficit in 2012, i.e. at the
deadline of its reduction below the reference level,
should amount to 3% of GDP against 3.8% forecast by
the EC. In the subsequent years the fiscal balance is
envisaged to improve in the pace of 0.4-0.5 pp of GDP.
Among the proposed measures, the authorities are
planning to continue efforts in streamlining public sector
employment, a reform of state enterprises and the social
security system. The latter is going to consist of
increased control and improvement of benefit targeting
as well as the introduction of a joint limit of social
transfers per person. An unstable political situation and
parliamentary elections in 2012 may pose a risk to the
achievement of the intended deficit target. Moreover
Romania has to solve the problem of indebtedness of
state enterprises, estimated at 5% of GDP.
The president of Romania put forward a legislative
motion concerning introduction of a cap on budget
deficit to the Constitution in order to prevent the
widening of fiscal imbalance. The Parliament is set to
conduct work on this draft in mid-2011. In 2010 the Act
on Fiscal Responsibility was adopted, which established a
fiscal council and multi-annual expenditure limits.
The level of public debt in Romania is going to stabilize in
subsequent years at the level of ca. 32-33% of GDP and
will be among the lowest in the countries of the region.
Since 2012 Romania is planning to restart issuance of
foreign currency denominated bonds.
Forecasts
In the first half of 2011, Romanian economic outlook did
not change significantly. In 2011 this country should
recover from recession with a one-year lag in comparison
to other CEE countries. Expectations for the coming 6
months are positive, which is indicated, among others, by
49 Eurostat doubts concern the classification of transfers to/from state enterprises as well as the consolidation of income and expenditure within the general government.

Analysis of economic situation in the countries of Central and Eastern Europe – Romania
National Bank of Poland – July 2011 45
the improvement in the ZEW index (established on the
basis of the surveys of economic prospects assessment)
in April 2011, and the GDP will be gradually coming back
to the path of growth in the coming two years. According
to the European Commission, Romania will reach GDP
growth at 1.5% in 2011 and in 2012 it will accelerate to
3.7%, i.e. above potential growth.
European Commission assumes that since 2011 net
exports will be replaced by fixed capital formation and
private consumption as main factors spurring GDP
growth. Private investment will be accompanied by
expected further growth of manufacturing and new
orders (still strong foreign demand). Public investment
may grow, stimulated by faster implementation of new
infrastructural projects financed primarily from EU funds.
Private consumption will lost its momentum, inhibited by
high interest rates and low wage growth. Within the next
2 years, however, a reversal of negative tendencies on
the labour market and a limitation of fiscal consolidation
are expected. The coming parliamentary elections may
trigger an increase in government expenditure, which will
constitute another incentive towards an increase in
consumption and GDP in 2012. 50 It is also expected that
in mid-2011 inventories will reach the level from before
the crisis, thus their contribution to the GDP growth will
also be decreasing.
Threats to growth stem from political climate in Romania
and in peripheral countries of the euro area. They may
affect investors' sentiment toward the developing
European countries and reduce the inflow of capital to
Romania.51 The risk also comes from a gradual reduction
of IMF monitoring and impact on the economic policy in
this country. A weaker than expected economic recovery
in Western Europe may negatively affect Romanian
exports. An important obstacle to growth are state-
owned enterprises generating high losses.52 On the other
hand, their restructuring and privatization are envisaged,
which may contribute to the increase of inflow of direct
foreign investment.
Inflation in 2011 will be running probably highly above
the inflation target of the National Bank of Romania (i.e.
3%+/-1%). The European Commission expects that the
average inflation rate in this year will amount to 6.7%. In
May 2011 the NBR raised the forecast from 3.4%
(November 2010) to 5.1% (in July inflation may still be
high – up to 9%). The scale of its growth will depend on
50 A similar situation took place in the case of earlier parliamentary elections in Romania in 2004 and 2008. Consumption in the year preceding and following elections was significantly lower than in the year in which they took place. This time the scale of consumption growth may be reduced on account of reduced access to foreign sources of financing as a result of crisis. 51 Romania despite a slight improvement in February 2011 posts besides Lithuania one of the lowest loan ratings among the 9 New Member States of the EU. 52 According to IMF estimates, ten biggest unprofitable state enterprises generated a loss in the amount of 1.1% of GDP in 2010.
the persisting high level of energy and food prices53 and
the increase in administered prices in part of state
enterprises. In 2011, subsidies on heat energy should
diminish. The high (but decreasing) output gap will be
acting in the reverse direction, as will the waning of the
base effect related to the VAT increase in mid-2010
(expected inflation drop by ca. 3 pp.). The European
Commission expects the inflation to return to the level of
4% in 2012.
The current account deficit in 2011-2012 probably will
not decrease, due to the increase in the goods deficit s
related to a fast growing imports (which will be affected
by the recovery in domestic demand and investment). It
is expected that 2011 it will amount to 4.4% of GDP and
in 2012 it will widen to 4.8%,
Table 8.4 Forecasts of main macroeconomic indicators
CNP/NBR EC IMF
Consensus Economics
05.2011 (11.2010)
05.2011 (11.2010)
04.2011 (10.2010)
06.2011 (12.2010)
GDP, in %, y/y
2011 1,5 (1,5) 1,5 (1,5) 1,5 (1,5) 1,7 (1,5)
2012 4,0 (3,9) 3,7 (3,8) 4,4 (4,4) 3,6
2013 4,5 (4,5) 4,3 (4,2)
Inflation, in %, y/y
2011 3,4 (2,8) 6,7 (5,5) 6,1 (5,2) 6,5 (5,4)
2012 4,0 (3,2) 3,4 (3,0) 4,3
2013 3,0 (3,0)
Current account balance, in % of GDP
2011 -5,5 -4,4 (-5,6) -5,0 (-5,4)
2012 -4,9 -4,8(-6,2) -5,2 (-5,1)
2013 -5,2 (-5,0)
GDP and current account balance forecast - Comisia Naţională de Prognoză (CNP), inflation forecast - Banca Naţională a României
53 The contribution of fuels and energy in the Romanian CPI basket amounts to 48% with 21% for EU-27.

Analysis of economic situation in the countries of Central and Eastern Europe – Romania
National Bank of Poland – July 2011 46
Contribution to GDP growth (in pp, y/y)
HICP and its components (in %, y/y)
Retail sales (in %, y/y) and consumer sentiment index
Industrial production (in %, y/y) and business sentiment index
Current account and its components (in % of GDP, 4-quarter moving
average)
Financial account balance and its components (in % of GDP, 4-quarter moving average)
Unemployment rate (%) and employment growth rate (in %, y/y)
General government debt and deficit (in % of GDP)
Source: Eurostat, CSOs

Analysis of economic situation in the countries of Central and Eastern Europe – Slovakia
National Bank of Poland – July 2011 47
SLOVAKIA
Economic growth
The downturn in economic activity registered in 2009, for
the first time since the formation of the independent
Slovakian state in 1993, was on the one hand relatively
moderate (-4.8%) in comparison with other Central and
Eastern Europe countries, but on the other – it was
relatively short-lived as it lasted only 4 quarters. In 2010
Slovakia's gross domestic product increased in real terms
by 4.0%, i.e. most of all other countries of the region. To
a large extent this was attributable to a recovery in
global economy, and particularly in Germany, i.e. the
biggest trade partner.
Table 9.1 GDP and its components (in % y/y)
2009 2010 Q3 2010 Q4 2010 Q1 2011
GDP -4.8 4.0 3.9 3.4 3.6
Private consumption 0.3 -0.3 -0.6 0.8 0.0
Public consumption 5.6 0.1 0.5 -3.2 -2.3
Fixed capital formation -19.9 3.6 6.4 10.4 1.3
Exports -19.9 16.4 18.0 13.2 17.0
Imports -18.6 14.9 19.0 13.5 11.2
source: Eurostat
Following a faster growth in exports (16.4% y/y) than
that of imports (14.9% y/y) foreign trade affected
positively economic growth in Slovakia last year. In the
first three quarters of 2010 both categories grew at a
relatively quick pace, while 2010 Q4 saw a clear
slowdown in their growth. The largest increases in 2010
were observed primarily in the sales of passenger cars,
which are the most important item in Slovakian exports.
Among domestic factors a dominant role in stimulating
economic activity in 2010 was played by an fixed capital
formationand rebuilding of inventories in enterprises. The
rebound in investment activity observed in 2010,
following its strong drop in 2009 (companies' outlays on
modernization and the expansion of the existing
production capacity decreased by 19.9% y/y), resulted
mainly from the improvement of the financial situation of
enterprises, industrial production rising at a two-digit
pace (this justified the need to increase production
capacity) and from the easing of banks' lending policy.
In turn, the drop in GDP growth reflected a decrease in
individual consumption (by 0.3% y/y, after an increase
by 0.3% y/y in 2009). Lower consumer spending in 2010
resulted not only from a persistently difficult situation on
the domestic labour market, but also a restrictive fiscal
policy of the Slovakian government. The undertaken
consolidation measures aimed at reducing the budget
deficit, including mainly tax increases (VAT and excise
tax), translated into a drop in consumption demand.
According to preliminary data in 2011 Q1 Slovakian GDP
increased by 3.6% y/y following an increase by 3.4% y/y
in 2010 Q4. Similarly as in 2010, the main driving force
behind the growth was the net exports. In the first three
months of 2010, enterprises sold 17.0% more goods
abroad than in the corresponding period of 2010, while
at the same time 11.2% more goods were imported to
Slovakia.
In turn the domestic demand negatively affected the
pace of economic growth in 2011 Q1. This resulted both
from a renewed drop in budgetary expenditure (which
should be explained mainly by the continuation of actions
aimed at fiscal consolidation) as well as from the drop in
the growth rate of private consumption.
Data on retail sales indicate that the drop in the
consumption expenditure of Slovakian households
observed in the first three months of 2011 was probably
temporary. During the period January to April 2011 the
annual sales growth remained at a high level (4.1% y/y)
except in March when an increase was posted of only
1.0% compared with the corresponding month of 2010.
On the other hand, the investment outlays increased
once again in 2011 Q1. The scale of this increase was
definitely lower than in the previous three quarters.
In the first four months of this year the industrial output
in Slovakia continued along the rising trend started in
2009 Q2, reaching the level seen before the crisis. This
was due to the ongoing global recovery, in particular
recovery at the most important exports markets.
Labour market
Despite the fact that during the period January to
December 2010 the unemployment rate in Slovakia
dropped from 14.5% to 14.0%, in the whole 2010 it
stayed at a heightened level in comparison with the
previous years54. The slow pace of adjustment in the
labour market was related, among others, to high
percentage of long-term unemployed (last year it
amounted to 64.1% against 54.1% in 2009). The latter
reveals various structural problems on the Slovakian
labour market, including in the first place low mobility of
the labour force, large disproportions in development
between particular regions of the country and a
mismatch between employee skills and market’s needs.
According to preliminary data in 2011 Q1 unemployment
rate amounted to 14%. Once again the highest
percentage of unemployed was registered in industry. On
the other hand, the largest increase in the number of
unemployed took place in public administration and in
trade.
The employment growth in Slovakia remained negative in
2010. In the first three quarters of 2010 the scale of the
job reduction rate was admittedly decreasing and the
employment still edged up in 2010 Q4 (0.5% y/y). The
54 In 2008-2009 the unemployment rate amounted respectively to 9.5% and 12.0%.
Analysis of economic situation in the countries of Central and Eastern Europe – Slovakia
National Bank of Poland – July 2011 48
decrease in employment hit the industrial sector to the
largest extent (a drop by 3.4% y/y), while in the service
sector the number of employees did not change in
annual terms.
Preliminary estimates indicate that in 2011 Q1 the
upward trend in employment strengthened (a rise by
2.1% in comparison with 2010 Q1). The number of
employed persons went up most in industry and in the
services sector. In turn the biggest decreases were
recorded in trade.
Inflation and labour costs
In 2010 the annual HICP inflation rate in Slovakia fell to
0.7% (as against 0.9% in 2009) thus setting a new
historic minimum. Most of the drop in the consumer
prices in 2010 derived from a drop in energy prices (-
1.3% y/y against their growth by 0.3% in 2009), and in
the prices of housing-related services (-1.4% y/y against
their rise by 3.4% in 2009)., Food prices admittedly rose
in 2010 but eventually this did was not enough to raise
inflation. There was no clear upward pressure on inflation
coming from wages which in 2010 increased at a
moderate pace (3.3% y/y compared to 3.0% in 2009).
Core inflation remained in 2010 at a stable level reaching
0.4% y/y.
Table 9.2 HICP and its components (in %, y/y)
Q2
2010 Q3
2010 Q4
2010 Q1
2011 May-11
HICP 0.7 1.1 1.1 3.5 4.2
Contribution to HICP growth rate (in pp)
Housing -0.3 -0.3 -0.4 1.3 1.4
Food and beverages 0.2 0.6 0.9 1.2 1.3
Transport 0.0 -0.1 0.0 0.5 0.6
Other 0.1 0.1 0.2 0.2 0.3
Alcoholic beverages and tobacco
products 0.4 0.4 0.2 0.1 0.2
source: Eurostat
In turn, in the first months of 2011, a strong rise in HICP
inflation was observed in Slovakia. According to
preliminary estimates in May 2011 it amounted to as
much as 4.2% y/y against 1.3% y/y in December 2011.
This was attributable on the one hand to rapidly
increasing global oil and food prices, which translated
into a higher growth in domestic energy prices (9.8%
y/y) and food prices (7.4% y/y) in this period, and on the
other hand to tax rises (excise and VAT), constituting
part of the government programme of public finance
consolidation. The acceleration in consumer goods and
services in January-May 2011 was also due to the
increase in regulated prices. Core inflation in this period
amounted to 1.4% y/y.
The pace of wage growth in Slovakia decreased in 2011
Q1 to 2.9% y/y from 3.8% y/y in 2010 Q4. Wages
increased in all sectors of economy, excluding public
administration in which a slight decrease (-0.1% y/y) was
seen.
Balance of payments
In 2010 the current account deficit widened in nominal
terms, though the scale of this increase was not very
large (ca. EUR 150 m). On the other hand, the structure
of this deficit changed considerably, as 2010 brought a
strong decrease in the goods and services surplus which
resulted from a stronger growth in imports than in
exports. The high growth in imports was attributable to
higher global commodity prices and an upturn in the
investment activity in Slovakia. On the other hand, the
deficit on services decreased markedly, while the
negative balance on income remained virtually
unchanged. Even though the current account deficit
increased, in terms of GDP in 2010 decreased slightly to -
3.0% (from -3.2% in 2009), due to a higher growth of
gross domestic product.
Table 9.3 Balance of payments, net balance (in % of GDP, 4q moving
average)
Q1
2010 Q2
2010 Q3
2010 Q4
2010 Q1
2011
Current account -2.3 -2.3 -2.8 -3.0 0.4
Goods 2.1 2.1 1.5 0.4 0.1
Services -1.6 -1.5 -1.4 -1.1 0.1
Income -2.1 -2.3 -2.1 -1.7 0.0
Current transfers -0.7 -0.7 -0.8 -0.6 0.2
Capital account 1.4 1.3 1.8 1.8 1.0
Financial account 3.3 0.5 0.9 -0.5 0.3
FDIs -0.5 0.7 0.8 -0.3 -0.4
Portfolio investments -3.3 -3.5 -2.8 -2.0 1.5
Other investments 7.1 3.4 2.9 1.8 -0.8
source: Eurostat
A negative balance was recorded on Slovakian financial
account, in other words foreign capital flowed out of the
country. Most of the exodus was attributable to a drop in
surplus in the so-called Other investment as a result of
reduction in the liabilities of the National Bank of Slovakia
towards the European System of Central Banks55.
Additionally residents increased their exposure abroad,
by purchasing financial assets. In effect, the negative
balance on portfolio investment increased. At the same
time, foreign direct investment in Slovakia rose, mainly in
the form of reinvested gains.
Preliminary estimates indicate that in the first two
months of 2011, there was a slight surplus in the current
account, which was attributable, among others, to
persisting positive balance on trade in goods and
decreasing deficit on services. Moreover an inflow of
foreign capital to the country occurred in all three forms
of investment.
55 Following Slovakia's entry to the euro area in 2009, the Slovakian Central Bank in order to settle its liabilities towards the domestic banking sector started borrowing funds from central banks of other Member States of the euro area. The payment of the bigger part of the contracted loan was due in 2010.

Analysis of economic situation in the countries of Central and Eastern Europe – Slovakia
National Bank of Poland – July 2011 49
Fiscal policy
In 2010, the general government deficit in Slovakia was
similar (7.9% of GDP) to its level from 2009 (8.0% of
GDP). This situation apart from a weaker impact of
improvement of the economic situation on the increase in
tax income,56 was attributable to higher than planned
expenditure of local government units (among others
related to the flood damages) and to the subsidies to
hospitals and state-owned railways from the state
budget.
While in the previous two years automatic stabilizers
were allowed to operate freely, in 2011 a definite fiscal
tightening will take place. Measures adopted in the first
consolidation package (ca. 2.5% of GDP) are evenly
distributed among revenue and expenditure. State
budget expenditure has been reduced by 10%,57 and
effectiveness of the public procurement system has been
improved. Since 2011 many rates have been raised: VAT
(temporarily58 from 19% to 20%), excise – including the
tax relief for bio-components together with the abolition
of some tax preferences in PIT coupled with the increase
in some charges.59 These actions are supposed to reduce
the general government sector deficit in 2011 by ca. 3 pp
of GDP, to 4.9% of GDP.
In the subsequent years the magnitude of fiscal
adjustment is supposed to be lower and is estimated by
the Slovak government at 1% of GDP in 2012 and 0.9%
of GDP in 2013.60 Measures described in the second
consolidation package concern further cuts in public
expenditure (current,61 capital and subsidies). On the
revenue side, the proposed changes include an increase
in excise on beer and wine, real estate tax (by 50%), the
introduction of a banking tax and uniform principles of
CIT amortization. The Slovak government proposed also
other legislative drafts concerning pension indexation
mechanism (since 201362) and the postponement of
payments related to building and maintenance of the
electronic system of toll collection, reduction of support
to the housing sector, reform of the special pension
scheme for the uniformed services, disbandment of some
budget units and agencies. However, they have not been
adopted by the Parliament. Moreover, the decision of the
56 Budget revenue execution in Slovakia was lower in 2010 by 1% of GDP than planned (mainly on account of lower VAT collection). 57 Cuts will be applied to wages (except teachers and soldiers, and to a lesser extent in the case of uniformed services and academic workers). National Defence expenditure in 2011 was slashed by 20%. 58 Effective till correction of the excessive deficit procedure. Since 2015 it should return to the previous level. In the case of some medicines and medical articles as well as books, the binding rate is 10%. 59 Charges for state material reserves, the National Atomic Energy Fund, and a twofold increase in the annual highway tolls. 60 In 2014, no consolidation measures are envisaged. 61 Some small wage rises are anticipated for 2013 and 2014, respectively by 1% and 3%. Scrutiny of employment in the public sector will be carried out. 62 At present the indexation ratio takes into consideration in equal proportions the CPI and the wage growth in the domestic economy. After 2013, it will take into account inflation only.
previous government concerning the voluntary
membership in funded pension scheme for persons
entering the labour market is going to be reversed. In
the assessment of the European Commission,
macroeconomic assumptions for 2013-2014 are too
optimistic and the achievement of fiscal deficit targets at
the level of 3.8% of GDP in 2012 and ca. 2.8-2.9% of
GDP in the following two years will be conditioned by the
implementation of measures proposed by the authorities.
The latest Slovak Stability Programme stipulates an
introduction of fiscal rules limiting: the budget
expenditure, debt of local government units and general
government debt (60% of GDP), as well as the
appointment of an independent fiscal council.
Public debt in Slovakia in 2011 is anticipated to reach
44.1% of GDP (as compared to 41.0% in 2010). In 2012
it is forecast at 45.3%, and in the following years
expected to stabilize at that level.
Forecasts
In its latest forecast, the National Bank of Slovakia
anticipates that in 2011 the country's economy will
develop at the rate of 3.6%, i.e. slightly slower than in
2010 (4.0%). The expected deceleration in GDP growth
will stem primarily from the ongoing process of fiscal
policy tightening by the Slovakian government, which will
translate into a decrease in budget expenditure. This
fiscal consolidation will also be reflected in a moderate
increase in private consumption. Additionally, the
expected lack of improvement on the local labour market
will be conducive to a slow pace of increase in the
consumption of households. On the other hand, foreign
demand should continue to support economic activity,
with an expected significantly lower exports growth. In
2012, a GDP growth of 4.7% is expected, mainly on
account of higher consumer spending and growing
investment outlays of enterprises.
Over the forecast horizon, consumer prices in Slovakia
will be still shaped by external factors. In 2011, on
account of expected higher global oil prices, HICP
inflation will rise to 4.1% y/y from 0.7% y/y in 2010. In
turn, following the anticipated slower increase in oil
prices in 2012 domestic prices of consumer goods and
services will decelerate their growth to 3.3% y/y.
In 2011-2012 the current account deficit will be gradually
decreasing as a result of a growing surplus in trade. The
deficit on services, on the other hand, should remain at
the previous level, limiting the negative impact of this
component on the whole current account balance.

Analysis of economic situation in the countries of Central and Eastern Europe – Slovakia
National Bank of Poland – July 2011 50
Table 9.4 Forecasts of main macroeconomic indicators
NBS EC OECD IMF
06.2011
(12.2010)
05.2011
(11.2010)
05.2011
(11.2010)
04.2011
(10.2010)
GDP, in %, y/y
2011 3,6 (3,0) 3,5 (3,0) 3,6 (3,5) 3,8 (4,3)
2012 4,7 (4,0) 4,4 (3,9) 4,4 (4,4) 4,2 (4,4)
2013 5,3 4,3 (4,3)
Inflation, in %, y/y
2011 4,1 (3,9) 3,6 (3,2) 3,9 (3,4) 3,4 (1,9)
2012 3,3 (2,6) 2,9 (2,8) 2,9 (2,9) 2,7 (2,4)
2013 2,5 2,9 (2,6)
Current account balance, in % of GDP
2011 -1,6 (-1,3) -2,8 (-1,9) -2,4 (-0,9) -2,8 (-2,6)
2012 -0,2 (-0,4) -2,6 (-1,7) -1,3 (-0,3) -2,7 (-2,5)
2013 0,4 -2,6 (-2,5)
NBS – Medium Term Forecast, Národná Banka Slovenska

Analysis of economic situation in the countries of Central and Eastern Europe – Slovakia
National Bank of Poland – July 2011 51
Contribution to GDP growth (in pp, y/y)
HICP and its components (in %, y/y)
Retail sales (in %, y/y) and consumer sentiment index
Industrial production (in %, y/y) and business sentiment index
Current account and its components (in % of GDP, 4-quarter moving
average)
Financial account balance and its components (in % of GDP, 4-quarter moving average)
Unemployment rate (%) and employment growth rate (in %, y/y)
General government debt and deficit (in % of GDP)
Source: Eurostat, CSOs
Analysis of economic situation in the countries of Central and Eastern Europe – Slovenia
National Bank of Poland – July 2011 52
SLOVENIA
Economic growth
Slovenia is among those countries of the region, which
were hit the hardest by global recession. After the euro
area entry (in 2007) most of high economic growth in
this country came from lending expansion and a booming
construction sector. The global crisis led to the collapse
of both these pillars and heavily impacted the pace of
economic recovery. Although since 2010 Q1, Slovenian
economy has been experiencing economic growth in
annual terms, its pace was among the slowest in Central
and Eastern Europe. Economic pick-up in Slovenia results
from a recovery in external demand, while domestic
demand remains very weak. Consumption is additionally
negatively affected by government's actions – on the one
hand resulting from abandoning anti-crisis policy (mainly
by retaining the number of jobs), on the other – actions
aiming at fiscal consolidation taken up starting from
2010.
Table 10.1 GDP and its components (in % y/y)
2009 2010 Q3 2010 Q4 2010 Q1 2011
GDP -7.8 1.2 1.4 1.9 2.1
Private consumption -1.4 0.7 1.4 0.9
Public consumption 3.1 0.8 -0.7 3.2
Fixed capital formation -21.6 -7.1 -7.4 -6.0
Exports -15.6 7.7 8.3 6.6
Imports -17.9 6.7 5.1 7.1
source: Eurostat
The most important growth factor in 2010 was the
external demand. It contributed not only to the increase
in exports but also to the increase in expenditure on
machinery and equipment in export-oriented enterprises
and to a gradual rebuilding of inventories (which started
at the beginning of 2010). At the same time value added
increased most in sectors with the strongest influence of
external demand, i.e. in manufacturing (by 8%) and
transportation (6%). Exporters, a lot of them joint-
ventures had also easier access to loans, while conditions
of crediting for enterprises in Slovenian banks remained
very tight.
The biggest significance for Slovenian exports can be
attributed to demand in EU countries, where the sales
growth was the highest. Meantime, exports to other
trade partners, particularly to the ex-Yugoslavia
countries63 practically stopped at the level from 2009,
which negatively influenced the total exports growth
(Slovenian exports rose at the slowest pace among CEE
countries in 2010).
63 The countries of the former Yugoslavia before the crisis (i.e. in 2008) accounted for 17.5% of Slovenian exports. In 2009 the value of exports in current prices to these countries decreased by 23.9% and in 2010 increased merely by 1.2% (including the still decreasing value of exports to Croatia, which before the crisis was the third exporting market of Slovenia).
Recovery in the export-oriented sector affected the
increase in imports demand – focused mainly on
intermediate goods and partially on capital goods. As a
result of steadily rising growth of imports, the direct
contribution of net exports to economic growth declined
in 2010 and in 2010 Q4 it was already negative.
In 2010, the expenditures of households continued a
weak rising trend. While their slight rise in 2009 may be
interpreted as a positive phenomenon (particularly
against the background of other countries of the region),
in 2010 they rather induced the deceleration of the
recovery process in Slovenia. A negative impact on the
growth of private consumption was exercised by a
worsening situation on the labour market and a low
growth in loans to households.
A positive impact on economic growth was exercised by
public expenditure, though smaller than in 2009. The
reduction of increase in expenditure were attributable to
measures aiming at reducing budget deficit.
In turn, a negative impact on growth of economic activity
in Slovenia came from construction investment, both
housing and commercial. Following a drop in expenditure
on construction investment in 2009 by 19.2%, in 2010
this category decreased by 15.7%.
In 2011 Q1 the structure of economic growth continued
the trends observed in 2010. In comparison with 2010
Q4, growth in the categories dependent on external
demand accelerated, while domestic demand weakened
(or its decline steepened). Further sharp declines took
place in the construction sector , where the drop in 2011
Q1 was steeper than in 2010, on average.
The still low consumer demand is testified by slow
increase in retail sales, which took place largely as a
result of the increase in fuel sales. Excluding fuels, the
real volume of retail sales in January-April 2011 increased
merely by 0.6% (against a drop by 1.3% in 2010). Sales
declined in the majority of categories including durable
goods.
Consumer sentiment indices do not promise a significant
improvement in the coming months either. Households
assess their current situation and the general economic
situation of the country as particularly unfavourable. In
January-May, expectations improved slightly. More
Slovenians declared the intention for major purchases
within the coming 12 months than in the previous two
years. It is probably due to the willingness to make
purchases put off in the period of deepest recession.
Manufacturing remained the main economic growth
driver in 2011 in Slovenia. In January-April 2011
industrial production increased by 8.7%, i.e. more rapidly
than on the average in 2010 (6.8%). A rapid increase in
the number of new orders (by 11.2%) within the first

Analysis of economic situation in the countries of Central and Eastern Europe – Slovenia
National Bank of Poland – July 2011 53
four months of 2011 suggests that the increasing trend in
production will probably persist in the coming months.
Foreign order books still rose the most rapidly, although
the portfolios of domestic orders gradually accelerated
their expansion.
At the beginning of 2011, business sentiment continued
to improve. The indices of reached the level from before
the crisis. The largest impact could be attributed to the
increase in the volume of foreign orders. Relatively high
expectations of output increase made the entrepreneurs
consider more and more often the possibility of
increasing employment.
Very sharp declines prevail in the construction and
assemblage. In 2011 Q1 it fell in annual terms by 23.6%
and preliminary data for April 2011 suggest a sharpening
of declining tendencies. In the first half of 2011 the
scale of declines in the Slovenian construction sector was
the largest in the region.
Labour market
In 2010 falls in employment intensified. The number of
jobs in comparison with 2010 declined by 2.2%
(following a decrease by 1.9% in 2009). Employment
decreased the most in construction (by 9.5%) and in
manufacturing (by 6.3%). Decrease in employment in
the whole economy was moderated by its increase in the
public sector (by 1.8%). The harmonized rate of
unemployment increased relatively quickly, as for
Slovenian conditions (Slovenia up to that moment stood
out against other countries of the region by high stability
of labour market indices). In late 2010 it amounted to
7.7%.
In 2011 Q1 the decrease in employment steepened while
the growth in unemployment rate accelerated. Such a
significant lag in the reaction of employment to the
deterioration in economic conditions resulted from the
termination of actions undertaken by the Slovenian
government in order to warrant employment to some
employees within the framework of programmes
weakening the impact of the crisis. In the December
2010 – January 2011 period these contracts expired,
which led to a further drop in employment and rise in
unemployment. In April 2011 the rate of unemployment
increased to the level of 8.2%, i.e. the highest since the
Eurostat published data for Slovenia (since 1996). Since
the beginning of the crisis the unemployment rate in
Slovenia increased almost twofold.
In the period from January to March 2011 employment
decreased by 2.3% in comparison with the corresponding
period of previous year. The number of jobs further
decreased in construction and industry. However,
employment increased in some services sectors,
particularly in healthcare and education.
Inflation and labour costs
Inflation in Slovenia is among the lowest in the region
besides the Czech Republic. In May 2011 the harmonized
index of consumer prices (HICP) amounted to 2.4%
(while in the whole 2010 it amounted to 2.1%). The
main factor for inflation growth in 2011 are the prices of
food while the impact of the increase in the prices of
fuels in global markets on domestic inflation was
weakened by the decrease of excise tax on motor fuels.
According to estimates, these measures have made the
level of current inflation drop by 0.4 pp. to date.
Core inflation (HICP index after excluding the prices of
energy and food) remained for almost the whole 2010
below zero. This development was attributable to a
significant drop in car prices, deceleration in the growth
service prices and introduction of subsidies to school
meals. Low consumption demand brought a sharpening
of the decrease of core inflation in 2011. This partly
contributed to the reduced fee of radio and TV licence.
Table 10.2 HICP and its components (in %, y/y)
Q2
2010 Q3
2010 Q4
2010 Q1
2011 May-11
HICP 2.4 2.3 2.0 2.2 2.4
Contribution to HICP growth rate (in pp)
Food and beverages 0.1 0.4 0.3 0.7 1.2
Housing 1.2 1.2 1.0 0.8 0.7
Alcoholic beverages and tobacco
products 0.4 0.4 0.4 0.4 0.3
Transport 0.4 0.0 0.3 0.5 0.3
Housing 0.0 0.1 0.1 0.1 0.2
source: Eurostat
The gross average wage increased by 5.1% in 2010
(against an increase by 1.8% in 2009), and the wage in
manufacturing by 8.9% (0.9% in 2009). Wage increase
is primarily attributable to the reductions being
concentrated in the segment of the least paid jobs, raise
of minimal wage and raising of wages for those
employees who in the period of the deepest economic
slowdown were covered by the programme of wage
subsidies. At the same time the growth in labour costs in
the public sector decreased visibly. In 2009 gross wage
increased by 6.6%, while it remained at an unchanged
level in 2010 as a result of the introduction of a new
wage system.
In March 2011 nominal wage growth rate decelerated. It
was related to the waning impact of minimal wage rise,
which in 2010 was introduced by enterprises much more
rapidly than indicated by government forecasts. Wages in
the public sector still remained practically unchanged.
Balance of payments
In 2010 the current account deficit in Slovenia narrowed
for the second consecutive year, both in nominal terms
and in relation to GDP (to -1.1%, from -1.5% in 2009).
On the one hand this was due to lower interest rates paid
to non-residents from contracted loans, which positively
affected the income balance. On the other, the the
acceleration of payments from European Union funds in
2010 found its reflection in the current transfers surplus
(0.3% of GDP) against the deficit registered in 2009 (-
0.4% of GDP). Balance in services, though fell slightly,
remained positive. On the other hand the deficit in goods
Analysis of economic situation in the countries of Central and Eastern Europe – Slovenia
National Bank of Poland – July 2011 54
widened in 2010 on account of terms of trade
deterioration, despite the fact that more goods were
exported than imported with respect to 2009.
Table 10.3 Balance of payments, net balance (in % of GDP, 4q moving
average)
Q1 2010 Q2 2010 Q3 2010 Q4 2010 Q1 2011
Current account -0.9 -1.3 -0.8 -1.1 -1.1
Goods -1.9 -2.4 -2.2 -2.7 -3.1
Services 3.1 3.1 3.0 2.9 3.1
Income -2.0 -1.8 -1.5 -1.7 -1.7
Current transfers -0.2 -0.2 0.0 0.3 0.6
Capital account 0.1 0.0 0.1 0.0 -0.1
Financial account 0.8 1.8 2.0 1.6 2.1
FDIs -1.6 -0.3 -0.1 1.4 1.7
Portfolio investments 13.8 11.9 5.2 5.4 9.5
Other investments -11.6 -9.6 -3.0 -5.0 -8.8
source: Eurostat
In 2010 Slovenian financial account once again posted a
surplus. The inflow of both direct and portfolio
investment increased. In the first case this was
attributable to taking up shares in domestic entities by
foreign investors. In turn the increase in foreign portfolio
investments was linked to the purchase of bonds issued
by one of local banks. At the same time, however,
Slovenian consumers and enterprises increased
investments in foreign debt securities, which eventually
brought about a decrease in positive balance on a
portfolio investments account. In 2010 there was also a
significant drop in the scale of capital outflow from
Slovenia in a form of other investment. This was
attributable to the fact that Slovenian banks granted at
that time less loans to foreign entities than in 2009.
Fiscal policy
Slovenian budget deficit slightly decreased in 2010 in
Slovenian general government deficit decreased slightly
in 2010 compared to 2009, (from 6.0% of GDP to 5.6%
of GDP). On account of lower than expected CIT revenue
execution, in mid-2010 the budget act was revised, which
anticipated, among others, spending cuts on wages in
the public sector, subsidies and capital expenditure.
In 2011 consolidation measures are continued.
Indexation was reduced both of wages in the public
sector (some fringe benefits were cancelled) and of social
and pension benefits.64 Later in 2011 a review of budget
expenditure will be performed. Despite above mentioned
adjustments, general government deficit in Slovenia is
estimated at the level close to that registered in 2010
(5.5% of GDP), as a consequence of a one-off
recapitalization by state of one of the commercial banks65
(ca. 0.7% of GDP) and subsidies to the state railways
(0.3% of GDP).
64 It took into consideration only ¼ of CPI. 65 Nova Ljubljanska Banka d.d. At the end of June 2011, the bank addressed the shareholders asking for another recapitalization.
The Slovene government targets the general government
deficit at 3.9% of GDP in 2012 and in the subsequent
years it is supposed to decrease at the pace of ca. 1% of
GDP annually. Fiscal adjustment will solely base on the
expenditure side. The government is planning no
increase in the ratio of tax revenue to GDP in fear of its
negative impact on economic growth. The adopted
changes will concern only shift in tax burdens from
income to consumption. In 2012 freezing of wages and
streamlining of public sector employment are expected
(redundancies will affect ca.1% of employees in 2011-
2012), as well as no indexation of pensions and disability
benefits, and in subsequent years their indexation
mechanism will be revised. Changes will also affect the
public procurement. Social benefits will be reduced. The
improvement of fiscal situation will also result from lower
investment expenditure. In the opinion of the EC
Slovenian macroeconomic assumptions for 2013-2014
are too optimistic, and the achievement of fiscal targets
in the subsequent two years will depend on the
implementation of planned measures, which may be
impeded by lack of social support (which led to rejection
of the pension reform in the referendum and withdrawal
of changes reducing preferences for working students by
the government).
Slovenia belongs to a group of countries, in which a long-
term stability of public finances is significantly burdened
by the population aging, and, what is more, where the
age of retirement is one of the lowest among the EU
member states. A pension reform tabled in December
2010 sought to improve the long-term sustainability of
the pension scheme. It assumed a gradual raise of the
retirement age and modification of the indexation
mechanism.66 The Slovene Constitutional Court following
the motion submitted by trade unions ruled that the
pension reform should be voted in a referendum. At the
beginning of June 2011 the changes proposed therein
were rejected. The government declared adoption of
additional consolidation measures,67 yet according to the
law, no initiative concerning changes in pension scheme
can be put forward within a year after referendum.
The Slovenian parliament debates on the new Act on
Public Finances, which is supposed to strengthen the
position of the fiscal council and multi-year budgetary
66 The retirement age may be raised gradually in 2021-2025 to 65 years for women (from 61 years) and men (from 63 years), with the possibility of earlier retirement in the case of a long insurance record (ca. 40 years). Until 2015 the indexation ratio will be based in 60% on the average growth of wages in the national economy and in 40% on the CPI. Since then these figures will be 70% and 30%. The insurance period which will be taken into consideration in the calculation of benefits is going to be gradually prolonged from 18 to 27 years. According to the IMF assessment of the Slovene pension reform it is not sufficient to safeguard public finance stability in the long run. The changes postulated by the organization apply among others to the further reduction of the replacement rate (including a larger reduction of the early retirement benefits) and linking the retirement age with expected life span. 67 The level of state budget expenditure is to be reduced by 4.5%. Slovenian Prime Minister announced that he will dismiss his government, should the the budget not be revised.

Analysis of economic situation in the countries of Central and Eastern Europe – Slovenia
National Bank of Poland – July 2011 55
framework. The act will include fiscal rules limiting the
level of budgetary expenditure, public debt (45% of
GDP), guarantees (13% of GDP) and indebtedness of
local government. Moreover social insurance and health
care funds will not be allowed to incur liabilities.
Slovenian public debt is to amount to 43.4% of GDP at
the end of 2011 against 38.0% of GDP in 2010. In the
following years, as a result of a decrease in fiscal deficit
and improvement of economic situation it is supposed to
decelerate. In 2014, the general government debt is
anticipated to stand at approx. 46% of GDP.
Forecasts
According to European Commission (EC), Slovenia will be
one of the slowest developing economies in the region.
Probably only in 2013 will the real GDP reach the level
from before the crisis. In April, the Bank of Slovenia (BS)
raised the significance of the of external factors impact
on economic growth, while it lowered its forecast on
domestic demand, as compared with the previous
forecast (of October 2010).
Recovery in Slovenia will be going on very slowly.
According to BS, in 2011 the GDP will increase by 1.8%.
In 2011 external demand will remain the main factor of
economic growth. Domestic demand will increase merely
by 0.6% – primarily as a result of increase in households
expenditure, while public consumption and investment
will decrease. The increase in private consumption will be
driven by increase in wages (in the private sector by
4.5%). On the other hand, the collective bargain
between the government and the largest trade unions
from the public sector limits the increase in wages in the
public administration in 2011 and 2012.
In 2011 the decrease in unemployment is likely to
persist. The expected scale of economic activity growth
in 2011 will be, however, too small to reverse negative
trends on the labour market. The rate of unemployment
is expected to reach the highest level in mid-2011.
Decrease in unemployment in the consecutive two years
will, however, be very slow.
Gross fixed capital formation will probably further
decrease in 2011, brought down to a large extent by a
drop in construction investments (on account of a large
number of unsold dwellings). On the other hand, a slight
increase is expected in investment in machinery and
equipment, particularly in export-oriented enterprises,
where production capacity markedly increased. A slow
growth in investment is expected only starting from
2012. It will be dependent on the sustainability of the
improvement in financing conditions and earnings of
enterprises.
Fiscal consolidation in 2011 will have a dampening
impact on public consumption and investment. Its spread
in time (according to government decision) will make the
increase in expenditure in the coming two years very
low.
In the current year, 2/3 of economic growth will be due
to a continued improvement of foreign trade balance.
This will be, however, attributable not to a large increase
in exports but to a still low increase in imports.
A slight increase is anticipated in the current account
deficit. In 2011, the slight increase in deficit (from 1.1%
of GDP in 2010 to 1.6% in 2011) will be primarily
attributable to the deterioration of the terms of trade on
account of increase in commodity prices) and steepening
of the income deficit. A more rapid increase in the
volume of exports of goods and services in comparison to
imports will be conducive to the opposite direction.
However, in subsequent years a decrease in the current
account deficit is expected in relation to GDP. The growth
in exports in the whole projection horizon (i.e. till 2013)
will be higher than the growth in imports.
Inflation may rise to 2.7% in 2011 (on account of food
and energy prices). Weak domestic demand, in particular
a still unfavourable situation on the labour market,
moderates inflationary pressure. As a result, also in 2011
core inflation may be negative. Anticipated recovery
should be conducive to growth in core inflation in
subsequent years. On the other hand, the impact on the
inflation of food and energy prices will decrease. As a
result, the HICP index in 2013 may decrease to 1.9%.
Table 10.4 Forecasts of main macroeconomic indicators
BS EC OECD IMF
06.2011 (12.2010)
05.2011 (11.2010)
05.2011 (11.2010)
04.2011 (10.2010)
GDP, in %, y/y
2011 1,8 (1,9) 1,9 (1,9) 1,8 (2,0) 2,0 (2,4)
2012 2,7 (2,9) 2,5 (2,6) 2,6 (2,7) 2,4 (3,0)
2013 3,1 2,5 (3,2)
Inflation, in %, y/y
2011 2,7 (2,1) 2,6 (2,0) 2,5 (1,9) 2,2 (2,3)
2012 2,3 (2,0) 2,1 (2,2) 2,2 (2,2) 3,1 (2,5)
2013 1,9 2,3 (2,7)
Current account balance, in % of GDP
2011 -1,6 (-1,7) -1,4 (-0,6) -1,3 (-3,9) -2,0 (-0,7)
2012 -1,1 (-2,3) -1,9 (-0,8) -1,3 (-4,5) -2,1 (-0,9)
2013 -0,9 -2,1 (-0,8)
BS - Price Stability Report, Banka Slovenije.

Analysis of economic situation in the countries of Central and Eastern Europe – Slovenia
National Bank of Poland – July 2011 56
Contribution to GDP growth (in pp, y/y)
HICP and its components (in %, y/y)
Retail sales (in %, y/y) and consumer sentiment index
Industrial production (in %, y/y) and business sentiment index
Current account and its components (in % of GDP, 4-quarter moving
average)
Financial account balance and its components (in % of GDP, 4-quarter moving average)
Unemployment rate (%) and employment growth rate (in %, y/y)
General government debt and deficit (in % of GDP)
Source: Eurostat, CSOs

Analysis of economic situation in the countries of Central and Eastern Europe – Hungary
National Bank of Poland – July 2011 57
HUNGARY
Economic growth
Hungarian economy in 2010 started the process of
recovery following the crisis of 2008-2009. GDP in
quarterly terms increased in each consecutive quarter,
and in the whole 2010 was higher by 1.2% than in the
previous year. This trend persisted also in 2011 Q1. The
main force driving the Hungarian economy in 2010 and
2011 Q1 was exports. Strong demand from the main
trade partners, coupled with persisting declines in
consumption and investment meant that net exports was
the main contributor to GDP growth in 2010. Change in
inventories also had a positive contribution to the GDP
growth rate.
Table 11.1 GDP and its components (in % y/y)
2009 2010 Q3 2010 Q4 2010 Q1 2011
GDP -6.3 1.2 2.3 2.6 2.2
Private consumption -7.6 -2.1 0.1 -0.3 -0.9
Public consumption -1.1 -1.7 -0.7 -3.6
Fixed capital formation -6.5 -5.6 -4.5 -5.5 -3.7
Exports -9.1 14.1 14.0 12.0 14.1
Imports -15.4 12.0 13.0 10.4 14.2
source: Eurostat
Private consumption in Hungary in 2010, for the third
consecutive year, continued a decreasing trend. It
recovered slightly only in 2010 Q3, since direct taxes
grew in 2010, and in effect disposable income fell. At the
end of 2010 consumer demand in Hungary weakened
again. Rising inflation, cancellation of annual bonuses in
enterprises and the appreciation of the Swiss franc,
which affected the growth in the instalments of the
majority of mortgage loans dampened the growth in
households consumer expenditure in 2010 Q4 and 2011
Q1. In the case of public consumption decreases were
bigger and lasted for the whole year long.
Gross fixed capital formation in Hungary in 2010 trended
further down, in spite of a very low base in 2009. The
majority of investment projects planned for 2010 was
halted during the year. In the context of a hindered
access to banking loans, enterprises attempted to
increase the already existing production capacity rather
than expanding it. Only in the manufacturing enterprises,
there was a visible increase in investment outlays, which
was primarily due to new investment in the automotive
sector68. Investment outlays dropped again in 2011 Q1.
At beginning of 2010 in Hungary a process of inventories
rebuilding, following the period of their utilization in
2008-2009 started. This involved primarily inventories in
industry. It seems however, that the process of inventory
rebuilding in Hungary is undergoing a deceleration, as
68 Investment in the Hankook and Mercedes plants.
manifested in their smaller share in GDP growth in 2011
Q1.
Weak domestic demand resulted also from stagnation on
the loan market. Admittedly in the first half of 2010 the
market recovered, but already in the second half of that
year and in 2011 Q1, the value of loans granted, both for
enterprises and households decreased again. Changes
introduced in May 2011, concerning the payment of loans
denominated in foreign currency should not contribute
significantly to an increase in lending in Hungary, but
they may lead to a temporary deburdening of household
budgets and as a result foster domestic demand in the
coming quarters.
The contribution of net exports to GDP growth in 2010 in
Hungary amounted to 3.8 pp., i.e. the most among the
main categories of national accounts. The high
contribution of foreign trade is primarily attributable to
rapidly growing external demand, both from Western
European, CEE countries and emerging markets. In the
result exports grew by 14% last year. Imports in 2010
rose slightly slower (12%), which was the result of weak
domestic demand. In 2011 Q1, export still rose rapidly
but the pace of imports growth markedly increased,
which resulted in the decrease in the net export
contribution to the GDP growth in Hungary, although it
remained positive.
The value of retail sales in Hungary in 2010 practically
levelled off, which reflected the weakness of consumer
demand in this period. In 2011 Q1 turnover in retail trade
remained at a low level, similar to the one observed in
2010.
Increase in consumer sentiment, which was visible in the
1st half of 2010 was halted in the second half of 2010.
These decreases were also continued in the first five
months of 2011. Increase in inflation and appreciation of
the Swiss franc brought about a drop in real disposable
income of households, which in turn brought a worse
assessment of their present and future financial situation.
The volume of industrial output in Hungary, similarly as
in other countries of the region markedly rose in 2010,
which was attributable primarily to a strong foreign
demand. The greatest increase was posted in the
production of machinery and equipment as well as
computers and electronics. In 2011 Q1 industrial output
increased further, fuelled by rapidly increasing production
in the automotive sector.
A large number of orders, both domestic and foreign
ones, as well as rapidly increasing volume of production
brought about a significant rise in business confidence
indicators. This development took place in 2010 and in
the first four months of 2011. In turn, in May 2011 the
indices of business confidence published by the European
Commission showed a marked drop in the number of

Analysis of economic situation in the countries of Central and Eastern Europe – Hungary
National Bank of Poland – July 2011 58
new orders, which also translated into a deterioration of
the entrepreneurs optimism.
Labour market
Situation on the Hungarian labour market in 2010 and in
the first months of 2011 showed no signs of significant
improvement. The harmonized unemployment rate in
Hungary in 2010 rose slightly in comparison with the
previous year. In December 2010 it amounted to 11.3%
against 10.9% in December 2009. January 2011 saw its
abrupt rise to 12.1%. In subsequent months a slight
decline could be seen (to 11.6% in April).
Employment statistics in Hungary indicate, however, a
recovery on the labour market in the second half of
2010, as the number of employed in the economy started
to increase in annual terms. Employment increased the
most rapidly in the sector of services (particularly in the
sector of financial intermediation and real estate
services). Its growth also took place in industry. This
development resulted from improving conditions in these
sectors in 2010. In 2010, employment rose also in the
public sector. This followed from the public employment
programme. At the end of 2010, budgetary funds
earmarked for this plan were significantly reduced and
already in 2011 Q1 the number of employees in the
public sector was nearly 5% lower than in 2010 Q1. This
affected also the decline in employment growth, even
though the number of employees in the enterprise
sector, particularly in the manufacturing sector, still
increased. In turn, agriculture and construction, both in
2010 and in 2011 Q1, experienced a steady decline in the
number of employees.
Inflation and labour costs
Rapid growth in food and energy commodity prices on
the global markets since the second half of 2010 also
translated into rising inflation in Hungary. It is the food
and energy prices which constituted the main reason
behind the increase in inflation in this period. From July
2010 until April 2011, the annual HICP growth increased
from 3.6% to 4.4%. In May 2011 inflation in Hungary
declined to 3.9% as a result of a drop in energy prices
and a significant slowdown in the pace of food price
growth.
Core inflation (excluding energy, food, alcoholic
beverages and tobacco product prices) since July 2010 (a
drop in core inflation as a result of waning of the base
effect related to the increase in indirect taxes in mid-
2009) to May 2011 remained at a relatively low level
(1.1-1.6%) although in March and April 2011, a slight
increase could be seen. A low level of core inflation is a
result of a continuously low inflationary pressure related
to the prevailing stagnation on the labour market. Until
now, there were no contagion effects from high prices of
food and fuels, or costs of temporary sectorial taxes
(imposed in January 2011 on banks, telecommunication
operators and retail trade networks) onto the prices of
other goods and services.
Table 11.2
HICP and its components (in %, y/y)
Q2
2010
Q3
2010
Q4
2010
Q1
2011
May-
11
HICP 5.2 3.6 4.3 4.3 3.9
Contribution to HICP growth rate (in pp)
Food and beverages -0.1 0.7 1.3 1.7 2.0
Transport 2.0 1.2 1.3 1.1 0.9
Housing 1.1 0.7 0.8 0.9 0.5
Restaurants and hotels -0.1 -0.1 0.0 0.1 0.2
Health 0.3 0.2 0.1 0.1 0.1
source: Eurostat
The average wage in Hungary increased slightly in 2010
(by 2.6% in comparison with 2009). The increase in the
annual growth of wages took place only in the first half
of 2010. In the second half of 2010 nominal wages
already declined in annual terms, which was primarily
attributable to their drop in the public sector (among
others due to a lower remuneration of temporary
employees, many of them working part-time).
Cancellation of annual bonuses in enterprises, particularly
in enterprises burdened with new taxes and public sector
institutions, was an additional factor lowering the growth
of wages at the end of 2010.
Increase in nominal wages in the first half of 2010 was
the main reason for the increase of unit labour costs in
this period. However, following the deceleration in their
growth, and as a result of a marked acceleration of
annual pace of economic growth, a renewed decline
could be observed in the second half of 2010.
Balance of payments
The current account surplus which materialized in 2009
(0.4% of GDP) in 2010 increased further and amounted
to 2.1% of GDP. It resulted from increased positive
balance in goods and services. The current transfers
balance did not change in comparison with 2009, while
the deficit in income increased slightly.
Table 11.3 Balance of payments, net balance (in % of GDP, 4q moving
average)
Q4 2009 Q1 2010 Q2 2010 Q3 2010 Q4 2010
Current account 0.4 1.5 1.9 1.9 2.1
Goods 3.6 4.4 4.5 4.6 4.7
Services 1.4 2.0 2.2 2.3 2.4
Income -5.1 -5.2 -5.3 -5.4 -5.5
Current transfers 0.4 0.4 0.5 0.4 0.4
Capital account 1.2 1.4 1.4 1.5 1.3
Financial account 4.9 3.0 5.2 0.9 1.3
FDIs -0.5 -1.4 -0.4 0.2 0.6
Portfolio investments -2.9 2.9 2.7 -1.3 0.6
Other investments 8.2 1.6 2.9 2.0 0.1
source: Eurostat
Surplus in goods and services in 2010 exceeded 7% of
GDP. The trade in goods in 2010 posted a big increase
both in exports and in imports (respectively by 25% and
23% y/y). In the case of exports and imports, the
increase in foreign trade was to the largest extent
affected by trade in products of the manufacturing. In
turn, the increase in the services account is primarily
attributable to the increase in net income from tourism,

Analysis of economic situation in the countries of Central and Eastern Europe – Hungary
National Bank of Poland – July 2011 59
financial services and licence fees. Increased deficit in
income is, in turn, the result of a higher outflow of
earnings from foreign investments in Hungary, mainly
direct investments due to the improvement of foreign-
owned companies financial condition, despite the
sectorial taxes introduced in 2010.
The year 2010 saw further foreign capital inflow to
Hungary. Its scale, however, diminished significantly as
compared to the levels from 2009. It was attributable
primarily to the withholding of subsequent tranches of
financial aid, granted to Hungary in 2008 by the
International Monetary Fund, the World Bank, the
European Commission and governments of some EU
member states. The decision to stop granting subsequent
tranches of aid was caused by termination of
negotiations with the IMF by the Hungarian government,
which did not want to agree to further cuts in budget
expenditure, taking into account the already difficult
economic situation of the country.69 This was reflected in
the decline in other investment surplus. Meanwhile, both
direct and portfolio investments flowed into Hungary in
2010 in larger amount than a year before, when a net
outflow was posted in both these categories.
Interest rates and exchange rate
Following a period of record low interest rates in Hungary
(5.25% in the period April-November 2010) the National
Bank of Hungary (MNB) decided to raise them at the turn
of 2010 and 2011. In November and December 2010 and
in January 2011 the main interest rate was raised by 25
bps each time, to the level of 6%, at which it remained
till June 2011. The tightening of monetary policy in
Hungary was due mainly to supply shock on food and
energy commodities markets, which brought a rapid
increase in inflation in Hungary in the second half of
2010.
The changes in the National Bank of Hungary interest
rates were also the main indicator of changes in the level
of interest rates on interbank market. The three-month
Bubor in November 2010-June 2011 increased from 5.4
to 6.1%. During all this period it was slightly higher (by
0.1-0.2 pp.) than the main interest rate.
The development of the exchange rate of the Hungarian
forint and the yields on treasury bonds in 2010 and 2011
were affected by both external factors – in particular the
69 The new Hungarian government, elected in July 2010, decided not to continue negotiations concerning the prolongation of financial aid from international institutions under the leadership of the IMF. The main reason for terminating these negotiations were discrepant positions concerning the manner of reducing the public finance sector deficit. According to the IMF, the temporary adjustments on the income side, proposed by Hungary, did not ensure stabilisation of the deficit at a low level, whereas the Hungarian government did not want to agree to further cuts in public expenditure. Stabilisation in the financial markets was another factor which enabled Hungary to resign from the help of financial institutions, as it allowed a renewed financing of expenditure with issue of bonds after a period of crisis.
situation in the euro area – and the situation in the
domestic economy. In the second half of 2010 there was
a visible weakening of the forint against the euro, as well
as an increase in the yields on Hungarian bonds. This
was due, on the one hand, to a new wave of information
on debt crises in peripheral countries of the euro area,
which increased investors' risk aversion. This is when the
flight of foreign investors from European markets,
including CEE country markets, took place into assets
denominated in USD. In mid-2010 Hungary broke
negotiations concerning prolongation of financial aid from
the IMF, which additionally decreased investors'
confidence with respect to this country. The proposed
and implemented own measures adopted in the second
half of 2010, aimed at limiting general government deficit
(primarily the nationalization of open pension funds and
temporary taxes imposed on the financial, energy,
telecommunication and retail trade sectors) were
unfavourably received by financial institutions and rating
agencies. It resulted in the ratings of long-term
Hungarian debt downgrade (Fitch and Moody's agencies)
at the beginning of December 2010 and was another
factor in the increase of foreign investors' aversion
towards Hungarian financial markets at the end of 2010.
The situation started to change in 2011 when the forint
began to strengthen vis-a-vis the main world currencies.
The first of the factors, which affected such a
development of the forint exchange rate, was a growing
difference in the level of interest rates between Hungary
and the euro area or the United States, resulting from
the tightening of the monetary policy by the National
Bank of Hungary. In April 2011, a new plan of structural
reforms was announced in Hungary, which included a
long-term strategy of public finance consolidation. This
time it did not focus solely on the temporary increase on
the revenue side, as it took place in 2010. This plan was
received by financial institutions and investors as "a step
in the good direction", which was an additional impulse
for the strengthening of the forint and a decrease in the
yields on Hungarian bonds in 2011 Q2.
Fiscal policy
In order to maintain the general government deficit in
2010 at the level agreed with international organizations
(3.8% of GDP against 4.5% of GDP in 2009), the
Hungarian government adopted temporary measures
increasing the budgetary revenue (suspension of
contribution transferred to the second pillar of the
pension scheme, introduction of special taxes – among
others imposed on the financial sector70), coupled with
simultaneous strict expenditure discipline. Nevertheless
the registered fiscal deficit in 2010 was higher then
assumed – 4.2% of GDP. This was, among others, the
related to worse than planned local government units
balance (by 0.2 % of GDP) and lower revenues from the
PIT and social insurance contributions, as a result of i.a.
70 They were imposed also on enterprises from the energy and telecommunications sectors as well as retail chains. Budgetrevenue due to this are estimated at ca. 0.6% of GDP in annual terms.

Analysis of economic situation in the countries of Central and Eastern Europe – Hungary
National Bank of Poland – July 2011 60
the shift of bonuses and premiums owing to the decrease
of the PIT rate, entering into force from 2011 (ca. 0.2 %
of GDP).
In 2011, Hungary, besides Sweden, will be the only
European Union country to record general government
surplus (2% of GDP, the European Commission forecast
– 1.6% of GDP). It will be generated as a result of a one-
off revenue related to the transfer of assets of individuals
returning from the private pension funds into the state
PAYG pension scheme71 (almost 10% of GDP). This
measure will allow to offset the negative impact on fiscal
balance of changes in the tax system72 (1.9% of GDP),
assumption of state enterprises debt (railway and public
transport company of Budapest – ca. 1.3% of GDP) and
the buyout of investments projects carried out in the
formula of public-private partnership73 (ca. 0.7% of
GDP). Excluding the assets transfer from private pension
funds, the budget deficit would have amounted to 8% of
GDP, the largest figure since 2006. Adjustments
introduced since 2011 include also the nominal freeze of
social transfers (family allowances, social assistance
benefits) and the reduction in their indexation rate.
Moreover, at the beginning of the year, the government
adopted a decision to block a part of ministries'
appropriations (stability reserve, ca. 0.9% of GDP). At
the end of May, Hungarian government concluded an
agreement with the Banks' Association with respect to
the assistance programme for persons repaying
mortgage loans denominated in Swiss francs. The cost to
the general government is estimated at approx. 0.05% of
GDP per year.
In the Széll Kálmán Plan(SKP) announced in March 2011,
and elaborated in the National Reform Programme
(NRP), the Hungarian government presented a wide
range of measures aiming at deficit and public debt
reduction. In contrast to the changes adopted in 2010,
the NRP focuses mainly (in ¾) on the expenditure side.
Proposals mainly involve cuts in social transfers74 and
71 As a result of changes introduced at the end of 2010, almost 97% of private pension fund members (more than 3 m persons) decided to opt-out. The decision was supposed to be made till the end of January 2011 (in some cases – until the end of February 2011). Continued participation in the funded pension scheme involves loss of entitlement to state pension and state’s guarantee for payment of future benefits from the second pillar, while the social insurance contributions would be still collected in full amount. The returning to the PAYG scheme enabled the insured to receive the yield earned by pension funds and in the case of negative rate of return, the state will adjust the balance on the insured person’s notional account in the first pillar. 72 The introduction of a flat PIT rate (16%) instead of the previous rates of 17% and 32% coupled with the increase in the tax allowance for raising a child, the reduced CIT rate for small taxpayers (10% against 19%, measure introduced in mid-2010). 73 The decision to continue or phase out particular projects (there were ca. 100 projects under implementation) is to be taken up in June 2011. According to the statement by the Hungarian minister of national development, termination of PPP contracts are supposed to generate savings in the long run at the level of ca. HUF 400 bn (i.e. ca. 1.4% of GDP in terms of 2011). 74 The formulae for the calculation of benefits are to be revised, early pensions phased out and the qualification conditions to
current expenditure75. On the revenue side, contrary to
earlier announcements, the special tax imposed on
financial institutions is going to be retained after 2012.
Moreover there will be no reduction of the CIT rate from
from 19% to 10% as planned of 2013. Assets transferred
by private pension funds76 will be earmarked for the
newly created Pension Reform and Public Debt Reduction
Fund. The fund will be also financed by a special tax paid
by financial institutions as well as by revenue from
electronic toll (effective from 2013). Funds can be
disbursed only to reduce public debt.
The magnitude of measures envisaged in the NRP is
estimated at ca. 2-3% of GDP yearly. As a result, the
fiscal deficit in Hungary in 2012-2014 is going to be kept
below reference value, and allows for its decrease from
82% of GDP in 2010 to ca. 66% in 2014. The
achievement of the above-mentioned targets will require
the implementation of actions in accordance with the
timetable adopted by the government. The IMF and the
EC forecast that the reduction in fiscal imbalance in
Hungary below 3% of GDP in subsequent years will
require additional consolidation measures.
In April 2011 a new Hungarian Constitution was adopted,
envisaging changes within the institutional framework of
public finances. It stipulated the public debt rule (cap set
at 50% of GDP77), strengthened control mechanisms
(among others, the possibility of vetoing the budget act
by the fiscal council) and sanctioned suspension of
referring amendments in the tax law and social insurance
system to the Constitutional Tribunal, in the case of
public debt exceeding 50% of GDP. The government
proposals require adoption of relevant subordinate
legislation determining in a detailed way the procedure
for reducing public debt in accordance with the enacted
fiscal rule. At the beginning of 2011, Hungarian Prime
Minister informed about the possibility of introducing a
statutory provision, which would restrict the possibility of
amending the provisions in the scope of tax law, social
insurance system and budgetary law (they would require
the support of at least ⅔ of deputies).
disability benefits tightened (followed by an overhaul of granted benefits). Changes are also going to include prescription drug subsidies as well as higher education financing. The government is planning to centralize public purchases and tasks fulfilled by local government units. The decrease in budget expenditure in the coming years is also going to be brought about by the restructuring of public transport (creation of the National Transport Holding Company) and reduction of tariff preferences. 75 Among others, 5% reduction of employment in administration, no filling in of vacant posts, freezing of expenditure on the purchase of goods and services at the level of 2011. 76 In the case of enterprises, whose tax base exceeded in the given tax year the amount of HUF 500 m. The rate for small taxpayers since mid-2010 is 10%. 77 Transfer is going to begin in June 2011. The value of transferred assets, is estimated at ca. 10% of GDP, out of which ca. 4.7% of GDP come in the form of Hungarian securities. In 2010, a part of that revenue (ca. 1.9% of GDP) is going to be assigned to cover the expenses of the Hungarian social insurance fund, not on the reduction of public debt.

Analysis of economic situation in the countries of Central and Eastern Europe – Hungary
National Bank of Poland – July 2011 61
Forecasts
As shown by the MNB forecasts published in June 2011,
the pace of economic growth in 2011-2012 will be below
3% y/y, i.e. definitely lower than expected at the end of
2010. Expectations for 2011 and 2012 include a
persisting high external demand, with the demand on the
part of euro area countries being gradually replaced by a
strong demand from countries outside Europe, in
particular from Asian ones. This will allow to maintain
high exports growth, leading to a renewed positive
contribution of net exports to GDP growth in this period.
At the same time the MNB expects an increase in
domestic demand, primarily private consumption and
fixed capital formation. Increase in private consumption
is going to take place already in 2011, however it is
going to be relatively slow. Stagnation on the labour
market is going to be the driving force behind this
development, as well as plans of further fiscal
consolidation (SKP). According to the NBH, measures
adopted by the Hungarian government, which took place
at the beginning of 2011 (lower income taxes, pay-out of
interest from nationalized pension fund assets) will
contribute rather to the increase in household savings
than to increase in their consumption. In 2012
employment in Hungary will continue to rise slowly. An
increase in average wage is also anticipated, particularly
in the private sector. On the other hand, while the plan
of restructuring foreign currency loans should not affect
significantly the increase in lending, it should still be
conducive to the reduction of the burden of households
and thus indirectly improve their financial situation. This
may favourably affect consumption in the next year. In
turn, the NBH expects a decrease in public consumption
in the coming two years, which is going to be the
consequence of the newly adopted savings plan. In the
case of fixed investment, the NBH counts on a successful
ending of investment projects in the automotive sector,
which would have an upside effect on investment outlays
in the economy, though only as of 2012.
The inflation forecast of the NBH assumes its gradual
decrease in 2011 and 2012 to the level below the NBH
inflation target (3%) at the end of 2012. The contribution
of food and energy prices to inflation should decrease
with each consecutive quarter. The expected increase in
private consumption should not have big impact on
inflation growth, however, contrary to energy and food
prices, core inflation in 2011 and 2012 will not decrease
and will be running at the level observed in 2011 Q1.
Expected persistence of a strong external demand and no
visible recovery of domestic demand will be conducive to
the persistence of current account surplus observed in
Hungary since 2009, or even its slight increase in the
subsequent quarters of 2011 and 2012.
Table 10.4 Forecasts of main macroeconomic indicators
MNB EC OECD IMF
06.2011 (11.2010)
05.2011 (11.2010)
05.2011 (11.2010)
04.2011 (10.2010)
GDP, in %, y/y
2011 2,6 (3,1) 2,7 (2,8) 2,7 (2,5) 2,8 (2,0)
2012 2,7 (4,0) 2,6 (3,2) 3,1 (3,1) 2,8 (3,0)
2013 2,8 (3,0)
Inflation, in %, y/y
2011 3,9 (4,0) 4,0 (3,9) 4,0 (2,9) 4,1 (3,3)
2012 3,6 (3,3) 3,5 (3,7) 3,3 (3,1) 3,5 (3,0)
2013 3,0 (3,0)
Current account balance, in % of GDP
2011 1,9 1,6 (0,4) 2,7 (-1,1) 1,5 (0,7)
2012 3,2 1,9(-0,4) 1,8 (-1,3) 0,9 (-0,7)
2013 -0,8 (-0,9)
MNB – Report on Inflation, National Bank of Hungary

Analysis of economic situation in the countries of Central and Eastern Europe – Hungary
National Bank of Poland – July 2011 62
Contribution to GDP growth (in pp, y/y)
HICP and its components (in %, y/y)
Retail sales (in %, y/y) and consumer sentiment index
Industrial production (in %, y/y) and business sentiment index
Current account and its components (in % of GDP, 4-quarter
moving average)
Financial account balance and its components (in % of GDP, 4-quarter moving average)
Unemployment rate (%) and employment growth rate (in %,
y/y)
General government debt and deficit (in % of GDP)
Source: Eurostat, CSOs

Analysis of economic situation in the countries of Central and Eastern Europe – Széll Kálmán Plan
National Bank of Poland – July 2011 63
Annex 1
Széll Kálmán Plan
At the beginning of March 2011, the Hungarian government presented the Széll Kálmán Plan78 (SKP)79 constituting a wide range of measures to consolidate public finances. Contrary to changes
implemented in 2010, improvement of the fiscal balance is going to be primarily the effect of a permanent reduction of expenditure (see table on the next page).
The magnitude of measures assumed in the SKP is estimated at ca. 2-3% of GDP per year (see chart
below). As a result, the fiscal deficit in 2012-2014 is going to remain below the reference value and the public debt is going to be reduced from 82% of GDP in 2010 to ca. 66% in 2014 (see chart
below). The IMF and the EC forecast that it will require additional consolidation measures in subsequent years. The EC estimates the impact of the KSP on deficit reduction at ca. 1-2% of GDP.
The government plan provides, among others, for the following:
cuts in social transfers,
modification of prescription drug subsidy system,
change in higher education financing (reduction of available places at full-time studies
by half),
restructuring of public transport enterprises (creation of the National Transport
Holding Company, reduction of tariff preferences),
rationalization of tasks performed by government administration and particular units
of local government.
Measures referring to social transfers aim at rise in the labour market participation rate by eliminating
disincentives to work. The formulae for the calculation of benefits are to be revised, early pensions
and special pension scheme for uniformed services phased out and the qualification conditions to disability benefits tightened (followed by an overhaul of granted benefits).The total amount of family
allowances and social benefits received by an individual will be capped at a level lower than minimum wage. The family allowances will remain frozen. The period for receiving unemployment benefits is
going to be shortened, while share of EU funds in financing of active labour market policy will
increase.
On the revenue side electronic toll is going to be introduced since 2013. Contrary to earlier announcements, the special tax imposed on financial institutions will be retained, though initially it
was going to remain in force till 2012. Moreover, the Hungarian government withdrew from the
reduction of the CIT tax from 19% to 10%80 since 2013. These revenue are going to be earmarked
78 As this threshold is breached, regulations provide for the enactment of Budget Act assuming reduction of the public debt. 79 Széll Kálmán was Hungary's Prime Minister in 1899-1903, his government introduced a tax and financial system reform. 80 Subsequently elaborated in detail in the National Reform Plan (of mid-April 2011).
Source: Hungarian Ministry of National Economy
Source: Hungarian Ministry of National Economy

Analysis of economic situation in the countries of Central and Eastern Europe – Széll Kálmán Plan
National Bank of Poland – July 2011 64
for newly created Pension Reform and Public Debt Reduction Fund. The fund is also going to receive
assets transferred by private pension funds.81
Hungarian authorities are also going to reduce administrative burden (by 25%), mainly with respect of
tax law and requirements of financial and statistical reporting as well as improved transparency of the functioning of regulatory bodies.
The achievement of objectives stipulated in the SKP will require the implementation of measures in
accordance with the timetable adopted by the government. The majority of bills are going to be prepared by 1 July 2011 and not later than in September 2011 they are going to be enacted. Longer
deadlines (end of 2011) are envisaged for changes in the pension scheme and railways restructuring. In total the government is planning to amend 42 acts and 18 government and ministerial decrees.
Table. Hungarian fiscal adjustment measures adopted in 2010 and assumed in the Széll Kálmán Plan
Measure 2010
2011
2012
2013
2014
Comment / Short description
% of GDP
MEASURES ADOPTED IN 2010
Tax imposed on financial institutions
0.7 0.6 0.6 0.3 0.3 2013-2014 replaced by bank tax harmonised within the EU (part of revenues will be directed from 2012 to the Pension Reform and Public Debt Reduction Fund, see below). It is applicable also to insurance and leasing companies
Crisis tax 0.6 0.6 0.5 Imposed on taxpayers from energy, telecommunications sector and retail chains
Suspension of the social contribution transfer to private pension funds
0.2 1.3 1.1 1.1 1.0 In force since November 2010 till December 2011;Estimates for 2012-2014 assume effects of 97% private pension funds members returning to the state pension scheme
Financing budgetary deficit by assets transferred form the funded pension scheme
1.8 Solely in 2010, a part of assets transferred by the private pension funds (ca. 1.9% of GDP out of ca. 10% of GDP) is going to be assigned to cover the expenses of the Hungarian social insurance fund, not on the reduction of public debt.
Spending cuts 0.8 0.9 blocking appropriations of particular ministries, freeze of budget reserves
TOTAL: 2.3 3.3 2.2 1.3 1.3
MEASURES ASSUMED IN THE KSP
Employment and labour market
0.01 0.6 0.7 0.6 Changes comprise of i.a.: • unemployment benefits granted for shorter period • larger share of EU funds in financing active labour market policies • the total amount of family allowances and social benefits received by an individual will be capped at a level lower than minimum wage • nominal freeze of family allowances
Pension scheme 0.04 0.3 0.4 0.4 Above all • unification of pension calculation formula• abolishment of early retirement and special pension scheme for uniformed forces • modification of pension indexation mechanism • review and overhaul of disability benefits scheme • gradual replacement of pension supplements by social benefits
Public transport 0.1 0.2 0.2 Measures include i.a.: • integration and restructuration of state railways MÁV, bus operator Volán and Public Transport Company of Budapest BKV into National Transport Holding Company • review of tariff exemptions
81 In the case of enterprises whose tax base exceeded in the given tax year the amount of HUF 500 m.

Analysis of economic situation in the countries of Central and Eastern Europe – Széll Kálmán Plan
National Bank of Poland – July 2011 65
Measure
2010
2011
2012
2013
2014
Comment / Short description
Higher education 0.0 0.1 0.1 Reduction of enrolment in state-subsidized higher education, taking into account labour force demand
Health sector 0.3 0.4 0.4 Cuts in prescription drug subsidies
Other measures 0.1 0.4 0.4 i.a.:• centralization of public procurement • ban on debt incurred by the central government units to finance current deficit, introduction of Government control on drawing loans for investments • simplifying of tax administration • rationalisation of the functioning of the central and local governments
Establishment of Pension Reform and Public Debt Reduction Fund
0.3 0.7 0.6 For debt reduction will serve revenues from electronic toll system (effective since 2013), withdrawal of CIT rate reduction (for yearly tax base >500 mil HUF) from 19% to 10%, and tax imposed on the financial institutions
TOTAL: 0.0 0.05 1.8 2.8 2.7
Source: Kálmán Széll Plan, Convergence Programme of Hungary 2011-2015

Analysis of economic situation in the countries of Central and Eastern Europe - Foreign currency loans
in Central and Eastern Europe – a Hungarian approach
National Bank of Poland – July 2011 66
Annex 2
Foreign currency loans in Central and Eastern Europe – a Hungarian approach
The real convergence process in developed countries is usually related to fast increase in lending. It was similar in CEE countries. The process of liberalization of economies, financial markets
development and inflow of foreign investment led to a rapid development of the banking sector in
these countries, and thus to an increase in loans to enterprises and households. This process accelerated even more after the accession of CEE countries to the European Union. It enabled
international financial institutions to easily and quickly enter onto Eastern European markets. Since the moment of the European Union accession, there has been a marked acceleration in the growth of
loans for private sector. In the case of the Baltic states or Romania it even exceeded 50% y/y in
2005-2008. The characteristic feature of the loan market in CEE countries was a very large share of foreign
currency loans. In 2004-2008 their share in total loans increased significantly. Since 2008, in Hungary, Romania and Lithuania they already accounted for over 60% of all granted loans, and in Estonia and
Latvia even c.a. 90%. The largest share of foreign currency loans in Baltic countries resulted, among
others, from the fixed exchange rate regime, which significantly reduced the exchange rate risk.82 Loans in foreign currencies were usually granted for housing purposes to households. In the case of
Romania and Baltic states, however, they dominated in almost all types of loans, both to households and enterprises. In the majority of countries the dominating currency of loans was the euro. Only in
Poland and Hungary it was loans in the Swiss franc turned out to be the most popular lending currency.
The share of loans in foreign currencies in total loans to the private sector in Central and Eastern
European countries which were not members of the euro area
Source: Central banks, own calculations
A big “success” of foreign currency loans in the region is related primarily to their lower price in
comparison with the domestic currency loans. Interest rates on the interbank market in the euro area
or Switzerland, and thus loan interest, were definitely lower than local ones.83 Nominal exchange rates of CEE currencies appreciation in 2004-2008 was an additional factor lowering the cost of foreign
currency loans and thus another incentive to contract this type of loans. At the same time only a minority of borrowers attempted to hedge against currency risk. The majority
of foreign currency loans, in particular granted to households, lacked security backing. Particular risk
was taken by residents from countries with a floating exchange rate regime, i.e. primarily Hungary, Poland and Romania. The outbreak of the global financial crisis in the second half of 2008 led to a
massive outflow of capital from CEE country markets, abrupt depreciation of these currencies, and an increase in the cost of loan servicing. Coupled with a worsening situation on the labour market in this
period, the cost of loan repayment was becoming an ever greater burden for households.
82 Only in 2011 is part of revenue from the sales of assets transferred by pension funds (ca. 1.9% of GDP compared with total revenue of ca. 10% of GDP) going to be assigned to cover the expenses of the social insurance fund. In subsequent years they are going to serve solely the purpose of reducing public debt. 83 The fixed exchange rate regime against the euro did not guarantee, however, full insurance against changes in currency exchange rates. In 2010, there was a serious concern about the devaluation of the currency exchange rate.

Analysis of economic situation in the countries of Central and Eastern Europe - Foreign currency loans
in Central and Eastern Europe – a Hungarian approach
National Bank of Poland – July 2011 67
The foreign currency market in Hungary
In the case of Hungary it seems that situation on the FX loans market constitutes a threat both for the
vast number of household consumption and for the financial sector stability. Foreign currency loans became very popular after 2004, when the access to them became easier and their interest rates were
markedly lower than in the case of loans granted in the domestic currency. In the case of Hungary,
the share of loans in foreign currencies increased from less than 30% in 2004 to more than 60% of total loans in 2008. This was primarily attributable to the rising popularity of foreign currency housing
loans. In 2004 nearly all long-term loans for households were granted in forint (almost 99% of total volume) and till 2010 already almost 2/3 of all loans for households granted for a period of over 1
year were was in foreign currency, primarily in Swiss franc.
The outbreak of the global financial crisis in Hungary led to a rapid and very strong depreciation of the forint. In the period from July 2008 to March 2009, the forint depreciated by 36% against the euro
and by 45% against the Swiss franc. It led to a significant increase in the cost of foreign currency loans, which primarily affected households burdened with a mortgage loan. In tandem with a
worsening situation on the labour market this led to households having ever bigger problems with loan repayment, particularly in the case of foreign currency mortgage loans. In April and May 2011
the Swiss franc exchange rate again visibly strengthened against the majority of currencies in the
world, including the forint. The CHF/HUF exchange rate in the course of less than two months weakened by almost 10%, which again increased the burden for holders of loans in this currency. In
the period from 2009 Q1 to 2011 Q1 the share of non-performing loans for households (90 or more days of delay in repayment) markedly increased from 4% to over 10%. An even larger increase took
place in the case of irregular housing loans granted in foreign currencies, whose share in total volume
increased from 2.5% to 7% in the corresponding period. Such a big increase in NPL value began to constitute a serious risk for the stability of the financial sector in Hungary.
The share of non-performing loans in Hungary (in %) i and CHF/HUF exchange rate in 2009-2011
Source: MNB
Hungarian programme of changes in the functioning of the foreign currency loan market.
Following electoral victory in parliamentary elections in April 2010, Viktor Orbán's government introduced a number of regulation aimed at protecting credit takers, in particular households indebted
in foreign currency. The 2010 saw the introduction of a ban on granting new loans in foreign currency to households, as well as a possibility of earlier loan repayment without additional fees, a possibility of
prolonging the period of loan repayment by 5 years and the limitation on foreclosures. At the end of May 2011, the Hungarian government, this time in agreement with the representatives
of the banking sector decided to put into force as of 1 July 2011 a programme of assistance to
loan takers indebted in foreign currency. This programme involved:
The establishment of a fixed exchange rate at which liabilities in foreign currencies
will be repaid, running below the market rate (180 CHF/HUF, 250 EUR/HUF. 2 JPY/HUF).
The remaining part of liabilities will be changed into a forint loan, which interest rate will be
Analysis of economic situation in the countries of Central and Eastern Europe - Foreign currency loans
in Central and Eastern Europe – a Hungarian approach
National Bank of Poland – July 2011 68
set in relation to the BUBOR interest rate and its repayment postponed till 1 January 2015.
Participation in the programme is voluntary. Applications will be admitted till the end of 2011,
and the programme itself will end in 2014.
Gradual withdrawal from the ban on foreclosures by banks as a result of failure to
repay mortgage loans. Since 1 July 2011 banks will be able to sell seized real estate, but
only those, whose value exceeds HUF 30 mn and the loan taker owes banks more than HUF
20 mn if the payment being overdue more than 90 days. Since 2011 Q4, auctions of all seized
real estate is going to be allowed. However, quota restrictions will be introduced. In 2011, a
maximum of 2% of the seized real estate will be allowed to be put to auction. This quota is
going to be raised by 1 pp. per year and reach 5% in 2014.
Creation of an institution aiming to assist debtors in particularly difficult situation
(National Asset Management Company). This assistance is going to be carried out in two
directions. First, the institution is going to assist the programme of building cheap housing for
less affluent citizens. Secondly, flats threatened by seizure are going to be taken over by this
institution and then rented to the occupants.
Partial cancelling of the ban on granting mortgage loans in foreign currency
introduced in 2010. Present regulations allow loans in euro, but they are accessible to a
very restricted pool of clients. In order to become eligible for such a loan, debtor must receive
his/her remuneration in euro and their income must exceed 15-fold the minimum national
wage.
Introduction of subsidies for debtors who decide to move into a cheaper dwelling.
The maximum period for subsidies is going to be 5 years. In the first year the maximum
interest rate of a new loan is going to amount to 3.5% and decrease by 0.5 pp. in every
subsequent year.
Despite good reception, this plan does not seem to permanently solve the problem of foreign currency loans in Hungary. It seems that risks related to the insolvency of Hungarian households have only
been postponed and will be faced again in 2015. At the same time this programme involves additional costs for the general government, which at present is particularly important, as Hungary is forced to
carry out a vast fiscal consolidation. On the other hand, economic growth and household financial
condition forecasts for Hungary indicate a marked improvement in the coming years, which suggests that the problem of FX denominated debt in 2015 may constitute a lesser risk for the financial sector
and the whole economy than it is now.

Analysis of economic situation in the countries of Central and Eastern Europe - Statistical annex
National Bank of Poland – July 2011 69
STATISTICAL ANNEX
1. National accounts
Table 1. Gross domestic product (in %, y/y) 2009 2010 2010 Q1 2010 Q2 2010 Q3 2010 Q4 2011 Q1
Poland 1.7 3.8 3.0 3.4 4.2 4.5 4.4
Czech Republic -4.1 2.3 1.2 2.9 2.3 3.0 3.1 Slovakia -4.7 4.0 4.7 4.2 3.8 3.5 3.5 Slovenia -8.2 1.0 -0.3 1.3 1.4 1.9 2.1 Hungary -6.3 1.2 0.1 1.0 1.7 1.9 2.5
Estonia -14.1 3.1 -2.6 3.1 5.0 6.6 11.1 Lithuania -14.8 -0.3 -2.0 1.0 1.2 4.8 6.9
Latvia -18.0 1.3 -6.1 -2.6 2.8 3.6 3.5
Bulgaria -5.0 0.2 -4.8 1.0 0.3 3.1 1.5 Romania -7.1 -1.3 -2.2 -0.4 -2.2 -0.6 1.7
EU-15 -4.3 1.7 0.7 2.0 2.2 2.1 2.4
Source: Eurostat, CSOs
Table 2. Private consumption (in %, y/y) 2009 2010 2010 Q1 2010 Q2 2010 Q3 2010 Q4 2011 Q1
Poland 2.3 3.2 2.2 3.2 3.4 4.0 3.9
Czech Republic -0.2 0.2 -0.4 -0.1 -0.5 0.8 -0.5 Slovakia -0.7 -0.3 -0.1 -1.4 -0.3 0.5 -0.1 Slovenia -1.4 0.7 -0.9 0.1 2.0 1.6 1.2 Hungary -7.5 -2.1 -3.7 -5.0 0.8 -0.4 -0.8
Estonia -18.5 -1.9 -7.7 -3.3 1.0 2.6 7.9 Lithuania -16.8 -0.1 -8.9 -8.2 -2.7 1.7 5.5
Latvia -24.0 -4.5 -6.2 -2.4 2.9 5.2 3.6
Bulgaria -6.3 -1.2 -4.6 1.7 -1.1 1.1 -1.5 Romania -10.5 -1.7 -4.4 -1.0 -1.1 -1.7 -1.7
Source: Eurostat, CSOs
Table 3. Gross fixed capital formation (in %, y/y) 2009 2010 2010 Q1 2010 Q2 2010 Q3 2010 Q4 2011 Q1
Poland -0.3 -2.0 -11.4 -0.4 1.5 1.6 6.0
Czech Republic -9.2 -3.1 -7.8 -4.7 -0.2 -0.1 3.7 Slovakia -10.5 3.6 -3.4 1.8 4.8 10.6 1.2 Slovenia -21.6 -7.1 -10.5 -3.8 -8.7 -5.8 -6.1 Hungary -6.5 -5.6 -4.8 -4.5 -2.6 -9.1 -1.6
Estonia -34.4 -9.2 -20.3 -17.1 -10.3 11.9 14.7 Lithuania -39.1 -19.5 -30.0 -5.5 15.0 13.9 41.0
Latvia -37.3 0.0 -44.4 -35.9 0.3 -1.8 28.4
Bulgaria -26.9 -16.5 -22.1 -21.9 -27.2 3.2 -12.4 Romania -25.3 -13.1 -28.3 -7.7 -15.5 -4.7 -2.2
EU-15 -12.2 -0.4 -4.8 -0.1 1.4 2.1 3.3
Source: Eurostat, CSOs
Table 4. Exports of goods and services (in %, y/y)
2009 2010 2010 Q1 2010 Q2 2010 Q3 2010 Q4 2011 Q1
Poland -9.1 10.2 10.1 14.9 8.7 7.0 5.9
Czech Republic -10.8 18.0 18.4 21.0 15.9 17.7 16.3 Slovakia -16.5 16.4 18.3 16.1 17.3 14.3 15.8 Slovenia -15.6 7.7 5.6 10.4 8.2 6.6 10.6 Hungary -9.1 14.1 15.5 15.8 13.9 11.7 14.4
Estonia -11.2 21.7 6.1 18.0 24.0 36.5 42.2 Lithuania -14.3 10.3 4.9 21.1 19.4 22.9 21.8
Latvia -15.5 17.4 3.8 7.5 15.5 13.8 14.7
Bulgaria -9.8 16.2 6.9 16.3 22.9 15.8 25.8 Romania -5.5 13.1 8.4 15.8 11.3 17.1 23.6
EU-15 -12.6 10.2 6.2 12.1 11.5 10.7 9.9
Source: Eurostat, CSOs
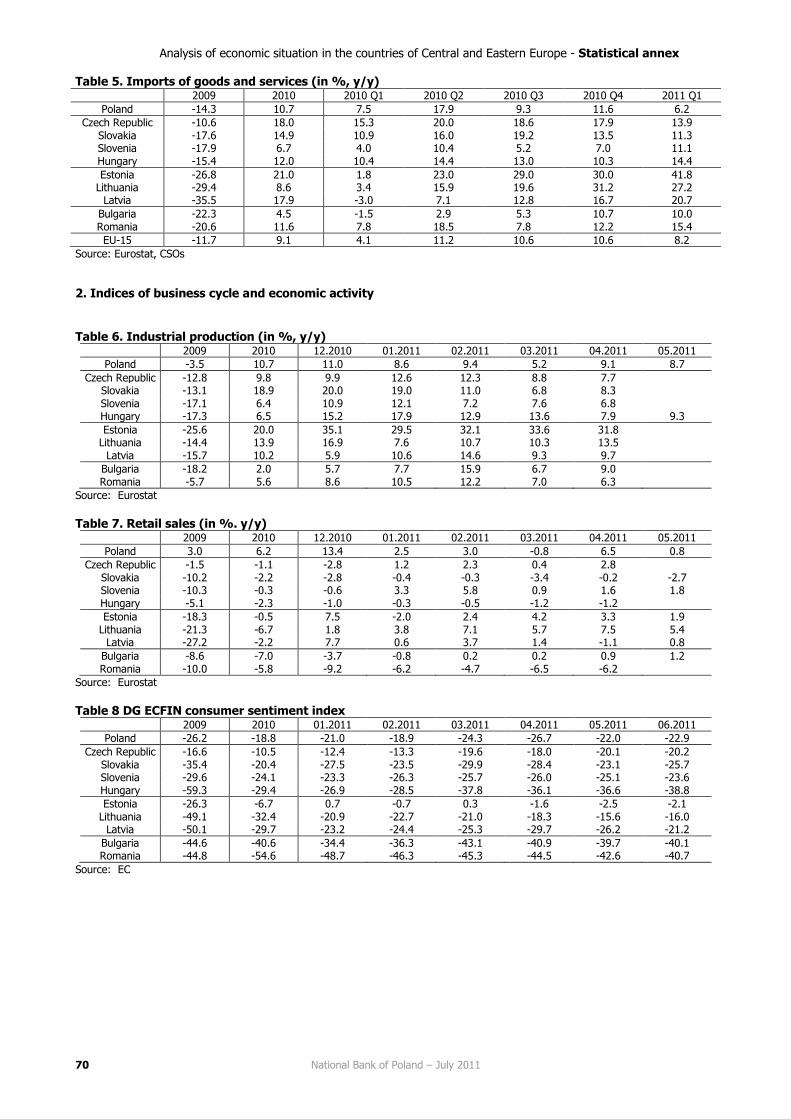
Analysis of economic situation in the countries of Central and Eastern Europe - Statistical annex
National Bank of Poland – July 2011 70
Table 5. Imports of goods and services (in %, y/y)
2009 2010 2010 Q1 2010 Q2 2010 Q3 2010 Q4 2011 Q1
Poland -14.3 10.7 7.5 17.9 9.3 11.6 6.2
Czech Republic -10.6 18.0 15.3 20.0 18.6 17.9 13.9 Slovakia -17.6 14.9 10.9 16.0 19.2 13.5 11.3 Slovenia -17.9 6.7 4.0 10.4 5.2 7.0 11.1 Hungary -15.4 12.0 10.4 14.4 13.0 10.3 14.4
Estonia -26.8 21.0 1.8 23.0 29.0 30.0 41.8 Lithuania -29.4 8.6 3.4 15.9 19.6 31.2 27.2
Latvia -35.5 17.9 -3.0 7.1 12.8 16.7 20.7
Bulgaria -22.3 4.5 -1.5 2.9 5.3 10.7 10.0 Romania -20.6 11.6 7.8 18.5 7.8 12.2 15.4
EU-15 -11.7 9.1 4.1 11.2 10.6 10.6 8.2
Source: Eurostat, CSOs
2. Indices of business cycle and economic activity Table 6. Industrial production (in %, y/y)
2009 2010 12.2010 01.2011 02.2011 03.2011 04.2011 05.2011
Poland -3.5 10.7 11.0 8.6 9.4 5.2 9.1 8.7
Czech Republic -12.8 9.8 9.9 12.6 12.3 8.8 7.7 Slovakia -13.1 18.9 20.0 19.0 11.0 6.8 8.3 Slovenia -17.1 6.4 10.9 12.1 7.2 7.6 6.8 Hungary -17.3 6.5 15.2 17.9 12.9 13.6 7.9 9.3
Estonia -25.6 20.0 35.1 29.5 32.1 33.6 31.8 Lithuania -14.4 13.9 16.9 7.6 10.7 10.3 13.5
Latvia -15.7 10.2 5.9 10.6 14.6 9.3 9.7
Bulgaria -18.2 2.0 5.7 7.7 15.9 6.7 9.0 Romania -5.7 5.6 8.6 10.5 12.2 7.0 6.3
Source: Eurostat
Table 7. Retail sales (in %. y/y)
2009 2010 12.2010 01.2011 02.2011 03.2011 04.2011 05.2011
Poland 3.0 6.2 13.4 2.5 3.0 -0.8 6.5 0.8
Czech Republic -1.5 -1.1 -2.8 1.2 2.3 0.4 2.8 Slovakia -10.2 -2.2 -2.8 -0.4 -0.3 -3.4 -0.2 -2.7 Slovenia -10.3 -0.3 -0.6 3.3 5.8 0.9 1.6 1.8 Hungary -5.1 -2.3 -1.0 -0.3 -0.5 -1.2 -1.2
Estonia -18.3 -0.5 7.5 -2.0 2.4 4.2 3.3 1.9 Lithuania -21.3 -6.7 1.8 3.8 7.1 5.7 7.5 5.4
Latvia -27.2 -2.2 7.7 0.6 3.7 1.4 -1.1 0.8
Bulgaria -8.6 -7.0 -3.7 -0.8 0.2 0.2 0.9 1.2 Romania -10.0 -5.8 -9.2 -6.2 -4.7 -6.5 -6.2
Source: Eurostat
Table 8 DG ECFIN consumer sentiment index
2009 2010 01.2011 02.2011 03.2011 04.2011 05.2011 06.2011
Poland -26.2 -18.8 -21.0 -18.9 -24.3 -26.7 -22.0 -22.9
Czech Republic -16.6 -10.5 -12.4 -13.3 -19.6 -18.0 -20.1 -20.2 Slovakia -35.4 -20.4 -27.5 -23.5 -29.9 -28.4 -23.1 -25.7 Slovenia -29.6 -24.1 -23.3 -26.3 -25.7 -26.0 -25.1 -23.6 Hungary -59.3 -29.4 -26.9 -28.5 -37.8 -36.1 -36.6 -38.8
Estonia -26.3 -6.7 0.7 -0.7 0.3 -1.6 -2.5 -2.1 Lithuania -49.1 -32.4 -20.9 -22.7 -21.0 -18.3 -15.6 -16.0
Latvia -50.1 -29.7 -23.2 -24.4 -25.3 -29.7 -26.2 -21.2
Bulgaria -44.6 -40.6 -34.4 -36.3 -43.1 -40.9 -39.7 -40.1 Romania -44.8 -54.6 -48.7 -46.3 -45.3 -44.5 -42.6 -40.7
Source: EC

Analysis of economic situation in the countries of Central and Eastern Europe - Statistical annex
National Bank of Poland – July 2011 71
Table 9. DG ECFIN business sentiment index 2009 2010 01.2011 02.2011 03.2011 04.2011 05.2011 06.2011
Poland -24.1 -13.0 -12.8 -9.1 -10.7 -9.7 -11.2 -12.3
Czech Republic -22.8 3.5 16.6 13.0 10.0 7.5 3.7 3.2 Slovakia -17.9 1.9 17.6 10.7 4.4 9.4 7.2 -9.5 Slovenia -25.6 0.0 9.0 7.8 6.2 6.6 5.2 1.5 Hungary -23.3 -1.9 6.7 8.1 5.2 9.8 0.4 1.8
Estonia -28.0 0.5 10.9 11.3 11.7 10.0 9.0 10.6 Lithuania -33.5 -13.1 -5.2 -6.0 -3.1 2.1 0.1 3.6
Latvia -27.9 -7.5 -5.9 -3.0 -2.8 -3.0 -3.8 -5.2
Bulgaria -10.8 -9.1 -4.1 -3.8 -4.5 -3.7 -5.0 -4.2 Romania -13.9 -8.3 -3.1 0.2 2.7 0.1 -1.8 -2.0
Source: EC
Table 10. PMI manufacturing index
2009 2010 12.2010 01.2011 02.2011 03.2011 04.2011 05.2011
Poland 45.6 53.5 57.3 58.4 60.5 59.8 58.6 59.0
Czech Republic 42.5 56.8 55.6 54.1 54.7 56.9 53.8 56.7 Hungary 45.3 52.8 55.9 56.3 55.6 53.8 54.8 54.4
Source: EcoWin Economic
3. Prices Table 11. CPI (in %, y/y)
10.2010 11.2010 12.2010 01.2011 02.2011 03.2011 04.2011 05.2011
Poland 2.8 2.7 3.1 3.6 3.6 4.3 4.5 5.0
Czech Republic 2.0 2.0 2.3 1.7 1.8 1.7 1.6 2.0 Slovakia 1.0 1.0 1.3 3.0 3.3 3.6 3.7 4.0 Slovenia 1.9 1.4 1.9 1.8 1.4 1.9 1.7 2.2 Hungary 4.2 4.2 4.7 4.0 4.1 4.5 4.7 3.9
Estonia 4.7 5.3 5.7 5.3 8.0 10.3 14.0 12.8 Lithuania 2.7 2.7 3.8 2.9 3.1 3.8 4.4 5.0
Latvia 1.0 1.9 2.5 3.7 4.0 4.2 4.5 5.0
Bulgaria 3.9 4.6 4.5 4.5 5.2 5.6 4.6 4.8 Romania 7.9 7.7 8.0 7.0 7.6 8.0 8.3 8.4
Source: CSOs
Table 12. PPI (in %. y/y)
10.2010 11.2010 12.2010 01.2011 02.2011 03.2011 04.2011 05.2011
Poland 5.8 6.1 7.2 7.3 8.4 9.6 9.4
Czech Republic 2.6 2.7 3.7 4.6 5.4 6.3 6.3 6.1 Slovakia -1.1 -1.1 -0.8 1.9 3.4 3.3 3.1 3.2 Slovenia 3.1 3.2 3.5 4.0 4.8 4.8 5.0 3.6 Hungary 10.0 10.7 10.9 9.6 9.2 8.7 6.4
Estonia 3.5 4.5 4.7 4.7 4.3 5.1 6.0 5.9 Lithuania 8.6 9.0 9.7 10.0 9.4 10.3 9.8 9.9
Latvia 4.4 6.2 5.8 7.4 7.4 7.7 9.4 9.7
Bulgaria 10.1 11.1 12.0 11.1 12.5 12.1 10.7 Romania 6.9 7.4 8.4 8.8 9.0 9.5 8.8
Source: CSOs
Table 13. HICP (in %, y/y)
10.2010 11.2010 12.2010 01.2011 02.2011 03.2011 04.2011 05.2011
Poland 2.6 2.6 2.9 3.5 3.3 4.0 4.1 4.3
Czech Republic 1.8 1.9 2.3 1.9 1.9 1.9 1.6 2.0 Slovakia 1.0 1.0 1.3 3.2 3.5 3.8 3.9 4.2 Slovenia 2.1 1.6 2.2 2.3 2.0 2.4 2.0 2.4 Hungary 4.3 4.0 4.6 4.0 4.2 4.6 4.4 3.9
Estonia 4.5 5.0 5.4 5.1 5.5 5.1 5.4 5.5 Lithuania 2.6 2.5 3.6 2.8 3.0 3.7 4.4 5.0
Latvia 0.9 1.7 2.4 3.5 3.8 4.1 4.3 4.8
Bulgaria 3.6 4.0 4.4 4.3 4.6 4.6 3.3 3.4 Romania 7.9 7.7 7.9 7.0 7.6 8.0 8.4 8.5
Source: Eurostat

Analysis of economic situation in the countries of Central and Eastern Europe - Statistical annex
National Bank of Poland – July 2011 72
Table 14. HICP - unprocessed food (in %, y/y) 10.2010 11.2010 12.2010 01.2011 02.2011 03.2011 04.2011 05.2011
Poland 6.2 5.4 4.4 5.9 5.6 6.5 6.0 7.2
Czech Republic 5.5 7.5 8.7 4.8 4.8 1.5 0.5 3.1 Slovakia 6.9 7.7 9.8 8.4 9.6 8.8 7.9 8.3 Slovenia 4.1 5.0 5.1 7.8 5.9 6.1 6.4 10.5 Hungary 11.9 11.8 13.0 11.5 11.3 9.2 9.5 6.1
Estonia 7.4 11.0 12.4 8.8 12.4 8.5 8.3 10.3 Lithuania 1.9 3.0 4.2 3.7 6.4 6.5 8.0 9.0
Latvia 3.9 6.2 8.5 6.4 7.5 5.5 5.7 6.2
Bulgaria 2.7 3.3 1.1 0.4 -0.5 1.2 2.4 3.0 Romania 7.5 8.1 8.5 9.8 12.1 13.3 14.8 14.8
Source: Eurostat
Table 15. HICP - processed food (including alcoholic beverages and tobacco products) (in %, y/y)
10.2010 11.2010 12.2010 01.2011 02.2011 03.2011 04.2011 05.2011
Poland 3.9 4.2 4.2 4.8 5.3 6.2 6.4 6.6
Czech Republic 3.1 3.7 4.1 3.7 3.9 4.6 4.6 6.2 Slovakia 3.2 2.6 2.6 3.5 3.4 4.7 5.0 5.8 Slovenia 3.2 2.8 3.2 3.7 5.0 4.8 4.4 5.0 Hungary 3.8 4.1 4.1 3.2 4.3 6.3 6.6 6.5
Estonia 8.7 9.6 9.4 9.5 10.0 11.4 12.4 11.7 Lithuania 5.6 4.3 5.6 5.8 5.8 6.7 7.5 8.3
Latvia 3.5 5.3 5.5 7.3 8.2 8.6 9.4 10.7
Bulgaria 11.1 12.0 12.2 12.5 13.4 13.5 7.3 7.4 Romania 11.8 10.8 10.2 7.0 8.1 8.8 9.6 10.2
Source: Eurostat
Table 16. HICP - energy (in %, y/y)
10.2010 11.2010 12.2010 01.2011 02.2011 03.2011 04.2011 05.2011
Poland 6.2 5.7 7.8 9.6 8.2 8.7 9.1 8.6
Czech Republic 5.4 4.7 6.5 7.4 7.1 7.0 6.1 5.8 Slovakia -1.7 -1.8 -1.2 9.2 10.3 10.1 9.8 9.5 Slovenia 14.0 10.3 12.6 12.6 12.3 11.4 10.0 8.6 Hungary 12.1 9.3 12.5 10.5 11.6 11.6 9.1 7.0
Estonia 10.3 10.7 12.1 8.5 8.6 7.5 6.0 5.1 Lithuania 16.9 16.1 19.7 12.8 11.3 11.9 11.3 11.3
Latvia 10.1 10.3 13.0 15.8 14.6 15.2 13.5 13.0
Bulgaria 10.3 11.2 14.3 12.9 13.6 12.0 9.1 9.0 Romania 9.5 9.6 11.2 9.6 9.5 9.7 11.0 10.9
Source: Eurostat
Table 17. HICP - excluding energy, food, alcoholic beverages and tobacco products (in %, y/y)
10.2010 11.2010 12.2010 01.2011 02.2011 03.2011 04.2011 05.2011
Poland 0.9 0.7 0.9 1.1 1.2 1.7 1.8 2.0
Czech Republic 0.1 -0.1 0.1 -0.3 -0.3 -0.3 -0.3 -0.4 Slovakia 0.3 0.4 0.5 1.0 1.0 1.3 1.6 1.9 Slovenia -0.8 -0.9 -0.6 -0.9 -1.4 -0.6 -0.8 -0.5 Hungary 1.5 1.4 1.6 1.6 1.1 1.4 1.6 1.7
Estonia 1.2 1.2 1.3 2.1 2.0 1.7 2.2 2.6 Lithuania -2.1 -1.9 -1.5 -1.4 -1.3 -0.5 0.1 0.7
Latvia -3.0 -2.5 -2.6 -1.6 -1.3 -0.8 -0.3 0.0
Bulgaria 0.0 0.1 0.4 0.5 0.7 0.7 0.7 0.8 Romania 4.7 4.7 4.8 4.7 4.6 4.5 3.8 3.7
Source: Eurostat
4. Balance of payments
Table 18. Current account balance (in % of GDP, 4q moving average)

Analysis of economic situation in the countries of Central and Eastern Europe - Statistical annex
National Bank of Poland – July 2011 73
2009 Q2 2009 Q3 2009 Q4 2010 Q1 2010 Q2 2010 Q3 2010 Q4 2011 Q1
Poland -5.1 -4.4 -3.9 -3.8 -3.8 -4.3 -4.5 -4.7
Czech Republic -2.6 -3.6 -3.2 -3.0 -2.5 -3.9 -3.8 -3.4 Slovakia -5.1 -3.8 -2.9 -2.3 -2.3 -2.8 -3.0 0.4 Slovenia -4.7 -3.5 -1.5 -0.9 -1.3 -0.8 -1.1 -1.1 Hungary -5.1 -2.4 0.4 1.5 1.9 1.9 2.1 1.4
Estonia -2.9 0.8 3.7 4.1 3.8 3.9 3.5 3.0 Lithuania -4.4 -0.3 4.3 4.5 5.3 4.0 1.8 1.5
Latvia -2.4 3.3 8.6 10.6 8.6 6.5 3.6 2.0
Bulgaria -17.7 -14.2 -8.9 -6.9 -4.4 -1.2 -1.0 1.1 Romania -7.1 -5.1 -4.2 -5.1 -5.3 -4.8 -4.1 -3.3
Source: Eurostat, central banks, own calculations
Table 19. Poland balance of payments and its components (EUR mn) 2009 Q2 2009 Q3 2009 Q4 2010 Q1 2010 Q2 2010 Q3 2010 Q4 2011 Q1
Current account -2705 -2958 -4489 -2174 -3020 -4987 -5671 -3364
Goods -1108 -1534 -1632 -1285 -1800 -2283 -3236 -1899 Services 875 726 1055 581 774 517 754 783 Income -3362 -2753 -3370 -2708 -3261 -3589 -3072 -2968
Current transfers 890 603 -542 1238 1267 368 -117 720
Capital account 1018 451 1729 1265 1064 1302 2859 1636
Financial account 3946 11212 6861 9379 5448 11740 1943 11870
FDI 318 2875 1413 3159 109 -217 -607 1713 Portfolio investment 3073 5114 2973 6691 3222 6984 2234 1770 Other investment 707 3106 2509 -356 2139 4988 585 8476
Source: Eurostat, central banks, own calculations
Table 20. Czech Republic balance of payments and its components (EUR mn)
2009 Q2 2009 Q3 2009 Q4 2010 Q1 2010 Q2 2010 Q3 2010 Q4 2011 Q1
Current account -2016 -1601 -868 248 -1328 -3642 -843 811
Goods 1041 690 554 1113 853 -110 246 1284 Services 588 646 660 621 878 526 582 666 Income -3635 -2532 -1894 -1507 -3217 -3870 -1613 -1180
Current transfers -10 -404 -188 22 158 -188 -58 40
Capital account 175 229 599 85 379 585 304 11
Financial account 1734 1209 3063 -737 864 6148 1046 -957
FDI 339 -669 1129 1183 761 2819 -939 545 Portfolio investment 2782 936 2375 527 2254 3117 341 -1833 Other investment -1247 969 -459 -2421 -2133 243 1734 242
Source: Eurostat, central banks, own calculations
Table 21. Slovakia balance of payments and its components (EUR mn) 2009 Q2 2009 Q3 2009 Q4 2010 Q1 2010 Q2 2010 Q3 2010 Q4 2011 Q1
Current account -269 -523 -480 -205 -287 -837 -660 2078
Goods 385 255 570 151 398 -171 -83 -62 Services -369 -222 -282 -167 -260 -188 -124 668 Income -196 -396 -502 -237 -354 -243 -304 872
Current transfers -89 -161 -266 49 -72 -235 -148 600
Capital account 225 176 282 215 177 479 345 -345
Financial account 856 237 1215 -213 -891 445 334 326
FDI -487 -437 392 235 252 -357 -346 216 Portfolio investment -814 -791 452 -972 -963 -344 983 1296 Other investment 2157 1465 371 524 -181 1146 -303 -1186
Source: Eurostat, central banks, own calculations
Table 22. Slovenia balance of payments and its components (EUR mn)
2009 Q2 2009 Q3 2009 Q4 2010 Q1 2010 Q2 2010 Q3 2010 Q4 2011 Q1
Current account 64 -235 -51 -107 -78 -64 -160 -87
Goods -29 -228 -286 -135 -204 -174 -461 -283 Services 311 296 269 234 300 261 263 307 Income -200 -241 -112 -152 -130 -158 -157 -162
Current transfers -18 -62 79 -53 -43 7 194 52
Capital account 41 -4 -42 46 2 16 -57 -7
Financial account -98 134 214 44 256 189 73 238
FDI -415 -46 -81 -39 63 32 443 90 Portfolio investment 1151 2293 307 1106 504 -48 388 2584 Other investment -891 -2112 -29 -1063 -195 201 -759 -2446
Source: Eurostat, central banks, own calculations
Table 23. Hungary balance of payments and its components (EUR mn)
2009 Q1 2009 Q2 2009 Q3 2009 Q4 2010 Q1 2010 Q2 2010 Q3 2010 Q4
Current account -549 236 417 228 600 627 439 366

Analysis of economic situation in the countries of Central and Eastern Europe - Statistical annex
National Bank of Poland – July 2011 74
Goods 441 1011 829 1089 1252 1223 914 1286 Services 90 354 603 303 612 627 754 413 Income -1027 -1251 -1195 -1275 -1217 -1458 -1350 -1415
Current transfers -53 122 179 111 -47 236 121 82
Capital account 241 378 308 183 452 389 439 509
Financial account 4128 -1983 2629 -211 2471 172 -1557 222
FDI 544 -1365 -357 735 -385 -354 196 1123 Portfolio investment -2940 -551 2903 -2085 2515 -750 -950 -201 Other investment 6523 -68 83 1139 341 1276 -803 -700
Source: Eurostat, central banks, own calculations
Table 24. Estonia balance of payments and its components (EUR mn)
2009 Q2 2009 Q3 2009 Q4 2010 Q1 2010 Q2 2010 Q3 2010 Q4 2011 Q1
Current account 120 233 209 6 74 264 169 -63
Goods -86 -115 -155 -131 -128 -23 31 -117 Services 393 400 321 235 347 444 287 209 Income -213 -113 -92 -110 -204 -196 -296 -206
Current transfers 26 60 135 11 59 39 147 52
Capital account 54 122 237 67 76 93 283 143
Financial account -22 -624 -113 -174 53 -841 -685 -72
FDI -169 -135 503 200 305 152 405 232 Portfolio investment -376 -150 -903 31 -289 -224 41 183 Other investment 502 -356 321 -408 23 -785 -1130 -456
Source: Eurostat, central banks, own calculations
Table 25. Lithuania balance of payments and its components (EUR mn)
2009 Q2 2009 Q3 2009 Q4 2010 Q1 2010 Q2 2010 Q3 2010 Q4 2011 Q1
Current account 98 254 806 16 321 -84 254 -76
Goods -263 -253 -129 -279 -266 -394 -242 -388 Services 86 135 174 192 220 294 274 111 Income -23 52 422 -76 -104 -244 -259 -195
Current transfers 297 320 338 179 471 260 481 396
Capital account 178 265 206 179 202 87 271 171
Financial account -353 -467 -1068 -208 -512 -11 -518 -127
FDI 16 -95 -124 -20 -109 451 57 60 Portfolio investment 6 65 642 1338 70 216 -217 -349 Other investment -212 -445 -1559 -1411 -613 -311 -110 160
Source: Eurostat, central banks, own calculations
Table 26. Latvia balance of payments and its components (EUR mn)
2009 Q2 2009 Q3 2009 Q4 2010 Q1 2010 Q2 2010 Q3 2010 Q4 2011 Q1
Current account 651 412 486 348 260 52 -16 75
Goods -300 -323 -212 -272 -245 -333 -310 -305 Services 281 274 277 257 296 291 269 267 Income 434 323 253 204 48 -31 -176 -24
Current transfers 236 137 169 160 161 126 202 136
Capital account 128 80 103 137 63 96 55 5
Financial account -905 -531 -563 -512 -258 -218 28 -76
FDI -98 137 27 -147 71 108 218 236 Portfolio investment 56 -40 61 60 39 -65 -174 -304 Other investment -1356 1008 -458 301 -471 116 -127 -388
Source: Eurostat, central banks, own calculations
Table 27. Bulgaria balance of payments and its components (EUR mn)
2009 Q2 2009 Q3 2009 Q4 2010 Q1 2010 Q2 2010 Q3 2010 Q4 2011 Q1
Current account -1191 249 -902 -554 -308 1343 -837 210
Goods -1257 -856 -905 -568 -786 -118 -941 53 Services 213 1140 -9 7 380 1447 68 141 Income -468 -238 -199 -379 -349 -395 -270 -330
Current transfers 322 204 211 386 447 409 305 347
Capital account 121 76 97 62 -90 178 140 13
Financial account 524 189 509 145 534 -770 474 -263
FDI 433 368 1061 24 420 443 573 -80 Portfolio investment -114 39 7 -145 -316 -47 -153 -189 Other investment 332 -386 -130 -512 52 -433 119 -649
Source: Eurostat, central banks, own calculations
Table 28. Romania balance of payments and its components (EUR mn)
2009 Q2 2009 Q3 2009 Q4 2010 Q1 2010 Q2 2010 Q3 2010 Q4 2011 Q1
Current account -1849 -946 -1722 -1544 -2101 -481 -843 -678

Analysis of economic situation in the countries of Central and Eastern Europe - Statistical annex
National Bank of Poland – July 2011 75
Goods -1732 -1693 -1907 -1287 -1900 -1216 -1502 -537 Services 15 -154 -158 -279 -224 -112 -21 -264 Income -1053 -261 -479 -412 -582 -427 -422 -603
Current transfers 49 223 351 49 36 53 79 97
Capital account 921 1162 822 434 605 1275 1102 724
Financial account 1266 1728 1159 1017 3014 341 1177 1650
FDI 1135 743 79 453 695 1008 394 446 Portfolio investment -32 324 268 1319 -109 -472 398 440 Other investment 1988 1886 607 2410 1059 1831 46 1909
Source: Eurostat, central banks, own calculations
Table 29. Official reserve assets to foreign debt ratio (in %, end of period)
2009 Q2 2009 Q3 2009 Q4 2010 Q1 2010 Q2 2010 Q3 2010 Q4 2011 Q1
Poland 26.2 27.6 29.1 31.4 34.9 29.8 30.2 29.7
Czech Republic 45.4 46.7 46.6 46.8 46.0 45.8 44.5 42.2 Slovakia 1.7 2.5 2.8 2.9 3.3 3.1 3.3 3.1 Slovenia 1.4 1.9 1.9 1.8 2.0 1.8 2.0 1.8 Hungary 20.5 23.1 22.5 23.8 24.8 24.4 24.5 25.7
Estonia 14.9 13.7 15.6 15.0 15.8 12.9 11.1 0.0 Lithuania 19.3 19.8 19.8 19.8 19.6 21.7 21.9
Latvia 10.0 15.7 16.4 19.1 19.4 21.2 19.4 18.2
Bulgaria 32.1 33.5 34.3 32.8 32.6 35.0 35.4 33.7 Romania 37.4 37.8 38.0 40.2 39.9 40.1 39.5 38.7
Source: Eurostat, central banks, own calculations
Table 30. FITCH rating for sovereign debt denominated in foreign currency 2006 2007 2008 2009 2010 06.2011
Poland BBB+ A- A- A- A- A-
Poland A A A+ A+ A+ A+ Czech Republic A A A+ A+ A+ A+
Slovakia AA AA AA AA AA AA Slovenia BBB+ BBB+ BBB BBB BBB- BBB-
Hungary A A A- BBB+ A A Estonia A A BBB+ BBB BBB BBB
Lithuania A- BBB+ BBB- BB+ BB+ BBB-
Latvia BBB BBB BBB- BBB- BBB- BBB- Bulgaria BBB BBB BB+ BB+ BB+ BB+
Source: FitchRatings
Table 31. FITCH rating for sovereign debt denominated in local currency
2006 2007 2008 2009 2010 06.2011
Poland A A A A A A
Czech Republic A+ A+ AA- AA- AA- AA- Slovakia A+ A+ A+ A+ A+ A+ Slovenia AA AA AA AA AA AA Hungary A- A- BBB+ BBB+ BBB BBB
Estonia A+ A+ A A- A A Lithuania A+ A+ A- BBB+ BBB+ BBB+
Latvia A A- BBB BBB- BBB- BBB
Bulgaria BBB+ BBB+ BBB BBB BBB BBB Romania BBB+ BBB+ BBB- BBB- BBB- BBB-
Source: FitchRatings
5. Interest rates and exchange rates
Table 32. Central banks main policy rates (end of period)

Analysis of economic situation in the countries of Central and Eastern Europe - Statistical annex
National Bank of Poland – July 2011 76
11.2010 12.2010 01.2011 02.2011 03.2011 04.2011 05.2011 06.2011
Poland 3.50 3.50 3.75 3.75 3.75 4.00 4.25 4.50
Czech Republic 0.75 0.75 0.75 0.75 0.75 0.75 0.75 0.75 Hungary 5.50 5.75 6.00 6.00 6.00 6.00 6.00 6.00
Romania 6.25 6.25 6.25 6.25 6.25 6.25 6.25 6.25
Euro area 1.00 1.00 1.00 1.00 1.00 1.25 1.25 1.25
Source: Central Banks, EcoWin Financial
Table 33. 3m interbank rates (average) 10.2010 11.2010 12.2010 01.2011 02.2011 03.2011 04.2011 05.2011
Poland 3.8 3.9 3.9 4.0 4.1 4.2 4.3 4.4
Czech Republic 1.2 1.2 1.2 1.2 1.2 1.2 1.2 1.2 Slovakia 1.0 1.0 1.0 1.1 1.1 1.2 1.4 1.4 Slovenia 1.0 1.0 1.0 1.0 1.1 1.2 1.3 1.4 Hungary 5.4 5.4 5.7 5.9 6.1 6.1 6.1 6.1
Estonia 1.1 1.1 1.1 1.1 1.1 1.1 Lithuania 1.6 1.6 1.6 1.4 1.4 1.4 1.5 1.7
Latvia 1.2 1.0 0.8 0.8 0.9 0.9 0.8 0.8
Bulgaria 4.0 4.0 3.9 3.9 3.9 3.9 3.8 3.8 Romania 6.7 6.6 6.3 5.3 5.7 6.1 5.7 5.5
Source: EcoWin Financial
Table 34. Exchange rates against EUR (average) 10.2010 11.2010 12.2010 01.2011 02.2011 03.2011 04.2011 05.2011
Poland 3.95 3.95 3.99 3.88 3.92 4.01 3.96 3.94
Czech Republic 24.51 24.62 25.13 24.39 24.26 24.37 24.24 24.36 Hungary 273.72 275.52 277.24 275.01 270.86 270.63 264.94 266.91
Latvia 3.45 3.45 3.45 3.45 3.45 3.45 3.45 3.45 Latvia 0.71 0.71 0.71 0.71 0.71 0.71 0.71 0.71
Bulgaria 1.96 1.96 1.96 1.96 1.96 1.96 1.96 1.96 Romania 4.28 4.29 4.29 4.26 4.24 4.16 4.09 4.11
Source: Eurostat
Table 35. Exchange rates against EUR (in %, y/y) 10.2010 11.2010 12.2010 01.2011 02.2011 03.2011 04.2011 05.2011
Poland -6.3 -5.0 -3.7 -4.5 -2.1 3.3 2.3 -3.0
Czech Republic -5.3 -4.6 -3.6 -6.6 -6.5 -4.4 -4.1 -4.9 Hungary 2.0 1.7 1.5 2.1 0.0 2.1 -0.1 -3.5 Romania -0.1 0.2 1.5 2.9 3.1 1.9 -0.7 -1.6
Source: Eurostat, own calculations
Table 36. NEER (in %, y/y) 10.2010 11.2010 12.2010 01.2011 02.2011 03.2011 04.2011 05.2011
Poland 3.4 1.7 -0.4 1.3 0.3 -4.0 -2.0 4.3
Czech Republic 2.1 1.0 -0.5 3.4 5.1 4.0 4.6 6.6 Slovakia -3.2 -3.5 -3.7 -3.3 -2.1 -0.8 0.1 0.6 Slovenia -2.0 -2.2 -2.4 -2.0 -1.1 -0.4 0.3 0.7 Hungary -5.4 -5.5 -5.7 -5.6 -1.9 -2.8 0.5 5.1
Estonia -3.4 -3.6 -4.4 -3.8 -2.5 -1.3 -0.1 0.5 Lithuania -3.0 -3.1 -3.7 -3.2 -2.0 -0.6 0.5 0.8
Latvia -2.8 -2.9 -3.7 -2.2 -1.2 -0.6 -0.1 0.1
Bulgaria -3.2 -3.7 -3.8 -2.6 -1.2 -0.1 1.0 2.0 Romania -2.8 -3.5 -5.2 -5.4 -4.2 -2.0 1.4 3.1
Source: BIS, own calculations
Table 37. REER (in %, y/y) 10.2010 11.2010 12.2010 01.2011 02.2011 03.2011 04.2011 05.2011
Poland 4.0 2.0 0.0 2.2 1.1 -2.9 -0.9 5.4
Czech Republic 1.5 0.4 -0.9 2.3 4.0 2.4 2.8 5.2 Slovakia -4.5 -4.7 -4.9 -3.0 -1.6 -0.2 0.7 1.4 Slovenia -2.2 -3.0 -3.0 -2.7 -2.5 -1.4 -1.1 -0.2 Hungary -3.9 -4.0 -4.0 -4.6 -0.9 -1.6 1.8 5.7
Estonia -1.3 -1.1 -1.8 -1.8 -0.1 0.4 1.6 2.2 Lithuania -3.0 -3.3 -3.1 -3.5 -2.3 -0.5 1.1 1.9
Latvia -4.5 -3.8 -4.4 -1.9 -0.6 -0.1 0.5 1.1
Bulgaria -2.3 -2.2 -2.5 -1.2 0.8 2.0 2.1 3.1 Romania 2.0 1.3 -0.4 -1.6 0.1 2.6 6.4 8.1
Source: BIS, own calculations
6. Labour market Table 38. Employment (in %, y/y)
2009 Q1 2009 Q2 2009 Q3 2009 Q4 2010 Q1 2010 Q2 2010 Q3 2010 Q4
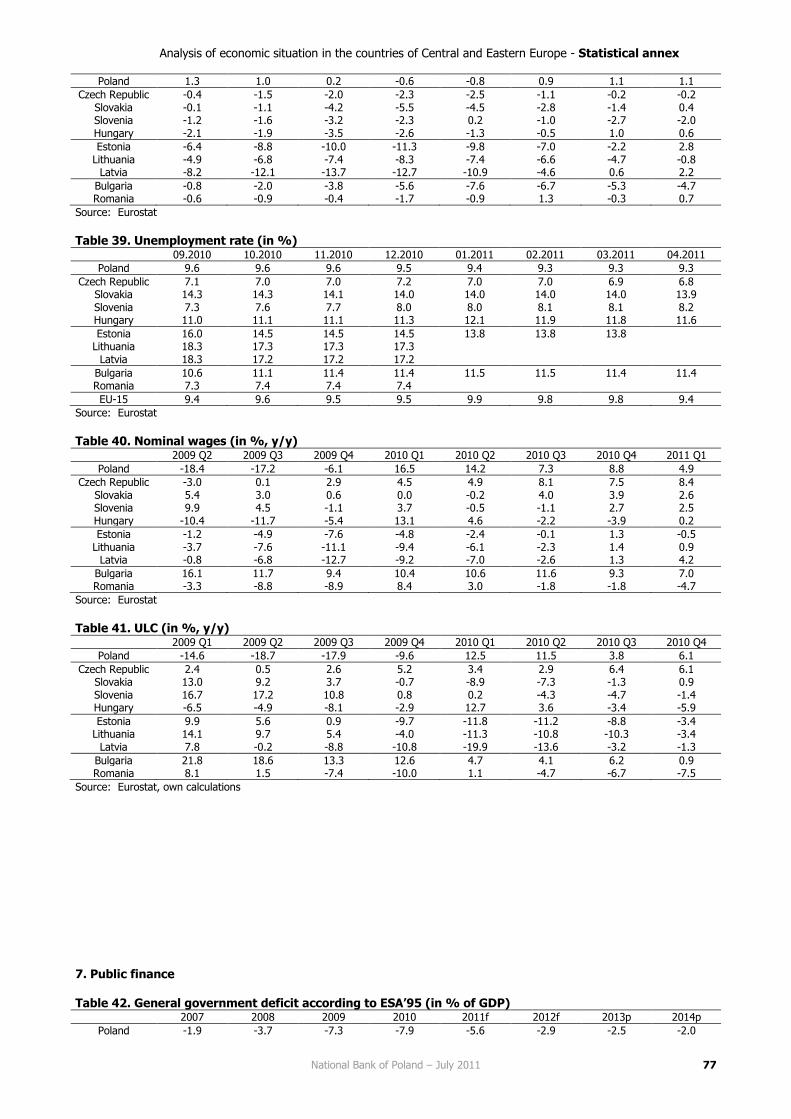
Analysis of economic situation in the countries of Central and Eastern Europe - Statistical annex
National Bank of Poland – July 2011 77
Poland 1.3 1.0 0.2 -0.6 -0.8 0.9 1.1 1.1
Czech Republic -0.4 -1.5 -2.0 -2.3 -2.5 -1.1 -0.2 -0.2 Slovakia -0.1 -1.1 -4.2 -5.5 -4.5 -2.8 -1.4 0.4 Slovenia -1.2 -1.6 -3.2 -2.3 0.2 -1.0 -2.7 -2.0 Hungary -2.1 -1.9 -3.5 -2.6 -1.3 -0.5 1.0 0.6
Estonia -6.4 -8.8 -10.0 -11.3 -9.8 -7.0 -2.2 2.8 Lithuania -4.9 -6.8 -7.4 -8.3 -7.4 -6.6 -4.7 -0.8
Latvia -8.2 -12.1 -13.7 -12.7 -10.9 -4.6 0.6 2.2
Bulgaria -0.8 -2.0 -3.8 -5.6 -7.6 -6.7 -5.3 -4.7 Romania -0.6 -0.9 -0.4 -1.7 -0.9 1.3 -0.3 0.7
Source: Eurostat
Table 39. Unemployment rate (in %)
09.2010 10.2010 11.2010 12.2010 01.2011 02.2011 03.2011 04.2011
Poland 9.6 9.6 9.6 9.5 9.4 9.3 9.3 9.3
Czech Republic 7.1 7.0 7.0 7.2 7.0 7.0 6.9 6.8 Slovakia 14.3 14.3 14.1 14.0 14.0 14.0 14.0 13.9 Slovenia 7.3 7.6 7.7 8.0 8.0 8.1 8.1 8.2 Hungary 11.0 11.1 11.1 11.3 12.1 11.9 11.8 11.6
Estonia 16.0 14.5 14.5 14.5 13.8 13.8 13.8 Lithuania 18.3 17.3 17.3 17.3
Latvia 18.3 17.2 17.2 17.2
Bulgaria 10.6 11.1 11.4 11.4 11.5 11.5 11.4 11.4 Romania 7.3 7.4 7.4 7.4
EU-15 9.4 9.6 9.5 9.5 9.9 9.8 9.8 9.4
Source: Eurostat
Table 40. Nominal wages (in %, y/y)
2009 Q2 2009 Q3 2009 Q4 2010 Q1 2010 Q2 2010 Q3 2010 Q4 2011 Q1
Poland -18.4 -17.2 -6.1 16.5 14.2 7.3 8.8 4.9
Czech Republic -3.0 0.1 2.9 4.5 4.9 8.1 7.5 8.4 Slovakia 5.4 3.0 0.6 0.0 -0.2 4.0 3.9 2.6 Slovenia 9.9 4.5 -1.1 3.7 -0.5 -1.1 2.7 2.5 Hungary -10.4 -11.7 -5.4 13.1 4.6 -2.2 -3.9 0.2
Estonia -1.2 -4.9 -7.6 -4.8 -2.4 -0.1 1.3 -0.5 Lithuania -3.7 -7.6 -11.1 -9.4 -6.1 -2.3 1.4 0.9
Latvia -0.8 -6.8 -12.7 -9.2 -7.0 -2.6 1.3 4.2
Bulgaria 16.1 11.7 9.4 10.4 10.6 11.6 9.3 7.0 Romania -3.3 -8.8 -8.9 8.4 3.0 -1.8 -1.8 -4.7
Source: Eurostat
Table 41. ULC (in %, y/y) 2009 Q1 2009 Q2 2009 Q3 2009 Q4 2010 Q1 2010 Q2 2010 Q3 2010 Q4
Poland -14.6 -18.7 -17.9 -9.6 12.5 11.5 3.8 6.1
Czech Republic 2.4 0.5 2.6 5.2 3.4 2.9 6.4 6.1 Slovakia 13.0 9.2 3.7 -0.7 -8.9 -7.3 -1.3 0.9 Slovenia 16.7 17.2 10.8 0.8 0.2 -4.3 -4.7 -1.4 Hungary -6.5 -4.9 -8.1 -2.9 12.7 3.6 -3.4 -5.9
Estonia 9.9 5.6 0.9 -9.7 -11.8 -11.2 -8.8 -3.4 Lithuania 14.1 9.7 5.4 -4.0 -11.3 -10.8 -10.3 -3.4
Latvia 7.8 -0.2 -8.8 -10.8 -19.9 -13.6 -3.2 -1.3
Bulgaria 21.8 18.6 13.3 12.6 4.7 4.1 6.2 0.9 Romania 8.1 1.5 -7.4 -10.0 1.1 -4.7 -6.7 -7.5
Source: Eurostat, own calculations
7. Public finance Table 42. General government deficit according to ESA’95 (in % of GDP)
2007 2008 2009 2010 2011f 2012f 2013p 2014p
Poland -1.9 -3.7 -7.3 -7.9 -5.6 -2.9 -2.5 -2.0
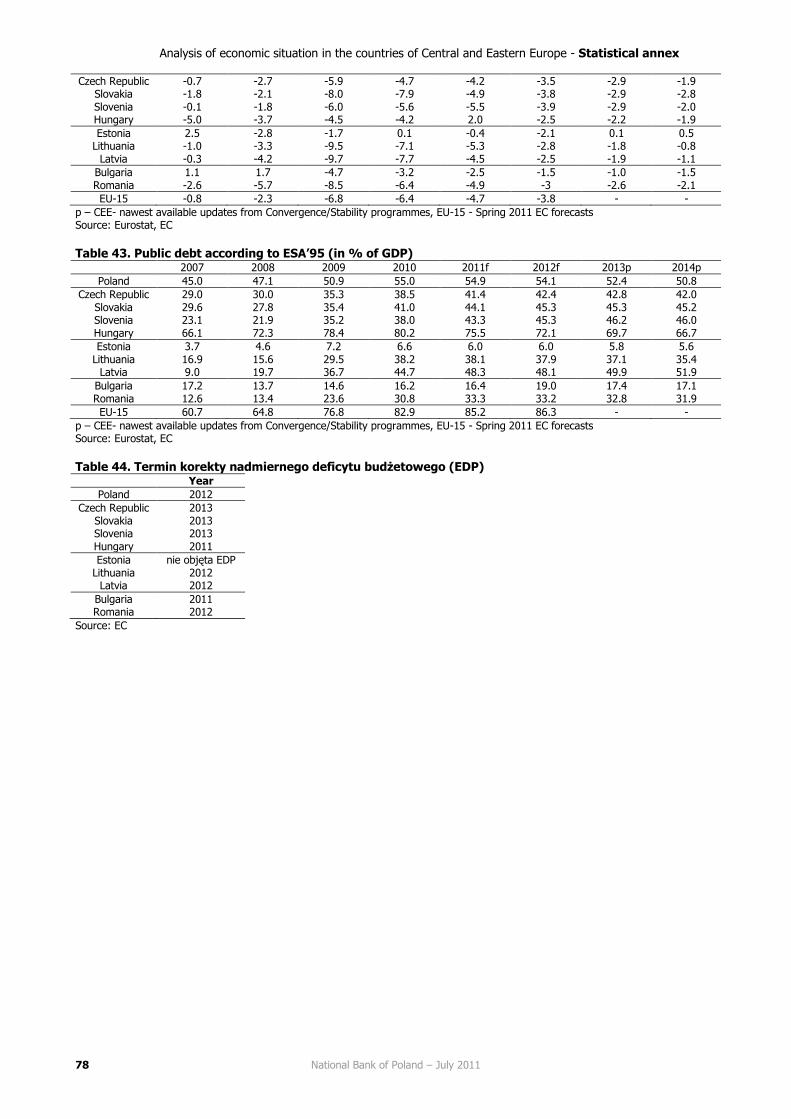
Analysis of economic situation in the countries of Central and Eastern Europe - Statistical annex
National Bank of Poland – July 2011 78
Czech Republic -0.7 -2.7 -5.9 -4.7 -4.2 -3.5 -2.9 -1.9 Slovakia -1.8 -2.1 -8.0 -7.9 -4.9 -3.8 -2.9 -2.8 Slovenia -0.1 -1.8 -6.0 -5.6 -5.5 -3.9 -2.9 -2.0 Hungary -5.0 -3.7 -4.5 -4.2 2.0 -2.5 -2.2 -1.9
Estonia 2.5 -2.8 -1.7 0.1 -0.4 -2.1 0.1 0.5 Lithuania -1.0 -3.3 -9.5 -7.1 -5.3 -2.8 -1.8 -0.8
Latvia -0.3 -4.2 -9.7 -7.7 -4.5 -2.5 -1.9 -1.1
Bulgaria 1.1 1.7 -4.7 -3.2 -2.5 -1.5 -1.0 -1.5 Romania -2.6 -5.7 -8.5 -6.4 -4.9 -3 -2.6 -2.1
EU-15 -0.8 -2.3 -6.8 -6.4 -4.7 -3.8 - -
p – CEE- nawest available updates from Convergence/Stability programmes, EU-15 - Spring 2011 EC forecasts Source: Eurostat, EC
Table 43. Public debt according to ESA’95 (in % of GDP)
2007 2008 2009 2010 2011f 2012f 2013p 2014p
Poland 45.0 47.1 50.9 55.0 54.9 54.1 52.4 50.8
Czech Republic 29.0 30.0 35.3 38.5 41.4 42.4 42.8 42.0 Slovakia 29.6 27.8 35.4 41.0 44.1 45.3 45.3 45.2 Slovenia 23.1 21.9 35.2 38.0 43.3 45.3 46.2 46.0 Hungary 66.1 72.3 78.4 80.2 75.5 72.1 69.7 66.7
Estonia 3.7 4.6 7.2 6.6 6.0 6.0 5.8 5.6 Lithuania 16.9 15.6 29.5 38.2 38.1 37.9 37.1 35.4
Latvia 9.0 19.7 36.7 44.7 48.3 48.1 49.9 51.9
Bulgaria 17.2 13.7 14.6 16.2 16.4 19.0 17.4 17.1 Romania 12.6 13.4 23.6 30.8 33.3 33.2 32.8 31.9
EU-15 60.7 64.8 76.8 82.9 85.2 86.3 - -
p – CEE- nawest available updates from Convergence/Stability programmes, EU-15 - Spring 2011 EC forecasts Source: Eurostat, EC
Table 44. Termin korekty nadmiernego deficytu budżetowego (EDP)
Year
Poland 2012
Czech Republic 2013 Slovakia 2013 Slovenia 2013 Hungary 2011
Estonia nie objęta EDP Lithuania 2012
Latvia 2012
Bulgaria 2011 Romania 2012
Source: EC