financial system in poland 2016 - nbp.pl · summary financial system in poland 2016 5 funds to the...
TRANSCRIPT

Financial System in Poland 2016

Warsaw, 2017
Financial System in Poland 2016

This document contains the summary and the first chapter of a comprehensive report Rozwój
systemu finansowego w Polsce w 2016 r. [Financial system development in Poland 2016], prepared by
the Financial Stability Department. The report is available in Polish, together with its previous
editions, on the NBP website:
www.nbp.pl/systemfinansowy/rozwoj
Narodowy Bank Polski 00-919 Warszawa ul. Świętokrzyska 11/21 tel.: +48 22 185 10 00 fax: +48 22 185 10 10 www.nbp.pl
© Copyright Narodowy Bank Polski, 2017

Summary
3 Financial System in Poland 2016
Summary
At the end of 2016, the ratio of domestic financial system assets to GDP was higher than at the
end of 2015 and amounted to 126.3%. Poland’s financial system, including the banking sector, is
not overly developed in relation to the real economy and compared with the developed
countries. It comprises all types of financial institutions and markets characteristic of well-
developed market economies, as well as institutions that make up its infrastructure. The size and
structure of the financial system indicate that, according to the assessment of both Polish and
international institutions, there is room for its further sustainable development that will support
economic growth. In line with recommendations, the development should remain moderate and
take place as the importance of financial markets grows.
The analyses of the individual segments of Poland’s financial system and of changes in its
regulation and infrastructure, presented in this study, lead us to the following conclusions and
suggestions concerning the development of domestic financial institutions and markets.
Financial institutions
▪ In Poland, as in other countries of the region, the banking sector was the largest part of the
financial system. In 2016, the sector developed at a moderate pace, and the ratio of bank assets
to GDP rose to 92% at the end of the year. Changes in the individual items of the balance-sheet
of banks and in the level of earnings resulted, among others, from the new tax on certain
financial institutions, which took effect in February 2016.
▪ As in previous years, loans, including housing loans to households in particular, were the
largest item of banks' assets. The share of Treasury securities in the balance-sheet total grew
and banks' activity in the unsecured deposit market diminished. Deposits of the non-financial
sector were the dominant source of funding of domestic banks. The rate at which they
increased exceeded credit growth, thus further reducing the funding gap. At the same time,
liabilities to parent companies accounted for a diminishing share of banks’ liabilities, which
stemmed from a gradual decline of the value of portfolios of foreign currency housing loans
and lower demand for currencies.
▪ A rise in profits in 2016, including in particular a large item appearing in one-off revenue due
to the sale of a stake in VISA Europe Limited, brought the downward trend of the profitability
of the banking sector, observed since 2008, to a halt. The average profitability of banks in
Poland was still higher than in the European Union (EU), even after excluding one-off
revenue.
▪ Banks in Poland ran their business using a low leverage. Their capital ratios remained at a
level similar to that in the EU, but the conservative approach to capital requirement estimation
(resulting in high shares of RWAs in assets) rendered the actual resilience of banks to shocks
to be higher.

Summary
4 Narodowy Bank Polski
▪ The trends indicated above were shaped by commercial banks, which accounted for over 90%
of assets of the banking sector. The role of branches of credit institutions and cooperative
banks was much lower. The latter were a particularly numerous and fragmented group of
entities. Although the current condition of the sector of cooperative banks is satisfactory,
certain unfavourable trends can be identified, pointing to the need to alter the sector's
organisation and business model. The putting in place of the institutional protection schemes
in 2016 should support the growth in the security of the cooperative banks sector and
stimulate business change.
▪ The year 2016 saw a continued restructuring process in the credit union sector, which reduced
the number of active credit unions and value of the sector's assets. In 2016 the number of
credit unions fell to 40, and their assets totalled PLN 11.3 billion. At the same time, the degree
of concentration of the sector increased as the share of its three largest entities exceeded 75%.
Receivables due to loans and credits granted to credit union members remain the main item of
their assets. The quality of the loans is low, despite the sale of overdue debt by credit unions.
▪ At the end of 2016, the sector of credit unions posted a loss of PLN 139.1 million, and the
factors negatively influencing their efficiency were the decreasing result on core operations
and high operating costs (especially the cost of outsourcing). The capital position of credit
unions remains tight even though the activity of credit unions with negative regulatory capital
ceased. The sector's capital adequacy ratio ran at the level of 1.24% while several credit unions
(including the largest ones) still do not comply with the regulatory minimum of 5%. A
significant part of the regulatory capital of credit unions is capital that cannot be used to
absorb losses.
▪ Throughout 2016, the net assets of investment funds grew slightly and amounted to PLN 275.4
billion at the end of December. For the first time since 2008, these institutions registered a net
outflow of funds. The outflow was associated with changes in tax regulations implemented
towards the end of the year, aimed at eliminating the use of investment funds for designing
capital structures for tax dodging purposes. Households remained the most important
investment fund participants, as the share of enterprises and insurance companies dwindled.
▪ Open-ended investment funds dominated in the structure of the sector, both in terms of the
volume of active funds and in value of assets. Equities other than shares of companies listed
on the markets organised by the Warsaw Stock Exchange (WSE) and participation units were
the main investment item of closed-end investment funds, while domestic Treasury securities
were the main item of investments of open-ended investment funds. In 2016, work was
completed on adjusting domestic law to the ZAFI and UCITS V Directives. In line with the
new provisions, closed-end investment funds and specialist open-ended investment funds
were considered to be alternative investment funds and investment fund management
companies that represent them – as alternative investment fund managers.
▪ In 2016, the net value of assets of open pension funds (OFE) grew by 9.2% to reach PLN
153.4 billion, primarily on account of favourable developments in the domestic stock market
which were behind the highest earnings of OFE since 2013. On the other hand, the transfer of
Summary
5 Financial System in Poland 2016
funds to the Social Insurance Institution (ZUS) under the so-called security slider mechanism,
which were higher than contributions to ZUS, had a negative effect on the value of OFE assets.
The number of OFE members – as in 2015 – dropped somewhat. Domestic equities continued
to prevail (76.4%) in the structure of the OFE investment portfolio. At the same time, shares in
the particular asset categories in investments differed significantly across funds. Open pension
funds were still one of the most important investors on the domestic stock market.
▪ The value of assets accruing as part of contributions to the pension system on a voluntary
basis rose by 13% and amounted to PLN 19.1 billion. The asset growth came mainly on high
net inflows (PLN 1.8 billion). The largest amount of assets was gathered in occupational
pension schemes – PLN 11.4 billion. Among financial institutions, the highest amount of
savings made on a voluntary basis was kept in investment funds (PLN 8.9 billion).
▪ The year 2016 saw a decline in the gross written premium collected by domestic life insurance
companies, mainly in unit-linked life insurance. However, the value of assets of the life
insurance sector increased, driven by good investment results. In non-life insurance, the gross
written premium increased significantly as a result of a rise in car insurance prices. At the
same time, claims arising from third-party liability car insurance (OC) reached their all-time
highs and negatively impacted the technical result of the whole sector of insurance, as it
remained low for another consecutive year. The financial result of the whole insurance sector
fell, with the fall resulting from the tax on certain financial institutions introduced in 2016.
New solvency rules came into force in the insurance sector in 2016. Despite the growth in
capital requirements, domestic insurance companies had eligible own funds at the level that
was over two and a half times higher than the Solvency Capital Requirement (SCR).
▪ The introduction of the tax on certain financial institutions affected the functioning of the
financial sector. It decreased the earnings of banks – although the decrease was partially offset
by lower deposit costs – and insurance companies. The preferential treatment of government
bonds in the calculation of the taxation base for banks contributed to a significant increase in
the share of domestic banks in the structure of government bond holders. The tax also led to a
temporary fall in the value of turnover in the markets for unsecured interbank deposits and
conditional transactions.
▪ Domestic firms favour self-financing as the model of business financing. Among external non-
banking sources of financing, firms often resort to leasing and the issue of bonds, including
bonds issued in foreign markets. In 2016, firms signed leasing agreements for a total of PLN
49.2 billion and raised PLN 21.7 billion in the market for long-term bonds. The value of new
share issues on the WSE-organised markets (Main List and NewConnect) was PLN 2.0 billion.
Private equity funds were an additional source of own capital for some enterprises. In the
years 2013-2016, the ratio of the value of capital invested by private equity funds in domestic
companies to the value of funds raised by enterprises via new share issues on the WSE-
organised markets was approx. 44% on average.
▪ According to data of the Central Statistical Office of Poland (GUS), the value of loans and
advances granted by non-bank lending companies and in association with credit

Summary
6 Narodowy Bank Polski
intermediaries in 2016 was PLN 38.6 billion. This value was the result of loans to natural
persons in the amount of PLN 31.7 billion and to enterprises – PLN 6.9 billion. The limit on
non-interest costs of consumer loans was set on 11 March 2016. Its maximum level depends on
the nominal value of the loan and the term of the credit agreement.
▪ Domestic investment firms carry on their business primarily on markets organised by the
WSE and BondSpot. The core activity of investment firms consisting in conveying trade orders
remained unprofitable. This was caused by the dwindling number of transactions in the spot
and futures markets of the WSE and intense competition on the market for brokerage services.
This induced investment firms to offer other services, including handling of share and bond
issues, ensuring access to foreign organised markets and providing individual investors,
mainly speculation-oriented ones, with internet-based trading platforms (so-called forex
platforms). Transferring brokerage activity from investment firms to banks or investment
fund management companies, which were owned by the same capital groups, continued
throughout 2016. The consolidation of the offer of financial services is motivated by cost
synergy and increasing the customer base.
Financial markets and their infrastructure
▪ In 2016, the liquidity of the domestic market for interbank deposits transactions decreased by
approx. 10% compared with 2015. The decrease was similar in all segments of the market.
Therefore, its structure did not change significantly. Although a significant increase in the
turnover on the repo and sell-buy back market has been observed in recent years, for a
number of banks unsecured interbank deposits have remained the only liquidity management
instrument.
▪ As in previous years, the liquidity of the market for unsecured interbank deposits
concentrated in the O/N transactions segment. The tax on certain financial institutions
introduced in February 2016 brought about a temporary fall in turnover on this market,
especially in the first months after its entry into force. The number of participants in
WIBID/WIBOR reference rate fixing decreased to 11.
▪ In 2016, the average daily value of transactions in the domestic FX swap market of the zloty
rose to PLN 13.7 billion, with the transactions accounting for only approx. 20% of the turnover
in the global FX swap market. Domestic banks concluded FX swaps mainly with foreign banks
which financed investments in Poland’s Treasury bond market and speculated on zloty
exchange rate movements. Domestic banks often used these transactions in their strategies of
hedging against FX risk.
▪ The year 2016 saw a continued fall in the turnover on the domestic market for conditional
transactions; the average daily turnover in transactions was PLN 13.8 billion. In June 2016, the
Polish Bank Association (ZBP) released an updated Recommendation on concluding Repo and
Buy/Sell Back transactions on the Polish financial market. The purpose of the recommendation was
to adjust the Polish standard master agreement to amendments in the law, international
standards and new solutions in the post-trading infrastructure. Despite the launch of the

Summary
7 Financial System in Poland 2016
initiative, the uniform definitions and standards of concluding repo and sell-buy-back/buy-
sell-back transactions that are widely accepted by financial market participants (i.e. banks,
brokerage houses, insurance companies, investment funds and pension funds) are still not in
place.
▪ In 2016, the value of the market for NBP bills continued to diminish on the back of falling
excess liquidity of the Polish banking sector. The value of issues of Treasury bills carried out
in the first quarter of 2016 after a two-year hiatus were low (PLN 6.48 billion) and were used
for current budget liquidity management purposes. The value of the domestic short-term
corporate bond market did not change considerably compared with 2015. These instruments
were used for transfers of excess liquidity among enterprises of the same capital group.
▪ In 2016, the Treasury bond market remained the dominant segment of the domestic market for
long-term debt instruments. At the end of 2016, the value of marketable Treasury bonds
issued on the domestic market amounted to PLN 576.7 billion. The structure of buyers of
domestic Treasury bonds changed substantially in 2016. The value of the portfolio of Treasury
bonds held by domestic banks rose by PLN 64.0 billion, and their share in the investor
structure stood at the end of 2016 at over 40%. At the same time, the value of domestic
Treasury bonds held by non-residents declined by PLN 14.3 billion, mainly as a result of
reduced portfolios of investment and hedge funds. The shift in the investor structure was
accompanied by a rise in the yields on domestic Treasury bonds along the entire yield curve.
Average daily net turnover in the domestic market of Treasury bonds increased to PLN 27.2
billion, with the increase mainly driven by a rise in value of unconditional transactions.
▪ Enterprises raised PLN 21.7 billion by issuing long-term bonds, which represented a decrease
of 12% on the 2015 figure. Industry-wise, the issuer diversification of the long-term bond
market remained low, and energy producing companies and development companies
prevailed. Domestic issuers continued to use creditworthiness assessment ratings assigned by
the rating agencies to a limited extent. The liquidity of the secondary corporate bond market
remained small – the value of transactions in corporate bonds on the Catalyst platform was
PLN 1.6 billion.
▪ The favourable financial condition of local government units and the fact they cut their
investment expenditure led to a small decline (to PLN 19.9 billion at the end of 2016) of the
value of outstanding municipal bonds. However, the market remained highly fragmented,
which stemmed from the minor borrowing needs of smaller local government units and the
splitting of issues into a number of series, which allowed the involved parties to set similar
debt repayment schedules as in the case of loans.
▪ At the end of 2016, the capitalisation of the Polish stock market increased to PLN 1,125.5
billion, which resulted mainly from the rising prices of equity instruments (the WIG index
rose by 11.4%). The number of entities whose shares were traded on the organised market fell
for the first time since 2003. A number of companies, some of which had high market value,
chose to be delisted. The ratio of the capitalisation of domestic companies to Poland’s GDP at
the end of 2016 was 30.6%. The liquidity of the domestic stock market remained low compared

Summary
8 Narodowy Bank Polski
to stock exchanges in developed countries. This is, inter alia, due to the fact that securities
traded on the domestic market are issued by a relatively large number of companies with low
capitalisation and low free float.
▪ The year 2016 saw a drop in the value of new issue shares sold in IPOs on the WSE Main List.
Such a trend may have stemmed from the reduction in investment expenditure by enterprises.
Non-residents were the most active investors, as their share in the session turnover in shares
and allotment certificates on the WSE Main List amounted to 53% and was the highest in the
history of the market. On the other hand, the share of individual investors reached its all-time
low of 13% for another year in succession.
▪ In 2016, rising shares contributed to an increase of 13.1% in the capitalisation of the
NewConnect market. At the same time, the number of issuers decreased. The instruments of
30 companies were delisted, because most frequently they were excluded by the market
organiser for putting the safety of trading at risk or transferring of listing to the WSE Main
List. The liquidity of the NewConnect market was adversely affected by the low value of
initial offerings.
▪ In 2016, average daily turnover on the global spot market for the Polish zloty rose by 10% to
over USD 10.5 billion. The vast majority of transactions (over 80%) were concluded in the
offshore market. The EUR/PLN exchange rate was largely determined by developments in the
global financial markets and reflected only to a small extent the flows arising from Poland’s
trade exchange or non-resident investment on the domestic capital market.
▪ The value of transactions in zloty-denominated OTC derivatives in the offshore market, which
involves transactions between non-residents, was substantially higher than in the domestic
market, which was primarily related to the high activity of London-based banks and hedge
funds. In Poland, OTC interest rate derivatives continued to markedly prevail in terms of
turnover value, despite a substantial fall in market participants’ interest in the instruments
during the year. Investor activity on the market for exchange-traded derivatives was still
substantially lower than on the OTC market and was concentrated in the segment of WIG20
futures.
▪ In 2011-2016, the value of average daily net turnover in the OIS market diminished by almost
90% and it amounted to PLN 0.1 billion in 2016, which represents the lowest figure in the
history of the market in Poland. The structural drop in activity on this market was associated
with the small number of domestic market participants amid persisting negligible activity of
foreign banks, lack of high and diversified expectations for changes in NBP interest rates in
the short term, and low volatility in the POLONIA rate, being the reference rate for the
instruments mentioned above. Continued low volatility of the OIS market in the long term
may prevent domestic banks from hedging effectively against the changes in short-term
financing costs and negatively impact on other segments of the domestic financial market. OIS
curves, as an approximation of risk-free rates, are commonly used to discount cash flows from
financial instruments and to value them.

Summary
9 Financial System in Poland 2016
▪ Transactions in OTC interest rate derivatives were increasingly cleared by domestic banks at
CCP, which was related to a gradual implementation in the EU of the central clearing
obligation for selected OTC derivatives classes. In 2016, almost 80% of FRAs, over 70% of IRSs
and over 60% of OISs denominated in the zloty concluded in the domestic market were
cleared at CCP.
▪ KDPW continued preparations aimed at obtaining authorisation as a central securities
depository in line with with the CSDR requirements. The authorisation is a necessary
condition for KDPW to carry on its activity in the area of all core services: registering of
securities, and running a deposit scheme and the securities settlement system. In December
2016, KDPW obtained international authorisation to assign LEI codes so that domestic entities
can, using the infrastructure located in Poland, fulfil the EU- imposed obligation to have an
LEI identifier.
▪ In August 2016, KDPW_CCP obtained a permit to expand the catalogue of its clearing services
provided as a CCP within the meaning of Regulation (EMIR) to include OTC interest rate
derivatives denominated in the euro, transactions in securities admitted to organised trading
and outright transactions denominated in the zloty concluded in the OTC market.

Directions of the evolution of Poland’s financial system
10 Narodowy Bank Polski
1. Directions of the evolution of Poland’s
financial system
In 2016, the growth rate of world GDP was the lowest since the last global financial crisis, and in
the case of developing countries – it was the weakest in 20 years. The moderate recovery in the
euro area was supported by the expansionary policy of the European Central Bank. In the United
States, economic recovery was stronger than in the euro area.
Poland's GDP growth was 2.7%, compared to 3.8% in 2015.1 The downturn came on the back of,
among others, lower investment, which was associated with a temporary reduction of the inflow
of EU funding. Economic growth, close to the growth rate of potential output, was accompanied
by low albeit rising price growth, which reached the level of +0.8% y/y in December 2016. The
annual CPI amounted to -0,6% y/y and signalled the absence of demand and cost pressure in the
national economy.2
In 2016, price developments in Poland, like in other European economies, were determined
primarily by global energy commodity prices. In the first half of the year, these prices were
markedly lower than in previous years, and hence their annual growth rate was negative. In the
second half of the year they rebounded, which was reflected in a gradual acceleration in energy
price growth, which however turned positive only towards the end of the year.3 In such an
environment, the Monetary Policy Council (MPC) kept the NBP interest rates unchanged,
including the reference rate at the level of 1.5% (the Lombard rate at 2.5%, the deposit rate at 0.5%
and the rediscount rate at 2.25%).
The economic condition of enterprises in 2016 remained good and improved at the end of the
year mainly on account of higher domestic sales addressing elevated consumer demand resulting
from favourable developments in the labour market and payments of funds under the Family 500
plus programme. Corporate investment activity remained low despite lending growth and the
persistently low price of money.4
The financial situation of households improved markedly in 2016. Households reported higher
income and average monthly disposable income per capita was 7% higher in real terms than in
1 http://strateg.stat.gov.pl/Home/Strateg 2 Poland in figures 2017, Warsaw May 2017, GUS, p. 9. 3 Report on monetary policy in 2016, Warsaw May 2017, NBP, p. 23. 4 NBP Quick Monitoring Survey. Economic climate in the enterprise sector in 2016 Q4 and forecasts for 2017 Q1, Warsaw,
January 2017, NBP, pp. 1, 35, 38.

Directions of the evolution of Poland’s financial system
11 Financial System in Poland 2016
2015.5 Poland’s unemployment rate dropped to 6.2% from 9.8% in 2015. The total employment
rate rose by 1 percentage point and amounted to 64.5% in 2016. Household financial assets also
grew (by 10%), and the growth rate of savings (bank deposits) amounted to 9.6%.
In the period under analysis, the monetary policy of major central banks was divergent. The
European Central Bank (ECB) lowered interest rates, including the interest rate on the deposit
facility to a more negative level, and expanded its asset purchase programme. On the other hand,
the US Federal Reserve (Fed) raised its target for short-term interest rates by 0.25 percentage
points to a range of 0.50% and 0.75% towards the end of 2016. The tightening of monetary policy
in the United States pushed up the yields on government bonds, and led to the appreciation of
the US dollar and a weakening of some emerging market currencies, including the zloty. At the
same time, the better global economic outlook translated into a further rise in prices of financial
prices, mostly shares, particularly in developed economies. 6
The ratio of financial system assets to GDP7 increased by 3.5 percentage points and amounted to
126.3% at the end of 2016 (Table 1.1.). In Poland, like in other Central and Eastern European
(CEE) countries, the development of financial intermediation, measured by the value of financial
system assets to GDP ratio, continued to exhibit a relatively low level compared with the ratio’s
average value in euro area countries (Figure 1.1.).
Table 1.1. Assets of the financial system as a percentage of GDP in selected CEE countries and in
the euro area, 2013-2016 (%)
2013 2014 2015 2016
Poland 125.9 121.4 122.8 126.3
Czech Republic 165.0 164.4 154.4 157.9
Hungary 132.9 133.3 127.0 127.2
Euro area 470.6 493.8 463.6 486.6
Notes: Data for the euro area refer to 17 countries in 2012-2013, 18 countries in 2014 and 19 countries in 2015-2016.
Due to the change of the source of data, inclusion of assets of money market funds and adjustments sent by
central banks, the data are not comparable with the data released in previous editions of the report.
Sources: For the euro area ‒ ECB Statistical Data Warehouse and Eurostat; for other countries ‒ data are provided
by national central banks (NCBs) and GUS.
5 Sytuacja gospodarstw domowych w 2016 r. w świetle wyników badania budżetów gospodarstw domowych [The situation of
households in 2015 as evidenced by the results of the household budget survey], Information note, Warsaw, 2 June 2016,
GUS, p. 1. 6 Report on monetary policy in 2016, Warsaw May 2017, NBP, p. 9. 7 For the purpose of the report, the value of Poland's GDP in 2016 was assumed at PLN 1,851,171 million.
Information on the GUS website on 15 May 2017 (preliminary estimate).

Directions of the evolution of Poland’s financial system
12 Narodowy Bank Polski
Figure 1.1. Financial system assets in selected EU countries at the end of 2016
0
110
220
330
440
550
660
770
0
2
4
6
8
10
12
14
Germ
an
y
Ita
ly
Ne
the
rla
nds
Sp
ain
Be
lgiu
m
Au
str
ia
Po
lan
d
Slo
vakia
Slo
ven
ia
Esto
nia
Monetary financial institutions – left-hand scale Investment funds – left-hand scaleInsurance companies – left-hand scale Pension funds – left-hand scaleFinancial system assets/GDP – right-hand scale
%EUR billion
Sources: Calculations based on ECB, Eurostat, OECD, GUS and NBP data.
According to another measure of the level of financial development, the Financial Development
Index (FD)8, which is more comprehensive than the asset to GDP ratio, Poland can be classified
into the group of countries with a medium level of financial development (for Poland, the FD
index was 0.48).9 This means that Poland is ranked 39th among 183 countries analysed in the IMF
paper and 18th among EU countries.10 Hungary (0.46), Slovenia (0.46) and Croatia (0.40) had a
similar level of development. The remaining countries of the region had a significantly lower
level: Bulgaria (0.38), Czech Republic (0.36), Estonia (0.33), Slovakia (0.31), Latvia (0.29),
Lithuania (0.27) and Romania (0.21).
An analysis of financial institutions and markets of various countries against the backdrop of
their economic development implies that some segments of Poland’s financial system, including
the banking sector, remain relatively poorly developed. A specific feature of the Polish financial
system is the relatively low stock market capitalisation and the low value of outstanding private
sector debt securities, including corporate and bank bonds (Figure 1.2).
8 See: R. Sahay, M. Cihak, P. N'Diaye, A. Barajas, D. A. Pena, R. Bi, Y. Gao, A’ Kyobe, L. Nguyen, C. Saborowski,
K Svirydzenka, R. Yousefi, Rethinking Financial Deepening: Stability and Growth in Emerging Markets, IMF Staff
Discussion Note SDN/15/08, May 2015, IMF. The IMF-developed Financial Development Index (FD) was
discussed in Financial System in Poland 2014, Warsaw 2015, NBP, pp. 29-32. The data cited in this report come
from K. Svirydzenka Introducing a New Broad-based Index of Financial Development, IMF Working Paper, WP/16/5,
January 2016, IMF. 9 Values of the indicator are in the range of <0 ; 1>. FD-associated data for Poland and other countries of the region
are for the year 2014. 10 Poland is ranked 23rd in the EU, in terms of GDP per capita.

Directions of the evolution of Poland’s financial system
13 Financial System in Poland 2016
Figure 1.2. Financial system development depending on the level of GDP per capita
0
10
20
30
40
50
60
70
80
90
100
110
7.5 8 8.5 9 9.5 10
Se
gm
ents
of
the
fin
ancia
l se
cto
r
(% o
f G
DP
)
Logarith of GDP per capita (in PPP)
Banking sector Banking sector – actual values in PolandEquity market Equity sector – actual values in PolandDebt securities of public sector Debt securities of public sector – actual values in PolandDebt securities of other sectors Debt securities of other sectors – actual values in PolandInsurance sector Insurance sector – actual values in Poland
20
00
20
16
20
07
Sources: NBP calculations based on data provided by the International Monetary Fund (World Economic
Outlook, 04/2013), the World Bank (Financial Structure Dataset, 04/2013) as well as GUS, Office of the Polish
Financial Supervision Authority (UKNF), Warsaw Stock Exchange (WSE), Fitch Polska and NBP.
Note: Values of the regression function presented in the figure were estimated for panel data which included
information on the financial systems of 203 countries for the years 1991-2012.
The following development measures of the individual sectors of the financial systems were used:
banking sector: loans to non-public sector to GDP (for Poland ‒ banking sector’s loans and advances to the
non-financial sector in domestic currency and foreign currency),
equity market: capitalisation of domestic companies of the WSE Main List to GDP,
insurance market: non-life and life insurance premium to GDP,
public sector debt securities: outstanding value of general government debt securities to GDP,
debt securities of other sectors: outstanding value of debt securities of financial institutions and enterprises to
GDP.
More in: T. Beck, A. Demirgüç-Kunt, Financial Institutions and Markets across Countries and over Time: Data and
Analysis, World Bank Policy Research Working Paper No. 4943, May 2009.
The regression function was estimated using the Fixed Effects GLS in relation to the banking sector and equity
market, and the Random Effects GLS in relation to debt securities of the public sector, other sectors and the
insurance sector. The model was selected on the basis of the Hausman test (M. Verbeek, A Guide to Modern
Econometrics, 2004 John Wiley & Sons, pp. 351-352).
The different levels of economic development of the individual components of the Polish
financial system are also indicated by the results of the analysis of the sub-indices comprising the
overall index of financial development (FD). The sub-index FI (0.598), defining the level of
development of Financial Institutions, was significantly higher than the sub-index FM (0.362),
which reflects the level of development of Financial Markets. This shows that the development of
financial markets in Poland is relatively lower compared with other countries, in particular with
countries with higher GDP. In countries with advanced financial systems (measured by the FD
index) and higher levels of economic development (measured by GDP per capita), the
importance of financial markets in the functioning and development of a financial system is
greater (Figure 1.3).

Directions of the evolution of Poland’s financial system
14 Narodowy Bank Polski
Figure 1.3. The FD index and the share of the index of development of financial institutions (FI)
in the FD index depending on the level of GDP per capita in EU countries, 2014
BG
RO
HR
HU
PL
LVLT
SK
CZ
EE
EL
PT
SI
MT
CY
ES
IT
FR
UK
BE
DE
FIATNL
IE
SE
DKLU
BG
RO HR
HU
PL
LVLT SK
CZ
EE
EL
PT
SI
MT
CY
ESIT
FR
UK
BE
DE FI
AT
NL
IE
SE
DK LU
0.0
10.0
20.0
30.0
40.0
50.0
60.0
70.0
80.0
90.0
100.0
0.1
0.2
0.3
0.4
0.5
0.6
0.7
0.8
0.9
1
5000 25000 45000 65000 85000 105000
GDP per capita USD
FD left-hand scale % of FI in FD right-hand scale
%
Sources: The NBP study based on K. Svirydzenka Introducing a New Broad-based Index of Financial Development,
IMF Working Paper, WP/16/5, January 2016, IMF and on World Bank data.
The experience of the recent global crisis has shown that the excessive growth of the financial
system compared with the real economy, and also an excessive share of the banking sector in the
financial system in a number of developed European countries, causes systemic risk growth and
adversely affects economic growth.11
In the case of Poland, the size and structure of the financial system indicate that, according to
assessments by both Polish and international institutions, the country has room for its further
sustainable development to support stable economic growth. In line with recommendations, the
development should remain moderate and take place as the importance of financial markets
grows. This remark applies in particular to the capital market as a source of funding of corporate
activity and development.12
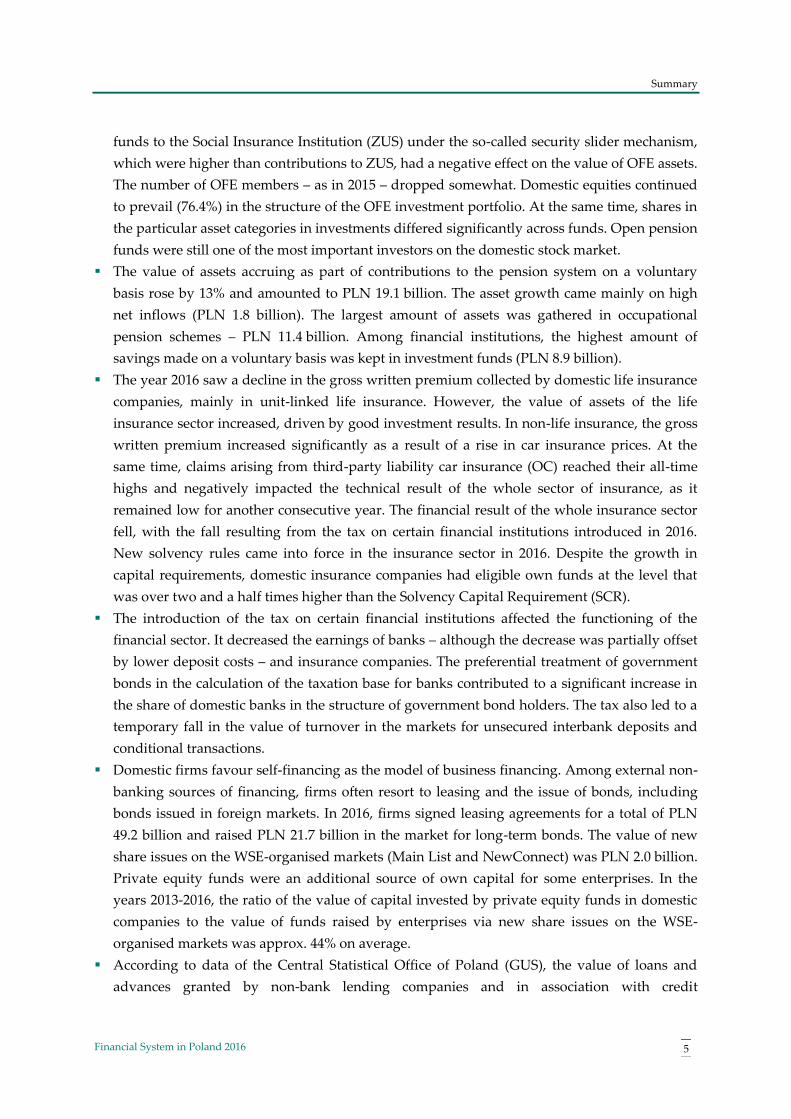
In Poland, like in other countries of the region, the banking sector continued to play a major role
in the financial system, although the Polish financial system can be regarded as one of the least
banking-oriented in CEE (Figure 1.4). This is because the sector of collective investment
undertakings, i.e. pension and investment funds and insurance companies, is larger compared
with other countries of the region.
11 S. Langfield, M. Pagano, Bank Bias in Europe: Effects on Systemic Risk and Growth, ECB Working Paper No 1797,
May 2015, European Central Bank. 12 See the position of the Ministry of Finance in Monitor Konwergencji z Unią Gospodarczą i Walutową [Monitor of
Convergence with the Economic and Monetary Union (Polish version only)], July 2017, Ministry of Finance, pp. 8-9.
Similar assessments can be found in the World Bank report Poland: Toward a Strategic, Effective, and Accountable
State. Systematic Country Diagnostic, 2017 World Bank, Washington, DC, p. 71. The report highlights the
importance of a further diversification of the financial sector by developing capital markets as a market-based
financing model is key to supporting innovation-led growth (p. 74).
Directions of the evolution of Poland’s financial system
15 Financial System in Poland 2016
Figure 1.4. Composition of financial systems in CEE countries at the end of 2016, by value of
assets
79.6 76.5 73.5 71.4
6.55.9 7.9 7.7
5.4 13.7 11.76.0
5.33.4 6.6
8.7
3.2 6.2
0
10
20
30
40
50
60
70
80
90
100
Czech Republic Hungary Poland Slovakia
Credit institutions Insurance companies Investment funds Pension funds Other financial sector institutions
%
Sources: For Slovakia, data were derived from the website of the central bank of Slovakia http://www.nbs.sk and
ECB Statistical Data Warehouse; for other countries ‒ data were provided by NCBs; for Poland ‒ by NBP.
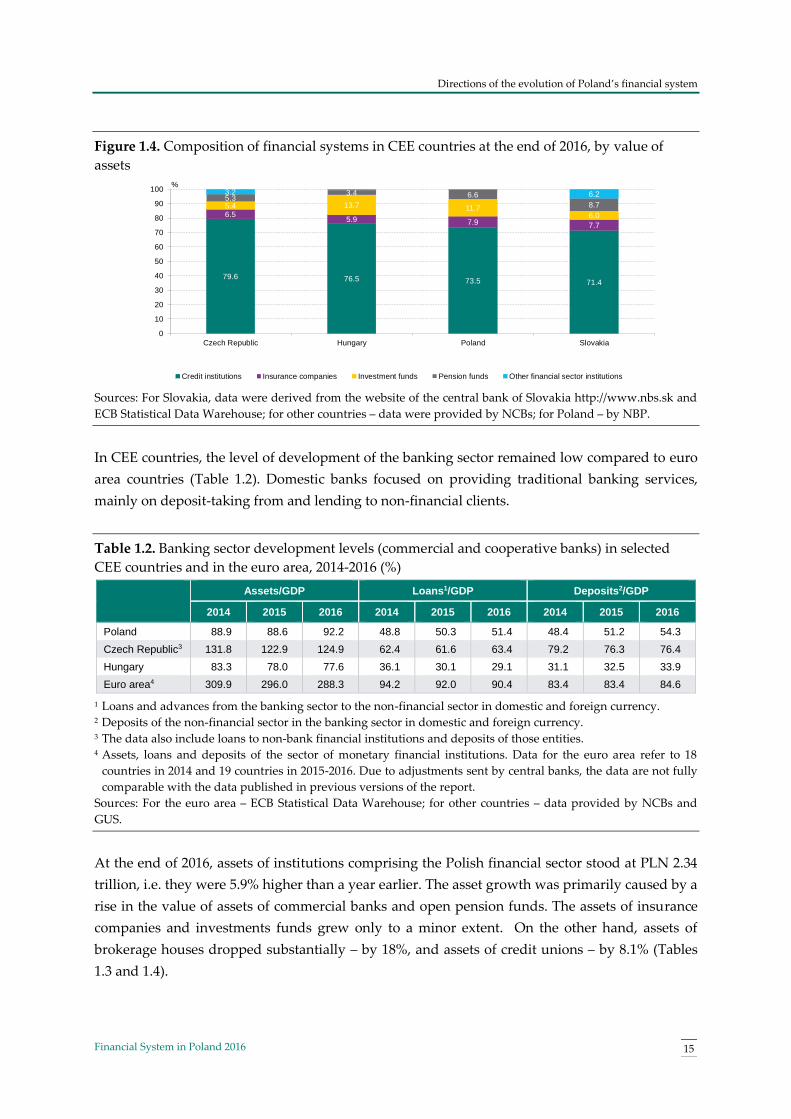
In CEE countries, the level of development of the banking sector remained low compared to euro
area countries (Table 1.2). Domestic banks focused on providing traditional banking services,
mainly on deposit-taking from and lending to non-financial clients.
Table 1.2. Banking sector development levels (commercial and cooperative banks) in selected
CEE countries and in the euro area, 2014-2016 (%)
Assets/GDP Loans1/GDP Deposits2/GDP
2014 2015 2016 2014 2015 2016 2014 2015 2016
Poland 88.9 88.6 92.2 48.8 50.3 51.4 48.4 51.2 54.3
Czech Republic3 131.8 122.9 124.9 62.4 61.6 63.4 79.2 76.3 76.4
Hungary 83.3 78.0 77.6 36.1 30.1 29.1 31.1 32.5 33.9
Euro area4 309.9 296.0 288.3 94.2 92.0 90.4 83.4 83.4 84.6
1 Loans and advances from the banking sector to the non-financial sector in domestic and foreign currency. 2 Deposits of the non-financial sector in the banking sector in domestic and foreign currency. 3 The data also include loans to non-bank financial institutions and deposits of those entities. 4 Assets, loans and deposits of the sector of monetary financial institutions. Data for the euro area refer to 18
countries in 2014 and 19 countries in 2015-2016. Due to adjustments sent by central banks, the data are not fully
comparable with the data published in previous versions of the report.
Sources: For the euro area ‒ ECB Statistical Data Warehouse; for other countries ‒ data provided by NCBs and
GUS.
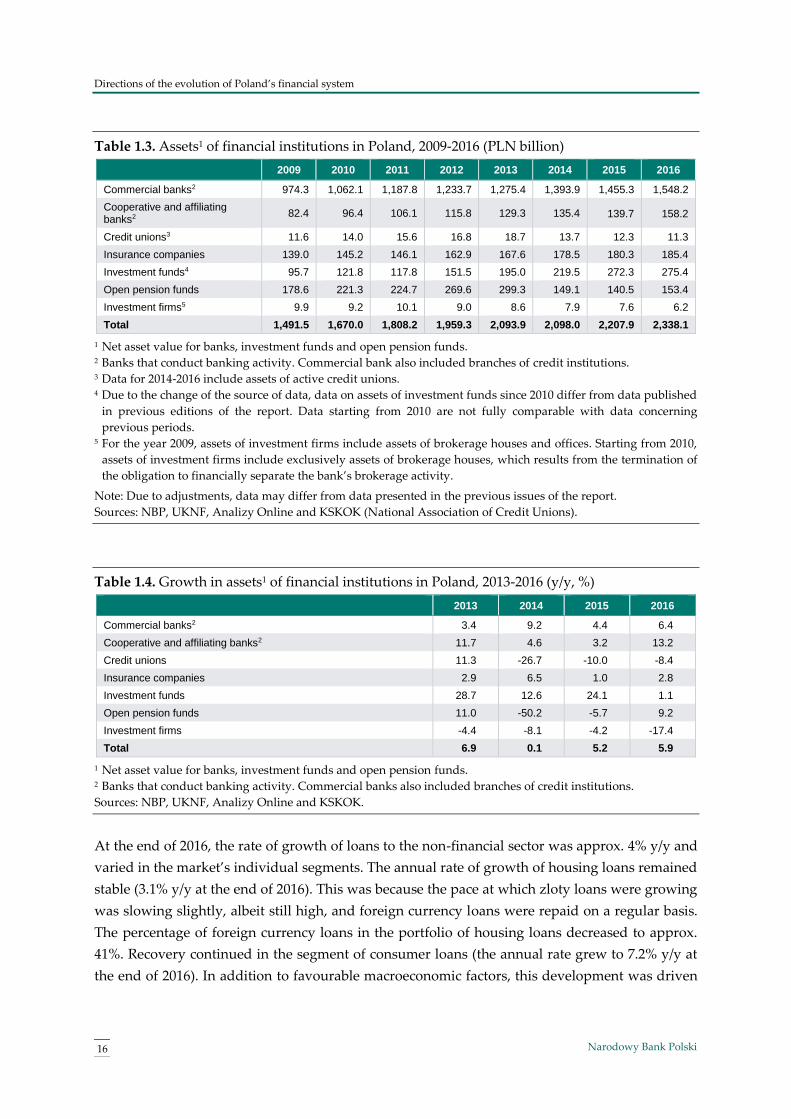
At the end of 2016, assets of institutions comprising the Polish financial sector stood at PLN 2.34
trillion, i.e. they were 5.9% higher than a year earlier. The asset growth was primarily caused by a
rise in the value of assets of commercial banks and open pension funds. The assets of insurance
companies and investments funds grew only to a minor extent. On the other hand, assets of
brokerage houses dropped substantially – by 18%, and assets of credit unions – by 8.1% (Tables
1.3 and 1.4).
Directions of the evolution of Poland’s financial system
16 Narodowy Bank Polski
Table 1.3. Assets1 of financial institutions in Poland, 2009-2016 (PLN billion)
2009 2010 2011 2012 2013 2014 2015 2016
Commercial banks2 974.3 1,062.1 1,187.8 1,233.7 1,275.4 1,393.9 1,455.3 1,548.2
Cooperative and affiliating banks2
82.4 96.4 106.1 115.8 129.3 135.4 139.7 158.2
Credit unions3 11.6 14.0 15.6 16.8 18.7 13.7 12.3 11.3
Insurance companies 139.0 145.2 146.1 162.9 167.6 178.5 180.3 185.4
Investment funds4 95.7 121.8 117.8 151.5 195.0 219.5 272.3 275.4
Open pension funds 178.6 221.3 224.7 269.6 299.3 149.1 140.5 153.4
Investment firms5 9.9 9.2 10.1 9.0 8.6 7.9 7.6 6.2
Total 1,491.5 1,670.0 1,808.2 1,959.3 2,093.9 2,098.0 2,207.9 2,338.1
1 Net asset value for banks, investment funds and open pension funds. 2 Banks that conduct banking activity. Commercial bank also included branches of credit institutions. 3 Data for 2014-2016 include assets of active credit unions. 4 Due to the change of the source of data, data on assets of investment funds since 2010 differ from data published
in previous editions of the report. Data starting from 2010 are not fully comparable with data concerning
previous periods. 5 For the year 2009, assets of investment firms include assets of brokerage houses and offices. Starting from 2010,
assets of investment firms include exclusively assets of brokerage houses, which results from the termination of
the obligation to financially separate the bank’s brokerage activity.
Note: Due to adjustments, data may differ from data presented in the previous issues of the report.
Sources: NBP, UKNF, Analizy Online and KSKOK (National Association of Credit Unions).
Table 1.4. Growth in assets1 of financial institutions in Poland, 2013-2016 (y/y, %)
2013 2014 2015 2016
Commercial banks2 3.4 9.2 4.4 6.4
Cooperative and affiliating banks2 11.7 4.6 3.2 13.2
Credit unions 11.3 -26.7 -10.0 -8.4
Insurance companies 2.9 6.5 1.0 2.8
Investment funds 28.7 12.6 24.1 1.1
Open pension funds 11.0 -50.2 -5.7 9.2
Investment firms -4.4 -8.1 -4.2 -17.4
Total 6.9 0.1 5.2 5.9
1 Net asset value for banks, investment funds and open pension funds. 2 Banks that conduct banking activity. Commercial banks also included branches of credit institutions.
Sources: NBP, UKNF, Analizy Online and KSKOK.
At the end of 2016, the rate of growth of loans to the non-financial sector was approx. 4% y/y and
varied in the market’s individual segments. The annual rate of growth of housing loans remained
stable (3.1% y/y at the end of 2016). This was because the pace at which zloty loans were growing
was slowing slightly, albeit still high, and foreign currency loans were repaid on a regular basis.
The percentage of foreign currency loans in the portfolio of housing loans decreased to approx.
41%. Recovery continued in the segment of consumer loans (the annual rate grew to 7.2% y/y at
the end of 2016). In addition to favourable macroeconomic factors, this development was driven

Directions of the evolution of Poland’s financial system
17 Financial System in Poland 2016
by the absence of major changes in banks' lending policy. 2016 saw a substantial decline in
corporate lending growth (3.9% y/y at the end of 2016). The decline was driven by a slower pace
of investment lending growth and a negative rate of growth of current loans (since mid-2016),
primarily at large enterprises. The share of corporate loans in total loans did not change
significantly in 2016.
Throughout 2016, the net assets of investment funds grew slightly and amounted to PLN 275.4
billion at the end of December. For the first time since 2008, the institutions registered a net
outflow of funds. In the period under analysis, assets of open pension funds increased by 9.2%.
The trends discussed earlier in the text led to a slight increase in the share of the banking sector in
the structure of financial system assets (Figures 1.5 and 1.6).
Figure 1.5. Asset structure of the Polish financial system, 2009-2016
2009 2010 2011 2012 2013 2014 2015 2016
0
20
40
60
80
100
Banks Credit unions Insurance companies Investment funds Open pension funds Investment firms
%
Sources: NBP, UKNF, Analizy Online and KSKOK.
Figure 1.6. Share of individual financial institutions in the asset structure of the Polish financial
system in 2015 and 2016
A. 2015 B. 2016
72.3%
0.6%
8.2%
12.3%
6.4% 0.3%
Banks Credit unions Insurance companies
Investment funds Open pension funds Investment firms
73.0%
0.5%
7.9%
11.7%
6.6% 0.3%
Banks Credit unions Insurance companies
Investment funds Open pension funds Investment firms
Sources: NBP, UKNF and Analizy Online.
Directions of the evolution of Poland’s financial system
18 Narodowy Bank Polski
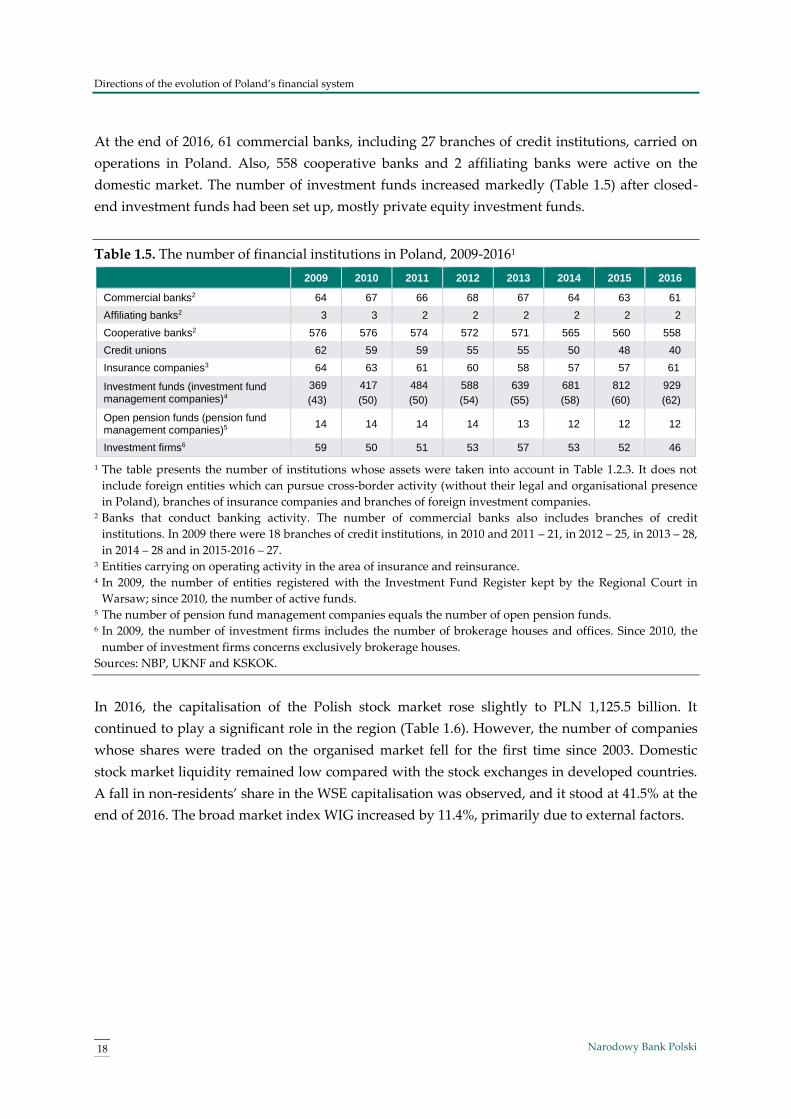
At the end of 2016, 61 commercial banks, including 27 branches of credit institutions, carried on
operations in Poland. Also, 558 cooperative banks and 2 affiliating banks were active on the
domestic market. The number of investment funds increased markedly (Table 1.5) after closed-
end investment funds had been set up, mostly private equity investment funds.
Table 1.5. The number of financial institutions in Poland, 2009-20161
2009 2010 2011 2012 2013 2014 2015 2016
Commercial banks2 64 67 66 68 67 64 63 61
Affiliating banks2 3 3 2 2 2 2 2 2
Cooperative banks2 576 576 574 572 571 565 560 558
Credit unions 62 59 59 55 55 50 48 40
Insurance companies3 64 63 61 60 58 57 57 61
Investment funds (investment fund management companies)4
369
(43)
417
(50)
484
(50)
588
(54)
639
(55)
681
(58)
812
(60)
929
(62)
Open pension funds (pension fund management companies)5
14 14 14 14 13 12 12 12
Investment firms6 59 50 51 53 57 53 52 46
1 The table presents the number of institutions whose assets were taken into account in Table 1.2.3. It does not
include foreign entities which can pursue cross-border activity (without their legal and organisational presence
in Poland), branches of insurance companies and branches of foreign investment companies. 2 Banks that conduct banking activity. The number of commercial banks also includes branches of credit
institutions. In 2009 there were 18 branches of credit institutions, in 2010 and 2011 ‒ 21, in 2012 ‒ 25, in 2013 ‒ 28,
in 2014 ‒ 28 and in 2015-2016 ‒ 27. 3 Entities carrying on operating activity in the area of insurance and reinsurance. 4 In 2009, the number of entities registered with the Investment Fund Register kept by the Regional Court in
Warsaw; since 2010, the number of active funds. 5 The number of pension fund management companies equals the number of open pension funds. 6 In 2009, the number of investment firms includes the number of brokerage houses and offices. Since 2010, the
number of investment firms concerns exclusively brokerage houses.
Sources: NBP, UKNF and KSKOK.
In 2016, the capitalisation of the Polish stock market rose slightly to PLN 1,125.5 billion. It
continued to play a significant role in the region (Table 1.6). However, the number of companies
whose shares were traded on the organised market fell for the first time since 2003. Domestic
stock market liquidity remained low compared with the stock exchanges in developed countries.
A fall in non-residents’ share in the WSE capitalisation was observed, and it stood at 41.5% at the
end of 2016. The broad market index WIG increased by 11.4%, primarily due to external factors.

Directions of the evolution of Poland’s financial system
19 Financial System in Poland 2016
Table 1.6. Characteristics of stock markets in selected CEE countries and in the euro area, 2014-
20161
Capitalisation of domestic companies
(EUR billion)
Capitalisation of domestic companies to GDP (%)
2014 2015 2016 2014 2015 2016
Poland2 140.7 123.2 128.1 34.9 29.2 30.6
Czech Republic 22.6 23.5 22.2 14.5 14.1 12.6
Hungary 12.0 16.2 21.3 11.5 14.9 18.9
Euro area3 6,298.0 6,774.6 7,081.8 62.5 65.1 66.0
Liquidity ratio4 (%) Number of listed companies (including foreign companies)
2014 2015 2016 2014 2015 2016
Poland 40.5 44.3 36.4 902 (30) 905 (33) 893 (32)
Czech Republic 19.1 20.9 23.8 23 (10) 25 (10) 25 (11)
Hungary 50.6 42.8 35.7 48 (0) 45 (0) 42 (0)
Euro area3 74.1 80.2 64.8 6,748 (483) 6,900 (440) 6,723 (420)
1 All values also include alternative trading systems, if such platforms were run by the operator of a given stock
exchange. 2 Calculations of values for Poland were based on WSE and GUS data using the average NBP exchange rates at
the end of particular years. 3 Indices calculated for the euro area include the following stock exchanges: Athens Exchange, Cyprus Stock
Exchange, Deutsche Börse, Euronext, Irish Stock Exchange, Ljubljana Stock Exchange, Luxembourg Stock
Exchange, Malta Stock Exchange, NASDAQ OMX Nordics & Baltics, Spanish Exchanges (BME) and Wiener
Börse. 4 The ratio of net turnover value of the shares of domestic companies to stock market capitalisation at the end of
the year.
Note: Due to data revisions, data may differ from data presented in previous editions of the report.
Sources: Eurostat, Federation of European Stock Exchanges (FESE), WSE and GUS.
The money bills market remained the largest segment of the domestic market for long-term debt
instruments. The fall in the annual average value of outstanding money bills, which continued
during 2016, reflected a steady decrease in excess liquidity in the domestic banking sector. Apart
from a small issue of Treasury bills (for the first time in two years), the State Treasury financed
borrowing needs exclusively with instruments with maturities longer than one year. Enterprises
and banks used short-term debt securities issues to finance their needs only to a minor extent.
Like in previous years, the Treasury bond market remained the dominant and most liquid
segment of the domestic long-term debt securities during 2016 (Table 1.7). The Polish Treasury
bond market was also the largest market for these instruments in CEE and the 9th largest market
in the EU.
In 2016, the average daily turnover of unconditional transactions in Treasury bonds amounted to
PLN 12.5 billion and in the case of Treasury bills it was less than PLN 60 million. The market for

Directions of the evolution of Poland’s financial system
20 Narodowy Bank Polski
non-Treasury long-term debt instruments was still relatively poorly developed. The share of non-
Treasury instruments in the domestic market for long-term debt securities decreased from 21.0%
at the end of 2015 to 20.3% at the end of 2016.
As in previous years, a fall in turnover was observed in the deposit transactions markets, which
is used mainly by financial institutions to manage liquidity on a day-to-day basis. An exception
was in the case of transactions in FX swaps. The most liquid segment of the Polish money market
was the conditional transactions market, where Treasury-bond-collateralised SBB operations
prevailed. The average daily value of conditional transactions went down by over 4.6%. At the
same time, the trade in the market for FX swaps went up by almost 16.5% (Table 1.8).
Table 1.7. Outstanding value of individual instruments of money and capital markets as of year-
end, 2013-2016 (PLN billion)
2013 2014 2015 2016
Treasury bills 0.0 0.0 0.0 0.0
NBP bills 131.4 110.6 98.8 81.38
Short-term bank debt securities 4.2 5.1 5.0 4.7
Short-term corporate bonds 16.2 13.5 7.3 7.8
Marketable Treasury bonds 565.7 482.9 513.4 576.7
BGK bonds for National Road Fund 25.4 19.6 19.4 22.7
Long-term corporate bonds 37.8 54.2 65.2 69.0
Municipal bonds 18.6 19.1 20.0 19.9
Long-term bank debt securities1 20.0 25.1 26.5 27.4
Covered bonds 3.3 4.1 5.4 7.6
1 The data include only bonds and bank securities, denominated in the Polish zloty and in foreign currency,
issued by banks operating in Poland. European Investment Bank bonds and bonds issued by EU credit
institutions were also traded in the domestic market.
Note: Due to revisions, data may differ from data presented in previous editions of the report.
Sources: Ministry of Finance (MF), NBP, KDPW and Fitch Polska.
As in previous years, the majority of zloty exchange transactions and OTC FX derivatives were
concluded in the offshore market, mostly in London. This means that the zloty exchange rate is
largely determined by operations executed between non-residents. In the case of derivatives, the
OTC market is much better developed, in terms of turnover value and variety of financial
instruments offered. Investor activity in the exchange-traded derivatives market continued to
concentrate in the segment of WIG20 futures.

Directions of the evolution of Poland’s financial system
21 Financial System in Poland 2016
Table 1.8. Average daily net turnover in the domestic financial market, 2013-2016 (PLN million)
2013 2014 2015 2016
Equity and debt instruments market
Shares and allotment certificates 1,041.8 941.0 905.3 811.4
Treasury bonds 30,113.8 27,158.9 24,325.3 27,167.1
Treasury bills 286.9 0.0 0.0 101.3
Deposit transactions market
FX swap transactions 9,508.6 10,336.4 11,779.2 13,729.2
Repo/SBB transactions 14,508.2 15,249.9 14,454.3 13,781.2
Unsecured interbank deposits 5,563.3 4,554.9 3,923.1 3,806.6
Derivatives transactions market
FX forwards 1,396.1 1,795.0 1,653.0 1,793.8
CIRS transactions 188.3 183.5 136.6 173.6
Currency options 273.3 399.2 331.7 350.1
FRAs 5,772.7 4,404.8 3,435.4 2,608.0
IRSs 2,100.0 2,422.4 2,361.0 2,533.4
OISs 441.4 520.8 236.5 125.1
WIG20 futures 813.8 850.1 781.5 676.1
Spot FX market 5,106.8 5,549.3 6,290.8 6,727.1
Notes: 1. Average daily net turnover means the value of transactions (turnover calculated individually). In the
case of the FX swap market, turnover value was calculated for only one currency of the transaction.
2. The value of turnover in the Treasury bond and bills market takes into account unconditional and conditional
transactions (repo and sell-buy-back). In 2013, the average daily value of unconditional transactions in the market
amounted to PLN 14.3 billion for bonds and PLN 70 million for bills. In 2014, the value of such transactions for
Treasury bonds was PLN 11.1 billion, while in 2014 it was PLN 9.3 billion (in these years, Treasury bills were not
traded). In 2016, average daily turnover in the market of unconditional transactions was PLN 12.5 billion for
Treasury bonds and less than PLN 60 million for Treasury bills.
3. Due to the change of the source of data, since 2013 the values of turnover in the market for unsecured interbank
deposits have differed from the values published in previous issues of the report. Moreover, since 2013 data have
not been fully comparable with data for 2012.
4. The value of conditional transactions (repo and sell-buy-back) was calculated according to the initial exchange
value. For FX swap transactions, the net turnover value was calculated according to the initial exchange value.
5. For the following markets: FX swap, FX, FX forwards, currency options and interest rate derivatives, the value
represents the value of an exchange transaction involving the Polish zloty or PLN-denominated instruments. The
impact of changes in the population of Money Market Dealers was eliminated.
6. The turnover in shares includes the value of session and block transactions.
7. The turnover in WIG20 futures was calculated according to settlement values, taking into account session and
block transactions.
8. The turnover in the FX market includes domestic transactions only. It does not include the offshore market.
9. The turnover in the markets for interest rate derivatives refers to domestic money market rates instruments.
Sources: NBP study based on data from WSE, MF and NBP.

Households and enterprises in the financial market in Poland
22 Narodowy Bank Polski
2. Households and enterprises in the financial
market in Poland
The financial system facilitates the flow of capital between entities holding surplus funds and
those in need of funds. The circulation of funds in the financial system takes place via banks or
the financial market, where businesses issue securities (shares or bonds). Investors, including
households, can acquire securities either directly in the financial market or via financial
institutions (i.e. investment funds).
2.1. Financial assets of households
The way in which households save is determined by both microeconomic factors (e.g. their
financial standing, size and demographic structure) and macroeconomic ones (e.g. the economic
situation of the country). Depending on the impact of individual determinants, households
decide about the amount of savings and choose specific savings and investment products. The
level of savings of domestic households and the form of saving are of great importance for
economic growth and financial system development.
According to surveys of Poles' attitudes towards saving carried out over many years, nearly 2/3
of respondents said they would save for the future.13 In 2016, the number of persons convinced
that saving for the future was a worthwhile activity rose to 70% from 67% in 2015. In 2016, 54% of
the respondents actually saved money. The percentage of persons declaring that they save on a
regular basis was 13% and the percentage of savers who do it irregularly was 41%.14 According to
GUS data, the financial condition of households improved markedly in 2016. Households in all
socio-economic groups reported higher income and spent more. Despite the growth of
expenditure, the surplus of disposable income over expenditure increased, which should boost
savings’ growth.15 The average monthly disposable income per capita in the household rose, in
13 Surveys carried out by the Kronenberg Foundation. Reports on Poles’ Attitudes Towards Saving were published
in 2008-2014 and reports on Poles' Attitudes Towards Finance — in 2015-2016. 14 According to the results of the survey, Poles’ Attitudes Towards Saving, a report of the Kronenberg Foundation at
Citi Handlowy and Think! Foundation, September 2016, p. 4. 15 Household's disposable income is defined as the sum of household’s current incomes from various sources
reduced by prepayments on personal income tax made on behalf of a tax payer by the tax-remitter (…), by tax
on income from property, taxes paid by self-employed persons, including those in free professions and
individual farmers and by social security and health insurance premiums. (…) Disposable income is allocated to
expenditures and savings increase. See: Methodological notes on household budget surveying, Warsaw, 2011, GUS,
p. 33.

Households and enterprises in the financial market in Poland
23 Financial System in Poland 2016
real terms, by 7.0% (to PLN 1,475).16 Consumer sentiment improved, both with regard to the
current financial position and projected saving trends (Figure 2.1).
Figure 2.1. Public sentiment surveys on savings and dynamics of disposable income, 2009-2016
-60
-50
-40
-30
-20
-10
0
I II III IV I II III IV I II III IV I II III IV I II III IV I II III IV I II III IV I II III IV
2009 2010 2011 2012 2013 2014 2015 2016
95
100
105
110
115
120
125
Growth rate of quarterly disposable income of households – right-hand scale
Assessment of changes in financial standing of households in last 12 months – left-hand scale
Assessment of changes in money saving trends over next 12 months – left-hand scale
Average of net household assessment Growth rate
Notes: Quarterly values of disposable income were deflated by the quarterly CPI. The quarterly growth rate is
calculated with reference to the corresponding quarter of the previous year. A positive average of household
assessment balances means the preponderance of consumers who take a positive view of the changes over
consumers who take a negative view of the changes.
Sources: The calculations are based on GUS data from Non-financial quarterly accounts by institutional sectors for the
period from the 1st quarter of 2005 to the 4th quarter of 2013, at current prices, 30.05.2014, GUS; Non-financial quarterly
accounts by institutional sectors for the period from the 1st quarter of 2010 to the 1st quarter of 2017, at current prices,
18.07.2017, GUS and the results of the GUS/NBP Consumer Tendency survey (2009-2016 editions) available on the
website www.stat.gov.pl.
In 2016, household financial assets that can be used relatively freely grew by 10.0% and
amounted to PLN 1,160.4 billion at the end of December 2016.17 They represented the equivalent
of 62.7% of GDP, i.e. 4 percentage points more than compared with the previous period (Figure
2.2). This asset growth was primarily driven by changes in the value of cash in circulation and, as
in previous years, of bank deposits and investment fund units. Shares listed on the WSE held by
households also grew in value in 2016. The value of deposits kept at credit unions was observed
to decline.
16 Sytuacja gospodarstw domowych w 2016 r. w świetle wyników badania budżetów gospodarstw domowych [The situation
of households in 2015 as evidenced by the results of the household budget survey], Information note, Warsaw, 2
June 2017, GUS. 17 The following financial assets that households can freely use were considered in this analysis: deposits at banks
and credit unions, investment fund units purchased by households, unit-linked assets and life insurance saving
premiums corresponding to the value of technical provisions in life insurance, Treasury securities, stocks
quoted on the WSE-organised markets, cash in circulation (excluding bank vault cash) and non-Treasury debt
securities. Not considered in this analysis were the funds kept at accounts at open pension funds (OFE), assets
of pension fund management companies and voluntary pension funds or funds transferred to the Social
Insurance Institution by OFE in February 2014.

Households and enterprises in the financial market in Poland
24 Narodowy Bank Polski
Figure 2.2. Household financial assets1, 2009-2016
599.8
675.8724.6
761.4815.5
889.6
967.9
1,054.8
1,160.4
47.0
50.351.2
49.0
50.5
53.7
56.3
58.7
62.7
40
42
44
46
48
50
52
54
56
58
60
62
64
0
100
200
300
400
500
600
700
800
900
1000
1100
1200
2008 2009 2010 2011 2012 2013 2014 2015 2016
Financial assets of households – left-hand scale Ratio of financial assets of households to GDP – right-hand scale
PLN billion %
1The analysis takes into account household financial assets that can be used relatively freely (see Footnote 17,
p.23).
Note: Due to adjustments, data may differ from data presented in the report’s previous edition.
Sources: Based on GUS, UKNF, Analizy Online and NBP data.
Polish households prefer these methods of managing surplus cash that enable them to use funds
instantly or withdraw them easily, and are at the same time regarded as the safest.18
Statistical data on financial assets confirm the household preferences expressed in the surveys
(Figure 2.3). At the end of 2016, deposits at banks and credit unions accounted for a total of 62.4%
of household financial assets (Table 2.1). The value of cash accumulated by households totalled
PLN 170 billion, which substantially boosted the growth rate of cash in circulation (17%). The
value of bank deposits placed by households during 2016 rose by 9.7%.
18 The TNS surveys conducted in August 2016 show that 23% of respondents indicated cash as the most preferred
form of saving, 20% — savings and checking account, 18% — savings deposit and 15% — savings account. Only
3% of the respondents pointed to investment funds and shares. See: Wybrane aspekty oszczędzania w polskim
społeczeństwie [Selected aspects of saving in Polish society (available in Polish only)], Warsaw 2016, TNS and ZBP,
p. 6.

Households and enterprises in the financial market in Poland
25 Financial System in Poland 2016
Figure 2.3. Structure of household financial assets1, 2009-2016, as at period-ends
2010 2011 2012 2013 2014 2015 2016 VI 2017
0
100
200
300
400
500
600
700
800
900
1,000
1,100
1,200
Bank deposits Deposits at credit unions
Units of investment funds Units of unit-linked funds
Treasury securities Shares listed on the WSE
Non-Treasury securities Cash in circulation (without bank vault cash)
PLN billion
1 The analysis takes into account household financial assets that can be used relatively freely (see Footnote 17,
p. 23).
Notes: The category of unit-linked funds is presented jointly with life insurance saving premiums.
Sources: Study based on UKNF, Analizy Online and NBP data.
Table 2.1. Value of household financial assets1 and their structure, 2013-2016, as at period-ends
2013 2014 2015 2016
Value of household financial assets (PLN billion)
Bank deposits 536.5 592.4 650.8 713.9
Deposits at credit unions 17.6 12.7 11.9 10.9
Units of investment funds 90.4 103.2 111.8 124.3
Units of unit-linked funds and life insurance saving premiums 80.1 82.7 82.7 83.5
Treasury securities 9.3 9.3 10.7 11.8
Non-Treasury securities 1.3 1.3 1.8 2.3
Shares listed on the WSE 44.6 40.5 39.8 43.6
Cash in circulation (excluding bank vault cash) 109.8 125.8 145.3 170.0
Total 889.6 967.9 1,054.8 1,160.4
Structure of household financial assets (%)
Bank deposits 60.3 61.2 61.7 61.5
Deposits at credit unions 2.0 1.3 1.1 0.9
Units of investment funds 10.2 10.7 10.6 10.7
Units of unit-linked funds and life insurance saving premiums 9.0 8.5 7.8 7.2
Treasury securities 1.0 1.0 1.0 1.0
Non-Treasury securities 0.1 0.1 0.2 0.2
Shares listed on the WSE 5.0 4.2 3.8 3.8
Cash in circulation (excluding bank vault cash) 12.3 13.0 13.8 14.7
1 The analysis takes into account household financial assets that can be used relatively freely (see Footnote 17,
p. 23).
Note: Due to adjustments, data may differ from data presented in the report’s previous edition.
Sources: Study based on UKNF, Analizy Online and NBP data.

Households and enterprises in the financial market in Poland
26 Narodowy Bank Polski
The value of units of investment funds19 in the portfolio of households rose by 11.2%. The change
in the value of this portion of the household deposit portfolio resulted primarily from an increase
in asset valuation. A net inflow of households' funds to investment funds in the amount of PLN
4.7 billion was PLN 2.1 billion lower than in 2015. Households seeking a saving alternative to
term deposits at banks first of all chose investment funds with a low risk profile, buying mostly
units of funds investing in debt securities. Equity funds and absolute return funds also attracted
interest. The highest inflow of funds to investment funds was reported in the third quarter of
2016, when it was net PLN 3.9 billion (Figure 2.4.).
Figure 2.4. Net inflow of funds from households to investment funds and the change in value of
household bank deposits, 2015-2016
5.03.2
-1.5
0.1
-1.5
0.9
3.9
1.4
14.0
5.4
12.0
26.8
17.115.4
4.6
26.0
-5
0
5
10
15
20
25
30
I II III IV I II III IV
2015 2016
Inflow of funds to investment funds Change in the value of household deposits (banking sector)
mld złPLN billion
Note: The category of households also includes non-commercial institutions offering services to households.
Source: Calculations based on NBP data.
The value of unit-linked funds and life insurance saving premiums in the household portfolio
increased slightly in 2016. The increase came primarily as a result good investment performance,
as the inflow of new funds to unit-linked funds was substantially lower than in previous years.
The value of shares held by Poles in their investment portfolio increased by 9.5% (to PLN 43.6
billion) in the period under analysis. The increase was tied to an improved situation on the
capital market and a rise in the prices of equity instruments on the WSE-organised markets.
The year 2016 saw a 10.3% increase to PLN 1.8 billion in the value of Treasury bonds in the
portfolio of households.
19 Excluding units purchased by insurance companies as a result of life insurance contracts concluded by natural
persons with unit-linked funds.

Households and enterprises in the financial market in Poland
27 Financial System in Poland 2016
2.2. External sources of financing of Polish enterprises
The economic condition of non-financial enterprises was favourable in 2016. Their sales revenues
were 3.8% higher than in 2015 and sales result went up 14.9% and net financial result by as much
as 21.3%. Their efficiency ratios improved. The cost level indicator declined as profitability and
liquidity ratios grew.20
In 2016, corporate investment outlays were 13.2% lower than in 2015 and amounted to PLN 120.8
billion. Outlays on buildings and structures declined by 20.1%, and on machines, technical
devices, appliances and vehicles by 8.3%. The share of purchases in total outlays increased from
59.4% in 2015 to 63.4% in 2016.21 The investments were largely financed with own funds, which
reflected the investment funding priority model prevailing at Polish enterprises.22
The year 2016 saw a substantial decline in corporate credit growth (3.9% y/y at the end of the
year). The pace of investment lending growth slowed down and the rate of growth of current
loans turned negative (since mid-2016), primarily at large enterprises. The decline in corporate
loan demand was driven both by lower financing needs for fixed investment and reduced
financing needs for inventories and working capital.23 The lower demand for investment credit
followed the postponement of large infrastructure projects. On the other hand, the fall in the
growth rate of current loans may be partially explained by the rising share of enterprises that use
their own resources to finance current activity.
The growth of lending to SMEs and microenterprises was supported by the de minimis Portfolio
Guarantee Facility. The effects of the programme affected directly the programme participants
and also translated into a positive change macroeconomically.24
Leasing remained the most frequently used non-banking external source of funding for small
enterprises (Figure 2.5). 2016 saw continued rapid growth in funding provided by leasing
companies, and the number of enterprises that entered into leasing contracts also rose. The
segment of modes of transport was almost fully responsible for the growth in the value of assets
leased.
20 Financial results of non-financial enterprises 2016, Warsaw, March 2017, GUS. 21 Op. cit. 22 Dostępność finansowania przedsiębiorstw niefinansowych w Polsce, Warsaw 2016, NBP, p. 4. 23 See Senior loan officer opinion survey on bank lending practices and credit conditions. 2nd quarter 2016, Warsaw, April
2016, NBP. 24 A. Kowalczyk, T. Kaczor, Efekty programu gwarancji de minimis 2016, Warsaw, November 2016, BGK, p. 6.

Households and enterprises in the financial market in Poland
28 Narodowy Bank Polski
Figure 2.5. Selected non-banking external sources of financing of Polish enterprises, 2013-2016
6.1
2.0
5.6
2.0
15.8
21.7
24.7
21.7
1.6 1.13.3 3.1
28.631.1
36.2
49.2
0
5
10
15
20
25
30
35
40
45
50
2013 2014 2015 2016Stock issues on the WSE Long-term bond issues on the domestic market Private equity Leasing
PLN billion
Sources: Calculations based on data from Fitch Polska, GUS, KDPW, WSE, Invest Europe and NBP.
Enterprises raised PLN 21.7 billion on the domestic long-term bond market, which represented
an decline of over 12% on the 2015 figure. The number of entities that went ahead with bond
issues also dropped (from 140 in 2015 to 124 in 2016). The Polish corporate bond market was still
characterised by a relatively low industry diversification of issuers. In 2016, the share of bonds
issued by energy producing and development companies in the value of bonds sold on the
primary market amounted to around 60%. Companies dealing with trading in debt were also
actively raising capital on this market. Private issues prevailed, and some of them, like in
previous years, were related to the use of the instruments for the transfer of funds inside capital
groups.
In 2016, the value of new issues of shares by non-financial enterprises and admitted to trading in
the WSE-organised markets (WSE Main List and NewConnect) amounted to PLN 2.0 billion. On
the WSE-organised markets, IPOs were conducted by a total of 35 domestic enterprises (WSE
Main List – 19, NewConnect – 16), and shares of 7 enterprises were graduated from ASO to the
regulated market.
Funding from private equity funds was also a source of financing for the development of Polish
enterprises. In 2016, funding in the amount of PLN 3.1 billion from private equity funds was
received by 82 domestic companies. Despite the small size of the market in Poland, capital from
private equity funds is an important source of own funds of domestic companies. In the years
2013-2016, the ratio of the value of capital invested by private equity funds in such companies to
the value of financing raised by enterprises via new share issues on the WSE-organised markets
(WSE Main List and NewConnect) was on average 44%.
Households and enterprises in the financial market in Poland
29 Financial System in Poland 2016
Box 1.1.1. The impact of the introduction of the tax on certain financial institutions on Poland's
financial system.
The Act of 15 January 2016 on the Tax on Certain Financial Institutions1, to which banks, credit unions,
insurance companies and non-bank lending companies are subject, had a substantial impact on the
behaviour of some financial institutions. The design of the tax encouraged them to take a number of
adjustment actions which, however, were limited in scope by external conditions, such as the
environment of record low interest rates or high competitive pressure on the banking market.
The effects of the introduction of the tax vary. The impact of some of the effects on the financial system
and behaviour of entities comprising the system will be permanent. The impact of other effects may
fade away over time.
Permanent effects
Banks' profitability goes down
During the first year of the Act (i.e. in 2016), the value of the tax calculated by banks for 11 months
totalled PLN 3.2 billion, which represented approx. 23% of the banking sector's net profit (approx. 25%
of the net profit of banks during 11 months of the Act). However, after excluding the effects of one-off
events (among others, banks' revenues from the sale of a stake in Visa Europe in the amount of approx.
PLN 2 billion), which increased the earnings of the sector in 2016, the impact of the tax on the
profitability of the banking sector in 2016 is slightly stronger (approx. 27% of its net profit).
The tax also affects banks' capacity to generate capital in the long term via accumulation of profit. So far,
retained earnings have been the main source of an increase in capital (in 2000-2015 by 56.5% on
average). As this possibility of accumulating capital is reduced, banks may be forced to raised it from
other sources. The worse profitability outlook triggered by the tax may, however, hamper increasing
capital via share issues as banks' investment attractiveness is relatively lower.
Banks lower the interest on deposits
In 2016, banks lowered the interest on new term deposits, which may be regarded as an adjustment
action following the introduction of the tax. Compared with the end of 2015, an average interest rate on
new deposits of households fell by about 27 basis points (to 1.49% in December 2016) and 29 basis
points for corporate deposits (to 1.2% in December 2016). The interest on all deposits was also lowered.
By lowering the interest rate of deposits, banks were able to improve their net interest margin without
resorting to an interest rate increase on credit on a permanent basis.
Banks significantly increase their portfolios of Treasury debt securities because of their preferential treatment for
tax purposes
As Treasury debt securities are excluded from the tax base, for entities subject to this tax obligation
effective yields on domestic government bonds are higher than on other assets with similar nominal
yields. In 2016, this development led to a rise in the value of domestic bonds held by domestic banks by
37.3% (i.e. by PLN 64 billion to PLN 235 billion). Consequently, the share of domestic banks in the
structure of buyers of government bonds rose from 32.7% to 40.1% (Figure I).

Households and enterprises in the financial market in Poland
30 Narodowy Bank Polski
Figure I. Structure of investors in the domestic government bond market, including the share of
domestic banks, 2016
30
32
34
36
38
40
42
0
100
200
300
400
500
600
1-2016 2-2016 3-2016 4-2016 5-2016 6-2016 7-2016 8-2016 9-2016 10-2016 11-2016 12-2016
Domestic banks Insurance companies
Other domestic entities Foreign investors
Share of domestic banks (right-hand scale)
PLN billion %
Note: The data reflect the balance of securities accounts as at month-ends.
Source: Ministry of Finance.
The share of consumer loans (with high spreads) in lending is up
Increasing consumer loan exposures was one of the adjustment actions taken by banks in order to
maintain profits (in the context of the tax and all-time interest rate lows) (Figure 4.1.3 in Chapter 4.1).
Increasing the share of consumer loans, which exhibit a higher profitability (higher credit spreads) than
other credit segments, in the structure of the loan portfolio, allowed banks to slightly neutralise the
adverse impact of the tax.
The financial result of the insurance sector decreases
Over half of domestic insurance companies in Poland were subject to the tax, and the financial result of
the entire sector decreased on average by 13% following the entry into force of the levy. The tax may
have contributed to reducing activity of insurance companies on the market for SBB transactions.
However, one cannot clearly say that it affected prices of insurance products.
Temporary effects
Turnover in the unsecured interbank deposit market and the market of conditional transactions falls temporarily
on the last days of particular months
The adopted design of the tax led to marked, albeit temporary, falls in the turnover on the unsecured
interbank deposit market towards the end of the month. This had a secondary influence on the decrease
of the reference rates2 of the domestic money market for short-term deposits on these days (Figure 5.1.4
in Chapter 5.1). These effects were most evident immediately after the introduction of the tax, i.e. in
February and March 2016, as the impact of the tax on the functioning of the domestic money market in
subsequent months weakened.
Banks temporarily raise the cost of credit during the term of the tax
Although some banks declared that they would raise spreads in less profitable market segments (i.e.
mostly for housing and corporate loans) and non-interest loan costs (in the corporate loan segment), the
actual rise of credit spreads recorded in the statistics of NBP interest rates was, however, temporary,
given competitive pressure and limited loan demand from enterprises. These two factors reduced the
banks' capacity to offset tax expenses with higher credit spreads in the longer term.

Households and enterprises in the financial market in Poland
31 Financial System in Poland 2016
Other changes after the introduction of the tax
Moreover, other changes occurring after the introduction of the tax can be identified; however, in their
case the direct impact of the tax is ambiguous and difficult to assess. The following changes are listed
below:
A fall in total lending growth
The growth rate of loans to the non-financial sector decreased from 5.1% at the end of 2015 to 3.9% at
the end of 2016. In this case, demand factors, especially in the enterprise sector, were relevant.
Therefore, it is difficult to clearly determine to what extent the tax affected lending.
The growth of the scale of leasing activity remains high and corporate external debt grows
The tax may have boosted the attractiveness of leasing and foreign funding, because the providers of
this form of funding are not subject to the tax and can offer relatively more favourable terms to
entrepreneurs. In 2016, the changes occurring in the categories did not deviate substantially from the
historical trends, therefore it is difficult to say that the bank tax led to the substitution of domestic bank
credit for the funding sources.
1 The design of the tax is described in detail in Chapter 2.1. 2 Towards the end of months, participants in WIBID/WIBOR reference rate fixing quoted the lowest bid rates, thus
discouraging other fixing participants from placing deposits with them. In view of the maximum spread defined in the
Rules and regulations for fixing, this exerted downward pressure on offer rates.

www.nbp.pl