national agricultural bank
TRANSCRIPT

A nnual Repor t 20 09 - Nat ional Agr icultur al Bank
NatioNal agricultural BaNk
aNNual rEPort 2009

A nnual Repor t 20 09 - Nat ional Agr icultur al Bank
2

A nnual Repor t 20 09 - Nat ional Agr icultur al Bank
3
coNtENts
general Presentation of the National agricultural Bank 6
Board Of Directors 7
Structure Of Capital & Vote Entitlement 8
Access Conditions To Meeting 9
Economic situation 11
The International Economic Situation 12
The National Economic Situation 13
activity at the National agricultural Bank 17
Resources 20
Jobs 25
Position On The Money Market And Liquidity 31
Banking Operations Abroad 31
Intermediary Balances For Management And Profits 32
Communication And Marketing Policy 35
Organisation And Information System 36
Human Resources 37
In-House Governance And Internal Audit 39
BNA Shares On The Stock Exchange 40
Prospects 41
individual Financial statements 44
Notes relating to the individual Financial statements 49
general report of the auditor on the Financial statements 69
special report of the auditor on the Financial statements 71
resolutions adopted By the ordinary general assembly 74
activity at the BNa group 77
Consolidated financial situation 78
Perimeter of Consolidation 84
Consolidated Financial Statements 85
Notes on Consolidated Financial Statements 89
Auditors Report on the Consolidated Financial Statements. 110

A nnual Repor t 20 09 - Nat ional Agr icultur al Bank
4

A nnual Repor t 20 09 - Nat ional Agr icultur al Bank
5
general Presentation of the National agricultural Bank 6
Board Of Directors 7
Structure of Capital & Vote Entitlement 8
Access Conditions To Meeting 9
gENEral PrEsENtatioN oF thE NatioNal agricultural BaNk

A nnual Repor t 20 09 - Nat ional Agr icultur al Bank
6
Denomination : NatioNal agricultural BaNk
Juridical shape : a Public limited company with governing and general Directorate
Nationality : tunisian
Registered Office : rue Hédi Nouira 1001 tunis
Telephone : (00 216) 71 831 000 / (00 216) 71 831 200
Telex : NaBattu 14 130 / BaNatu 15 436 / DirBNa 13 220
Swift number : BNtEtNtt
Website address : www.bna.com.tn
Constituting date : June 1, 1959
Duration : 99 years
Trade register : B142431996 tuNiS
Fiscal number : 000 123 laM 000
Registered capital : 160,000,000 tunisian Dinars
Period : From the 1st of January to December the 31th of each year
Purpose : Banking activity
Fiscal system : common law.
gENEral PrEsENtatioN oF thE NatioNal agricultural BaNk

A nnual Repor t 20 09 - Nat ional Agr icultur al Bank
7
Board oF dirEctors
■ Board of directors
Chairman : Mr. Moncef Dakhli
Members : - the Ministry of Finance
represented by Mr. Maher Zouari and Mr. Ismail Hamadi.
- the Ministry of Development and international cooperation
represented by Mr. Lotfi Frady.
- the Ministry of the agriculture and of the Hydraulic resources
represented by Mr. Ali Aydi.
- the « office des céréales »
represented by Mr. Youssef Neji.
- the « caisse Nationale de Sécurité Sociale »
represented by Mr. Khalil Belhaouen.
- the « office du commerce de la tunisie »
represented by Mr. Slaheddine Makhloufi.
- the « caisse tunisienne des assurances Mutuelles agricoles »
represented by Mr. Mansour Nasri.
- Mr. Sahbi Mahjoub.
- Mr. ali El Hlioui.
- Mr. Mustapha lahmar.
■ Government controller
Mr. Mahmoud Montassar Mansour
■ independant auditors
- « la générale d’audit et conseil »
represented by Mr. Chiheb Ghanmi.
- « commissariat, Management, conseil »
represented by Mr. Cherif Ben Zina.

A nnual Repor t 20 09 - Nat ional Agr icultur al Bank
8
structurE oF caPital aNd VotE ENtitlEmENt■ structure of capital and vote entitlement
At the end of 2009 the allocation of registered capital and vote entitlement were as follows :
Number of shares amount in tNd %
State 7,517,319 37,586,595 23,49
Public Companies 8,509,484 42,547,420 26,59
Partially Public Companies 5,143,467 25,717,335 16,08
Private 10,829,730 54,148,650 33,84
total at dec 31,2009 32,000,000 160,000,000 100,00
23,5%33,8%
16,1%
26,6%
Private
partially public compagnies
Public Companies
State

A nnual Repor t 20 09 - Nat ional Agr icultur al Bank
9
accEss coNditioNs to mEEtiNg■ access conditions to meetinG
In accordance with article 40 of the status, only the shareholders whose have at least ten paid-up
shares are entitled to take part in meeting after simple presentation of identity proof.
The shareholders whose have at least ten shares have the power to join together and choose one
of the group to represent them. This operation require a signed mandate which can be gave to
the mandatory or deposited at the head office of the Bank five days at least before the meeting.

A nnual Repor t 20 09 - Nat ional Agr icultur al Bank
10

A nnual Repor t 20 09 - Nat ional Agr icultur al Bank
11
Economic situation 11
The International Economic Situation 12
The National Economic Situation 13
EcoNomic situatioNiN 2009

A nnual Repor t 20 09 - Nat ional Agr icultur al Bank
12
EcoNomic situatioNiN 2009■ economic situation in 2009
I / The International Economic Situation
At the international level, economic conditions in 2009 were marked by ongoing financial unrest,
causing lower production and collapse of world trade. Tighter credit and a brutal drop in stock
values along with loss of confidence among consumers and investors in most countries brought
about the onset of recession in the economies of industrialized countries and slowing of growth
in emerging countries. Starting the third quarter of 2009, an end to recession and economic
recovery were made possible by better financial conditions and coordinated monetary and
budgetary intervention. Governments and monetary authorities adopted diversified strategies,
including expansionary monetary policies such as injection of liquidity and reduction of key
interest rates at record lows, as well as discretionary plans for budgetary recovery that although
meant to boost economic activity in fact led to increased public debt and higher budget deficits.
In this context, real GDP around the world fell by 0.6% in 2009 after rising by 3.4% in 2008.
In the United States, credit tightened at a faster pace, financial assets depreciated and consumer
confidence plummeted, bringing about the deepest recession since the great crash of the 1930s.
Still, thanks to better economic conditions and growing activity in the third quarter of 2009, real
GDP in the United States dropped by just 2.4% compared to 1.3% growth in 2008.
In the euro zone, GDP posted a drop of some 4.1% in 2009 after 0.7% growth in 2008. In effect,
economic activity was affected by the extreme shock to financial systems, the collapse of
confidence in the wake of sharp reduction in household consumer and corporate investment
outlays, as well as the harmful repercussions of exposing the banking system to US financial
assets.
In Japan, economic activity picked up starting the third quarter of 2009 thanks to renewed
domestic demand and net exports, despite aggravation in the first half of the year of problems in
the export sector due to appreciation of the yen on the one hand and tightening of credit on the
other.
Emerging and developing countries were not immune to the drop in economic activity. In effect,
it was only in the second half of 2009 that the process of economic recovery was clearly seen to
be under way, thanks to budgetary recovery measures and expansionary monetary policies, a

A nnual Repor t 20 09 - Nat ional Agr icultur al Bank
13
return to capital inflows, and positive trends on stock and real estate markets. China in particular
posted economic growth at some 8.7% in 2009 vs. 9% a year earlier, especially in the wake of
measures undertaken to boost domestic demand.
In this framework, falling economic activity brought about net deterioration in conditions on the
job market. The unemployment rate went up in the United States and the euro zone to 10% for
2009 vs. 5.8% and 8.2% respectively for 2008. In Japan, unemployment rose from 4.3% in 2008
to 5.1% in 2009.
On another front, after a long period of decreasing inflationary pressure, consumer prices went
up in the main industrialised countries starting in November 2009. Inflation rates for 2009 as a
whole came to -0.4% in the United States, 0.3% in the euro zone and -1.4% in Japan, vs. 3.8%,
3.3% and 1.4% respectively in 2008.
On international foreign exchange markets, the euro closed for the year 2009 at USD 1,4326 - 2.5%
more than at the end of 2008, due to investor optimism about economic activity and the difference
in interest rates between the United States and the euro zone. The yen depreciated against the
dollar by 2.5% in 2009.
Stock indexes were up considerably by the end of 2009, in particular on European stock
exchanges, after having posted record lows in March. Thanks to economic recovery and growing
international demand as investor confidence and optimism returned, stock market indexes rose
by 19% for the Dow Jones and the Nikkei, 22% for the CAC 40 and 44% for the Nasday.
II / The National Economic Situation
At the national level, despite repercussions from the world economic and financial crisis on
production and foreign trade as well as tourism and air transport, Tunisia’s economy continued
to grow thanks to higher agricultural production and steady progress in service activities.
Ongoing implementation of timely measures to help companies encountering difficulties along
with adoption of appropriate monetary policy helped maintain overall balances and keep prices
down. Thus the Tunisian economy posted a growth rate of 3.1% in 2009.
1 - agriculture and fishing
The cereal harvest for the 2008-2009 agricultural year came to a record level of 25.3 million
quintals (compared to 11.9 million the year before) for an increase of 113%. Imported quantities
A nnual Repor t 20 09 - Nat ional Agr icultur al Bank
14
for all varieties of cereals came to 2,314,000 tonnes worth 828 MD for 2009, a drop of 23.9% in
terms of volume and 44.2% in terms of value compared to the previous year’s figures.
In tree crops, production of olive oil fell to 160,000 tonnes for the 2008-2009 season, down from
200,000 tonnes the year before. Exports of olive oil for this campaign came to 142,000 tonnes
worth 533 MD vs. 169,000 tonnes and 759 MD the previous season.
The date harvest came to 162,000 for the 2008-2009 season, compared to 145,000 tonnes the
year before, an increase of 11.7%, leading to higher figures for exports in terms of both quantity
and value.
Citrus production came to 297,000 tonnes for the 2008-2009 season, down from 300,000 tonnes
the year before. This decrease was caused largely by a 27,000 tonne drop in production of
Maltese oranges.
In the livestock sector, production of fresh milk rose by 3.7% to 1,048,000 tonnes in 2009 vs.
1,010,000 tonnes a year earlier.
In the field of fishing and aquaculture, production came to 90,000 tonnes in 2009 compared to
100,300 tonnes in 2008, a drop of 10.3%. Exports of seafood in 2009 were down by some 18.5% to
16,300 tonnes in terms of quantity and by 23.4% to 182 MD in terms of value.
2 - industrial activity
The general index for industrial production fell by 4.9% in 2009, after going up by 3.2% the year
before. This drop involved mainly mechanical/electrical industries (-19.6%) and textiles (-12.4%).
Exports by the energy sector dipped by 35.3% in 2009 (after growing by 30% in 2008) and exports
by the mining sector went down by 56% in 2009 (vs. 127% in 2008). Imports of raw materials and
semi-finished products fell by 21% in 2009, after increasing by 30.2% the year before.
3- tourism
The tourist sector fell slightly, mainly because of a drop in indicators on the number of foreign
tourists and tourist bednights. 6.9 million foreign tourists visited Tunisia in 2009 (vs. more than
7 million the year before), posting a drop of 2.1%. This influenced the overall number of tourist
bednights, which fell by 8.2% in 2009 after going up by 2% a year earlier. 2009 income from
tourism in foreign currency grew by 2.1% in 2009 (vs. 10.2% in 2008) to some 3460 MD.
EcoNomic situatioNiN 2009

A nnual Repor t 20 09 - Nat ional Agr icultur al Bank
15
4 - inflation
In the area of price trends, inflation posted an average of +3.7% in 2009 (down from 5% the
year before), despite the appearance of some pressure on the prices of a number of products
(especially food) in the closing months.
5 - External payments
The general balance of payments yielded a 2204 MD surplus in 2009, an increase of 151 MD
because of a 596 MD decrease in the current deficit and a 305 MD reduction in the balance of
capital and financial transactions. The drop in exports (-17.6%) was greater than that in imports
(-15%), for a 2.4 percentage point decrease in the coverage rate to 75.8% in 2009. Remittances
from Tunisians working abroad rose by 8% (+195 MD) to 2631 MD in 2009.
6 - monetary and financial balance
Conditions in the financial system were marked in 2009 by slower growth in net claims abroad
and loans to the economy, despite a higher level of net claims on the State. This situation mirrors
trends in monetary aggregates, which also posted slower growth. Thus money supply M2 went
up by 11.9% in 2009 vs. 14.5% in 2008, affected by slower growth in quasi money and faster
growth in monetary availability. Net claims abroad rose by 1574 MD in 2009 vs. 1584 MD a year
earlier, influenced mainly by the 1697 MD increase in net holdings in foreign currency. Loans to
the economy by the financial system went up by 10.5% in 2009 (vs. 14% the year before) because
of slower growth in the outstanding balance of loans from ordinary resources and a downward
trend in the outstanding balance of loans from special resources and that of commercial paper.
Net claims on the State went up by 775 MD in 2009 vs. 108 MD in 2008, leading to considerable
recovery in the outstanding balance of banks’ portfolio Treasury bonds (+468 MD in 2009). Trends
in the dinar’s exchange rate between 2008 and 2009 on average posted depreciation of 17.2%
against the Japanese Yen, 8.8% against the US Dollar and 3.9% against the Euro.

A nnual Repor t 20 09 - Nat ional Agr icultur al Bank
16

A nnual Repor t 20 09 - Nat ional Agr icultur al Bank
17
actiVity at thE B.N.aFor thE FiNaNcial yEar 2009
activity at the National agricultural Bank 17
Resources 20
Jobs 25
Position on The Money Market and Liquidity 31
Banking Operations Abroad 31
Intermediary Balances For Management And Profits 32
Communication and Marketing Policy 35
Organisation and Information System 36
Human Resources 37
In-House Governance and Internal Audit 39
BNA Shares on the Stock Exchange 40
Prospects 41

A nnual Repor t 20 09 - Nat ional Agr icultur al Bank
18
2009, marked by celebration of the 50th anniversary of the national agricultural bank BNA, was
a year of ongoing progress in the Bank’s activity, in line with the strategic choices that form the
basis of the 2009 - 2013 contract programme. These priorities target higher growth in the volume
of business, a doubling of financial profitability (despite lower interest rates) and a change in the
behaviour of a number of major institutional clients, notably in the area of financing needs.
Despite the difficult economic conditions that affected investment and foreign trade, loan policy
was based on ongoing efforts to improve the quality of claims and to increase the Bank’s market
shares, particularly the number of private individuals and small/medium businesses, which
could offset the drop in commitments by storage structures.
The Bank’s efforts to mobilise client resources focused on development of sight deposits,
especially by private parties. It sought to maintain prudent remuneration policy and to avoid
raising rates, which is becoming increasingly risky.
Furthermore, the Bank undertook a capital increase and issued a subordinated loan. Prudential
solvency and division of risk ratios improved considerably, providing the Bank with new
possibilities for growth in its activities while also meeting the prudential norms dictated by
monetary authorities.
In the area of banking operations, activity at BNA yielded a higher level of net banking proceeds,
with assignment of allotments to provisions in amounts high enough to reach the national objective
of covering risks, yielding net profits that were higher than the year before and confirming the
Bank’s profitability and solvency indicators.
As for organisation and support activities, 2009 was marked in particular by overhaul of the
Bank’s organisational chart, greater decentralisation, an improved internal audit system,
deployment of the agency system and the commitments system (applications developed in-
house), and conclusion of a market contract to establish a new hub for the information system.
Progress in human resource management in 2009 involved mainly reducing the average age
of employees through recruitment, opting for training in line with the new specialisations of
banking, and redeployment of available staff according to the needs of the Bank’s structures,
taking into account departures on retirement and the growing network of bank branches.
actiVity at thE B.N.aFor thE FiNaNcial yEar 2009

A nnual Repor t 20 09 - Nat ional Agr icultur al Bank
19
(U : 1 000D)
2005 2006 2007 2008 2009
Balance sheet structure
Total Balance Sheet 4 176 423 4 509 522 5 050 653 5 577 447 5 648 461
Resources 3 276 323 3 520 110 3 821 367 4 306 281 4 473 105
Stockholder’s Equity (before distribution of profits) 352 110 365 851 386 856 411 248 492 924
Provisions 202 750 215 819 284 095 344 760 403 504
Net commitments 4 083 793 4 518 020 5 249 766 5 632 037 5 424 479
Commitments by Disbursement 3 108 207 3 335 197 3 881 073 4 543 380 4 357 967
Surety Bonds 975 586 1 182 823 1 368 693 1 088 657 1 066 512
operations activities
Turnover 269 826 307 188 340 524 391 739 396 409
Expense on banking operations 121 207 130 413 149 293 174 089 154 859
Net banking income 148 619 176 775 191 231 217 650 241 549
General operating expenses 91 534 95 566 99 551 102 754 120 192
Operating Result 6 652 19 239 27 849 39 050 48 851
Net income 8 065 16 323 28 106 31 763 40 299
Productivity and operational efficiency
General operating expenses / N.B.I 61,59% 54,06% 52,06% 47,21% 49,76%
N.B.I / Manpower 53,7 65,8 71,8 81,5 90,2
N.B.I / Number of branches 1 032,1 1 210,8 1 309,8 1 470,6 1 538,5
Net income / Manpower 2,9 6,1 10,5 11,9 15,1
Net Income / Number of branches 56,0 111,8 192,5 214,6 256,7
Financial performance
Net Income / Total average stockholder’s equity (R.O.E) 3,83% 7,64% 12,71% 13,45% 14,24%
Net Income / Total Assets (R.O.A) 0,20% 0,38% 0,59% 0,60% 0,72%
Cook ratio 10,42% 9,73% 8,98% 8,16% 11,43%
Liquid ratio 131,04% 142,92% 114,64% 115,10% 133,36%
unpaid / Total commitments 17,52% 15,77% 13,60% 12,06% 13,07%
Received interest / average outstanding loans 6,21% 6,54% 6,73% 6,77% 6,42%
Paid interest / average outstanding resources 3,37% 3,35% 3,57% 3,70% 3,12%
sales Force
Manpower 2 767 2 687 2 665 2 672 2 677
Branches 144 146 146 148 157

A nnual Repor t 20 09 - Nat ional Agr icultur al Bank
20
■ resources1 / Client resources
The outstanding balance of resources taken in from clients rose by 3.9% to a total of 4,473 MD
as at 31.12.2009 (compared to 4306 MD at the end of the previous year), a 167 MTD increase in
volume vs. 485 MD between 2007 and 2008. This was the result of a 206 MD increase in deposits
and a 39 MD drop in investment in monetary and financial instruments.
The fact that the net additional envelope of client resources mobilised in 2009 was lower than
that recorded in 2008 was the reason behind the Bank’s decision to focus its commercial policy
on an increase in deposits at the lowest possible cost and by negotiating short term cash flow
on the basis of financing needs to market the cereal harvest. This trend concerned exclusively
forward deposits mobilised from a number of major institutional clients.(in thousands of TND)
dec.31,2008realization
Projectiondec.31,2009
dec.31,2009realization
realization %
gapin volume
deposits 4 162 632 4 576 000 4 374 873 95,6% -201 128
Sight deposits 942 576 1 056 000 1 107 236 104,9% 51 236
Savings 1 320 179 1 465 000 1 466 067 100,1% 1 067
Time deposits 1 761 208 1 930 001 1 658 352 85,9% -271 649
Other amounts owed to customers 138 670 125 000 143 218 114,6% 18 218
other resources 115 900 74 000 77 188 104,3% 3 188
Treasury bills 5 000 24 000 12 238 51,0% -11 762
Commercial paper 110 900 50 000 64 950 129,9% 14 950
total resources (without subordinated debts) 4 278 532 4 650 000 4 452 061 95,7% -197 940
0
500
1000
1500
2000
2007
Evolution of the resources (MD)
2008 2009
1 271p
Dep
osits
1 466
gSa
ving
1 658
pTi
me
Dep
osit
77M.I.FM.I.F
1 024
pD
epos
its
1 249
gSa
ving
1 357
Tim
e D
epos
it
192116
1 109
pD
epos
its
1 320
gSa
ving
1 761
pTi
me
Dep
osit
M.I.F
actiVity at thE B.N.aFor thE FiNaNcial yEar 2009

A nnual Repor t 20 09 - Nat ional Agr icultur al Bank
21
In effect, the completion rate for projection of the outstanding balance of client resources came
to 95.7% as of 31.12.2009. These projections would have been considerably exceeded if it had
not been for the Bank’s policy on fees for mobilisation of forward investment from institutional
clients, particularly at the end of 2009.
The average outstanding balance of client deposits went up by 12.3%, a 482 MD increase in
volume in 2009 vs. 445 MD at the end of 2008.
1.1 – deposits
The outstanding balance of client deposits and assets came to 4396 MD as of 31.12.2009,
compared to 4190 MD at the end of 2008, a 4.9% increase corresponding to 206 MD more in
volume.
This trend was mainly the result of :
• a 15.6% increase in sight deposits and other sums due to clients, for a total of 1250 MD at the
end of 2009 vs. 1081 MD as of 31.12.2008, a 169 MD increase in volume vs. 87 MD for 2008 (to
be noted in this framework: a 177 MD increase in sight deposits in 2009 vs. just 40 MD in 2008,
• a 11.1% (+146 MD) increase in savings deposits, up to 1,466 MD as of 31.12.2009 vs. 1,320 MD
as of 31.12.2008, double the increase in 2008.
The geographic breakdown reflecting marketing efforts carried out by farming structures in all
regions but particularly agricultural areas.
Deposits
Saving
Time depositsand MIF
0
500
1000
1500
2000
2500
Jan-09 Feb-09 Mar-09 Apr-09 May-09 Jun-09 Jul-09 Aug-09 Sep-09 Oct-09 Nov-09 Dec-09

A nnual Repor t 20 09 - Nat ional Agr icultur al Bank
22
contribution in effort of 2009 share in 2008 share in 2009
Grand Tunis 15% 18% 18%
Monastir 10% 11% 11%
Sfax 9% 8% 8%
Nabeul 8% 12% 11%
Béja 8% 5% 5%
Sousse 7% 8% 8%
Jendouba 7% 7% 7%
Kasserine 6% 5% 5%
Siliana 5% 3% 4%
Mednine 5% 4% 4%
le Kef 5% 3% 4%
Kairouan 5% 5% 5%
Bizerte 4% 7% 7%
Gabes 2% 2% 2%
Gafsa 2% 2% 2%
total 100% 100% 100%
• and a decrease in the volume of forward deposits and other financial products, down from
1761 MD as of 31.12.2008 to 1658 MD at the end of 2009, a drop of 5.8% (-103 MD) following an
increase of 29.8% (+404 MD) the year before, this trend being attributable in particular to the
drop in forward investments in dinars by a number of institutional clients because of BNA’s
prudence about high interest rates.
Thus, in line with the commercial and financial objectives of the Bank’s Programme Contract,
trends in the structure of deposits was marked by better balancing of sight deposits and savings
deposits, with respective shares that increased by 2.4 and 1.9 percentage points respectively.
This influenced the average annual cost of deposits, which came to just 3.06% as of 31.12.2009.
structure of deposits in (%) 31.12.2007 31.12.2008 31.12.2009
Depositsvar
28,2%+1,2 pc
26,5% -1,7 pc
28,9%+2,4 pc
Savingvar
34,4%-1,5 pc
31,5-2,9 pc
33,4+1,9 pc
Time depositsvar
37,4%+0,3 pc
42%+4,6 pc
37,7%-4,3 pc
total 100% 100% 100%
actiVity at thE B.N.aFor thE FiNaNcial yEar 2009

A nnual Repor t 20 09 - Nat ional Agr icultur al Bank
23
1.2 – investment in monetary and financial instruments
The outstanding balance of client investment in monetary and financial instruments dropped by
33.4 % to 77 MD as of 31.12.2009, compared to 116 MD at the end of 2008, a decrease of 39 MD
in volume. This situation was attributable to the 46 MD decrease in the outstanding balance of
commercial paper and the 7 MD increase in investment in treasury bonds.
2 - Loans and special resources
The net outstanding balance of loans and special resources came to 567.8 MD as of 31.12.2009
vs. 576.5 MD at the end of 2008, down by 1.5% for a drop in volume of 8.7 MD.
This development was the result of:
• Settlement of the last two 2009 payments for the syndicated loan in the amount of 21.6 MD,
• a 47 MD drop in the outstanding balance of external resources, due to settlement of almost
56 MD in scheduled repayments (principal) to draw down foreign loans vs. 8.4 MD in calls on
the funds available under these lines,
• issue of the first portion in the amount of 50 MD of the subordinated loan, serving to increase
additional core funds and thus enhance the Bank’s solvency and to its potential to provide
financing to the national economy,
• and the 10.1 MD increase in the outstanding balance of budgetary resources.(in thousands of TND)
Var. 2008/2007 Var. 2009/2008
31.12.2007 31.12.2008 31.12.2009 Volume (%) Volume (%)
Obligation and syndicated loans 43 548 21 970 50 392 -21 578 -49,6 28 422 129,4
External loans 390 580 368 017 320 855 -22 563 -5,8 -47 161 -12,8
Budgetary resources 168 416 179 713 189 771 11 297 6,7 10 059 5,6
total 602 544 569 699 561 018 -32 844 -5,5 -8 681 -1,5
Other loans 7 180 6 771 6 789 -408 -5,7 18 0,3
total 609 723 576 471 567 808 -33 253 -5,5 -8 663 -1,5
3 – Core capital and provisions
In line with the resolutions of the extraordinary general assembly held on 14 March 2009, BNA
capital went up from 100 MD to 160 MD. Release of the entire issue premium (20 MD), attribution
of free shares (10 MD) by tapping extraordinary reserves, and release of the first portion of stock
issues in cash (25 MD) took place in 2009.

A nnual Repor t 20 09 - Nat ional Agr icultur al Bank
24
Moreover, following the decision of the ordinary general assembly on 15 May 2009, amounts of
13.6 MD and 9.8 MD were taken from 2008 profits and assigned respectively to reserves for tax-
free reinvestment and extraordinary reserves.
Thus the outstanding balance of BNA’s core capital prior to assignment of profits came to 493
MD at the end of 2009 vs. 411 MD as of 31.12.2008, an increase of 19.9% vs. 6.3% the year before.
It should be noted that in line with law n° 94 - 117 of 14 November 1994, BNA in 2009 disposed
of the equity capital that it had previously bought back, i.e. 318,424 shares. The net loss of
these divestment transactions came to 124 400 dinars, recorded by deduction from extraordinary
reserves. Dividends encashed in 2009 on this equity capital totalling 82,500 dinars were entered
on the account line «carried forward».
Furthermore, with issue of a first portion of the subordinated loan and the capital increase and
assignment of profits for the year, net capital stock equity rose by 31.5% to a total of 531 MD as
at 31.12.2009, compared to 403 MD at the end of 2008.
Consequently, the solvency ratio rose from 8.16% as at 31.12.2008 to 11.43% at the end of 2009,
giving the Bank new margins for growth while remaining in line with prudential regulations.
The overall outstanding balance of provisions came to 404 MD as of 31.12.2009 vs. 345 MD as of
31.12.2008, representing an increase in volume of 59 MD.
This trend was the result in particular of
- assignment of a gross allotment to provisions of 109.2 MD in 2009 vs. 91.2 MD in 2008, and
- recovery from provisions of 50.4 MD in 2009 vs. 30.6 MD in 2008.
actiVity at thE B.N.aFor thE FiNaNcial yEar 2009

A nnual Repor t 20 09 - Nat ional Agr icultur al Bank
25
■ JoBs1 – Commitments
(in thousands of TND)
Var. 2008/2007 Var. 2009/2008
31.12.2007 31.12.2008 31.12.2009 Volume (%) Volume (%)
Commitments by disbursement 3 881 073 4 543 380 4 357 967 662 307 17,1 -185 413 -4,1
Surety bonds 1 368 693 1 088 657 1 066 512 -280 037 -20,5 -22 144 -2,0
total Nets commitments 5 249 766 5 632 037 5 424 479 382 270 7,3 -207 558 -3,7
Subordinated Debts -316 261 -342 395 -362 829 -26 133 8,3 -20 434 6,0
Provisions and reserved interest 593 352 672 024 739 603 78 671 13,3 67 579 10,1
total 5 526 857 5 961 665 5 801 253 434 808 7,9 -160 413 -2,7
The overall outstanding balance of the Bank’s net commitments fell by 3.7%, down from 5632
MD as of 31.12.2008 to 5424 MD at the end of 2009, corresponding to a drop in volume of 208 MD.
This development was attributable to a 185 MD (-4.1%) decrease in balance sheet commitments,
for a total of 4358 MD at the end of 2009 vs. 4543 MD as of 31.12.2008 and of 22 MD (-2.0%)
for surety bonds, down from 1089 MD at the end of 2008 to 1067 MD at the end of 2009. In
terms of gross outstanding balance, the Bank’s commitments came to 5801 MD as of 31.12.2009
compared to 5962 MD as of 31.12.2008, a drop of 2.7% after an increase of 7.9% in 2008.
Thanks to efforts to enhance monitoring and collection of claims from clients, indicators of the
quality and profitability of loans improved, leading to a lower volume of assigned receivables.
1.1 - loan policy and structure of commitments
Despite difficult conditions, BNA did its best to follow loan policy that focuses on the sectors
least affected by fallout from the economic and financial crisis, while continuing to help its client
export companies overcome prevailing difficulties.
These efforts helped the Bank attain better strategic positioning on the private individual and
small/medium scale business compartments. But the lower level of financing required by the
cereals board in the closing months of 2009 eliminated the possibility of avoiding a drop in the
overall outstanding balance of gross commitments.

A nnual Repor t 20 09 - Nat ional Agr icultur al Bank
26
(in thousands of TND)
Var. 2008/2007 Var. 2009/2008
31.12.2007 31.12.2008 31.12.2009 Volume (%) Volume (%)
loans for agricultural production 632 591 664 582 674 980 31 992 5,1 10 398 1,6
Commitments by disbursement 622 614 652 697 657 987 30 083 4,8 5 290 0,8
Surety bonds 9 977 11 885 16 993 1 909 19,1 5 108 43,0
loans for marketing agricultural commodities 852 056 919 098 279 095 67 042 7,9 -640 004 -69,6
Commitments by disbursement 503 201 695 323 197 646 192 122 38,2 -497 677 -71,6
Surety bonds 348 856 223 776 81 449 -125 080 -35,9 -142 327 -63,6
commercial and industrial loans 4 042 210 4 377 985 4 847 178 335 774 8,3 469 194 10,7
Commitments by disbursement 3 032 349 3 524 989 3 879 108 492 640 16,2 354 119 10,0
Surety bonds 1 009 861 852 995 968 070 -156 865 -15,5 115 075 13,5
total 5 526 857 5 961 665 5 801 253 434 808 7,9 -160 413 -2,7
a) – loans for agricultural production
In lines with national goals to develop the agricultural sector, more than 5500 farmers took
advantage of short term loans in 2009 to finance the agricultural campaign, corresponding to
67 MD vs. 55 MD in 2008. There were more than 1500 loan applications for medium and long
term financing, corresponding to 44 MD in disbursements in 2009. Thus the overall volume of
outlays for agricultural production loans came to 111 MD in 2009, compared to 102 MD in 2008,
an increase of 10 %.
Nord West
41%
Nord East
40%
South
9%
Middle
10%
Releasing structure of agriculture per region
Big Farming45%
Fishing1%
Breeding13%
Fruit tree growing
8%
Other activities
28%
Truck Farming
4%
Releasing structure of agriculture per activity
actiVity at thE B.N.aFor thE FiNaNcial yEar 2009

A nnual Repor t 20 09 - Nat ional Agr icultur al Bank
27
Furthermore, the breakdown of financing by region and by speculation reflects the Bank’s
efforts to actively support national priorities in terms of regional development while ensuring
diversification of risk depending on the solvency and profitability of all branches of agriculture.
b) – loans for marketing agricultural commodities
The outstanding balance of loans for marketing agricultural commodities took a sharp downturn
of 69.6%, from 919 MD as of 31.12.2008 to 279 MD at the end of 2009. This was due for the
most part to the 633 MD drop in the cereal board’s commitments between December 2008 and
December 2009.(in thousands of TND)
Var. 2008/2007 Var. 2009/2008
31.12.2007 31.12.2008 31.12.2009 Volume (%) Volume (%)
Cereal 788 533 843 490 223 562 54 957 7,0 -619 928 -73,5
Wine 28 151 34 723 31 218 6 572 23,3 -3 505 -10,1
Oil 35 372 40 886 24 315 5 513 15,6 -16 570 -40,5
total 852 056 919 098 279 095 67 042 7,9 -640 004 -69,6
c) – commercial and industrial loans
BNA efforts focused on development of its market shares for small/medium businesses as well as
private individuals and professionals, giving due attention to maintaining stable income in the future
by promoting medium and long term loans. The outstanding balance of loans to professionals
and private parties came to 882 MD as of 31.12.2009, posting an increase of 134 MD in volume
compared to 2008. 417 MD were released in 2009 for more than 40,000 new loan agreements.
As for financing of businesses, 147 MD were released against medium and long term loans to
finance investment in industry, 120 MD for real estate promotion, and 86 MD for services. This came
to 353 MD overall in 2009 vs. 205 MD in 2008, for an increase of 72%. Thus the gross outstanding
balance of commercial and industrial commitments posted 4847 MD as of 31.12.2009, an increase
of 10.7% (+ 469 MD) vs. 8.3 % (+ 336 MD) at the end of 2008.
1.2 – monitoring risk and profitability
In line with national objectives and the Bank’s strategic choices regarding better rates for filed
receivables and coverage of risk by provisions, BNA continued in 2009 to implement policy in

A nnual Repor t 20 09 - Nat ional Agr icultur al Bank
28
the areas of collection and rigorous monitoring of companies exposed to prevailing economic
difficulties, while adopting a pro-active policy to assess risk and maintain provisions.
These efforts led to a higher rate of claim collection and thus higher quality and profitability in the
Bank’s loan portfolio. Furthermore, BNA improved its procedure for assessing the guarantees
taken into account in determining the level of provisions to be constituted, on the basis of seniority
and class of risk, seeking to ensure durability and projected financial profitability in the Bank’s
assets.
a) – loan collection and profitability
Encashment of claim recovery (principal and interest) as of 31.12.2009 amounted to 2326 MD
vs. 2109 MD at the end of 2008, an increase of 10.3%. The collection rate thus improved by
two percentage points to 68.8% in 2009 vs. 66.8% in 2008 and 62.6% the year before. This
enhanced performance for collection efforts was made possible by rigorous monitoring, notably
of companies hit by the world economic crisis, so that the collection rate for amounts due on
commercial and industrial claims came to 99.1% in 2009.
The volume of payment on loans for agricultural production (exclusive of disputed claims) came
to 112.5 MD as of 31.12.2009, compared to 84.8 MD in 2008. It should be noted in this framework
that the best results were achieved for large-scale crops, for which 56.7 MD were repaid in 2009
vs. 32.7 MD as of 31.12.2008.
As for disputed claims, the volume of collection increased from 23.7 MD in 2008 to 28.7 MD at the
end of 2009, an increase of 20.9%.
Still, following a sharp drop in commitments held by structures that store cereals, the rate of
non-repayment eased by one percentage point to 13.1% as of 31.12.2009 compared to 12.1% at
closing of the 2008 year.
The yield rate for loans from its own and external resources held at 6.42% as of 31.12.2009
vs. 6.77% at the end of 2008, despite the one percentage point drop in the money market rate
between December 2008 and December 2009.
actiVity at thE B.N.aFor thE FiNaNcial yEar 2009
A nnual Repor t 20 09 - Nat ional Agr icultur al Bank
29
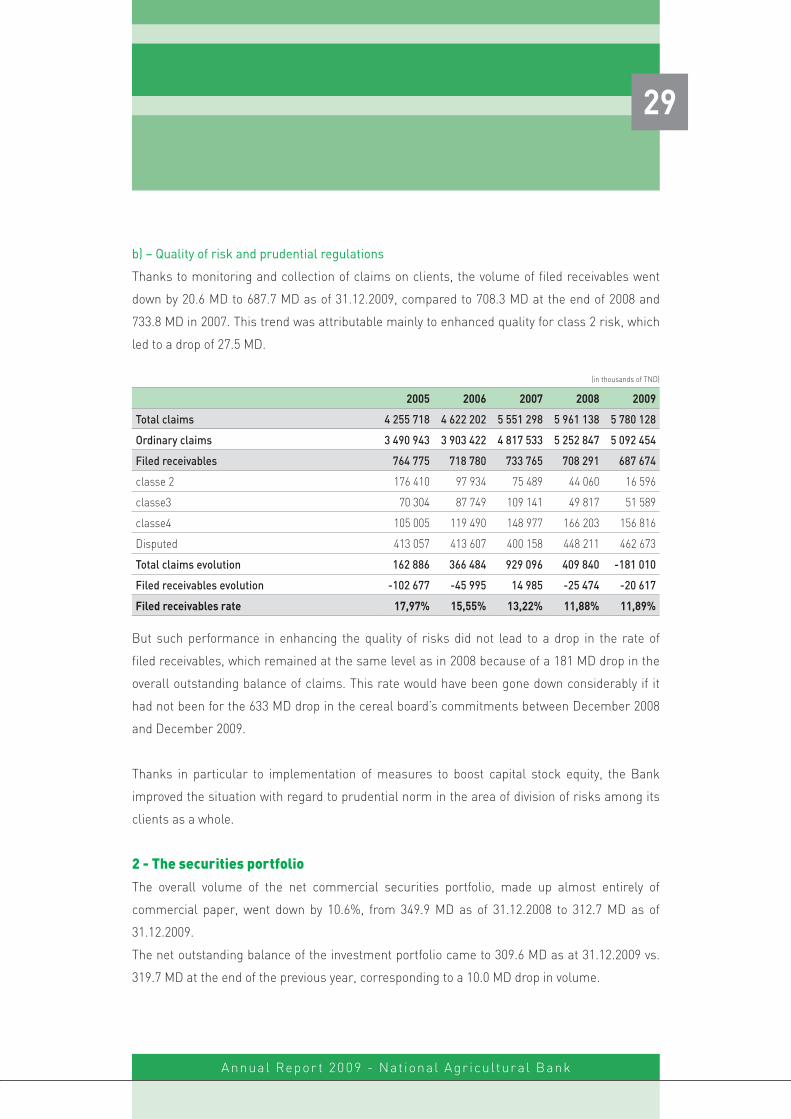
b) – Quality of risk and prudential regulations
Thanks to monitoring and collection of claims on clients, the volume of filed receivables went
down by 20.6 MD to 687.7 MD as of 31.12.2009, compared to 708.3 MD at the end of 2008 and
733.8 MD in 2007. This trend was attributable mainly to enhanced quality for class 2 risk, which
led to a drop of 27.5 MD.
(in thousands of TND)
2005 2006 2007 2008 2009
total claims 4 255 718 4 622 202 5 551 298 5 961 138 5 780 128
ordinary claims 3 490 943 3 903 422 4 817 533 5 252 847 5 092 454
filed receivables 764 775 718 780 733 765 708 291 687 674
classe 2 176 410 97 934 75 489 44 060 16 596
classe3 70 304 87 749 109 141 49 817 51 589
classe4 105 005 119 490 148 977 166 203 156 816
Disputed 413 057 413 607 400 158 448 211 462 673
total claims evolution 162 886 366 484 929 096 409 840 -181 010
filed receivables evolution -102 677 -45 995 14 985 -25 474 -20 617
Filed receivables rate 17,97% 15,55% 13,22% 11,88% 11,89%
But such performance in enhancing the quality of risks did not lead to a drop in the rate of
filed receivables, which remained at the same level as in 2008 because of a 181 MD drop in the
overall outstanding balance of claims. This rate would have been gone down considerably if it
had not been for the 633 MD drop in the cereal board’s commitments between December 2008
and December 2009.
Thanks in particular to implementation of measures to boost capital stock equity, the Bank
improved the situation with regard to prudential norm in the area of division of risks among its
clients as a whole.
2 - The securities portfolio
The overall volume of the net commercial securities portfolio, made up almost entirely of
commercial paper, went down by 10.6%, from 349.9 MD as of 31.12.2008 to 312.7 MD as of
31.12.2009.
The net outstanding balance of the investment portfolio came to 309.6 MD as at 31.12.2009 vs.
319.7 MD at the end of the previous year, corresponding to a 10.0 MD drop in volume.

A nnual Repor t 20 09 - Nat ional Agr icultur al Bank
30
This trend was in particular the result of:
• a 10.9 MD drop in public enterprise debt assumed by the State following State settlement of
repayments scheduled for 2009,
• release of shares subscribed to by the Bank in the capital of five companies in the amount
of 4.1 MD, compared to sale of shares worth an accounting value of 3.7 MD, of which 2.9 MD
involved BNA acquisition of shares in the capital of the Tunisian banking union UTB,
• a 1.2 MD increase in the outstanding balance of debenture loans subscribed to by the
Bank, following Bank subscription to a debenture loan in the amount of 5 MD, compared to
encashment of 3.8 MD in reimbursement of bonds in the portfolio, and
• a 7.5 MD increase in the outstanding balance of venture capital management funds, especially
following assignment of an allocation of 8.5 MD, compared to repayment of 3.7 MD.
It should be specified that in the framework of measures taken by the commission to clear up
finances and restructure companies with public holdings (CA.R.E.P.P) on 28 May 2009, the Bank
divested itself of all its holdings in the capital of the Tunisian banking union UTB. Gains on sale
came to 4.1 MD, aside from gains on exchange evaluated at 3.5 MD. Given these gains, the yield
rate for the Bank’s portfolio of share securities came to 15.1% at the end of 2009 vs. 7.4% in 2008.
The Bank’s holdings were spread out over 78 companies, 12 of which were on the stock exchange’s
official list, yielding latent gains of 118 MD for acquisition value of 101 MD.
The sectoral breakdown of the Bank’s stock portfolio remained in line with the choices for
realigning the Bank’s holdings in finance and agrofood, which make up a respective 37.5% and
28% of the portfolio.
3 –Fixed assets
The outstanding balance of net fixed assets went up by 11.5%, from 48.1 MD as of 31.12.2008 to
53.6 MD at the end of 2009, an increase in volume of 5.5 MD.
In effect, investment expenditure tied to operational premises involved some 4.0 MD, of which
1.7 MD were for acquisition of fixed assets in line with plans to open new branch offices.
As for computer equipment, outlays for investment came to 2.3 MD of which 1.1 MD were for
acquisition of software and the same amount for renewal of computer material.
actiVity at thE B.N.aFor thE FiNaNcial yEar 2009
A nnual Repor t 20 09 - Nat ional Agr icultur al Bank
31
The outstanding balance of amortisation rose from 64.9 MD at the end of 2008 to 68.9 MD at the
end of 2009, due to assignment of an annual allotment to amortisation of fixed assets amounting
to 4.1 MD in 2009.
■ position on the money market and liquidityThe above mentioned trends in resources and uses yielded a net surplus for the bank on the
money market amounting to 466 MD as at 31.12.2009 compared to net indebtedness of 32 MD as
of 31.12.2008.
The liquidity ratio came to 133.36% as at 31.12.2009 vs. 115.10% at the end of 2008.
■ BankinG operations aBroadThe financial and economic crisis that broke out in the last quarter of 2008 quickly affected foreign
trade in a big way, at both the domestic and international levels. There was in particular a drop
in prices for raw materials and falling demand in the euro zone, Tunisia’s main trading partner.
These adverse conditions influenced trends in the overall volume of BNA’s banking operations
with foreign correspondents, dropping by almost a third from 33,101 MD in 2008 to 22,220 MD in
2009. It should be noted that the lower volume of operations with foreign correspondents for a
number of the Bank’s major clients was offset at least partially by a commercial effort to sign up
new clients, leading to an increase in the number of domiciliation and transfer orders.
1 – Domiciliated securities
The volume of domiciliation of foreign trade titles came to 9,527 MD at the end of 2009 vs. 10,997
MD the previous year, for a drop of 13.4%. But the number of domiciliated titles went up by 2.16%
to almost 29,000 files in 2009. In effect, domiciliation of import titles fell to 8280 MD at the end
of 2009, down from 9326 MD in 2008, an 11.2% decrease. Still, the number of domiciliation titles
entrusted to the BNA went up by 5.4% to more than 20,000 titles, helping to offset the impact
of lower prices for imported raw materials and non recurrence of domiciliation of some 3000
MD in volume in 2008 by one of the Bank’s largest clients, in the framework of expansion of its
activities. The volume of domiciliated export titles at BNA agencies fell by 25.4%, from 1671 MD
in 2008 to 1247 MD in 2009.

A nnual Repor t 20 09 - Nat ional Agr icultur al Bank
32
2 –Settlements abroad
Settlements abroad handled by BNA agencies posted just 12,693 MD in 2009, compared to 22,104
MD the year before, a drop of 42.6 %. Incoming payments from abroad came to 4873 MD as at
31.12.2009 compared to 15,005 MD at the end of 2008, a 7185 MD decrease in volume, of which
6768 MD were received transfers. Outgoing payments destined for abroad dropped by 31.4%,
down from 7100 MD in 2008 to 4873 MD as at 31.12.2009.
3 – Banknote exchange transactions
Banknote exchange transactions handled by BNA agencies amounted to 412 MD as at 31.12.2009,
compared to 407 MD in 2008, a 1.2% increase. This was the result of a 2.0% increase in purchases
of foreign currency and a 3% drop in volume of transactions for sale of foreign currency.
■ intermediary Balances for manaGement and profitsMonetary policy in 2009 was marked in particular by a one percentage point drop in the average
money market rate, down from 5.19% in December 2008 to 4.18% in December 2009. This trend
had an effect on trends in proceeds and financial charges. But the Bank was still able to generate
net banking proceeds in line with projections for 2009.
1 – Banking proceeds on transactions
Total proceeds from banking transactions came to 396.4 MD as at 31.12.2009 vs. 391.7 MD at the
end of 2008, an increase of 1.2% (+4.7 MD) vs. 15.0% (+51,2 MD) in 2008.
This trend was attributable mainly to :
• a 7.5 MD (+2,7%) increase in interest on transactions with clients, led in particular by strong
performance for encashment of proceeds from interest on unpaid and disputed claims
(exclusive of loans from budgetary resources), which posted an increase of 24.8% (+2.4 MD)
for a total of 12.1 MD as at 31.12.2009 vs. 9.7 MD in 2008 - noting that this trend in interest
collected on loan transactions is attributable to a large degree to a lower money market rate
and lower demand for financing in a number of economic sectors affected by recession in
the euro zone, with the average yield rate for loans granted from core and external resources
dropping by just 0.35% vs. the above-mentioned drop of 1% in the money market rate,
• a 0.8 MD increase in gains on the investment securities portfolio,
• a 1.6 MD drop in interest collected on cash transactions, and
• a drop in gains on the Treasury bond portfolio, in the amount of 2.1 MD.
actiVity at thE B.N.aFor thE FiNaNcial yEar 2009

A nnual Repor t 20 09 - Nat ional Agr icultur al Bank
33
2 – Banking operating costs
Banking operating costs were down by 11.0%, from 174.1 MD as at 31.12.2008 to 154.9 MD at the
end of 2009, a 19.2 MD drop in volume vs. an increase of 24.8 MD in 2008. The main factors for
this trend were :
• a 10.8 MD (-84.9%) drop in interest on cash transactions,
• a 6.4 MD drop in the volume of interest on client deposits, and
• a 2.1 MD drop in interest and commissions incurred on external and bond loans.
3 – Net banking proceeds
Net banking proceeds came to 241.5 MD as at 31.12.2009, compared to 217.6 MD at the end of
the previous year, an increase of 11.0% (+23.9 MD) vs. 13.8% (+ 26.4 MD) in 2008.
(in thousands of TND)
31.12.2007 31.12.2008 31.12.2009
Net margin of interest 113.198 133.730 159.908Contribution to NBI 59% 61% 66%
Net margin of commissions 39.154 43.653 43.704Contribution to NBI 20% 20% 18%
Net margin of commercial portfolio 30.102 30.573 27.433Contribution to NBI 16% 14% 11%
Net margin of investment portfolio 8.776 9.694 10.504 Contribution to NBI 5% 4% 4%
Net Banking income 191.231 217.650 241.549
The net interest margin, representing 66% of
net banking proceeds, rose by 20% to 159.9
MD as at 31.12.2009, a 26.2 MD increase in
volume. This trend was due in particular
to the interest margin on cash transactions
that rose by 9.2 MD between 2008 and 2009.
Still, the share of income from the
commercial securities portfolio fell by three
percentage points to 11% as at 31.12.2009,
following the lower average outstanding
balance of Treasury bonds in the portfolio
and the drop in the money market’s average
rate.
Interest margin
66%
Commision margin
18%
Commercial portfolio
12%
Investment portfolio
4%
Structure of Net Banking Income in 31.12.2009

A nnual Repor t 20 09 - Nat ional Agr icultur al Bank
34
4 – Operating costs and operational efficiency ratios
Operating costs totalled 120.2 MD in 2009, compared to 102.7 MD as at 31.12.2008, an increase
of 17.0% (+17.4 MD).
This was the result of:
• a 14.5 MD (17.9%) increase in wage costs, compared to 2.3 MD (+3.0%) in 2008, attributable
to the wage increase contracted in the framework of the collective agreement, costs for
promotions, the introduction of a fuel indemnity in line with that granted by other public
banks, and attribution of a premium in the framework of the Bank’s 50th anniversary and
• a 2.9 MD (13.4%) increase in the volume of general operating costs in 2009, compared to 0.9
MD (+4.1%) the year before.
Thus, given the trend in net banking proceeds, the operating coefficient eased, moving from
47.2% as at 31.12.2008 to 49.8% at the end of 2009.
Productivity per agent rose by 10.8%, with 90,231 dinars in net banking proceeds per agent as at
31.12.2009 vs. 81,456 dinars at the end of 2008.
5 – Allotments to provisions and correction of values
In line with the national objective to ensure a 70% rate of coverage of filed receivables, BNA
continued efforts to build up provisions by assigning 109.2 MD in gross allotment to provisions
in 2009 vs. 91.2 MD in 2008, despite a drop in volume of filed receivables and an increase in the
volume of recovered provisions on claims. In this framework, with a view to entry into force of
Basel II prudential norms, the Bank has assigned 3.5 MD to cover operational risks.
General operating expenses / NBI
NBI / Manpower
0 10 20 30 40 50 60 70 80 90 100
0.0
10.0
20.0
30.0
40.0
50.0
60.0
70.0
2005 2006 2007 2008 2009
Productivity efficiency
actiVity at thE B.N.aFor thE FiNaNcial yEar 2009
A nnual Repor t 20 09 - Nat ional Agr icultur al Bank
35
And given gains and losses as well as correction of values on claims and securities (of which
7.5 MD are gains) and gain on exchange on sale of UTB stock, the volume of net allotments to
provisions came to 68.8 MD at the end of 2009 vs. 71.4 MD in 2008, a drop of 4% compared to an
increase of 20% as at 31.12.2008.
Tapping net banking proceeds to cover risks was once again reduced, thanks to assignment of
an allotment to provisions net of recovered provisions representing 24% as at 31.12.2009 vs. 28%
at the end of 2008 and 36% in 2007.
It should also be mentioned that this provisioning effort helped achieve a ratio of coverage of
filed receivables by provisions of 68.61% as at 31.12.2009. Subsequently, the national objective to
achieve 70% coverage of filed receivables by provisions will be achieved by BNA in 2010.
6 – Results
Given the above-mentioned trends in proceeds and costs, operating results came to 48.9 MD as
at 31.12.2009, compared to 39.1 MD in 2008, an increase of 25.1%. Net results went up by 26.9%,
from 31.763 MD as at 31.12.2008 to 40.299 MD for 2009. Thus the yield rate for average capital
stock equity amounted to 14.24% as at 13.12.2009, compared to 13.45% for 2008 and 12.71% for
2007.
■ communication and marketinG policyIn 2009, BNA pursued its communication policy, which focuses on becoming better known and
enhancing its institutional image while also adapting techniques and modes for marketing
products and services to clients.
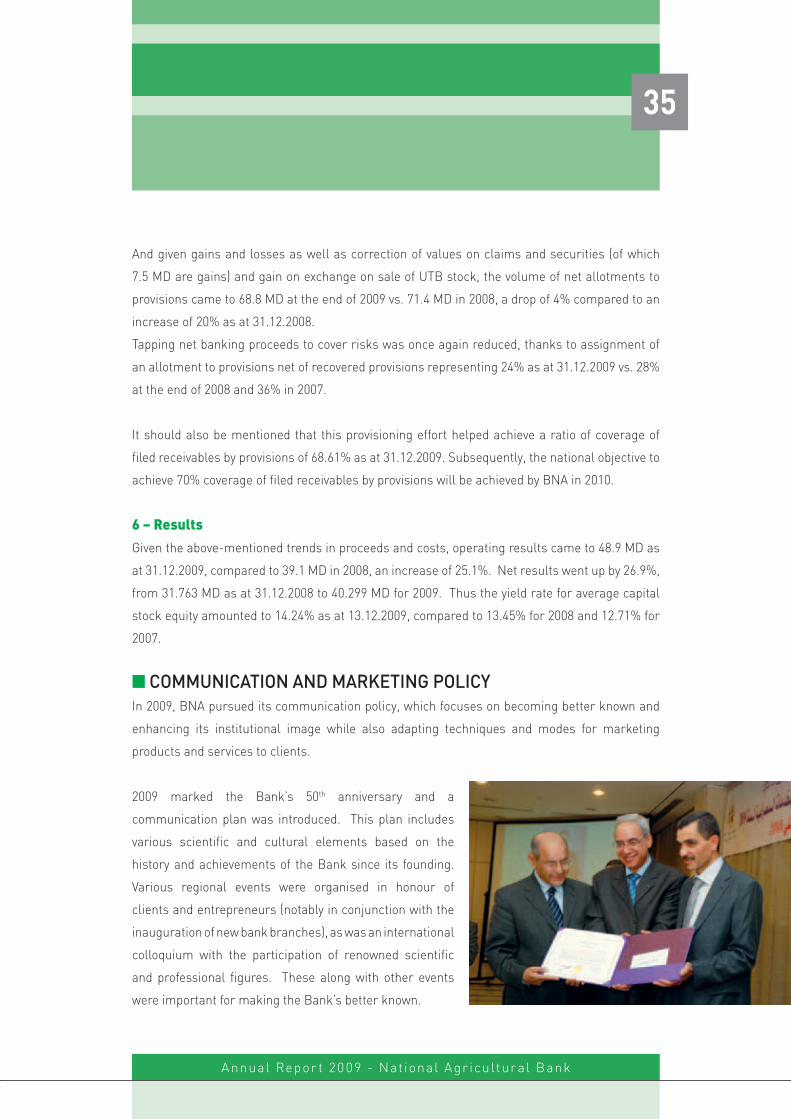
2009 marked the Bank’s 50th anniversary and a
communication plan was introduced. This plan includes
various scientific and cultural elements based on the
history and achievements of the Bank since its founding.
Various regional events were organised in honour of
clients and entrepreneurs (notably in conjunction with the
inauguration of new bank branches), as was an international
colloquium with the participation of renowned scientific
and professional figures. These along with other events
were important for making the Bank’s better known.

A nnual Repor t 20 09 - Nat ional Agr icultur al Bank
36
These efforts to achieve greater outreach and an ever better image were crowned by the choice of
BNA to receive the President of the Republic’s award for the quality of banking services in 2009.
On another front, campaigns for «products and e-banking» contributed considerably to promotion
of high added value banking products while also providing higher quality service. Thus aside
from adaptation of certain savings and financing products, remote banking achieved a new level
of growth in 2009. There were in particular almost 6000 subscribers to the BNAnet network,
there were more than 250,000 hits on the Bank’s website, and there was a monthly average of
more than 42,000 connections to the BNAphone vocal service.
It should also be noticed that launching of a new NOMADE electronic recharging service in
cooperation with the local telephone service will provide new synergy with the Bank’s other
products and it will thus help to generate higher turnover.
Furthermore, in line with priorities in the area of proximity, the Bank strengthened its commercial
network by opening seven new bank branches, two special offices, and six new cash machines,
bringing its networks to 124 machines and 157 bank branches.
■ orGanisation and information system Bank policy in the area of organisation in 2009 involved facilitating the transition to new areas of
banking specialisation and processing, storage and transmission of information processes, in
the framework of introduction of the new information system.
Following adoption of the BNA governing board’s plan to reorganise the organisational chart,
it was submitted to the authorities for approval. Establishment in the near future of a new
organisational chart will help the Bank provide better reactivity and greater organisational
synergy will help it to better monitor trends in risks and opportunities inherent to trends in
competitiveness and migration to the new information system based on new information and
communication technologies, marked by a centralised accounting system.
It should also be noted that the decentralisation initiative was supported in 2009 by adaptation
of procedures for a greater role and greater responsibility for regional structures, notably in
granting, monitoring and collecting loans and in managing guarantees and internal audit.
actiVity at thE B.N.aFor thE FiNaNcial yEar 2009

A nnual Repor t 20 09 - Nat ional Agr icultur al Bank
37
As for the pivotal initiative to introduce the technical base for the information system, the contract
was awarded to a local supplier in 2009, in the framework of a banking interest grouping. It
follows that the success of the new bank branch system «SMILE», the system of commitments
«SAEB», and client and product referentials (modules that have been developed in-house) is
proof of the Bank’s capacity to bring this project to maturity in the targeted time frame and with
all due diligence.
Thus work groups, marked by the active participation of both central services and operational
management staff, were engaged in establishing the functional and technical pre-requisites that
will serve to find the solution for meeting the Bank’s needs and expectations by introducing a
new core information system.
Furthermore, preliminary measures for introduction of a new accounting system were undertaken
with the help of an outside consultant and they should in the end contribute to sufficient
integration of the accounting function in all the components of the new information system.
And given certain specific needs, the Bank called on the market to acquire specialised software
applications relating to certain areas of specialisation such as money laundering, management
of documentary letters of credit, security of the SWIFT system, and management of cash flow in
foreign currencies.
■ human resourcesRegarding the Bank’s strategic choices, especially development of its commercial network and
more generalised use of new information and communication technologies, BNA’s policy for
human resources in 2009 focused on a larger number of staff members, through recruitment of
new specialists and ongoing training to keep Bank staff’s know how current through training and
internal rotation.
In this framework, in addition to reintegration within Bank departments, carrying out of the
recruitment programme led to recruitment of 54 new staff members, almost all assigned to
bank branches, in line with the plan to open new branches and with the need to replace staff
leaving bank branches.
Recruitment policy also helped the Bank to lower the average age of staff, given departures
over the past few years. Consequently, the age pyramid showed an improvement of almost two
percentage points in the group of staff under the age of 35 to 9.9% of overall employees in 2009.

A nnual Repor t 20 09 - Nat ional Agr icultur al Bank
38
Also of note were the 41 definitive departures in 2009, 31 of which were on retirement. Given the
temporary absence of 14 staff members (secondment, long term sick leave, leave without pay,
etc.), the actual staff count at the Bank rose from 2672 as at 31.12.2008 to 2677 at the end of 2009.
Nevertheless, to achieve the goal of increasing the rate of banking penetration and the fact that
722 staff members (27% of the Bank’s manning table) will be eligible for retirement in less than
ten years, recruitment efforts will have to continue in the coming years.
age bracket 2007 2008 2009 manpower31.12.2009
< = 25 years 0,10% 0,20% 0,70% 20
26 - 35 years 8,30% 7,80% 9,20% 245
36 - 50 years 65,00% 62,80% 63,10% 1690
51 - 60 years 26,60% 29,20% 27,00% 722
total 100% 100% 100% 2677
In the area of training, more than 2100 employees (80% of actual total) took training courses
organised by the Bank in 2009 at a global cost corresponding to some 0.4% of annual turnover.
It should be noted that training activities organised by the Bank’s integrated training centre
accounted for almost two thirds of the overall number of trainees.
On another front, in the framework of opening up to the university and professional environment,
BNA in 2009 accepted almost 1000 interns at the various structures in its network and at central
services, including 200 paid interns.
1153 1111 1102 1110 1114
1614 1576 1563 1562 1563
2005 2006 2007 2008 2009
Network Headquaters
Real Manpower 2005 - 2009
actiVity at thE B.N.aFor thE FiNaNcial yEar 2009

A nnual Repor t 20 09 - Nat ional Agr icultur al Bank
39
■ in-house Governance and internal auditBank efforts in 2009 focused on improving the process for prudential surveillance by strengthening
structures attached to the board and aligning the missions and objectives of internal audit
structures, in line with the
national goal of introducing
the new prudential norms
instituted by monetary
authorities.
Thus aside from the mandates
initiated by external audit
structures (auditors, the court
of audit, etc.), the permanent
internal audit committee
ensured periodic monitoring
of trends in financial
conditions and respect of the Bank’s policies and internal procedures. The conclusions and
recommendations of these oversight bodies, all subject to the board, were the object of rigorous
monitoring by the Bank to clear up known difficulties and inadequacies.
Furthermore, the Bank pursued its objectives in the area of coordination and synchronisation of
the role of the internal audit department and of the inspection division, with a view to ensuring
that regulations are met and the interests of the Bank preserved, at both central and regional
structures. In this sense, reorganisation of tasks entrusted to each division led to more than
a hundred audit exercises and/or inspections in 2009, in addition to survey and monitoring
exercises.
The executive loan committee, which met more than a dozen times in 2009, ruled on all the large-
scale loans submitted to it while also monitoring trends in incurred risks, as well as conduct
of the Bank’s loan policy, taking into account available capital stock equity and economic and
financial conditions.
In the area of monitoring of conformity and efforts to crack down on money laundering, beyond
the ongoing help of the relevant structures, those in charge at more than 100 agencies were
A nnual Repor t 20 09 - Nat ional Agr icultur al Bank
40
invited to attend sessions for training and awareness-building about diligence and rules of
ethics to be respected in line with Bank policy on conformity.
Furthermore, to continue to put in place the pre-conditions for establishment of Basel II
prudential norms, specifications were drawn up and validated for acquisition of software to
manage operational risks and management of assets and liabilities. Establishment of this
means of prudential surveillance will pick up speed, with creation in the very near future of
structures appropriate to the framework of the Bank’s new organisational chart.
As for communication and financial transparency, it should be noted that in addition to publication
of indicators of activity and financial statements at the proper times and according to regulatory
norms, the Bank organised a press conference in November 2009 to which stockholders and the
media were invited. This event, coinciding with celebration of the Bank’s 50th anniversary, helped
highlight BNA’s achievements and its contribution to the national economy, and especially to
outline its objectives for growth and profitability, both short term and strategic.
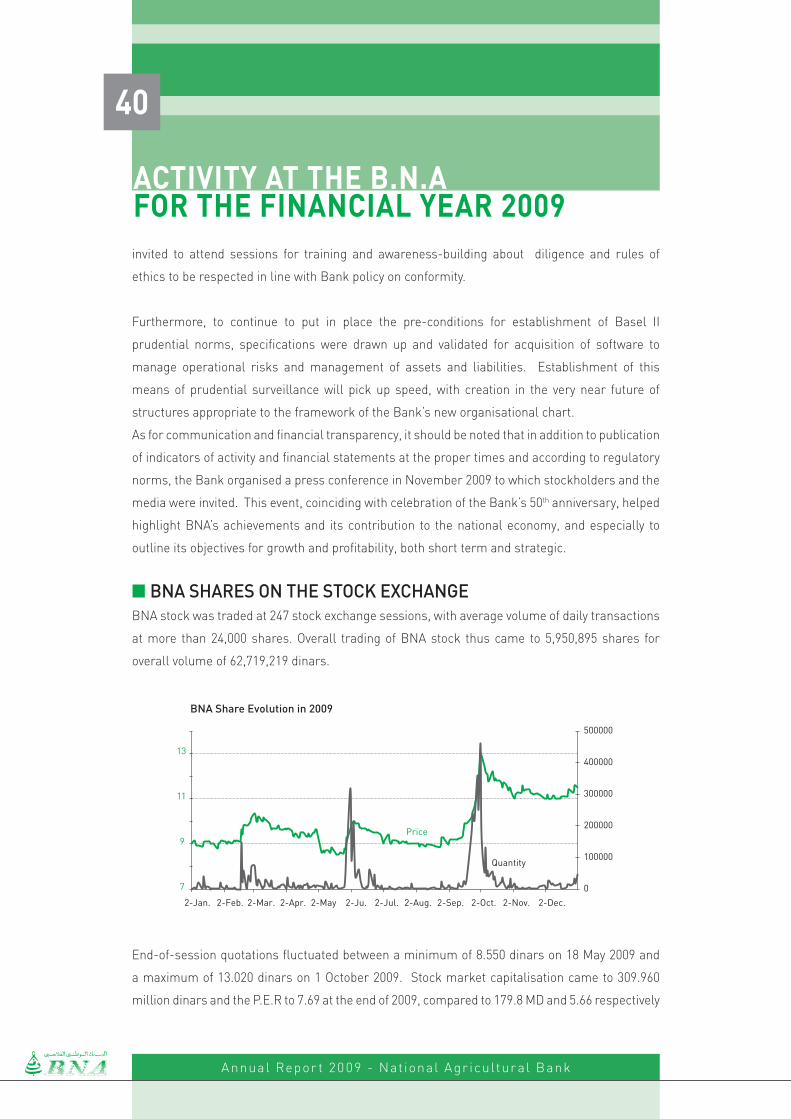
■ Bna shares on the stock eXchanGeBNA stock was traded at 247 stock exchange sessions, with average volume of daily transactions
at more than 24,000 shares. Overall trading of BNA stock thus came to 5,950,895 shares for
overall volume of 62,719,219 dinars.
End-of-session quotations fluctuated between a minimum of 8.550 dinars on 18 May 2009 and
a maximum of 13.020 dinars on 1 October 2009. Stock market capitalisation came to 309.960
million dinars and the P.E.R to 7.69 at the end of 2009, compared to 179.8 MD and 5.66 respectively
actiVity at thE B.N.aFor thE FiNaNcial yEar 2009
Price
Quantity
0
100000
200000
300000
400000
500000
7
9
11
13
2-Jan. 2-Feb. 2-Mar. 2-Apr. 2-May 2-Ju. 2-Jul. 2-Aug. 2-Sep. 2-Oct. 2-Nov. 2-Dec.
BNA Share Evolution in 2009

A nnual Repor t 20 09 - Nat ional Agr icultur al Bank
41
at the end of 2008. It should also be noted that 2009 was marked by the success of subscription
to the capital increase, up from 100 MD to 160 MD, with paying in of the entire issue premium and
of the first half of subscribed nominal. We take this opportunity to thank the Bank’s stockholders
for their ongoing support of BNA stock.
2006 2007* 2008 2009
Registered capital (in Thousands of TND) 100.000 100.000 100.000 160.000
Called up capital (in Thousands of TND) 100.000 100.000 100.000 135.000
Face value (TND) 10 5 5 5
Shares number (in Thousands) 10.000 20.000 20.000 32.000
Admitted shares number (in Thousands) 10.000 20.000 20.000 27.000
Transacts capital (TND) 20.764.702 22.111.988 23.781.008 62.719.219
Transacted shares 1.443.159 1.583.109 2.711.195 5.950.895
Maximum quotation price (TND) 18,200 10,850 9,540 13,020
Minimum quotation price (TND) 8,550 7,940 7,700 8,550
Dividends per action (TND) 0,800 0,400 0,400 0,450
Date of allotment 11/06/2007 16/06/2008 02/06/2009 07/06/2010
Price Earning Ratio (P.E.R) 10,54 6,37 5,66 7,69
Stock exchange capitalization (in Thousands of TND) in 31.12 172.000 179.000 179.800 309.960
* figure calculated integrating the split of June 22, 2007.
■ prospectsIn line with the orientations announced in the
framework of the presidential programme and the
Bank’s strategic objectives for the period 2009-2013,
BNA will in 2010 focus on the following main objectives:
• Higher economic and financial profitability for
the Bank, while pursuing the initiative to boost
provisioning and strengthen equity.
• Pursuit of commercial action to increase client
resources, notably by expanding the network
of bank branches and developing the range of
products and services offered by the Bank.

A nnual Repor t 20 09 - Nat ional Agr icultur al Bank
42
• Conduct of loan policy based on diversification of risks and improvement of quality and of
coverage of commitments, while maintaining its active contribution to economic priorities.
• Establishment of an appropriate organisational and logistic system in support of plans to
completely reorganise the Bank’s information system.
Implementation of these development choices will lead in particular to an increase in the gross
outstanding balance of commitments and of the rate of coverage of filed receivables by provisions.
As for mobilisation of resources, the outstanding balance of funds mobilised from clients has
gone up despite the downward trend in the average cost of deposits.
Higher capital stock equity in 2010 is expected to be secured through release of the second
portion of the capital increase and issue of the second portion of the subordinated loan. These
projections of activity will lead to significant improvement in the Bank’s operational indicators
and thus a high level of economic and financial performance than the target set in the 2009 –
2013 programme contract.

A nnual Repor t 20 09 - Nat ional Agr icultur al Bank
43
iNdiVidual FiNaNcial statEmENts as oF dEcEmBEr 31, 2009
individual Financial statements 44
Notes relating to the individual Financial statements 49
general report of the auditor on the Financial statements 69
special report of the auditor on the Financial statements 71
resolutions adopted By the ordinary general assembly 74

A nnual Repor t 20 09 - Nat ional Agr icultur al Bank
44 BalaNcE shEEt BEForE distriButioN oF ProFitsas at dEcEmBEr 31,2009
Notes 31.12.2009 31.12.2008 change in
Volume (%)
assEts
1. cash & credit notes with the central bank, the post office& the treasury 4.1.1 427 593 168 318 259 275 154,0
2. receivables from banking and financial institutions 4.1.2 113 198 72 828 40 370 55,4
3. receivables from customers 4.1.3 4 357 967 4 543 380 -185 413 -4,1
a- debit accounts 498 119 618 878 -120 759 -19,5
b- other assistance to customers 3 342 963 3 363 254 -20 291 -0,6
c- loans out of special resources 489 440 532 601 -43 161 -8,1
d- farming receivables from the state 27 445 28 647 -1 202 -4,2
4. commercial securities portfolio 4.1.4 312 728 349 918 -37 190 -10,6
5- investment portfolio 4.1.5 309 628 319 665 -10 037 -3,1
6- frozen assets 4.1.6 53 593 48 084 5 509 11,5
7- other assets 4.1.7 73 753 75 254 -1 501 -2,0
a- suspense and adjustment accounts 34 076 37 492 -3 416 -9,1
b- Other 39 677 37 762 1 915 5,1
total assEts 5 648 460 5 577 447 71 013 1,3
liaBilitiEs
1. the central bank and the post office 1 8 -7 -87,5
2. deposit & credit notes of banking & financial institutions 4.1.8 15 696 210 964 -195 268 -92,6
3. customers’ deposits and credit notes 4.1.9 4 395 917 4 190 380 205 537 4,9
a- sight deposits 1 108 078 943 506 164 572 17,4
b- other deposits and credit notes 3 287 839 3 246 874 40 965 1,3
4- Borrowings and special resources 4.1.10 567 808 576 471 -8 663 -1,5
a- realised borrowings 52 576 22 164 30 412 137,2
b- special resources 515 232 554 307 -39 075 -7,0
5. other liabilities 4.1.11 176 114 188 376 -12 262 -6,5
a- provisions for liabilities and expensive 7 833 5 842 1 991 34,1
b- suspense and adjustment accounts 131 953 142 684 -10 731 -7,5
c- other 36 328 39 850 -3 522 -8,8
total liaBilitiEs 5 155 536 5 166 199 -10 663 -0,2
stockholdErs' EQuity
1a- capital 4.1.12 160 000 100 000 60 000 60,0
1b- shareholders : no called capital 4.1.12 -25 000 -25 000
2- reserves 4.1.12 184 478 149 965 34 513 23,0
3- treasury stock 4.1.13 -3 -3 678 3 675 -99,9
4. other stockholders’ equity 4.1.12 133 000 133 000 0 0,0
5- income brought forward 4.1.12 150 198 -48 -24,2
6- income for the year 4.1.12 40 299 31 763 8 536 26,9
total stockholdErs EQuity 492 924 411 248 81 676 19,9
total liaBilitiEs aNd stockholdErs EQuity 5 648 460 5 577 447 71 013 1,3
(in thousands of TND)

A nnual Repor t 20 09 - Nat ional Agr icultur al Bank
45 statEmENt oF oFF-BalaNcE shEEt liaBilitEsas at dEcEmBEr 31,2009
Notes 31.12.2009 31.12.2008 change in
Volume (%)
coNtiNgENt liaBilitiEs
oBs1- Bonds, backings & other guaranties given 4.2.1 714 665 703 447 11 218 1,6
a - in favour of banking institutions 100 641 75 466 25 175 33,4
b - in favour of customers 454 024 467 981 -13 957 -3,0
c - in favour of the state 160 000 160 000 -
oBs2- documentary credits 324 711 409 103 -84 392 -20,6
a - debtor by export documentary credits 28 207 46 784 -18 577 -39,7
b - debtor by import documentary credits 296 504 362 319 -65 815 -18,2
oBs3- assets given as security
total coNtiNgENt liaBilitiEs 1 039 376 1 112 550 -73 174 -6,6
commitmENts giVEN
oBs4- financing commitments given 287 776 211 571 76 205 36,0
a - notified credits which are not utilized 287 776 211 571 76 205 36,0
oBs5- commitments on securities 8 795 5 530 3 265 59,0
a - equity investments still to be paid in 5 216 2 820 2 396 85,0
b - other 3 579 2 710 869 32,1
total commitmENts giVEN 296 571 217 101 79 470 36,6
commitmENts rEcEiVEd
oBs6- financing commitments received 0 114 -114 -100,0
oBs7- Guarantees received 4.2.2 468 873 489 256 -20 383 -4,2
(in thousands of TND)

A nnual Repor t 20 09 - Nat ional Agr icultur al Bank
46
Notes 31.12.2009 31.12.2008 Variations
Volume (%)
rev1- interest and similar income 4.3.1 313 711 306 775 6 936 2,3
a- transactions with banking & financial institutions 10 283 11 863 -1 580 -13,3
b- transactions with customers 290 727 283 179 7 548 2,7
c- other interest and similar income 12 701 11 733 968 8,3
rev2- fees & commissions (as income) 4.3.2 44 760 44 697 63 0,1
rev3- Gains on commercial portfolio & financial transactions 4.3.3 27 433 30 573 -3 140 -10,3
rev4- revenue from investment portfolio 4.3.4 10 504 9 694 810 8,4
total iNcomE From BaNkiNg oPEratioNs 396 408 391 739 4 669 1,2
eXp1- accrued interest & similar expense 4.3.5 153 803 173 045 -19 242 -11,1
a- transactions with banking & financial institutions 1 904 12 654 -10 750 -85,0
b- transactions with customers 134 214 140 630 -6 416 -4,6
c- borrowings and special resources 14 170 15 524 -1 354 -8,7
d- other interest and expense 3 515 4 237 -722 -17,0
eXp2- fees and commissions accrued 1 056 1 044 12 1,1
total EXPENsE oN BaNkiNg oPEratioNs 154 859 174 089 -19 230 -11,0
NEt BaNkiNg iNcomE 241 549 217 650 23 899 11,0
rev5/eXp4- provisions made & result of valuation adjustmentson off-balance sheet receivables & liabilities
4.3.6 -68 263 -69 597 1 334 -1,9
rev6/eXp5- provisions made & result of valuation adjustments on investment portfolio
4.3.7 -633 -1 751 1 118 -63,8
rev7- other operating revenue ( + ) 532 444 88 19,8
eXp6- staff expense ( - ) 4.3.8 95 465 80 942 14 523 17,9
eXp7- General operating expenses ( - ) 24 727 21 812 2 915 13,4
eXp8- provisions & fixed assets depreciation allowances ( - ) 4 141 4 942 -801 -16,2
rEsults From oPEratioNs 48 852 39 050 9 802 25,1
rev8/eXp9- income/loss balance from other regular items 53 576 -523 -90,8
eXp11- income taxes ( - ) 8 606 7 863 743 9,4
rEsults From rEgular actiVitiEs 40 299 31 763 8 536 26,9
rev9/eXp10- income/loss balance from extraordinary items
NEt iNcomE For thE PEriod 40 299 31 763 8 536 26,9
(in thousands of TND)
statEmENt oF oPEratioNsas at dEcEmBEr 31, 2009

A nnual Repor t 20 09 - Nat ional Agr icultur al Bank
47
Notes 31.12.2009 31.12.2008
oPEratioNal actiVity
1-Product of operating 384 030 373 940
2-Charge of operating -161 451 -177 105
3-Deposit / withdrawal of money from banking & financial institutions 7 781 18 604
4-Loan / repayment given to customers 122 955 -721 890
5-Deposit / withdrawal of the customers 212 243 563 292
6-Securities -715 120
7-Paid-up amount for the employees & creditors -88 672 -80 601
8-Others cash flows from operating activities -37 616 61 705
9-Income taxes -13 542 0
cash FloWs From oPEratioNal actiVitiEs 425 013 38 065
iNVEstmENt actiVitiEs
1-Interest & similar from investment portfolio 11 010 9 607
2-Acquisition / assignment on investment portfolio 1 417 -14 919
3-Acquisition / assignment on immobilization -9 587 -4 392
4-Income of participation securities 7 547 490
cash FloWs From iNVEstmENt actiVitiEs 10 387 -9 214
FiNaNcial actiVitiEs
1a-Shares of BNA 3 551 -233
1b-Shares emission 45 000 -
2-Loans emission 50 000 -
3-Repayment of loans -21 578 -21 578
4-Increase / diminution of special resources -37 103 -11 267
5-Paid-up dividend -7 914 - 7 886
cash FloWs From FiNaNciNg actiVitiEs 31 956 -40 964
Net change in cash & cash equivalents during the period 467 356 -12 113
Cash & cash equivalents at start of the period 320 735 332 848
cash aNd cash EQuiValENts at thE ENd oF PEriod 4.4.1 788 091 320 735
(in thousands of TND)
statEmENt oF cash FloWs For thE PEriod JaNuary 1st to dEcEmBEr 31, 2009

A nnual Repor t 20 09 - Nat ional Agr icultur al Bank
48
31.12.2009 31.12.2008 change in
Volume (%)
assEts
1. cash & credit notes with the central bank, the post office & the treasury 427 593 168 318 259 275 154,0
2. receivables from banking and financial institutions 113 198 72 828 40 370 55,4
3. receivables from customers 4 357 967 4 543 380 -185 413 -4,1
a- debit accounts 498 119 618 878 -120 759 -19,5
b- other assistance to customers 3 342 963 3 363 254 -20 291 -0,6
c- loans out of special resources 489 440 532 601 -43 161 -8,1
d- farming receivables from the state 27 445 28 647 -1 202 -4,2
4. commercial securities portfolio 312 728 349 918 -37 190 -10,6
5- investment portfolio 309 628 319 665 -10 037 -3,1
6- frozen assets 53 593 48 084 5 509 11,5
7- other assets 73 753 75 254 -1 501 -2,0
a- suspense and adjustment accounts 34 076 37 492 -3 416 -9,1
b- Other 39 677 37 762 1 915 5,1
total assEts 5 648 460 5 577 447 71 013 1,3
liaBilitiEs
1. the central bank and the post office 1 8 -7 -87,5
2. deposit & credit notes of banking & financial institutions 15 696 210 964 -195 268 -92,6
3. customers’ deposits and credit notes 4 395 917 4 190 380 205 537 4,9
a- sight deposits 1 108 078 943 506 164 572 17,4
b- other deposits and credit notes 3 287 839 3 246 874 40 965 1,3
4- Borrowings and special resources 567 808 576 471 -8 663 -1,5
a- realised borrowings 52 576 22 164 30 412 137,2
b- special resources 515 232 554 307 -39 075 -7,0
5. other liabilities 188 264 196 376 -8 112 -4,1
a- provisions for liabilities and expensive 7 833 5 842 1 991 34,1
b- suspense and adjustment accounts 131 953 142 684 -10 731 -7,5
c- other 48 478 47 850 628 1,3
total liaBilitiEs 5 167 686 5 174 199 -6 513 -0,1
stockholdErs' EQuity
1a- capital 160 000 100 000 60 000 60,0
1b-shareholders : no called capital -25 000 -25 000
2- reserves 212 749 173 859 38 890 22,4
3- treasury stock -3 -3 678 3 675 -99,9
4. other stockholders’ equity 133 000 133 000 0 0,0
5- income brought forward 28 67 -39 -58,2
total stockholdErs' EQuity 480 774 403 248 77 526 19,2
total liaBilitiEs aNd stockholdErs’ EQuity 5 648 460 5 577 447 71 013 1,3
(in thousands of TND)
BalaNcE shEEt aFtEr distriButioN oF ProFits as at dEcEmBEr 31,2009

A nnual Repor t 20 09 - Nat ional Agr icultur al Bank
49
1 • presentation of the BankThe national agricultural bank BNA is a limited liability company with 160 million dinars in
capital, made up of 32,000,000 shares worth 5 TD each. It is posted on the official list of the Tunis
stock exchange.
At the 14 March 2009 meeting of the extraordinary general assembly it was decided to increase
the Bank’s capital by 60 million dinars (10 MD by incorporating reserves and 50 MD by cash
inputs), for an increase from 100 MD to 160 MD. The first portion of the capital increase in cash
(25 MD) was completed on 6 July 2009 and the remaining second portion in the identical amount
of 25 MD was completed on 9 March 2010. Thus, given that the issue premium came to a total of
20 MD, the overall amount mobilised for this increase amounted to 70 million dinars.
The head office is situated at Hedi Nouira Avenue, 1001 Tunis. The bank is managed by a board
of director.
The bank has 15 regional directions and 155 branches.
The bank finance different sector of activities and nearly all the needs of the agricultural sector.
2 • processinG referential of the financial statementsThe financial statements of the National Agricultural Bank are constituted in accordance with
the terms of the law N° 96-112 of 30 December 1996 which concern the accounting system of the
enterprises, the decree N°96-2459 of 30 December 1996 which support the conceptual confines
of the accounting and accounting principles foreseen in accounting norms for the banking sector.
Number 21 and 25 published in the order of the Finance Ministry at 25th March 1999.
3 • Basic for measurement and accountinG principales usedThe financial statements of the National Agricultural Bank are constituted in accordance with the
decree N°96-2459 of 30 December 1996 which support the conceptual confines of the accounting
and accounting principles foreseen in accounting norms for the banking sector.
The most significant bookkeeping are summarised below.
3.1. Accounting for commitments and related income
3 .1.1. commitments on the off balance sheet
Financing commitments are entered on the off balance sheet as they are contracted and
transferred to the balance sheet as they are disbursed, at nominal value.
NotEs rElatiNg to thE iNdiVidual FiNaNcial statEmENts iN dEcEmBEr 31,2009

A nnual Repor t 20 09 - Nat ional Agr icultur al Bank
50
3. 1. 2. claims on clients
Loans and advances are entered as assets for the amount of funds made available to clients.
Loans granted as net discount are entered at nominal value (funds made available to clients
above and beyond interest entered in advance). Claims on clients (disbursed loans and debit
current accounts) are shown under assets less relevant provisions, interest and reserved fees
and interest entered in advance but not yet accrued. Claims are evaluated and classification
made periodically in line with the terms of BCT circular N°91-24 of 17 December 1991 and
modified by subsequent texts.
Commitments that exceed 50,000 TD are subject to assessment on a case by case basis.
Provisions constituted on these commitments are determined by taking into account accepted
guarantees and reserved fees and interest.
In light of the difficulties encountered in trying to use dated guarantees and procedures applied
during auction sales, a discount of 40% on the value of actual guarantees was applied starting
this year for loan applications transferred for legal action between three years and five years
ago but for loan applications transferred for legal action more than five years ago the discount
is 100%.
Constituting these provisions on filed claims is done in line with the following rates:
category of risk rate of provision
0 and 1 0%
2 20%
3 50%
4 100%
required provisions on commitments that are below 50,000 TD are assessed using a method of
extrapolation in light of the rate for provisioning commitments exceeding 50,000 TD.
The level of provisions required to cover disputed claims of less than 50,000 TD was calculated by
applying to the net outstanding balance of claims (after deduction of commitments on budgetary
funds, those guaranteed by the FNG and the FNE as well as bank charges and reserved interest)
positioning rates varying between 30% and 100% depending on how long ago they were handed
over for legal action. ∏
NotEs rElatiNg to thE iNdiVidual FiNaNcial statEmENts

A nnual Repor t 20 09 - Nat ional Agr icultur al Bank
51
3.1.3. accounting for income relating to client claims
Interest, similar proceeds and encashed commissions as well as accrued products that have
not yet fallen due that are reasonably sure of being encashed are taken into account in results.
When their encashment is not sure, interest and fees are entered as reserved interest and fees,
presented as a minus on the “claims on clients” line. They are posted as proceeds only when they
are actually encashed, to be part of results for the year of encashment.
3.2. Accounting for the securities portfolio and related income
The bank’s securities portfolio falls into two categories: the commercial securities portfolio and
the investment securities portfolio.
3.2.1. commercial securities portfolio and related income
This portfolio includes securities acquired with the intention of selling them off short term. It
is made up of transactional securities and investment securities are assessed at the end of
the year at their stock market value, with latent losses entered as provisions. Treasury bonds
are assessed at their depreciated cost. Income related to fixed income securities are taken into
account in results as they accrue.
3.2.2. investment securities portfolio and related income
The investment securities portfolio includes securities acquired with the intention of keeping
them until they fall due, as well as those whose durable possession is considered useful for
banking activity.
To be found under this category are:
• Certificates of participation, shares in associated companies and shares in related companies.
• Fixed income securities acquired by the bank with the intention of holding them until they
fall due.
• Debt at public enterprises assumed by the Tunisian state.
• Amounts invested in funds managed by the SICAR INVEST company.
Non freed subscriptions are recorded as off balance sheet commitments at the price of issue.
Securities are accounted for at the price of acquisition exclusive of fees and costs except for costs
for studies and consulting committed by the bank at the time of acquisition. Acquisition and sale
A nnual Repor t 20 09 - Nat ional Agr icultur al Bank
52
of securities are entered for the date of transfer of ownership of the securities, i.e. the date on
which the transaction is registered at the Tunis Stock Market.
Encashed dividends, actual gains on sales, income on managed funds and income from bond
loans are posted under the category “income from the investment portfolio” on the results
statement. Dividends not yet encashed but that have been the object of a decision to distribute as
well as proceeds from managed funds and accrued bond loans are also entered as “income from
the investment securities portfolio is subject to assessment on the date of closing by comparing
it with the usual of securities at accounting value. Corresponding provisions are readjusted
accordingly.
The normal value of securities is determined by referring to the stock market value for listed
securities and the mathematical value calculated starting with the last available balance sheet
for non listed securities.
Funds managed by capital risk mutual investment companies are made up of holdings secured
in the framword of onlending agreements. These securities are assessed at the closing date by
referring to the mathematical value of participation in the core funds of the company issuing
securities, taking into account prospects for collection.
3.3. Accounting for client deposits and related costs
Client deposits and assets are made up of :
• sight deposits and savings accounts for which interest fees are calculated and entered on a
quarterly basis and
• Forward investment by clients, either post or pre counted, for which interest is entered as it
accrues.
3.4. Accounting for external loans and related costs
External credit lines are entered on off balance sheets at the time an agreement is signed, and
then entered under liabilities, converted at the rate of exchange on the date it is released, during
discharge of calls for funds. Interest on loans is entered under costs for the year as it accrues.
Losses on exchange on these loans are covered by an insurance policy contracted with the TUNIS
RE COMPANY.
NotEs rElatiNg to thE iNdiVidual FiNaNcial statEmENts
A nnual Repor t 20 09 - Nat ional Agr icultur al Bank
53
3.5.Buying back of core shares
In line with accounting standard NC02 relating to core capital:
• Buy backs of core shares are presented as a deduction from core capital [such shares are
those purchased directly by the bank or through deposited funds management directly by
SICARINVEST],
• Gains or losses on bought back core shares are charged directly to core capital,
• Dividends on core shares are charged to “results carried forward”.
3.6. Reclassification of certain lines on the financial statements:
Certain lines on the financial statements as at 31.12.2008 were processed anew to take into
account the following reclassifications.(in thousands of TND)
Former line New line 31.12.2008
Profits/arbitration transaction monetary rejects PR7 PR8/CH9 27
Commissions collected on banknote exchange PR2 PR3 2 808
Losses and profits on sale of travellers checks PR2 PR3 -6
Loans on the money market in foreign currency (central bank of Tunisia BCT) AC2 AC1 82 223
Interest to be collected /Loans on the money market in foreign currency (BCT) AC2 AC1 169
Interest to be collected/closing of leasing company accounts AC3A AC2 5
Interest to be served /closing of leasing company accounts PA3A PA2 5
Foreign banknotes in foreign currency AC1 PA3B 1 240
4 • notes on lines in the financial statements
4.1- Notes on lines in the balance sheet
4.1.1- cash and assets at the central bank of tunisia Bct, the postal checks centre ccP
and the tunisian general treasury tgt
Cash assets at the BCT, CCP and TGT came to a total of 427,593,000 TD as at 31.12.2009,
compared to 168,318,000 TD as at 31.12.2008, an increase of 259,275,000 TD mainly due to the
higher level of loans on the money market in dinars.

A nnual Repor t 20 09 - Nat ional Agr icultur al Bank
54
(in thousands of TND)
31/12/2009 31/12/2008
Credits notes and cash in Dinars 31 579 29 189
Credits notes and cash in Devises 8 469 13 913
Credits notes and cash with central bank in Dinars 1 978 14 492
Credits notes and cash with central bank in currency 7 878 7 401
Loan on the monetary market in Dinars 329 000
Loan on the monetary market in currency 38 214 82 223
Interest receivable 54 169
Movements with IBS 6 682 9 257
Credits notes and cash with the post office 570 1 177
Credits notes and cash with TGT 3 169 10 497
total 427 593 168 318
4.1.2- claims on banking and financial institutions
Claims on banking and financial institutions increased from 72,828,000 TD as at 31.12.2008 to
113,198,000 TD as at 31.12.2009, an increase of 40,370,000 TD.
The various headings that make up this line as well as their balances can be detailed as follows:(in thousands of TND)
31/12/2009 31/12/2008
a-receivables from banking institutions 110 256 72 823
* sight accounts 4 748 5 090
* loan on the monetary market 105 170 39 752
* loan on the currency market 27 092
* interest receivable 338 889
b-receivables from financial institutions 2 942 5
* sight accounts 2 908
* interest receivable 34 5
total 113 198 72 828
4.1.3- claims on clients
Net claims on clients as at 31.12.2009 came to 4,357,967,000 TD, compared to 4,543,380,000 TD
as at 31.12.2008, a decrease of 185,413,000 (a drop of 4.1%). The structure of these claims by
category is as follows:
NotEs rElatiNg to thE iNdiVidual FiNaNcial statEmENts
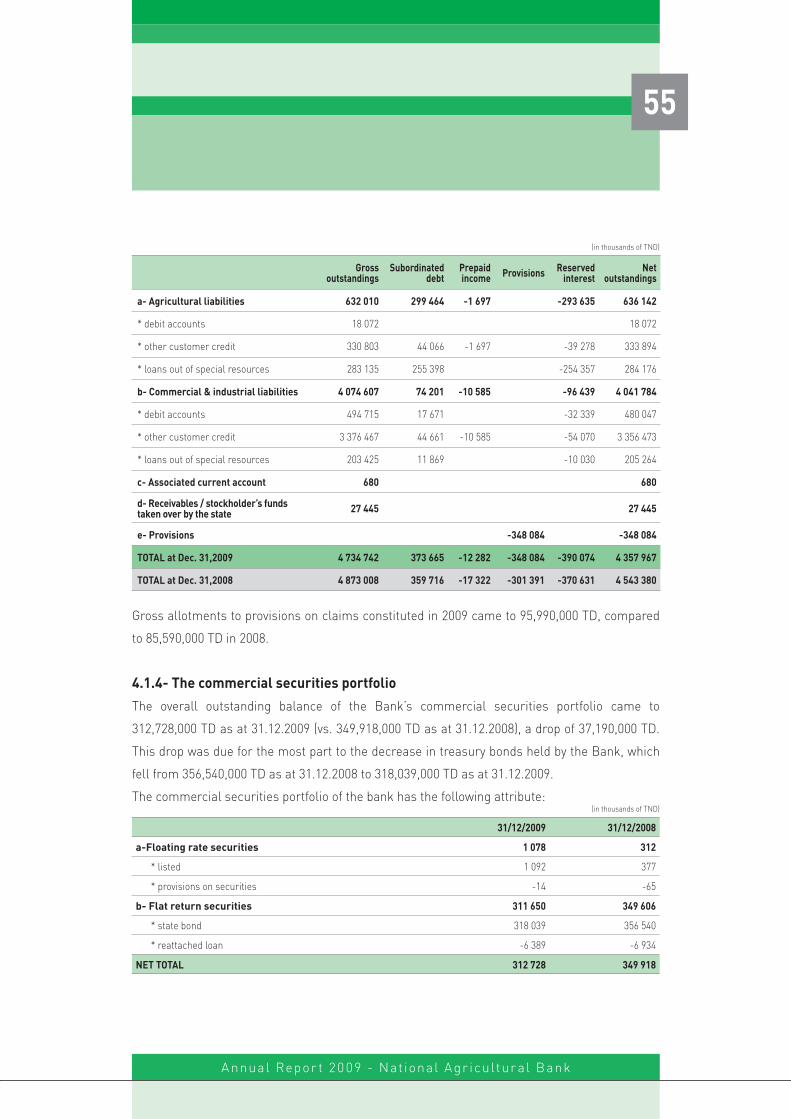
A nnual Repor t 20 09 - Nat ional Agr icultur al Bank
55
(in thousands of TND)
grossoutstandings
subordinateddebt
Prepaid income Provisions reserved
interest Net
outstandings
a- agricultural liabilities 632 010 299 464 -1 697 -293 635 636 142
* debit accounts 18 072 18 072
* other customer credit 330 803 44 066 -1 697 -39 278 333 894
* loans out of special resources 283 135 255 398 -254 357 284 176
b- commercial & industrial liabilities 4 074 607 74 201 -10 585 -96 439 4 041 784
* debit accounts 494 715 17 671 -32 339 480 047
* other customer credit 3 376 467 44 661 -10 585 -54 070 3 356 473
* loans out of special resources 203 425 11 869 -10 030 205 264
c- associated current account 680 680
d- receivables / stockholder’s funds taken over by the state 27 445 27 445
e- Provisions -348 084 -348 084
total at dec. 31,2009 4 734 742 373 665 -12 282 -348 084 -390 074 4 357 967
total at dec. 31,2008 4 873 008 359 716 -17 322 -301 391 -370 631 4 543 380
Gross allotments to provisions on claims constituted in 2009 came to 95,990,000 TD, compared
to 85,590,000 TD in 2008.
4.1.4- the commercial securities portfolio
The overall outstanding balance of the Bank’s commercial securities portfolio came to
312,728,000 TD as at 31.12.2009 (vs. 349,918,000 TD as at 31.12.2008), a drop of 37,190,000 TD.
This drop was due for the most part to the decrease in treasury bonds held by the Bank, which
fell from 356,540,000 TD as at 31.12.2008 to 318,039,000 TD as at 31.12.2009.
The commercial securities portfolio of the bank has the following attribute:(in thousands of TND)
31/12/2009 31/12/2008
a-Floating rate securities 1 078 312
* listed 1 092 377
* provisions on securities -14 -65
b- Flat return securities 311 650 349 606
* state bond 318 039 356 540
* reattached loan -6 389 -6 934
NEt total 312 728 349 918
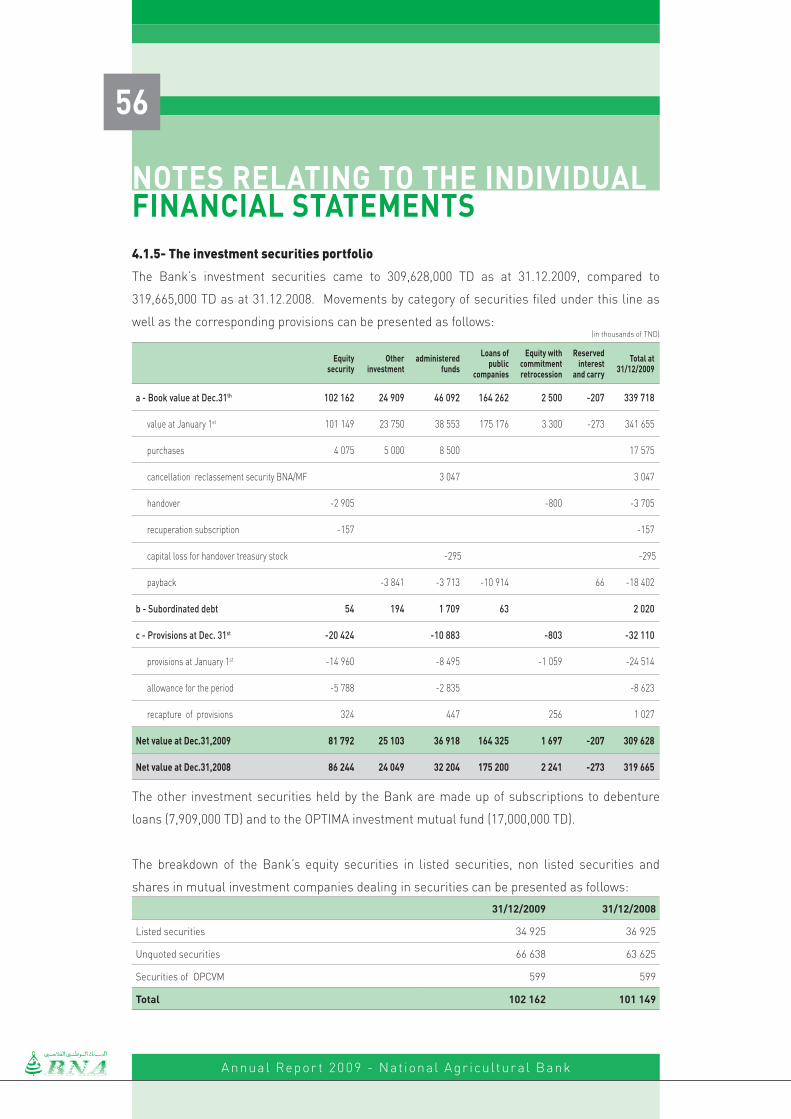
A nnual Repor t 20 09 - Nat ional Agr icultur al Bank
56
4.1.5- The investment securities portfolio
The Bank’s investment securities came to 309,628,000 TD as at 31.12.2009, compared to
319,665,000 TD as at 31.12.2008. Movements by category of securities filed under this line as
well as the corresponding provisions can be presented as follows:(in thousands of TND)
Equitysecurity
otherinvestment
administeredfunds
loans of public
companies
Equity with commitment retrocession
reserved interest
and carry
total at 31/12/2009
a - Book value at dec.31th 102 162 24 909 46 092 164 262 2 500 -207 339 718
value at January 1st 101 149 23 750 38 553 175 176 3 300 -273 341 655
purchases 4 075 5 000 8 500 17 575
cancellation reclassement security BNA/MF 3 047 3 047
handover -2 905 -800 -3 705
recuperation subscription -157 -157
capital loss for handover treasury stock -295 -295
payback -3 841 -3 713 -10 914 66 -18 402
b - subordinated debt 54 194 1 709 63 2 020
c - provisions at dec. 31st -20 424 -10 883 -803 -32 110
provisions at January 1st -14 960 -8 495 -1 059 -24 514
allowance for the period -5 788 -2 835 -8 623
recapture of provisions 324 447 256 1 027
Net value at dec.31,2009 81 792 25 103 36 918 164 325 1 697 -207 309 628
Net value at dec.31,2008 86 244 24 049 32 204 175 200 2 241 -273 319 665
The other investment securities held by the Bank are made up of subscriptions to debenture
loans (7,909,000 TD) and to the OPTIMA investment mutual fund (17,000,000 TD).
The breakdown of the Bank’s equity securities in listed securities, non listed securities and
shares in mutual investment companies dealing in securities can be presented as follows:
31/12/2009 31/12/2008
Listed securities 34 925 36 925
Unquoted securities 66 638 63 625
Securities of OPCVM 599 599
total 102 162 101 149
NotEs rElatiNg to thE iNdiVidual FiNaNcial statEmENts

A nnual Repor t 20 09 - Nat ional Agr icultur al Bank
57
Provisions on equity securities went up from 14,960,000 TD as of 31.12.2008 to 20,424,000 TD
as at 31.12.2009, following assignment in 2009 of an additional allotment to provisions in the
amount of 5,788,000 TD and to entry of recovered funds in the amount of 324,000 TD.
Funds managed by the bank entrusted to SICAR INVEST as of 31.12.2009 were as follows :
year ofallocation initial amount payback
less value on handoverof own stock
total at dec31,2009
managed fund 1 1997 4 500 -1 914 -187 2 399
managed fund 2 1997 2 057 -874 -239 944
managed fund 3 1998 5 550 -3 329 -1 170 1 051
managed fund 4 1999 7 350 -2 674 4 676
managed fund 5 2000 7 000 -1 374 -12 5 614
managed fund 6 2001 7 000 -1 052 -70 5 878
managed fund 7 2002 5 000 -253 -156 4 591
managed fund 8 2003 3 500 3 500
managed fund 9 2005 1 500 1 500
managed fund 10 2006 5 000 5 000
managed fund 11 2007 2 500 2 500
managed fund 12 2008 8 500 8 500
t o t a l 59 457 -11 470 -1 834 46 153
Capital loss for managed fund 8 &9 waiting for allocation
-61 -61
t o t a l 59 457 -11 470 -1 895 46 092
The outstanding balance of provisions on managed funds as at 31.12.2009 came to 10,883,000 TD,
a net additional amount of 2,388,000 TD over the figure as at 31.12.2008.

A nnual Repor t 20 09 - Nat ional Agr icultur al Bank
58
4.1.6- Fixed assets
Fixed assets are assessed at their historic acquisition cost, including all costs and taxes that the
Bank cannot recover. These fixed assets are depreciated according to the following modes and
rates.
Fixed assets kind of depreciation ratio of depreciation
software linear 33%
hardware linear 15%
building linear 2%
spending of organization linear 10%
office furniture linear 10%
material linear 20%
strong-box linear 3%
Net value of tangible and intangible fixed assets as of 31.12.2009 is as follows:(in thousands of TND)
dec.31,2008 purchases /allowances
sales /recoveries
internalallocation dec.31,2009
a-intangible fixed assets 4 931 1 510 - - 6 441
* software 4 931 1 510 - - 6 441
depreciation -4 071 -498 - - -4 569
* software -4 071 -498 - - -4 569
net total (1) 860 1 012 - - 1 872
b-tangible fixed assets 108 028 17 086 -31 -8 978 116 105
* land 5 008 135 -2 074 3 069
* building 47 285 1 784 -31 -3 187 45 851
* land settlement & lay-on 21 629 1 836 - -4 23 461
* haulage materials 1 463 552 - - 2 015
*office furniture 31 035 1 167 - - 32 202
* fixed assets in process 1 093 2 812 - -2 347 1 558
* office furniture in store 318 1 584 - -1 179 723
* advance for office furniture 183 327 - -42 468
* spend for new agency 14 132 - -145 1
* other fixed assets - 6 757 - - 6 757
depreciation -60 804 -3 799 219 - -64 384
* building -17 972 -1 102 219 - -18 855
* land settlement & lay-on -17 504 -858 - - -18 362
* haulage materials -1 301 -81 - - -1 382
*office furniture -24 027 -1 758 - - -25 785
net total (2) 47 224 13 287 188 -8 978 51 721
overall total (1) + (2) 48 084 14 299 188 -8 978 53 593
NotEs rElatiNg to thE iNdiVidual FiNaNcial statEmENts

A nnual Repor t 20 09 - Nat ional Agr icultur al Bank
59
4.1.7- other assets
The bank’s other assets categories came to 75,254,000 TD on 31.12.2008 to 73,753,000 TD on
31.12.2009. (in thousands of TND)
31/12/2009 31/12/2008
a-asset adjustment accounts 34 076 37 492
* sundry debtors 5 199 6 005
* the government tax expenses 7 069 1 389
* management fees receivable 4 691 4 246
* foreign exchange adjustments 281 219
* other account 16 836 25 633
b-other 39 677 37 762
* staff loans 31 769 32 466
* expenses carried over 16 53
* cash card stocks 404 189
* allowance for postage stamps 25 24
* allowance for revenue stamps 5 5
* allowance for special travel stamps 83 67
* deposits and guaranties 143 140
* other account 7 232 4 818
total 73 753 75 254
4.1.8- Banking and financial institutions deposits and assets
This line came to 15,696,000 TD as at 31.12.2009, compared to 210,964,000 TD as at 31.12.2008,
a drop of 195,268,000 TD, largely the result of the drop in loans on the monetary market in dinars
and sight accounts. It can be broken down as follows:(in thousands of TND)
a-deposits & credit notes of banking & financial institutions 31/12/2009 31/12/2008
* deposits & credit notes of banking institutions 12 823 210 021
* deposits & credit notes of financial institutions 2 873 943
total 15 696 210 964
b-Breakdown by type receivable 31/12/2009 31/12/2008
* sight accounts 9 175 29 436
* borrowings on the monetary market (in dinars) - 179 000
* borrowings on the currency market 6 486 2 248
* interest for payment 35 280
total 15 696 210 964

A nnual Repor t 20 09 - Nat ional Agr icultur al Bank
60
4.1.9- Client deposits and assets
Client deposits and assets came to a total of 4,395,917,000 TD as at 31.12.2009, compared to
4,190,380 thousand TD as at 31.12.2008, an increase of 205,537,000 TD, an increase of 4.9%.(in thousands of TND)
31/12/2009 31/12/2008
a- deposits in dinars 4 006 167 3 792 998
* sight deposits 917 965 745 658
* saving deposits 1 466 067 1 320 179
* cash notes 162 423 151 081
* term accounts 219 939 210 608
* special investment accounts 1 054 291 1 229 687
* certificates of deposit 51 500 6 500
* other amounts due to customers 133 982 129 285
b- deposits in currency 368 705 369 634
* sight deposits 189 271 196 918
* cash notes 9 020 8 714
* term accounts 69 131 53 009
* investment accounts 92 048 101 608
* other amounts due to customers 9 235 9 385
c- reattached debt 21 045 27 748
interest to be paid for sight deposits 842 930
interest to be paid for term accounts in currency 23 519
interest to be paid for saving deposits, cash notes, term accounts& other financial product 29 418 35 675
interest given in advance for cash notes and special investment accounts -9 238 -9 376
total 4 395 917 4 190 380
4.1.10- loans and special resources
The Bank’s loans and special resources came to a total of 567,808,000 TD as at 31.12.2009 vs.
576,471,000 in 31.12.2008, which breaks down as follows. It should be noted that over the second
quarter of 2009, BNA launched and successfully closed the first portion of 50 million dinars for
the subordinated bond loan.(in thousands of TND)
31/12/2009 31/12/2008
Bond debt 52 576 586
ABC Bahrain borrowings - 21 578
Special resources 510 626 547 729
Interest for payment 4 606 6 578
total 567 808 576 471
NotEs rElatiNg to thE iNdiVidual FiNaNcial statEmENts

A nnual Repor t 20 09 - Nat ional Agr icultur al Bank
61
4.1.11- other liabilities
The other liability lines came to a total of 176,114,000 TD as of 31.12.2009, compared to
188,376,000d TD as at 31.12.2008. This can be broken down as follows :(in thousands of TND)
31/12/2009 31/12/2008
State's duty 11 194 7 864
Corporation tax 8 606 7 863
Social organism 20 801 17 824
Sundry creditors 36 328 39 850
Other liabilities' adjustment accounts 88 899 108 528
Foreign exchange adjustment accounts 1 892 605
SWAP currency 561
Reserve for liabilities & expenses 7 833 5 842
total 176 114 188 376
4.1.12- Core capital
Gross capital stock equity (prior to deduction of buyback by the bank of its own stock) came to a
total of 492,927,000 TD as at 31.12.2009 vs. 414,926,000 TD as at 31.12.2008. The movement of
capital stock equity in 2009 can be broken down as follows:(in thousands of TND)
Balance atdec.31,2008
appropriation of2008 income
othermovements
Balance atdec.31,2009
Social capital 100 000 60 000 160 000
Shareholders : no called capital - -25 000 -25 000
Endowment from the state 133 000 133 000
Legal reserve 10 000 10 000
Extraordinary reserve 35 051 9 800 -10 124 34 727
Special regime reserve 13 703 13 703
Reserve for tax-exempt reinvestments 25 230 13 594 38 824
Premiums for stock issues & mergers 35 077 20 000 55 077
Reserve for staff provident fund 30 904 500 743 32 147
Income brought forward before distribution 198 -198 -
Income brought forward after distribution 68 82 150
Income for the period 31 763 -31 763 40 299 40 299
total 414 926 -7 999 86 000 492 927

A nnual Repor t 20 09 - Nat ional Agr icultur al Bank
62
In line with the terms of law n°94-30 of 21 February 1994, State allotment of 133,000,000 TD is
not reimbursable until the Bank’s financial balance is re-established.
Among the other movements figure:
• Losses and gains for net value of -124,000 TD, following sale of a portion of its own stock
(- 295,000 TD representing losses, following sale of capital stock equity held through
managed funds and + 171,000 TD representing gains following sale of capital stock equity
held directly by the BNA.
• The 60,000,000 TD capital increase, simultaneously by 10,000,000 TD by incorporation of
reserves and 50,000,000 TD cash inputs, of which 25,000,000 TD were called for and paid in at
the beginning of 2010.
• The 20,000,000 TD increase in the issue premium, following the Bank’s capital increase in
2009.
• The 743,000 TD in interest collected on loans granted from social funds.
• Dividends on BNA’s equity share capital from results carried forward in the amount of
82,000 TD.
4.1.13- Treasury shares
Treasury shares held by the bank came to 3000 TD as at 31.12.2009, compared to 3678 thousand
TD as at 31.12.2008, posting a drop of 3,675,000 TD following:
• sale of treasury shares held directly by BNA, the acquisition value of which amounted to
628,000 TD (1st batch) and 37,000 TD (2nd batch), which posted respective gains of 81,000 TD
and 89,000 TD,
• acquisition at the end of the financial period of treasury shares held directly by BNA for an
amount of one thousand dinars, and
• sale of treasury shares held via managed funds, the acquisition value of which came to
3,048,000 TD and on which losses of 295,000 TD were posted. (in thousands of TND)
Balance atdec 31,2008 Purchase handover Balance at
dec 31,2009
Treasury shares bought back directly -630 -38 665 -3
Treasury stock buy back through managed funds -3 048 0 3 048 0
total -3 678 -38 3 713 -3
NotEs rElatiNg to thE iNdiVidual FiNaNcial statEmENts

A nnual Repor t 20 09 - Nat ional Agr icultur al Bank
63
4.2- Notes on off balance sheet commitments
4.2.1- Sureties, endorsements and other guarantees given
This line came to 714,665,000 TD on 31.12.2009 vs. 703,447,000 TD on 31.12.2008. It breaks down
as follows:(in thousands of TND)
31/12/2009 31/12/2008
a-in favour of banking institutions 100 641 75 466
Debtor by letter of indemnity of our foreign corresponding 100 641 75 466
b-in favour of customers 454 024 467 981
Debtor by endorsement and acceptance 56 560 41 855
Debtor by letter of indemnity 85 228 84 446
Debtor by surety bond 10 025 11 205
Debtor fiscal security 49 545 52 846
Debtor by public bargain security 179 422 156 740
Endorsement on debenture loan 8 075 9 703
Endorsement on treasurer's bill 64 950 110 900
Debtor by banking security on taxation 219 286
c-in favour of the state 160 000 160 000
Budgetary debts transferred by the state 160 000 160 000
total 714 665 703 447
4.2.2- guarantees received (oBs7)
As of 31.12.2009, the line “guaranties received” was made up of the following components: (in thousands of TND)
31/12/2009 31/12/2008
Guarantees received from banks & insurance companies 4 548 4 548
Guarantees received from the state 206 012 209 770
Guarantees received from customers 258 313 274 938
total 468 873 489 256

A nnual Repor t 20 09 - Nat ional Agr icultur al Bank
64
4.3- Notes on the results statement
4.3.1- interest and related income
Interest and related income came to 313,711,000 TD on 31.12.2009 vs. 306,775,000 TD on
31.12.2008 posting a growth rate of 2,3%. Breakdown is as follows:(in thousands of TND)
31/12/2009 31/12/2008
a- Business transaction with banking-houses & financial establishment 10 283 11 863
Interest from loans on dinars monetary market 9 253 3 928
Interest from loans on currency monetary market 809 6 675
Interest from other financial & bank depositary 101 540
Benefit from SWAPS operations 120 720
b- operations with the customers 290 727 283 179
Interest from customer's debtor account 48 795 46 816
Interest from customer's loan 241 932 236 363
c- other interest & assimilated income 12 701 11 733
total 313 711 306 775
4.3.2- commissions collected
Commissions collected by the bank amounted to 44,760,000 TD on 31.12.2009 vs. 44,697,000 TD on
31.12.2008. They broken down as follows :(in thousands of TND)
31/12/2009 31/12/2008
Commissions from transactions on cheques, drafts, transfers and keeping of accounts 23 364 22 040
Commissions on electronic banking 2 936 2 780
Commissions on foreign exchange transactions 715 1 250
Commissions on foreign trade transactions 2 092 1 794
Commissions on rental of safe deposit boxes 21 14
Commissions from review, advisory and arrangement fees 7 962 9 147
Commissions for the management of government and external funds 2 057 1 850
Commissions for guarantees on commercial paper 380 374
Sundry fees 5 233 5 448
total 44 760 44 697
NotEs rElatiNg to thE iNdiVidual FiNaNcial statEmENts

A nnual Repor t 20 09 - Nat ional Agr icultur al Bank
65
4.3.3- gains on the commercial portfolio and financial transactions
This line came to 27,433,000 TD on 31.12.2009 vs. 30,573,000 TD on 31.12.2008. These gains
broke as of 31.12.2009 as follows:(in thousands of TND)
31/12/2009 31/12/2008
a- net gains (or net losses) on placement securities 20 962 22 928
Net interest from treasury bonds (+) 20 895 22 915
Dividends and similar revenue (+) 16 21
Retaking in provisions for depreciation in investment securities (+) 51 16
Endowment for depreciation of securities placement (-) - -24
b- net gains on foreign exchange transactions 6 471 7 645
Positive result from exchange transactions 4 504 4 837
Commissions for manual exchange 1 967 2 808
t o t a l 27 433 30 573
4.3.4- income from the investment portfolio
Income from the investment portfolio came to 10,504,000 TD on 31.12.2009 vs. 9,694,000 TD on
31.12.2008, an increase of 8,4%; Break down is as follows :(in thousands of TND)
31/12/2009 31/12/2008
Income from participation equity 8 456 7 300
Income of bonds 339 346
Income of managed funds 1 709 2 048
total 10 504 9 694
4.3.5- accrued interest and related charges
Accrued interest and related charges came to 153,803,000 TD on 31.12.2009 vs. 173,045,000 TD
on 31.12.2008, an increase of 11,1%; They are broken down as follows: (in thousands of TND)
31/12/2009 31/12/2008
a-Business transaction with banking-houses & financial establishment 1 904 12 654
Interest cost for loans on dinars monetary market 1 275 11 449
Interest cost for loans on currency monetary market 25 109
Interest cost for other financial & ban depositary 459 1 069
Deport/report on operations of SWAP 145 27
b-operation with the customers 134 214 140 630
Interest cost for sight account 4 559 7 254
Interest cost for saving account 38 726 48 085
Interest cost for bonds term account & financial product 90 929 85 291
c-debt 14 170 15 524
d-other interest and & cost 3 515 4 237
total 153 803 173 045

A nnual Repor t 20 09 - Nat ional Agr icultur al Bank
66
4.3.6- allocations for provisions and result of correction of securities on claims, off
balance sheet and liabilities
This category came to 68,263,000 TD on 31.12.2009 vs. 69,597,000 TD on 31.12.2008, a decrease
of 1,334,000 TD. The situation on 31.12.2009 was as follows: (in thousands of TND)
31/12/2009 31/12/2008
Accounting to provisions for doubtful receivables -95 990 -85 590
Forgotten debt -17 065 -10 907
Resumption of provisions for doubtful receivables off-balance sheet commit- ments & liabilities 49 297 29 275
Provisions for various risk -4 569 -2 953
Retaking of various provisions 63 572
Amounts recovered under written-off receivables 1 6
total -68 263 -69 597
4.3.7- Allocations to provisions and result of correction on investment portfolio
securities (REV6/EXP5)
This line came to 633,000 TD on 31.12.2009 vs. 1,751,000 TD on 31.12.2008, as follows:(in thousands of TND)
31/12/2009 31/12/2008
Accounting to provisions for investment portfolio depreciation -5 788 -835
Accounting to managed funds provisions -2 835 -1 833
Capital gains from investment portfolio sales 4 094 490
Exchange gains from investment portfolio 3 453
Exceptional losses on investment portfolio -584 -280
Retaking in provisions made for investment portfolio depreciation 580 644
Retaking in managed funds provisions 447 63
total -633 -1 751
4.3.8- staff costs
Staffs costs came to 95,465,000 TD on 31.12.2009 vs. 80,942,000 TD on 31.12.2008, with breakdown
as follows:(in thousands of TND)
31/12/2009 31/12/2008
Wages 71 402 61 459
Social & fiscal expenditure 19 355 16 125
Other expenditure of employees 4 708 3 358
total 95 465 80 942
NotEs rElatiNg to thE iNdiVidual FiNaNcial statEmENts

A nnual Repor t 20 09 - Nat ional Agr icultur al Bank
67
4.4- Notes on the cash flow Statement
4.4.1- liquidity and quasi liquidity
Liquidity and quasi liquidity totalled 788,091,000 TD as at 31.12.2009 vs. 320,735,000 TD as at
31.12.2008, a positive variation of 467,356,000 TD. Operational, investment and financing activities
yielded a positive net flow of 425,013,000 TD, 10,387,000 TD and 31,956,000 TD. Analysis of these
three components underlines the following observations.
1- Net cash flows from operational activities
The main lines that contributed to this positive net flow of 425,013 thousand dinars are the
following:
• client deposits recorded a net increase between December 2008 and December 2009 of
212,243,000 TD;
• loans to clients recorded a net drop between December 2008 and December 2009 of
122,955,000 TD;
• net disbursements to staff and miscellaneous creditors for the period between 31.12.2008
and 31.12.2009 came to 88,672,000 TD;
• the surplus in proceeds encashed compared to costs disbursed between 31.12.2008 and
31.12.2009 came to 225,579,000 TD.
2- Net cash flows from investment activities
A positive net flow of 10,387 ,000 TD for the period between December 2008 and December 2009
was due mainly to interest and dividends encashed on the investment portfolio in the amount of
11,010 ,000 TD, variation in the investment portfolio for 1417 ,000 TD, and gains and losses on
equity securities in the amount of 7547 ,000 TD, partially offset by acquisition of fixed assets in
the amount of 9587 ,000 TD.
3- Net cash flows from financing activities
The positive net flow of 31,956,000 TD for the period between December 2008 and December
2009 was due mainly to issue of shares in the amount of 45,000,000 TD (nominal: 25,000,000
Tunisian dinars and issue premium: 20,000,000 TD) and launching of a subordinated loan in the
amount of 50,000,000 TD, partially offset by reimbursement of 21,578,000 TD in borrowings, the
37,103,000 TD drop in special resources, and dividends paid in the amount of 7,914,000 TD.

A nnual Repor t 20 09 - Nat ional Agr icultur al Bank
68
4- liquidity and quasi liquidity
This heading is made up of cash holdings in dinars and foreign currency at the Central Bank
and the postal check centre as well as net assets at banking institutions, interbank loans and
borrowings of a duration of less than three months, and the transaction securities portfolio.
Such liquidity and quasi liquidity amounted to 788,091,000 Tunisian dinars as of 31.12.2009,
mainly from the following lines:
(in thousands of TND)
liQuidity aNd Quasi liQuidity at thE ENd oF thE PEriod 788 091
liquidity in tunisian dinars 451 357
Cash in dinars 31 579
Holding at the central bank of Tunisia in dinars 1 978
Holding at the postal check centre 570
IBS Transactions 6 682
TGT check to be encashed 3 169
Investments in dinars 407 500
Corresponding debit in dinars 7 642
Corresponding credit in dinars -7 763
liquidity in foreiGn currency 43 284
Cash in foreign currency 8 469
Holdings at the Central Bank of Tunisia in foreign currency 7 877
Corresponding debit in foreign currency 15
Corresponding credit in foreign currency -1 413
Investments in foreign currency 28 336
BorroWinGs in dinars -
BorroWinGs in foreiGn currency 6 485
iNVEstmENt For morE thaN thrEE moNths* 299 935
* Investment in bonds equivalent to Treasury bonds (BTA) and zero coupon Treasury bonds (BTZC), which are part of the commercial securities portfolio, are considered to be quasi liquidity.
NotEs rElatiNg to thE iNdiVidual FiNaNcial statEmENts

A nnual Repor t 20 09 - Nat ional Agr icultur al Bank
69
In execution of the mandate entrusted to us by the General Assembly, we hereby present to you
our general audit report on the financial statements of the National Agricultural Bank as at 31
December 2009 annexed to this report along with the specific verifications outlined in legislation
and professional norms.
■ opinion on the financial statements
We have audited the BNA’s (National Agricultural Bank) financial statements as of 31 December
2009, which were drawn up under the responsibility of the Bank’s executive management and
administration.
Such responsibility is for design, establishment and monitoring of internal control for drawing
up and sincerely presenting financial statements that present no significant anomalies, whether
as a result of fraud or error, the choice and application of appropriate accounting methods and
determination that accounting has been presented in a reasonable manner in view of circumstances.
Our responsibility is limited to expressing an opinion on these statements on the basis of our
audit. We have carried out the audit following international audit norms, in line with the terms
of reference for audit of the financial statements of loan institutions given in the Central Bank of
Tunisia’s note to banks n°93-23 of July 1993. These norms require that the audit be planned and
carried out in a manner that gives reasonable assurance that the financial statements do not
contain any significant anomalies.
An audit implies the use of procedures that will provide convincing proof about the amounts and
information found in the financial statements. The choice of procedures is left to our judgement,
as is assessment of the risk that financial statements could contain significant anomalies, due
to either fraud or error. In proceeding with this risk assessment, we have taken into account the
internal controls used at the bank for establishing and faithfully presenting financial statements,
so as to define audit procedures that are appropriate to the circumstances, rather than to give
an opinion on the effectiveness of its procedures. An audit also calls for giving an opinion about
the appropriateness of the accounting methods used and the reasonable nature of accounting
estimates made by the management, as well as assessment of the overall manner in which
financial statements are presented.
We consider that the work carried out in this framework constitutes a reasonable basis to support
our conclusions.
The attached financial statements covering the period 1 January through 31 December 2009
gENEral rEPort oF thE auditors oN thE FiNaNcial statEmENts

A nnual Repor t 20 09 - Nat ional Agr icultur al Bank
70
show a net balance sheet total of 5 648.5 million dinars and net profits of 40.3 million dinars.
This result is due to the following factors:
• Allotment of net provisions and of the result of correction of values on claims, off balance
sheet and liabilities in the amount of 68.3 million dinars
• Corporate tax in the amount of 8.6 million dinars
• Proceeds from sale of equity securities in the amount of 7.5 million dinars
On the basis of a diligent review, we find that the financial statements of the National Agricultural
Bank are correct and faithfully represent in all significant ways the financial situation at the
National Agricultural Bank along with the result of its operations and cash flows for the year
ending 31 December 2009, in line with the accounting principles generally used in Tunisia.
■ specific reviews
We have proceeded with the review and specific verifications outlined in legislation, in line with
audit norms applicable in Tunisia. On the basis of our review, we have neither discovered nor heard
of any significant inconsistencies in the account data provided in the boards annual management
report that are in contradiction with bank’s financial statement’s at 31 December 2009.
In the framework of our audit and in application of (new) article 3 or law N° 94-117 governing
reorganisation of the financial market as modified in subsequent texts, we have reviewed internal
audit procedures relating to how accounting data is handled and how financial statements
are prepared. This review has enabled us to identify a number of inadequacies in the bank’s
information and internal audit system. And in application of the terms of article 19 of decree
n°2001-2728 of 20 November 2001, we have carried out the required verifications and have found
nothing to report regarding conformity of the stock accounts issued by the National Agricultural
Bank in the context of prevailing regulations.
Tunis, 26 April 2010
co auDitorS
p/ cmc – dfk international p/ Gac – cpa international
Chérif BEN ZINA Chiheb GHANMI

A nnual Repor t 20 09 - Nat ional Agr icultur al Bank
71
In application of the terms of article 29 of law n°2001-65 of 10 July 2001 concerning loan
institutions and articles 200 and 475 of the commercial company code, we would like to inform
you of the conventions outlined in these articles to be used or which remain in force for 2009.
Our responsibility is to ensure that legal procedures for authorising and approving these
conventions or operations and that they are correctly translated, in fine, in the financial
statements. It is not up to us to specifically seek in a sustained manner the possible existence of
such conventions or operations but to transmit to you, on the basis of information we have received
as well as information obtained through our audit procedures, their essential characteristics and
modalities, without commenting on their usefulness or justification. It is up to us to assess the
interest attached to the conclusion of these conventions and the carrying out of these operations
with a view to their approval.
■ Funds managed by sicar iNVEst
The National Agricultural Bank signed agreements with its affiliate SICAR INVEST to manage capital
risk funds. These managed funds are broken down as follows:(in thousands of TND)
specifications amount of fund outstanding of fund in theend of 2009
BNA fund 1 (1997) 4 500 2 399
BNA fund 2 (1998) 2 057 944
BNA fund 3 (1999) 5 550 1 051
BNA fund 4 (2000) 7 350 4 676
BNA fund 5 (2000/2001) 7 000 5 614
BNA fund 6 (2002) 7 000 5 878
BNA fund 7 (2003) 5 000 4 591
BNA fund 8 (2004) 3 500 3 500
BNA fund 9 (2005/2006) 1 500 1 500
BNA fund 10 (2007) 5 000 5 000
BNA fund 11 (2008) 2 500 2 500
BNA fund 12 (2009) 8 500 8 500
total 59 457 46 153
sPEcial rEPort oF thE auditors oN thE FiNaNcial statEmENts

A nnual Repor t 20 09 - Nat ional Agr icultur al Bank
72
Conditions for remunerating these funds are summarised as follows:
• A 0.5% management commission on the outstanding balance of funds entrusted to them, up
to 200,000 dinars a year.
• Collection fees of :
- 0.75% if the claim dates back less than three months
- 1.50% if the claim dates back between three months and one year
- 2.50% if the claim dates back more than one year
• A 3% commission on proceeds taken in.
■ conventions regarding trustees of securities and funds In light of trusteeship agreements with « SICAV PLACEMENT OBLIGATAIRE », « SICAV BNA » and
« BNA-CAPITAUX », the National Agricultural Bank plays the role of trustee for securities and
funds. To remunerate these services, the bank receives the following commissions:
• « SICAV PLACEMENT OBLIGATAIRE »: 0.15% exclusive of tax on the amount of net assets;
• « SICAV BNA »: 1000 dinars exclusive of tax per annum;
• « BNAC CONFIANCE FCP»: 0.1% including tax on the amount of net assets, paid quarterly;
• « BNAC PROGRES FCP»: 0.1% including tax on the amount of net assets, paid quarterly.
■ convention regarding the keeping of a register on stockholders and related services
The agreement between the National Agricultural Bank and BNA-CAPITAUX was updated in
2007 to include the following:
• Keeping up the register of stockholders and related services, for which BNA-CAPITAUX
received a lump sum payment of 50,000 dinars for 2007, down to 40,000 dinars in 2008 and
30,000 dinars in 2009;
• Portfolio management on behalf of the National Agricultural Bank for which BNA-CAPITAUX
received:
- A commission amounting to 0.4% of the amount of the transaction;
- A commission amounting to 0.2% of the amount of the coupon on encashment of coupons;
- Fees of 0.075% for keeping accounts, calculated as a percentage of the stock portfolio, up to a
maximum of 2 500 dinars per stock;
• Portfolio management on behalf of BNA clients, for which BNA-CAPITAUX received payment
in line with the latter’s prices to the public [For stock market transactions via the BNA
network, it was agreed that relevant transaction fees would be split evenly between the
National Agricultural Bank and BNA-CAPITAUX].

A nnual Repor t 20 09 - Nat ional Agr icultur al Bank
73
■ transactions carried out with the « tuNisia comPutEr sErVicEs comPaNy »
The amount for purchases of equipment, computer supplies and services provided by the
«TUNISIA COMPUTER SERVICES COMPANY» came to 1 037 170 dinars in 2009 vs. 2 225 367 dinars
in 2008.
■ rental contract with BNa-caPitauX
In 2009 the National Agricultural Bank rented business premises to BNA-CAPITAUX for Sousse
branche.
Because it did not give notice three months before expiration of the contract, the current rental
agreement has been renewed for a new period of one year, under the same conditions but with
a 5% increase in the price of rent, until such time as notice is given by registered letter with
confirmation of receipt by either the renter or the owner.
Since 1st April, Monthly rent is set at 420 dinars, exclusive of tax and payable in advance.
In 2009 the «National Agricultural Bank» rented premises for commercial use to «BNA Capitaux».
This contract runs for a period of one year, renewable by tacit agreement. Annual rent comes to
4 630,500 dinars, exclusive of tax, starting 1 July 2009.
■ remuneration and advantages for leaderships and administrators
• Gross remuneration to the deputy president director general in 2009 came to 66 420,400 dinars,
including benefits in kind.
• Gross remuneration to the deputy managing director in 2009 came to 60 601,970 dinars,
including benefits in kind.
• Attendance fees for board members in 2009 came to a gross total of 57 187 500 dinars.
Tunis, 26 April 2010
co auDitorS
p/ cmc – dfk international p/ Gac – cpa international
Chérif BEN ZINA Chiheb GHANMI

A nnual Repor t 20 09 - Nat ional Agr icultur al Bank
74
FIRST RESOLUTION:
The Ordinary General Assembly, after having listened to reading of:
• the Board’s report on BNA activity and individual financial statements, on BNA group activity,
and on consolidated financial statements relating to 2009
• reports of the audit commission on BNA’s financial statements and consolidated financial
statements as of 31.12.2009.
Takes note of the conclusions given in audit reports and approves the Board’s reports as well as
the individual and consolidated financial statements as of 31.12.2009 as presented to it.
Consequently, it entirely and unreservedly absolves the Board of their management responsibilities
regarding 2009 accounts.
This resolution is adopted unanimously.
SECOND RESOLUTION:
The Ordinary General Assembly, after hearing reading of the auditor’s special report on operations
that are the object of articles 200 and following as well as 475 of the commercial companies code
and article 29 of law n° 2001-65 as modified by law n° 2006-19, takes note of the conclusions of
this report.
This resolution is adopted unanimously.
THIRD RESOLUTION:
As proposed by the Board, the Ordinary General Assembly decided to allot 2008 profits to be
distributed as follows:results 40.298.750,302 dt
Carried forward from 2008 150.148,629 DT
Profits to be distributed 40.448.898,931 dt
Legal reserves 2.022.444,947 DT
Reserves for tax-exempt reinvestment 21.350.000,000 DT
Reserves for special regime 4.098.336,660 DT
Extraordinary reserves 300.000,000 DT
Social funds 500.000,000 DT
Results to be carried forward 28.117,324 DT
total assigned 28.298.898,931 dt
remainder to be distributed 12.150.000,000 dt
Dividends (9%) 12.150.000,000 DT
Dividends for 2009 were thus set at 0.450 TD net per share. These dividends will be released for
payment starting on 7 June 2010.
This resolution is adopted at the majority.
rEsolutioNs adoPtEd By thE ordiNary gENEral assEmBlyoN 21 may 2010

A nnual Repor t 20 09 - Nat ional Agr icultur al Bank
75
FOURTH RESOLUTION:
The Ordinary General Assembly decided, on the basis of a proposal by the Board, to deposit in «
Carry forward » account dividends from BNA shares acquired in line with the terms of article 19
of law n° 94-117 of 14 November 1994, i.e. 82 468,800 dinars.
This resolution is adopted unanimously.
FIFTH RESOLUTION:
The Ordinary General Assembly decided, on the basis of a proposal by the Board, to deduct
124 375,393 TD from the Extraordinary reserves to regularize the capital loss registered In the
framework of transfer of BNA shares acquired in line with the terms of article 19 of law n° 94-117
of 14 November 1994.
This resolution is adopted unanimously.
SIXTH RESOLUTION:
The Ordinary General Assembly authorises buy back by the Bank of its core stock, as allowed for
in the terms outlined in law n° 94-117 of 14 November 1994, law n° 99-92 of 17 August 1999 and
Minister of Finance decree of 17 November 2000, with a view to regulating the market.
It delegates to the Board the power to set maximum buying prices and minimum resale prices,
the maximum number of shares to be acquired and the timeframe for acquisitions to be made,
authorising it to use extraordinary reserves for coverage of losses that can be entered.
This resolution is adopted unanimously.
SEVENTH RESOLUTION:
The Ordinary General Assembly authorises issue by the National Agricultural Bank of one
or more bond loans, up to 100 million dinars, for the period between the present Assembly’s
meeting and the one that will approve the following year’s accounts. The Board is authorised to
set the amounts, conditions and modalities for each issue.
This resolution is adopted unanimously.
EIGHTH RESOLUTION:
The Ordinary General Assembly sets the net amount for directors’ tokens in 2009 at five thousand
(5000 dinars) per administrator.
This resolution is adopted unanimously.

A nnual Repor t 20 09 - Nat ional Agr icultur al Bank
76
NINETH RESOLUTION:
The Ordinary General Assembly notes the designation of Mr. Youssef NEJI as the administrator
representing the cereals board to replace Mr. Mohamed Fadhel ZRELLI.
This resolution is adopted unanimously.
TENTH RESOLUTION:
The Ordinary General Assembly designed “GEM” represented by M Abderrazek Gabsi and “CSL”
represented by Samir Laarbi as co – auditors, that certified the Individual Financial Statements
and Consolidated Financial Statements of the BNA for the exercises 2010-2011-2012.
Their mandate expired on the Ordinary General Assembly,
This resolution is adopted unanimously.
ELEVENTH RESOLUTION:
The Ordinary General Assembly designed, for the years 2010-2012, the administrators bellow:
- Mr. Moncef Dakhli, represent Tunisian State .
- The Ministry Of Finance, two represented by two members.
- The Ministry Of Development And International Cooperation, represented By one member
- The Ministry Of The Agriculture And Of The Hydraulic Resources, represented By one member
- The « Office des Céréales », represented By one member
- The « Caisse Nationale de Sécurité Sociale », represented By one member
- The « Office du Commerce de la Tunisie », represented By one member
- The « Caisse Tunisienne des Assurances Mutuelles Agricoles », represented By one member
- Mr. Sahbi Mahjoub.
- Mr. Ali El Hlioui.
- Mr. Mustapha Lahmar.
Their mandates expired in the Ordinary General Assembly that decided on financial statements
for exercise 2012.
This resolution is adopted at the majority.
TWELVETH RESOLUTION:
The bearer of a copy or extract of these minutes is free to dispose of them or publish them as
required.
This resolution is adopted unanimously.

A nnual Repor t 20 09 - Nat ional Agr icultur al Bank
77
actiVity at thE BNa grouP iN 2009
activity at the BNa group 77
Consolidated financial situation 78
Perimeter of Consolidation 84
Consolidated Financial Statements 85
Notes on Consolidated Financial Statements 89
Auditors Report on the Consolidated Financial Statements. 110

A nnual Repor t 20 09 - Nat ional Agr icultur al Bank
78
■ consolidated financial situation
The national agricultural bank’s consolidated financial statements as well as those of companies
in its perimeter of consolidation as at the end of 2009 show the following main developments.
• A 1.8% increase in the total of the consolidated balance sheet to 6015 MD as at 31.12.2009 vs.
5908 MD as at 31.12.2008.
• A 21.4% increase in the outstanding balance of capital stock equity, for a total of 505 MD in
2009 vs. 416 MD in 2008.
• A 4.1% drop in the outstanding balance of shares in companies accounted for under the
equity method, down from 19.9 MD as at 31.12.2008 to 19.1 MD as at 31.12.2009.
• The total of consolidated operating proceeds amounted to 407.3 MD at the end of 2009,
compared to 401.2 MD in 2008, an increase of 1.5%.
• Consolidated operational costs came to a total of 149.5 MD as at 31.12.2009 vs. 171.8 MD at
the end of the previous year, a decrease of 12.9%.
• Consolidated net banking proceeds went up by 12.3% to 257.8 MD in 2009, compared to 229.5
MD in 2008.
• Operating costs came to 186.9 MD in 2009 vs. 151.4 MD in 2008, an increase of 23.4%.
• The share of the group in the results of companies accounted for under the equity method
moved from -1,930,000 dinars as at 31.12.2008 to -89,000 dinars at the end of 2009.
• The consolidated net result for 2009 came to 46.029 million dinars, of which 40.892 million
dinars were from the positive contribution of the BNA as the consolidating company,
1.901 million dinars from that of BNA-CAPITAUX and 1.174 MD from that of SO.FIN.REC. The
positive contribution of the real estate group to the consolidated result came to 1.653 MD for
2009.
It should be noted that compared to 31.12.2008, the consolidated net result posted an increase
in volume of 12.8 million dinars, attributable for the most part to the +12.9 million dinar greater
positive contribution of BNA (the consolidating company) and of BNA-CAPITAUX (1.0 million
dinars) and the drop in that of the real estate group for an amount of 1.0 MD.
actiVity at thE BNa grouP iN 2009

A nnual Repor t 20 09 - Nat ional Agr icultur al Bank
79
contribution to the consolidated result(in thousands of TND)
denomination contribution to the consolidated result
of 2008
contribution to the consolidated result
of 2009
NATIONAL AGRICULTURAL BANK (consolidating company) 27 949 40 892
SOFINREC 1 362 1 174
BNA–CAPITAUX 923 1 901
SIVIA 894 229
SIMPAR 699 931
ESSOUKNA 664 708
SICAF PARTICIPATIONS BNA 252 21
Les Œillets 203 228
EL MEDINA 173 -443
SOIVM-SICAF 138 579
SICAR INVEST 78 4
SOGEST 61 37
SICAV BOND INVESTMENT COMPANY 7 7
IFRIKIA 3 5
SICAV–BNA 0 2
ZIED -2 -1
AGRO-SERVICES -5 22
SIP SICAR -50 -88
T.I.S -88 -180
coNsolidatEd rEsult oF thE grouP 33 265 46 029
■ FINANCIAL AFFILIATES
BNa caPitauX
BNA Capitaux is a stockbrokerage firm. Initial capital was 2.5 million dinars, now standing at
5 million dinars, made up of 50,000 shares worth 100 dinars each, 99% of which is held by the
National Agricultural Bank. The company works mainly in stockbrokerage and management of
stock portfolios and holdings of any kind as well as management of stock mutual investment
funds in any form.
In 2009, the total of transactions on the Tunis Stock Exchange came to 3324 million dinars
compared to 4130 million dinars in 2008. The volume of transactions carried out by BNA-
Capitaux on the official list market came to 278,688,000 dinars in 2009 compared to 198,536,000
dinars the year before, for a market share of 7.6%, in third place out of a total of 23 stockbrokers.
Corporate income rose by 30% over the 2008 figure, coming to 3,221,000 dinars and the net

A nnual Repor t 20 09 - Nat ional Agr icultur al Bank
80
result was 1,953,000 dinars as at 31/12/2009, a 127% increase. This improvement was the result
of BNA Capitaux’s main activity of stockbrokerage, which continues to post exceptional results,
with turnover of 3.2 million dinars in 2009, compared to 2.0 million dinars in 2008 and 1.8 million
dinars in 2007.
At the same time, operating costs grew more slowly, yielding an operating result that has risen
by +100% every year since 2007. This main activity is thus structurally beneficiary and profitable.
Activity in the securities portfolio also recorded satisfactory results, an increase of 37% over the
2008 figure.
THE STOCK INVESTMENT COMPANY «SOIVM SICAF»
SOIVM SICAF was founded in July 1993 with initial capital of two million dinars, now standing at
4 million dinars, made up of 400,000 shares with a nominal value of 10 dinars each. This is a
company that uses its core funds to manage a stock portfolio.
BNA’s holdings in this closed-end investment company amounted to 63% or 2,514,000 dinars.
Income derives from dividends and proceeds from investment, closely linked to economic and
stock market conditions.
In 2009, net income from investments went up by +288% to 1,109,000 dinars. Operational results
came to +1,028,000, an increase of 307% and the net result was +1,015,000 dinars vs. 251,000
dinars in 2008.
OPEN END BOND MUTUAL INVESTMENT COMPANY
The open end mutual investment company was founded in September 1996 with initial capital of
300,000 dinars held exclusively by the BNA group. As at 31/12/2009 it came to 329,936,000 dinars.
Maintaining and managing a stock portfolio using nothing but its own funds.
As at 31/12/2009, its net assets came to 304,599,000 dinars vs. 256,246,000 dinars as at
31/12/2008, an increase of 19%. It posted 2009 net profits of 15,118,000 dinars, a 10% increase
over the previous year’s figure, allowing for distribution of dividends in the amount of 4.289 dinars
per share. Posted yield was 4.12%.
BNA OPEN END MUTUAL INVESTMENT COMPANY
SICAV BNA is an open end investment company founded in 1993 with a corporate mandate to
constitute and manage a stock portfolio using its core funds. Initial capital was 300,000 dinars,
which had increased to 3,653,000 dinars as at 31.12.2009. Net assets rose by 37% in 2009, up
from 2,493,000dinars to 3,413,000. Similarly, net results went up considerably, from 131,000
actiVity at thE BNa grouP iN 2009

A nnual Repor t 20 09 - Nat ional Agr icultur al Bank
81
dinars in 2008 to 653,000 dinars in 2009. Thus distributable results went up by 25%, which led to
an increase in distribution of dividend per share to 0.577 dinar for 2009, up from 0.501 dinar the
year before.
THE CAPITAL RISK INVESTMENT COMPANY «SICAR INVEST »
SICAR INVEST was founded in March 1997 with initial capital of 2 million dinars. It currently
stands at 8 million dinars, entirely paid in. The object of this venture capital investment company
is essentially to participate (for its own account or on behalf of others) in increasing corporate
stock equity. SICAR INVEST’s income is made up of commissions for management of funds,
commitments for study, proceeds from investment and gains on onlending. This income came
to 765,000 dinars in 2009, posting a drop of 18% from the 2008 figure.
Other operating proceeds were marked by a high increase, up from 184,000 dinars in 2008 to
555,000 in 2009, given the higher level of proceeds from investment and recovery on provisions.
Operating costs posted an increase of 12%, up from 933,000 dinars in 2008 to 1,043,000 dinars in
2009. Net results rose by 31%, up from 168,000 dinars in 2008 to 221,000 in 2009. The company’s
overall balance sheet came to 68,268,000 dinars in 2009, an increase of 3.7% and the core stock
portfolio for onlending up from 9,119,000 dinars in 2008 to 8,713,000 in 2009.
THE CAPITAL RISK INVESTMENT COMPANY «SIP-SICAR»
SIP SICAR is a capital risk investment company founded in 1997 with initial capital of 2 million
dinars, now standing at 3 million dinars entirely paid in. SIP SICAR’s income is made up of
proceeds from investment and piggybacking on the securities it manages.
Operating proceeds dropped by 13%, down from 307,000 dinars in 2008 to 268,000 in 2009.
2009 posted a net deficit of 248,000 dinars, compared to a deficit of 142,000 in 2008.
THE FINANCIAL CLAIM COLLECTION COMPANY «SO.FIN.RE.C»
SO.FIN.REC is a claim collection company affiliated to the National Agricultural Bank. Founded
in 2001, its current capital is 3 million dinars, entirely paid up, divided into 600,000 shares with
a nominal value of 5 dinars each, 90% of which is held by the National Agricultural Bank. This
capital is being increased to 8 million dinars to help handle new acquisition of claims and to
remain in conformity with prudential ratios for claim collection companies. SOFINREC’s work
involves the acquisition of claims and collection for itself and on behalf of others.
2009 posted a 9.7% increase in collection to 13,175,000 dinars, leading to net income from
collection in the amount of 7,129,000 dinars, an increase of 4%. At the end of 2009, net results
had posted an increase of 20% (660,000) over the 2008 figure.

A nnual Repor t 20 09 - Nat ional Agr icultur al Bank
82
THE «SICAF PARTICIPATIONS BNA» COMPANY
SICAF PARTICIPATIONS BNA is a close-end investment company, founded in December 2003
with capital of 500,000 dinars held exclusively by the National Agricultural Bank.
This company recorded final liquidation of three companies in their portfolio in 2009, exclusive
of any distribution. Consequently, SPB’s stock portfolio counted 46 companies as at 31/12/2009.
The year closed with a net gain of 22,000 dinars vs. 257,000 in 2008 despite the absence of income
from the stock portfolio.
■ REAL ESTATE GROUP
THE REAL ESTATE AND STOCK COMPANY «SIMPAR»
SIMPAR was founded in April 1973 with initial capital of 300,000 dinars. There have been several
increases since then and capital now stands at 3,500,000 dinars for 700,000 shares.
In 2009 SIMPAR posted turnover of 20,725,000 dinars vs. 15,338,000 in 2008, an increase of 35 %.
2009 showed profits that were 44% higher at 3,656,000 dinars vs. 2,534,000 in 2008.
THE REAL ESTATE AND DEVELOPMENST COMPANY «SIVIA»
«SIVIA» is a limited liability company, founded in April 1980 with initial capital of 900,000 dinars,
currently standing at 1,400,000 dinars. «SIVIA» handles all kinds of real estate operations
Activity at SIVIA involved all kinds of real estate transactions. It posted 12,552,000 dinars in
turnover in 2009, up from 12,079,000 in 2008, for an increase of 3.9 %. 2009 showed profits of
900,000, which allowed for distribution of dividends at the same 10% rate as the year before.
THE ESSOUKNA COMPANY
ESSOUKNA is a real estate promotion company, founded in November 1983 with initial capital of
800,000 dinars, now standing at 3,006,000, with 3,006,250 shares worth 1 D nominal each.
2009 turnover came to 17,347,000 dinars vs. 17,272,000 in 2008. Net results were up by 35%,
from 2,303,000 dinars in 2008 to 3,104,000, allowing for distribution of dividends in the amount of
0.280 dinar per share.
THE «EL MEDINA» REAL ESTATE PROMOTION COMPANY
«EL MEDINA» is a limited liability company founded in 1988, with capital currently posted at
900,000 dinars.
EL MEDINA’s work involves purchase and sale all real estates.
actiVity at thE BNa grouP iN 2009

A nnual Repor t 20 09 - Nat ional Agr icultur al Bank
83
2009 turnover came to 8137 thousand dinars vs. 7344 thousand dinars in 2008, an increase of
11%. The 23.6% increase in operating costs brought about net results that fell from 591 thousand
dinars in 2008 to 119 thousand dinars in 2009.
THE «ŒILLETS» REAL ESTATE COMPANY
The Œillets Real Estate Company is a limited liability company, founded in December 1997 with
initial capital of 150,000 dinars, currently standing at 900,000 dinars. Its initial purpose was to
build housing for BNA staff but in 2003 this expanded to include housing initiatives of all kinds.
2009 turnover dropped by 38%, down from 3789 thousand dinars in 2008 to 2340 thousand dinars
in 2009. Similarly, net results, although remaining positive, went down from 340 thousand dinars
in 2008 to 229 thousand dinars in 2009.
THE GENERAL COMPANY FOR STUDIES, SUPERVISION AND WORKS «SOGEST»
SOGEST is a limited liability company, founded in December 1978. It handles engineering advice,
including technical studies, oversees worksites, supervises, coordinates and verifies work in civil
engineering and construction.
2009 turnover came to 1,128,000 dinars and net results to 204,000 dinars in 2009, compared to
1,015,000 and 195,000 dinars respectively in 2008. SOGEST performance remained fairly good,
helping it to distribute dividends of 7.5 dinars per share in 2009 compared to 7 dinars in 2008.
■ SERVICE COMPANIES
AGRO-SERVICES
«Agro-Services» is a limited liability company, founded in June 1991 with capital of 200,000
dinars. Now its capital is 600,000 dinars. It participates in development of agriculture and fishing,
carrying out feasibility studies and providing technical assistance relating to the production and
management of agricultural operations.
Turnover rose by 3.4%, up from 2,473,000 dinars as at 31.12.2008 to 2,558,000 in 2009. 2009
posted positive results of 70,000 dinars vs. a deficit of 16,000 dinars in 2008.
TUNISIA COMPUTER SERVICES COMPANY «TIS»
TIS, founded in June 1991 with capital of 250,000 dinars, works in developing computer solutions,
telematics and electronic banking.
Income was from services rendered and from sale of material. It fell by 30.5%, from 2,930,000
dinars in 2008 to 2,037,000 dinars in 2009. 2009 posted a deficit of 129,000 thousand dinars.

A nnual Repor t 20 09 - Nat ional Agr icultur al Bank
84
denomination and address activity Percentageof control
Percentageof interest
B.N.ARue Hédi Nouira - Tunis financial services 100,00% 98,53%
gloBally iNtEgratEd suBsidiary comPaNiEs
SOIVM-SICAF Stock Investment CompanyRue Hédi Nouira – Tunis financial services 100,00% 74,30%
SICAV–BNA BNA’s Variable Capital Mutual Investment FundImmeuble Ennouzha – Cité Ennasim – Montplaisir – Tunis financial services 22,38% 19,87%
BNA–CAPITAUXRue 8301 Immeuble Ennozha - Montplaisir – Tunis financial services 100,00% 97,98%
Placement Obligataire-SICAV Bond Investment CompanyRue Hédi Nouira – Tunis financial services 0,08% 0,05%
SICAR INVEST Capital Risk Investment Company67, Avenue Jughurta - Mutuelleville – Tunis financial services 49,13% 41,58%
SIP SICAR Capital Risk Investment Company financial services 100,00% 35,59%
SOFINREC Claim Collection Company10, Rue Pierre de Coubertin Immeuble de la CIL – 1001 – Tunis. financial services 100,00% 96,40%
SICAF PARTICIPATIONS BNA financial services 100,00% 98,53%
ZIED Company SARL46, Rue Tarek Ibn Zied - Mutuelleville – Tunis financial services 100,00% 30,75%
SIMPAR Real Estate and Shareholdings Group14, Rue Masmouda - Mutuelleville – Tunis estate promotion 42,08% 33,48%
ESSOUKNA company46, Rue Tarek Ibn Zied - Mutuelleville – Tunis estate promotion 70,56% 23,73%
SIVIA Real Estate and Development Company8, Rue Saint Fulgence, Notre Dame – Mutuelleville – Tunis estate promotion 99,99% 42,11%
EL MEDINA11, Rue Masmouda - Mutuelleville – Tunis estate promotion 99,99% 40,94%
Les Œillets Real Estate Company11, Rue El Arbi Zarrouk - Mutuelleville – Tunis estate promotion 100,00% 52,56%
IFRIKIA Agriculture 100,00% 38,16%
T.I.S Tunisia Computer Services Company6, place Mohamed Kurd Ali 1005 El Omrane – Tunis computer company 68,00% 43,79%
SOGEST General Company for Studies, Supervision & Public Works17, Avenue d’Afrique – El Menzah V – Tunis Services 94,74% 44,73%
AGRO-SERVICES4, Rue Hassen Ibn Noôman 1002 - Tunis – Belvédère Services 29,85% 29,41%
EQuiValENcE PuttiNg suBsidary comPaNiEs
TUNISIE-RE Reinsurance CompanyRue 8006 n° 7 Montplaisir – Tunis financial services 25,08% 22,39%
«Générale des ventes» company trade 50,00% 49,26%
SODINO financial services 22,98% 22,64%
PErimEtEr oF coNsolidatioN as at dEcEmBEr 31, 2009

A nnual Repor t 20 09 - Nat ional Agr icultur al Bank
85
(in thousands of TND)
Notes 2009 2008*
assEts
Cash and credit notes with the central bank, the post office and the treasury 427 595 168 321
Receivables from banking and financial institutions 3 113 537 73 159
Receivables from customers 4 4 288 897 4 467 447
Commercial securities portfolio 5 622 559 636 905
Investment portfolio 6 273 894 281 912
Financial contribution in firms of equivalence putting 7 19 067 19 877
Frozen assets 55 698 49 975
Acquisition gap (Goodwill) 51 59
Other assets 8 213 801 209 864
total assEts 6 015 099 5 907 519
liaBilitiEs
The central bank and the post office 1 8
Deposits and credit notes of banking institutions 15 696 210 964
Customers' deposits 4 317 470 4 126 698
Borrowings and special resources 566 035 580 114
Other liabilities 9 224 455 230 494
total liaBilitiEs 5 123 657 5 148 278
Minority interest 386 151 342 953
stockholdErs EQuity
Capital (nominal value of 5 Dinars of the 32 million shares in 31/12/2009) 160 000 100 000
no called up capital (25 000)
Treasury stock of self control 10 (2 681) (6 122)
Consolidated reserves 11 195 778 158 786
Other consolidated stockholders’ equity 12 131 165 130 359
Consolidated income for the year 13 46 029 33 265
total stockholdErs EQuity 505 291 416 288
total liaBilitiEs aNd stockholdErs EQuity 6 015 099 5 907 519
coNsolidatEd statmENt oF thE BalaNcE shEEt BEForE distriButioN oF ProFits as at dEcEmBEr 31, 2009
(*) information treated for comparison (Rv. Note 1)

A nnual Repor t 20 09 - Nat ional Agr icultur al Bank
86
(in thousands of TND)
2009 2008
coNtiNgENt liaBilitiEs
oBs1- Bonds, backings and other guarantees given 714 665 703 447
a - in favour of banking institutions 100 641 75 466
b - in favour of customers 454 024 467 981
c - in favour of the state 160 000 160 000
oBs2- documentary credits 324 711 409 103
a - debtor by export documentary credits 28 207 46 784
b - debtor by import documentary credits 296 504 362 319
oBs3-assets given as security
total coNtiNgENt liaBilitiEs 1 039 376 1 112 550
commitmENts giVEN
oBs4- financing commitments given 268 236 211 571
Notified credits not used 268 236 211 571
oBs5- commitments on securities 8 795 5 530
a - Equity investments still to be paid in 5 216 2 820
b – Other 3 579 2 710
total commitmENts giVEN 277 031 217 101
commitmENts rEcEiVEd
oBs6- financing commitments received 0 114
oBs7- Guarantees received 476 327 530 752
coNsolidatEd statEmENt oF oFF-BalaNcE shEEt liaBilitiEs

A nnual Repor t 20 09 - Nat ional Agr icultur al Bank
87
(in thousands of TND)
Notes 2009 2008(*)
REV1- Interest and similar revenue 305 855 298 337
REV2- Commissions ( as revenue ) 46 395 45 955
REV3- Gains on commercial portfolio and financial transactions 46 859 49 227
REV4- Revenue from investment portfolio 8 206 7 699
total iNcomE From BaNkiNg oPEratioNs 407 315 401 218
EXP1- Accrued interest and similar expense (148 019) (169 097)
EXP2- Commissions accrued (829) (829)
EXP3- Losses on commercial portfolio and financial transactions (679) (1 825)
total EXPENsE oN BaNkiNg oPEratioNs (149 527) (171 751)
NEt BaNkiNg iNcomE 257 788 229 467
REV5/EXP4- Provisions made & result of valuation adjustments on off-balancesheet receivables and liabilities
(63 437) (64 042)
REV6/EXP5- Provisions made & result of valuation adjustments on investment portfolio 3 127 (500)
REV7- Other operating revenue 76 461 59 653
EXP6- Staff expense (103 274) (87 673)
EXP7-General operating expenses (83 621) (63 722)
EXP8- Provisions & fixed assets depreciation allowances (4 613) (5 237)
rEsults From oPEratioNs 82 431 67 946
Quota of the equivalence putting companies 7 (89) (1 930)
REV8/EXP9- Income/loss balance from other regular items (822) (12)
rEsult BEForE taX 81 520 66 004
Income Taxes 14 (16 115) (13 513)
Minority interest (19 376) (19 226)
NEt rEsult - Quota oF thE grouP 46 029 33 265
(*) information treated for comparison (Rv. Note 1)
coNsolidatEd statEmENt oF oPEratioNs

A nnual Repor t 20 09 - Nat ional Agr icultur al Bank
88
(in thousands of TND)
Notes 2009 2008(*)
oPEratiNg actiVitiEs
1- Product of operating 393 271 382 632
2- Charge of operating (154 659) (177 285)
3- Deposit / withdrawal of money from banking and financial institutions 7 781 18 188
4- Loan / repayment given to customers 123 199 (710 470)
5- Deposit / withdrawal of the customers 195 537 563 958
6- Securities (23 773) (49 531)
7- Paid-up amount for the employees and creditors (155 252) (133 983)
8- Others cash flows from operating activities 37 768 109 794
9 - Firms taxes (21 336) (3 125)
cash FloWs From oPEratiNg actiVitiEs 402 534 178
iNVEstiNg actiVitiEs
1- Interest and similar from investment portfolio 5 539 7 961
2- Acquisition / assignment on investment portfolio 3 627 (9 807)
3- Acquisition / assignment on immobilization (10 014) (5 164)
4- Income of participation securities 7 547 1 957
cash FloWs From iNVEstiNg actiVitiEs 6 699 (5 052)
FiNaNciNg actiVitiEs
1- Shares of BNA 3 494 (280)
2- Shares emission by parent companies 45 000 -
3- Shares emission by subsidiaries 38 969 46 157
4- Loans emission 45 000 -
5- Repayment of loans (21 878) (21 578)
6- Increase / diminution of special resources (37 215) (11 589)
7- paid-up dividend (18 864) (18 827)
cash FloWs From FiNaNciNg actiVitiEs 54 506 (6 117)
* Impact of the perimeter of consolidation's variation - -
* Net increase in cash & cash equivalents 463 739 (10 992)
* Cash and cash equivalents at start of period 16 346 317 357 308
cash aNd cash EQuiValENts at thE ENd oF PEriod 16 810 055 346 317
(*) information treated for comparison (Rv. Note 1)
coNsolidatEd statEmENt oF cash FloWs For thE PEriod JaNuary 1 to dEcEmBEr 31, 2009
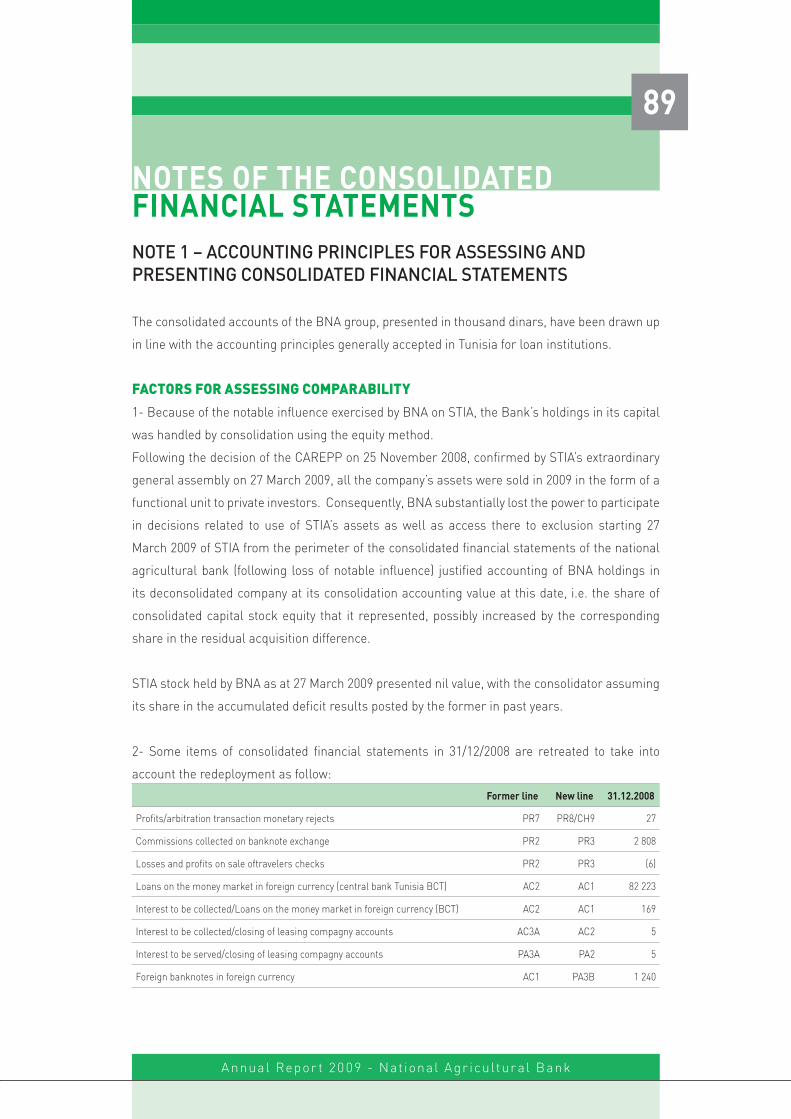
A nnual Repor t 20 09 - Nat ional Agr icultur al Bank
89
note 1 – accountinG principles for assessinG and presentinG consolidated financial statements
The consolidated accounts of the BNA group, presented in thousand dinars, have been drawn up
in line with the accounting principles generally accepted in Tunisia for loan institutions.
FACTORS FOR ASSESSING COMPARABILITY
1- Because of the notable influence exercised by BNA on STIA, the Bank’s holdings in its capital
was handled by consolidation using the equity method.
Following the decision of the CAREPP on 25 November 2008, confirmed by STIA’s extraordinary
general assembly on 27 March 2009, all the company’s assets were sold in 2009 in the form of a
functional unit to private investors. Consequently, BNA substantially lost the power to participate
in decisions related to use of STIA’s assets as well as access there to exclusion starting 27
March 2009 of STIA from the perimeter of the consolidated financial statements of the national
agricultural bank (following loss of notable influence) justified accounting of BNA holdings in
its deconsolidated company at its consolidation accounting value at this date, i.e. the share of
consolidated capital stock equity that it represented, possibly increased by the corresponding
share in the residual acquisition difference.
STIA stock held by BNA as at 27 March 2009 presented nil value, with the consolidator assuming
its share in the accumulated deficit results posted by the former in past years.
2- Some items of consolidated financial statements in 31/12/2008 are retreated to take into
account the redeployment as follow:
Former line New line 31.12.2008
Profits/arbitration transaction monetary rejects PR7 PR8/CH9 27
Commissions collected on banknote exchange PR2 PR3 2 808
Losses and profits on sale oftravelers checks PR2 PR3 (6)
Loans on the money market in foreign currency (central bank Tunisia BCT) AC2 AC1 82 223
Interest to be collected/Loans on the money market in foreign currency (BCT) AC2 AC1 169
Interest to be collected/closing of leasing compagny accounts AC3A AC2 5
Interest to be served/closing of leasing compagny accounts PA3A PA2 5
Foreign banknotes in foreign currency AC1 PA3B 1 240
NotEs oF thE coNsolidatEdFiNaNcial statEmENts

A nnual Repor t 20 09 - Nat ional Agr icultur al Bank
90
GENERAL ACCOUNTING RULES AND PRINCIPLES
rulEs oF EstaBlishmENt For coNsolidatEd accouNts
• referential for drawing up consolidated financial statements
Consolidated financial statements for the period 1st January to 31 December 2009 have been
established in line with accounting principles generally accepted in Tunisia, notably accounting
norms (NCT 21 to 25) relating to banking establishments and norms NCT (35 to 39) relating to
consolidation.
To understand the importance of the various activities carried out by the group, sectoral
information can be found in note 15.
Deferred taxation is dealt with in line with international financial information standard IAS 12.
• application of global integration for affiliates that carry out an activity unlike that of structures
working in the financial sector
All affiliates controlled exclusively by the National Agricultural Bank are consolidated by global
integration, regardless of their area of activity.
The financial statements of consolidated companies are reprocessed to bring them in line with
the BNA group’s rules for accounting, assessment and presentation. Accounting principles and
rules of assessment applicable to non banking activities are maintained in the consolidated
accounts of the BNA group.
PrEsENtatioN oF summary coNsolidatEd FiNaNcial statEmENts
Presentation of the BNA Group’s consolidated financial statements is in conformity with the terms
of norm NC 21 concerning presentation of financial statements for banking establishments.
Income generated by affiliates that do not work in financial services is recorded under the
category «other operational proceeds». Assets other than tangible and intangible fixed assets
and liabilities at affiliates that work in the non financial sector are no longer entered under
current and non current components and are now respectively presented under «other assets»
and «other liabilities».
PERIMETER, METHODS AND RULES OF CONSOLIDATION
PErimEtEr
Consolidated accounts are established on the basis of the National Agricultural Bank’s individual
accounts and those of all the affiliates it controls. Unless it turns out to be unfeasible (for
example when affiliates close their accounts during the year with a difference of more than three
NotEs oF thE coNsolidatEdFiNaNcial statEmENts

A nnual Repor t 20 09 - Nat ional Agr icultur al Bank
91
months),they will establish an intermediate situation as of 31 December, with results determined
on the basis of 12 months.
Excluded from the perimeter of consolidation are companies for which equity securities have
been acquired solely for sale in the near future. When severe ongoing restrictions put into
question the ability of the group to control operational policy and the assets of an affiliate or
holdings, it is also excluded from the perimeter of consolidation. Such is the case for affiliates
being liquidated or that are placed under the control of an administrator appointed by the courts.
The value of holdings in these companies is entered under the category «Holdings and shares in
non consolidated related companies».
mEthods oF coNsolidatioN
• companies consolidated by global integration
Companies over which the Group exercises exclusive control are consolidated by global
integration, including companies with a different account structure. The Group has exclusive
control over an affiliate when it has the ability to dictate financial and operational policy at that
affiliate in order to benefit from its activities. This control is the result of:
• either direct or indirect holding of the majority of voting rights in the consolidated company.
• or designation of the majority of members on administrative, directive or oversight structures.
• or the right to exert dominant influence on an affiliate as per a contract or statutory clauses.
Control is also presumed to exist when a company directly or indirectly holds at least 40% of
voting rights in another company, with no other associate holding a higher percentage.
The global integration method has been applied in line with the following approach:
• Individual financial statements of the parent company and its affiliates are combined line by
line by adding like components for assets, liabilities, core capital, proceeds and costs.
• Reciprocal operations between companies in the group are eliminated in a symmetrical
manner.
• Minority interests in the net result of consolidated affiliates for the year are identified and
subtracted from the Group’s results in order to obtain the net result due to the owners of the
parent company.
• The accounting value for the group’s holdings in each affiliate and the share of the group
in capital stock equity are eliminated to determine consolidated reserves and the share of
minority holdings in reserves.

A nnual Repor t 20 09 - Nat ional Agr icultur al Bank
92
Losses falling to minority interests in a consolidated affiliate can be higher than minority interests
in the affiliate’s capital stock equity. This surplus and all future losses relating to minority holders
are charged to majority interests unless the minority holders have an irrevocable obligation to
compensate for these losses and are able to do so. If the affiliate later turns a profit, majority
interests will have to allot all of these profits until the share of losses relative to minority holders
previously charged to majority interests is recovered.
• companies accounted for under the equity method
Companies under notable influence are accounted for under the equity method. Notable influence
is the result of the power to participate in financial and operational policies by a company without
holding control. Notable influence can be the result of representation on boards of directors or
oversight committees, of participation in strategic decisions, of the existence of major inter-
company operations, of exchange of management staff, and/or of ties of technical dependency.
Notable influence on the financial and operational policies of a company is assumed to exist
when the group has direct or indirect control of a portion of at least 20% of voting rights in that
company. The equity method consists of the following steps:
• Reprocess the capital stock equity of the company accounted for using the equity method by
eliminating reciprocal operations that have an impact on its results or reserves;
• Enter the share of the group in the capital stock equity of the company accounted for under
the equity method under an assets account entitled «Securities accounted for under the
equity method»;
• liminate the group’s holdings in the company accounted for under the equity method from the
share of the group in capital stock equity and note the difference in the consolidated result
under the account entitled «Share in the results of companies accounted for under the equity
method», taking into account the impact on consolidated reserves.
The group’s share in an associated company is the sum total of holdings in this associated
company held by BNA and its affiliates. To this end, the shares held by other associated
companies in the group are ignored.
If, according to accounting for a consolidated company using the equity method, the consolidating
bank’s share in the deficit results of an associated company is equal to or more than the
accounting value of the holding, the bank generally ceases to take into account its share in future
losses. Holdings are then presented as a nil value. Additional losses are the object of provisions,
NotEs oF thE coNsolidatEdFiNaNcial statEmENts
A nnual Repor t 20 09 - Nat ional Agr icultur al Bank
93
insofar as the bank has assumed responsibility or effected payments for the company accounted
for using the equity method to fulfil its obligations to the latter, guaranteed by the bank or for
which it has some other commitment. If the company accounted for under the equity method
later turns a profit, the consolidating bank again takes into account its share of these profits only
after it exceeds its share of net losses not yet taken into account.
rulEs oF coNsolidatioN
acquisition cost for securities, acquisition difference and evaluation difference
• cost for acquiring securities
The cost for acquiring securities is equal to the amount of remuneration paid to the seller by the
acquirer, increased by the costs considered significant directly imputable to net acquisition of the
corresponding tax savings.
• Difference on acquisition
Differences on acquisition (corresponding to the difference between the acquisition cost of
securities and evaluation of assets and liabilities of the acquired company) are amortized on a
linear basis over a period not to exceed 20 years, defined on the basis of conditions specific to
each acquisition.
Every time that information has been available, the differences on acquisition have been identified
and entered as assets as appropriate, as intangible fixed assets for globally integrated affiliates,
or as securities accounted for under the equity method for other companies.
• Difference on evaluation
The differences on evaluation corresponding to differences between the re-estimated entry
value in the consolidated balance statement of assets/liabilities of the acquired company and
the accounting value of these components are accounted for according to the common rules
applicable to corresponding components.
Variation of the interest percentage in a consolidated company
An increase in the interest percentage held in a company included in the perimeter of consolidation
calls for entry in accounting of an additional difference on acquisition depreciated according to the
rules specified above. The drop in the percentage of interest in a company remaining consolidated
(notably after an operation on depreciated dilutive capital for the company in the group holding
shares in that company) gives rise to additional amortization of the acquisition difference.

A nnual Repor t 20 09 - Nat ional Agr icultur al Bank
94
reciprocal transactions
Reciprocal accounts as well as proceeds and costs resulting from transactions internal to
the group and that have a significant influence on the consolidated financial statements are
eliminated when they concern entities that are the object of global or proportional integration.
Shares issued by BNa held by the group
Shares issued by BNA and acquired that are meant to regularise prices or those held by the
group are entered in reduction of consolidated capital stock equity for their acquisition value.
If these securities are later sold, the result of the sale and corresponding tax are recorded in
consolidated core capital.
global integration of stock mutual investment funds
Except for re-processing of the effect of withholding on accounting for income in the form of interest,
accounting principles and rules of evaluation specific to stock mutual investment funds have been
maintained in the BNA group’s consolidated accounts. The posts that make up globally integrated
stock mutual investment funds are presented under headings of the same nature in the balance
sheet, income statement and consolidated off balance sheet, aside from the following components:
• Negotiation fees
The costs occasioned by purchase and sale transactions for securities held by stock mutual
investment funds are charged directly to core funds. The group’s share is presented under the
heading «Other consolidated capital stock equity».
• Variation of potential gains or losses on securities
Gains or losses on securities held by stock mutual investment funds that correspond to the
balance of the variation during the period of potential gains or losses are charged directly as
capital stock equity. The group’s share is presented under the heading «Other consolidated
capital stock equity».
• Variation of gains or losses on securities
Gains (or losses) on securities held by stock mutual investment funds that correspond to the
balance of variation during the exercise of potential gains or losses are entered directly in capital
stock equity. The share due to the group is presented under the heading «Other consolidated
capital stock equity».
NotEs oF thE coNsolidatEdFiNaNcial statEmENts

A nnual Repor t 20 09 - Nat ional Agr icultur al Bank
95
OTHER ACCOUNTING PRINCIPLES RELATING TO EVALATION AND PRESENTATION
accouNtiNg For loaNs aNd rElatEd iNcomE
accounting for loans to clients
Financing and guarantee commitments are entered off balance sheet as they are contracted and
entered on the balance sheet as funds are released for nominal value.
Net discount loans are presented on the balance sheet at their nominal value minus interest
calculated in advance and not yet accrued. Disbursed loans and debit current accounts are
presented minus interest and reserved fees, proceeds paid or accounted for in advance, and
related provisions.
accounting for income on loans to clients
Interest on short term loans is collected and accounted for in proceeds accounts when these
loans are released. They then, as appropriate, are the object of regularisation at the end of the
month, for the portion that is not accrued. Interest due on long and medium term loans relative
to the current year are taken into account as a result at the time of their encashment. Interest
due and not yet encashed are entered as reserved proceeds and deducted from the category
«Claims on clients». This interest is taken into account as a result when it is actually encashed.
Fees on debit current accounts relating to filed commitments in classes B2, B3, B4 and B5 are
reserved and presented at the time of closing, deducted from debit current accounts. Fees on
disputed claims in closed debit current accounts are not entered in accounting.
accouNtiNg For thE sEcuritiEs PortFolio aNd rElatEd iNcomE
The consolidated securities portfolio is found in two categories: the investment portfolio and the
commercial securities portfolio.
investment portfolio and related income
In the investment portfolio are found:
• Securities representing shares in capital in companies, the ongoing ownership of which
is considered useful for the group’s activity but not held with the intention to control (non
consolidated equity securities)
• Fixed income securities acquired by the group with the intention of holding them until
they fall due (investment securities, notably debenture loans)
• Securities representing financing shares that have been the object of an agreement to
onlend but which are not yet definitively sold.

A nnual Repor t 20 09 - Nat ional Agr icultur al Bank
96
Rules for accounting for transactions on these various categories of securities are summarized
as follows:
equity securities of a durable nature (non-consolidated)
Shares that have been subscribed to but not yet paid in are recorded as off balance sheet
commitments at their issue value. These securities are accounted for in the balance sheet at
the price of acquisition, exclusive of expenses and costs. Transactions to acquire and sell equity
securities are recorded on the date of transfer of securities, i.e. the date when the transaction is
recorded at the Tunis Stock Market. The added value that results from sale of these securities
is presented under the heading «Allotment for provisions and result of corrections on values in
the investment portfolio». Dividends on securities held by the group are taken into account as a
result as soon as they are encashed.
investment securities
Income from fixed income securities are taken into account in proceeds, spread out over the
period concerned by their being held.
securities representing financing shares
Subscribed to but not yet paid in shares are recorded as off balance sheet commitments at their
issue value. These securities are accounted for in the balance sheet at the price of acquisition,
exclusive of expenses and costs.
Transactions involving acquisition and sale of equity securities are recorded on the date of transfer
of ownership of the securities, i.e. the date when the transaction is recorded at the Tunis Stock
Market. Financing shares are considered to be an extension of the main financing activity and
gains resulting from their sale are treated as interest, being a part of banking operations. These
gains are recorded as proceeds as they accrue, once their effective encashment is considered
reasonably sure. Alternately, they are recorded as a lump sum at the time of sale. They are
presented as results under the heading «Income from the investment securities portfolio».
commercial securities portfolio
The commercial securities portfolio is made up of fixed income and/or variable income securities
held for future transaction or investment. Securities issued by the State (Treasury bonds) acquired
in the framework of brokerage of the consolidated party (securities acquired for investment with
clients) are accounted for in transaction securities. The portion of securities onlended to clients
NotEs oF thE coNsolidatEdFiNaNcial statEmENts

A nnual Repor t 20 09 - Nat ional Agr icultur al Bank
97
(other than globally integrated affiliates) is presented in a compensated manner as a deduction
under the heading «Transaction securities». Consequently, income from these securities and
fees for their onlending to clients are entered as a result, spread out over the relevant period
and presented in a compensated manner. Securities issued by globally integrated stock mutual
investment funds held by the companies in the group for investment purposes are among the
components of the consolidated commercial portfolio.
The securities portfolio held by globally integrated stock mutual investment funds are also
among the components of the consolidated commercial portfolio. The costs for acquisition
of these securities are recorded, for the share belonging to the group, as capital stock equity
under the heading «Other consolidated capital stock equity». Listed securities held by globally
integrated stock mutual investment funds are assessed at the end of period date by referring to
the average stock market prices for the month of December. Positive or negative differences in
estimating compared to the entry value of the same securities are charged directly as capital
stock equity, for the share belonging to the group, under the heading «Other consolidated capital
stock equity». Gains or losses on sale of securities held by globally integrated stock mutual
investment funds are placed, for the share belonging to the group, under the heading «Other
consolidated capital stock equity». As for the share belonging to interests outside the group in
acquisition costs, the differences in estimation and the results of sale of securities held by the
globally integrated stock mutual investment fund is presented apart from liabilities and capital
stock equity under the heading «Interests of minority holders».
ProVisioNs For risks oN NoN coNsolidatEd loaNs aNd sharEs
• Provisions for risks on loans
Provisions for risks on loans is determined in line with prudential norms of division, risk coverage,
and monitoring of commitments as given in Central Bank of Tunisia (BCT) circular n° 91-24 of
17 December 1991, as modified by subsequent circulars that define the classes of risk in the
following manner:
A-current assets
B1-assets which require a specific follow-up
B2-uncertain assets
B3-worrisome assets
B4-compromised assets
B5-litigation assets

A nnual Repor t 20 09 - Nat ional Agr icultur al Bank
98
The rate of provisioning retained by the consolidating bank corresponds to the minimal rate
by class of risk as specified in BCT circular n° 91-24, applied to net exposure to risk of the
counterpart, i.e. the amount of the commitment less reserved fees and the value of guarantees
obtained.
The applicable rates of provision by class of risk are as follows:
B2- Uncertain assets 20%
B3- Worrisome assets 50%
B4- Compromised assets 100%
B5- litigation assets 100%
• Provisions on non consolidated holdings:
At the date of closing, non consolidated equity securities are assessed at their usual value, giving
rise to the constitution of provisions to cover any losses that might occur that are of a durable
nature. This value takes into account:
- the stock market value of the stock for listed securities
- the mathematical value calculated on the basis of the last available balance sheet for other
securities.
accouNtiNg For cliENt dEPosits aNd rElatEd costs
Interest costs on client deposits and assets are recorded by the nature of deposits in the following
manner:
• Interest on current accounts is positioned on client accounts and accounted for on a quarterly
basis. The value dates used to calculate interest on clients’ current accounts vary according
to the nature of withdrawals and deposits made by clients, in line with BCT circular n° 91-22.
• Interest on forward accounts is positioned on forward client accounts that have fallen due,
being the object of subscription at each closing date.
FiXEd assEt ValuEs
Fixed assets are accounted for on the date of entry at the cost of historic acquisition, including
the purchase price exclusive of taxes, duties and supported non recoverable taxes, and direct
costs exclusive of deductible taxes. Fixed assets are depreciated starting on the date they are
first used, on the basis of their estimated lifespan. Rates of amortisation applied by the group
are to be detailed as follows:
NotEs oF thE coNsolidatEdFiNaNcial statEmENts

A nnual Repor t 20 09 - Nat ional Agr icultur al Bank
99
Real estate 2-5%
Transport equipment 20%
Desk equipment 10-15%
Communication & conditioning equipments and material of security 10%
Computer 15-33%
Software 33%
Arrangement & installation 10%
taXEs oN iNcomE
current taxes:
BNA Group companies are subject to corporate taxes as per rules and rates prevailing in each
sector of activity.
Differed taxes:
Differed taxes are accounted for when a time difference is identified between accounting values
for assets and liabilities that figure in the balance sheet and respective tax bases when these
differences have an incidence on future payment of taxes. Differed taxes are calculated on the
basis of the voted or virtually voted tax rate that should apply when the time difference is inversed.
When there is a change in the tax rate, the corresponding effect is recorded in the income account
under the heading «differed tax charge». Net differed tax assets are taken into account only if it is
probable that the consolidated company has prospects for recovery at a given time. Differed taxes
are determined at the level of each tax entity; they are not updated. For 2006 and beyond, effective
tax rates used to calculate stocks of differed taxes at consolidated companies are presented by
entity as follows:

A nnual Repor t 20 09 - Nat ional Agr icultur al Bank
100
Nominal ratio real ratio
Establishment of credit
Banque Nationale Agricole 35% 20%
other
BNA CAPITAUX 30% 30%
SOFINREC 35% 35%
SICAR INVEST 35% 0%
SIP SICAR 35% 0%
SOIVM SICAF 35% 35%
SICAF PARTICIPATIONS 35% 35%
SICAV BNA 0% 0%
SICAV BOND HOLDER PLACEMENT 0% 0%
real Estate Promotion
SIMPAR 30% 20%
ESSOUKNA 30% 20%
SIVIA 30% 30%
SPI MADINA 30% 30%
LES ŒILLETS 30% 30%
agriculture
IFRIKIA 10% 10%
informatics services
TIS 30% 30%
other activity
SOGEST 30% 30%
AGRO SERVICES 30% 30%
ZIED SARL 30% 30%
NotEs oF thE coNsolidatEdFiNaNcial statEmENts

A nnual Repor t 20 09 - Nat ional Agr icultur al Bank
101
sEctoral data
The group is managed mainly on the basis of four groups of activities:
• Financial services: This pole groups the entities that have the status of loan institutions or
companies whose activity is a direct extension of activities at loan institutions or that are
involved in activities relating thereto: stock brokerage, claim collection, capital risk, portfolio
management …
• Real estate promotion: This pole groups entities authorised in the framework of law n° 90-17
of 26 February 1990 to handle in a professional capacity housing tract operations and land
development mainly for housing, as well as construction or renovation of collective or semi-
collective buildings for housing, commercial, professional or administrative use.
• Agriculture: This pole groups entities involved in the use of available natural resources to
increase agricultural production.
• Computer services: This pole groups entities specialised in the maintenance and marketing
of computer equipment and software.
Sectoral data is provided only by sector of activity, in the absence of identification of geographical
sectors involved in supplying goods or services in a given economic environment and exposed to
risks and profitability different from risks and profitability in other sectors of activity operating in
other economic environments.
Sectoral results are presented by taking into account the effect of transactions internal to the group,
while sectoral assets and liabilities are presented after eliminating the effect of transactions internal
to the group.
note 2: perimetre of consolidationThe perimeter of consolidated financial statements included (a side from the consolidating parent)
22 entities as of 31 December 2009:
- 18 affiliates treated under global integration
- 3 associated companies processed using the equity method
Modifications made in the perimeter of consolidation as at 31 December 2009 compared to the
perimeter in force on the closing date of 31 December 2008 are as follows:
company input output Nature comments
STIA - X Associated company Loss of notable influence following sale of all assets inthe form of a functional unit.

A nnual Repor t 20 09 - Nat ional Agr icultur al Bank
102
Companies included in the perimeter of consolidation, the percentage of control, and the
percentage of interest for the group are as follows: method of
consolidation % of control % of interest
a-Banking institutions
BNA GI 100,00% 98,53%
b-Financial services
BNA CAPITAUX GI 100,00% 97,98%
SOFINREC GI 100,00% 96,40%
SICAR INVEST GI 49,13% 41,58%
SIP SICAR GI 100,00% 35,59%
SOIVM SICAF GI 100,00% 74,30%
SICAF PARTICIPATIONS GI 100,00% 98,53%
SICAV BNA GI 22,38% 19,87%
SICAV BOND HOLDER PLACEMENT GI 0,08% 0,05%
TUNIS-RE EP 25,08% 22,39%
SODINO EP 22,98% 22,64%
c-Estate promotion
SIMPAR GI 42,08% 33,48%
ESSOUKNA GI 70,56% 23,73%
SIVIA GI 99,99% 42,11%
SPI MADINA GI 99,99% 40,94%
LES ŒILLETS GI 100,00% 52,56%
d-agriculture
IFRIKIA GI 100,00% 38,16%
e-computer company
TUNISIA INFORMATICS SERVICES GI 68,00% 43,79%
autres activités
SOGEST GI 94,74% 44,73%
AGRO SERVICES GI 29,85% 29,41%
ZIED SARL GI 100,00% 30,75%
«GENERAL SALES COMPAGNY» EP 50,00% 49,26%
GI : global integration - EP: equivalence placed.
NotEs oF thE coNsolidatEdFiNaNcial statEmENts

A nnual Repor t 20 09 - Nat ional Agr icultur al Bank
103
note 3 – claims on BankinG institutionsContent of this rubric can be clarified as follows:
(in thousands of TND)
2 009 2 008
a-receivables from banking institutions 110 595 73 154
* sight accounts 5 087 5 421
* overnight placements 105 170 39 752
* time placements - 27 092
* interest receivable 338 889
b-receivables from financial institutions 2 942 5
* time placements 2 908 -
* interest 34 5
total 113 537 73 159
note 4 – claims on clientsThe composition and evolution of the net outstanding balance of claims on clients as of 31
December 2009 can be given in a comparative manner as follows:(in thousands of TND)
grossoutstan-
dings
subordina-ted debt
Prepaidincome Provisions reserved
interest Net
outstandings
a-agricultural liabilities 632 010 299 464 (1 697) - (293 635) 636 142
* debit accounts 18 072 - - - - 18 072
* others advances to the customers 330 803 44 066 (1 697) - (39 278) 333 894
* loans out of special resources 283 135 255 398 - - (254 357) 284 176
b-commercial & industrial liabilities 3 960 478 73 778 (10 585) - (96 439) 3 927 232
* debit accounts 492 149 17 577 - - (32 339) 477 388
* others advances to the customers 3 264 903 44 332 (10 585) - (54 070) 3 244 580
* loans out of special resources 203 425 11 869 - - (10 030) 205 264
c- ordinary associated account 680 - - - - 680
d- receivables / stockholder's funds takenover by the state
27 445 - - - - 27 445
e-cost of loans amortization held by src - - - - - 45 482
f-provisions - - - (348 084) - (348 084)
total at dec.31,2009 4 620 613 373 242 (12 282) (348 084) (390 074) 4 288 897
total at dec.31,2008 4 467 447

A nnual Repor t 20 09 - Nat ional Agr icultur al Bank
104
note 5 – commercial securities portfolioThe breakdown of this post is presented in a comparative manner as follows:
(in thousands of TND)
2009 2008
total Brutsubor-
dinateddebt
Provisions accountingnet value
accountingnet value
a-floating rate securities
Listed 7 934 - (410) 7 524 7 167
Not listed - - - - 0
Part of OPCVM 51 672 - - 51 672 46 035
total Floating rate securities 59 607 - (410) 59 196 53 202
b-fixed rate securities
Government securities & similar bills 417 365 1 382 - 418 747 463 188
Bonds 112 848 2 922 - 115 770 85 741
Treasury bill 28 360 486 - 28 846 34 773
total fixed rate securities 558 573 4 790 - 563 363 583 702
total 618 180 4 790 (410) 622 559 636 905
note 6 – investment securities portfolioThe value of the investment securities portfolio went from 281,912,000 TD on 31/12/2008 to
273,894,000 TD on 31/12/2009. This trend can be broken down as follows:(in thousands of TND)
2009 2008
totalBrut
subordina-ted debt Provisions reserved
interestaccounting
net valueaccounting
net value
Investment securities 24 909 194 - - 25 103 24 049
Financing or retrocession 48 466 454 (15 221) (207) 33 492 32 850
Participation in tied companies (not consolidated) 10 799 - (6 919) - 3 880 3 880
Equity security 54 745 54 (7 705) - 47 094 45 933
Receivables taken over by the state 164 262 63 - - 164 325 175 200
total 303 181 765 (29 846) (207) 273 894 281 912
NotEs oF thE coNsolidatEdFiNaNcial statEmENts

A nnual Repor t 20 09 - Nat ional Agr icultur al Bank
105
note 7 – holdinGs in companies accounted for under the equity methodThe value of equivalency for securities issued by associated companies came to 19,067 T TD as
at 31/12/2009 vs 19,877 T TD as at 31/12/2008.
The breakdown of this line can be compared as follows:(in thousands of TND)
2009 2008
Quota inPurchased
capitalNet
goodwillQuota in
reserves Quota in results
comparabilityValue
comparabilityValue
(1) (2) (3) (4) (1)+(2)+(3)+(4)
TUNIS-RE 10 302 - 2 810 1 099 14 210 13 833
GENERALE DES VENTES 2 000 - (328) (1 029) 642 1 672
SODINO 3 260 380 732 (158) 4 214 4 372
total 15 562 380 3 214 (89) 19 067 19 877
note 8 – other assetsContent of this heading can be illustrated as follows:
(in thousands of TND)
2 009 2 008
Suspense & adjustment accounts 38 132 39 383
Assets payable tax 4 319 3 449
Assets put off tax 20 936 18 061
Stock of transformation activities 107 359 104 483
Others 43 055 44 488
total 213 801 209 864
note 9 – other liaBilitiesThe breakdown of this post is presented in a comparative manner as follows:
(in thousands of TND)
2 009 2 008
Provisions for liabilities & expense 11 226 8 226
Suspense & adjustment accounts 134 123 144 164
Assets payable tax 2 927 2 526
Assets put off tax 16 546 12 829
Others 59 633 62 749
total 224 455 230 494

A nnual Repor t 20 09 - Nat ional Agr icultur al Bank
106
note 10 – treasury stockUnder this heading are found the counterpart paid by the parent bank and its affiliates for
acquisition and holding of shares issued by BNA. No profit or loss will be accounted for in the
result at the time of purchase or sale of these shares. The counterpart received on sale of these
shares and dividends received are recorded directly as capital stock equity under the heading
«Core shares and auto control».
This category, which on 31/12/2009 amounted to 2,681,000 TD vs. 6,122,000 TD on 31/12/2008,
can be broken down as follows:(in thousands of TND)
2 009 2 008
Own stock finance held by the BNA 3 3 678
Treasury stock for regularization held by subsidiary companies 6 560 6 400
Additional (or drop in) value realised on own stock finance (49) 53
Dividend on own stock finance (321) (385)
Quota of minority (3 512) (3 625)
total 2 681 6 122
note 11 – consolidated reserveConsolidated reserves correspond to the results accumulated by the consolidating Bank in the
entities included in the perimeter starting when control was taken or notable influence began, up
until the closing date prior to that relating to publication.
Consolidated reserves as of 31/12/2009 came to 195,778,000 TD vs. 158,786,000 TD as of
31/12/2008. Breakdown can be presented as follows:(in thousands of TND)
2 009 2 008
a-contribution of the Bna (consolidating company) 168 228 135 894
b-contribution of the subsidiary companies 27 550 22 892
Positive contribution 28 921 24 364
Negative contribution (1 371) (1 472)
total 195 778 158 786
note 12 – other consolidated capital stock equityThis category, which on 31/12/2009 came to 131,165,000 TD vs. 130,359,000 TD on 31/12/2008, can
be broken down as follows:
NotEs oF thE coNsolidatEdFiNaNcial statEmENts

A nnual Repor t 20 09 - Nat ional Agr icultur al Bank
107
(in thousands of TND)
2 009 2 008
Endowment from the state (133 thTD) 133 000 133 000
Additional value (or drop in value) potential in stock exchangetransactions of securities held by the OPCVM
(457) (143)
Additional value (or drop in value) achieved in stock exchange transactions of securitiesheld by the OPCVM
1 117 271
Negotiation expenses of the OPCVM (15) (1)
Minority portion (2 480) (2 767)
total 131 165 130 359
note 13 – consolidated earninGThe year ending 31/12/2009 yielded a positive consolidated result amounting to 46,029 K TD,
compared to results of the same nature corresponding to 33,265 K TD as at 31/12/2008. The
contribution to consolidated results of the parent company and its affiliates can be compared as
follows:(in thousands of TND)
2 009 2 008
a-contribution of the Bna (consolidating company) 40 892 27 949
b-contribution of the subsidiary companies 5 136 5 315
Positive contribution 5 848 5 460
Negative contribution (712) (145)
total 46 029 33 265
note 14 – income taXesThe breakdown of this post is presented in a comparative manner as follows:
(in thousands of TND)
2 009 2 008
Payable fiscal expense 15 902 14 436
Put off fiscal expense 4 175 3 834
Put off fiscal product (3 962) (4 757)
total Fiscal EXPENsE 16 115 13 513
note 15 – sector-related informationSectoral data on the poles of activities retained can be presented as follows for the periods
ending 31/12/2009 and 31/12/2008:

A nnual Repor t 20 09 - Nat ional Agr icultur al Bank
108
NotEs oF thE coNsolidatEdFiNaNcial statEmENts
Fina
ncia
lse
rvic
esEs
tate
Prom
otio
nag
ricu
lture
info
rmat
ics
serv
ices
othe
r ac
tivity
supp
ress
ion
Betw
een
sect
orco
nsol
idat
ed
(in th
ousa
nds
of T
ND
)2
009
2 00
82
009
2 00
82
009
2 00
82
009
2 00
82
009
2 00
82
009
2 00
82
009
2 00
8
a-re
sult
s fr
om r
eGu
lar
acti
viti
es
Exte
rnal
ear
ning
s
Conc
urre
nt e
arni
ngs
in fo
rmat
ion
of
net b
anki
ng in
com
e40
7 07
639
9 59
2-
--
--
--
-
Not
con
curr
ent e
arni
ngs
in fo
rmat
ion
of n
et b
anki
ng in
com
e-
-63
518
64 6
41-
-89
678
52
653
2 53
2
Earn
ings
com
ing
from
tran
sact
ion
with
ot
her s
ecto
r6
007
6 47
025
335
3-
158
640
01
049
968
(7 8
95)
(8 1
90)
tota
l41
3 08
3 40
6 06
1 63
771
64
993
-
11
482
1 18
5 3
702
3 50
0 (7
895
)(8
190
)47
4 14
346
7 54
9
B-in
com
e
Sect
or-r
elat
ed in
com
e75
565
60
209
14
396
17
083
(3
7)(4
0)(6
93)
(1 9
48)
221
161
(7 6
34)
(7 6
92)
81 8
1767
773
Not
allo
cate
d ex
pens
e(3
1)(3
54)
Oper
atio
nal i
ncom
e81
786
67 4
20
Fina
ncia
l exp
ense
of n
ot fi
nanc
ial s
ecto
r(3
3)(1
56)
Inve
stin
g yi
eld
of n
ot fi
nanc
ial s
ecto
r31
359
5
Net
inco
me
quot
a fr
om a
ssoc
iate
d co
mpa
nies
(312
)(2
238
)22
330
8-
--
--
-(8
9)(1
930
)
Bala
nce
of a
ccou
nt fr
om o
ther
regu
lar e
lem
ents
(457
)74
Inco
me
taxe
s(1
6 11
5)(1
3 51
3)
Net
inco
me
for
the
peri
od65
405
52
491
d-ot
her
info
rmat
ion
Sect
or-r
elat
ed a
sset
s5
848
055
5 74
6 32
210
9 71
810
6 78
89
-34
842
32
395
2 65
55
960
524
5 85
6 18
9
Cont
ribut
ion
in e
quiva
lenc
e pu
tting
as
soci
ated
com
pani
es16
177
17 0
642
890
2 81
3-
--
--
-19
067
19 8
77
Sect
or-r
elat
ed li
abili
ties
5 08
1 13
15
114
208
16 5
1012
885
6460
545
636
1 14
41
215
5 09
9 39
55
129
004
Dep
reci
atio
n al
low
ance
4 21
14
823
277
345
--
--
8369
4 57
15
237

A nnual Repor t 20 09 - Nat ional Agr icultur al Bank
109
note 16 – liquidity and equivalent liquidityLiquidity and consolidated equivalent of liquidity came to 810,055,000 TD as of 31/12/2009 vs.
346,317,000 TD on 31/12/2008, a positive net variation of 463,739,000 TD that is detailed in the
consolidated cash flow statement.(in thousands of TND)
2 009 2 008
Cash & credit notes with the central bank, the post office & the treasury 60 326 85 921
Banks and specialized organizations (1 180) (24 015)
Marketable securities / loans on money market 429 350 (76 510)
Treasury bonds 302 199 339 970
Treasury bill 19 360 20 950
total 810 055 346 317

A nnual Repor t 20 09 - Nat ional Agr icultur al Bank
110
As part of the mandate to audit the consolidated financial statements of the National Agricultural
Group, we hereby present to you our audit on verification of the BNA’s consolidated financial
statements as of 31 December 2009, annexed to the present report, along with the specific
verifications outlined in legislation and professional norms.
The attached consolidated financial statements covering the period of 1st January to 31 December
2009 show a total net balance sheet of 6 015 099 000 dinars, capital stock equity for the group of
505 291 000 dinars including results for the year amounting to 46 029 000 dinars.
i - opinion of the auditors concerning the consolidated financial statements
We have audited the National Agricultural Bank Group’s attached consolidated financial
statements, which includes a balance sheet, income statement, statement of off balance sheet
commitments, cash flow statement and notes that provide a summary of the main accounting
methods and other explanatory notes pertaining to the period 1 January 2009 to 31 December
2009.
These statements were finalised under the responsibility of the Bank’s executive and administrative
authorities. This responsibility covers design, establishment and monitoring of internal audit of
how financial statements are drawn up and faithfully presented with no significant anomalies
due to either fraud or error, the choice and application of appropriate accounting methods and
determination that accounting estimates being reasonable in light of circumstances.
Our responsibility is to give an opinion on the basis of our audit. We have carried out this audit in
line with professional norms applicable in Tunis, which require that we respect rules of ethics,
planning and that the audit is carried out to obtain reasonable assurance that the financial
statements do not include any significant anomalies.
An audit implies that procedures are used to gather reliable information on the amounts and data
given in the financial statements. The choice of procedures is left to the judgement of the auditor,
as is assessment of risk that the financial statements might contain significant anomalies as
a result of either fraud or error. In carrying out an assessment of risk, the auditor takes into
account internal audit procedures in effect in the establishment relating to the drawing up and
faithful presentation of financial statements so that they can define audit procedures appropriate
to the circumstances rather than express an opinion about the effectiveness thereof. An audit
auditors rEPort oN thE coNsolidatEd FiNaNcial statEmENt oF thE BNa grouP

A nnual Repor t 20 09 - Nat ional Agr icultur al Bank
111
also includes assessment of the appropriate character of accounting methods used and the
reasonable nature of accounting estimates made by management, as well as assessment of the
overall presentation of consolidated financial statements.
On the basis of our diligent work, it is our opinion that the consolidated financial statements of the
National Agricultural Bank Group are correct, faithfully presenting all aspects of significance as
well as the results of operations and cash flows for the whole made up of companies included in
consolidation for the exercise ending le 31 December 2009, in line with the accounting principles
generally recognised in Tunisia.
ii - specific verifications
We have proceeded with the review and specific verifications outlined in legislation, in line with
audit norms applicable in Tunisia. On the basis of our review, we have neither discovered nor
heard of any significant inconsistencies in the accounty data provided in the boards annual
management report that are in contradiction with bank’s consolidated financial statement’s at
31 December 2009.
In the framework of our audit and in application of (new) article 3 of law n° 94-117 governing
reorganisation of the financial markets as modified by subsequent texts, we have reviewed the
internal audit procedures governing how accounting data is processed and financial statements
prepared at the parent company. This review has enabled us to identify certain inadequacies in
the Bank’s information and internal audit system.
Tunis, 26 April 2010
co auDitorS
p/ cmc – dfk international p/ Gac – cpa international
Chérif BEN ZINA Chiheb GHANMI

Conception et Impression
PICTURA : +216 71 788 077