nart report drag effects faye clawson-1
TRANSCRIPT

Drag Effects of Corrugated Plastic Rocket Fin Design and Corrugation Orientation
Fayetta Clawson1 Navajo Technical University
Gary L. Brandt2
Northwest Indian College
NomenclatureCd = Coefficient of dragCPLE = corrugations parallel to leading edgeCPRC = corrugations parallel to root cordFML = Fluid Mechanics Lab, NASA Ames Research CenterLE = Leading edgemV/V = millivolts per voltNART = Native American Research TeamRC = Root chordRotCFD = Rotor Computational Fluid Dynamics softwareSP = SpanTE = Trailing edgeTP = Tipfpm = Feet per minutefps = Feet per second
AbstractCorrugated plastic such as used in making political and other outdoor signs, is often used to make fins for
air/water rockets. It is light and durable. A question often asked by the rocket builders is, “Which way do the corrugations go, into the air flow, or does it matter?” This investigation will provide information about which corrugation orientation, parallel to the air flow or parallel to the fin’s leading edge, is more efficient during flight. The test goal is to learn which corrugation orientation will have less drag. Two clipped delta shaped (trapezoid) fin plan forms were evaluated: one plan form has corrugations parallel to the fin’s root chord (CPRC) and one fin has corrugations parallel to the fin’s leading edge (CPLE); Testing evaluated fin drag at constant angle of attack (0 degrees) and varied wind speeds for comparison. All testing was performed in the 24” x 24” Wind Tunnel (Lifesaver) located in the Fluid Mechanics Lab at NASA Ames Research Center, (Figure 1) The two fins were also analyzed in the RotCFD for comparison to the wind tunnel results.
1 Student, Industrial Engineering, Navajo Technical University2 Faculty, Information Technology, Northwest Indian College

Figure 1. 24” x 24” Wind Tunnel (Lifesaver)
I. IntroductionCorrugated plastic is an ideal material for water/air pressure rocket fins because it is readily available,
inexpensive, durable, and easy to shape with household tools. Many people have made rocket fins out of corrugated plastic. Corrugated plastic stock is similar to corrugated cardboard in that there are corrugations or openings between an upper and lower skin. Figure 2 presents a conceptual drawing of corrugated plastic as well as an edge view of a representative sample. The openings may have an effect on the air flow over the fins where one orientation may exhibit less drag compared to the other orientation. To the knowledge of the author, no testing for drag has been done on rocket fins made from this type of plastic. Two delta shaped (trapezoid) fins were tested to investigate which corrugation orientation, parallel to the air flow or parallel to the fin’s leading edge, is more efficient during flight. One fin had corrugation orientation parallel to the leading edge, and the other had corrugations parallel to the root chord. RotCFD is used in the rotorcraft industry as a design tool that can carry out aerodynamic simulations. Additional analysis was done with RotCFD by running simulation for both fin designs in order to view the simulated flow dynamics.
Figure 2. Corrugated plastic drawing and edge view showing corrugations
1

II. HypothesisIt is hypothesized that the CPRC will be more efficient during flight by creating less drag. It is thought that
the drag will be reduced with the corrugations parallel to the air flow (Figure 3) because the air will flow through the openings in the fins. It is thought that the drag will be higher with fins that have the corrugations parallel to the fin’s leading edge (Figure 4) due to air blockage from the leading edge.
Figure 3. Corrugations parallel to the root cord. Figure 4. Corrugations parallel to the leading edge.
III Design DescriptionTesting was performed in the 24” x 24” Wind Tunnel (Lifesaver) in the Fluid Mechanics Lab (FML) at
NASA Ames Research Center. A test stand to hold the fins in place was made of light wood, wire, and Velcro (Figure 5) and was mounted on the torque sensor (Figure 6) and then that assembly was mounted on the wind tunnel along with an anemometer (Figure 7). An anemometer measured the tunnel’s wind speed in feet per minute and the torque sensor measured the torque generated by the drag over the test fin’s surface created by the wind. The torque sensor was calibrated to measure in grams.
Figure 5. Test stand concept (dimensions in inches) and the stand mounted on the torque sensor
Figure 6. Omega TQ201 Series Torque Sensor and digital display
2
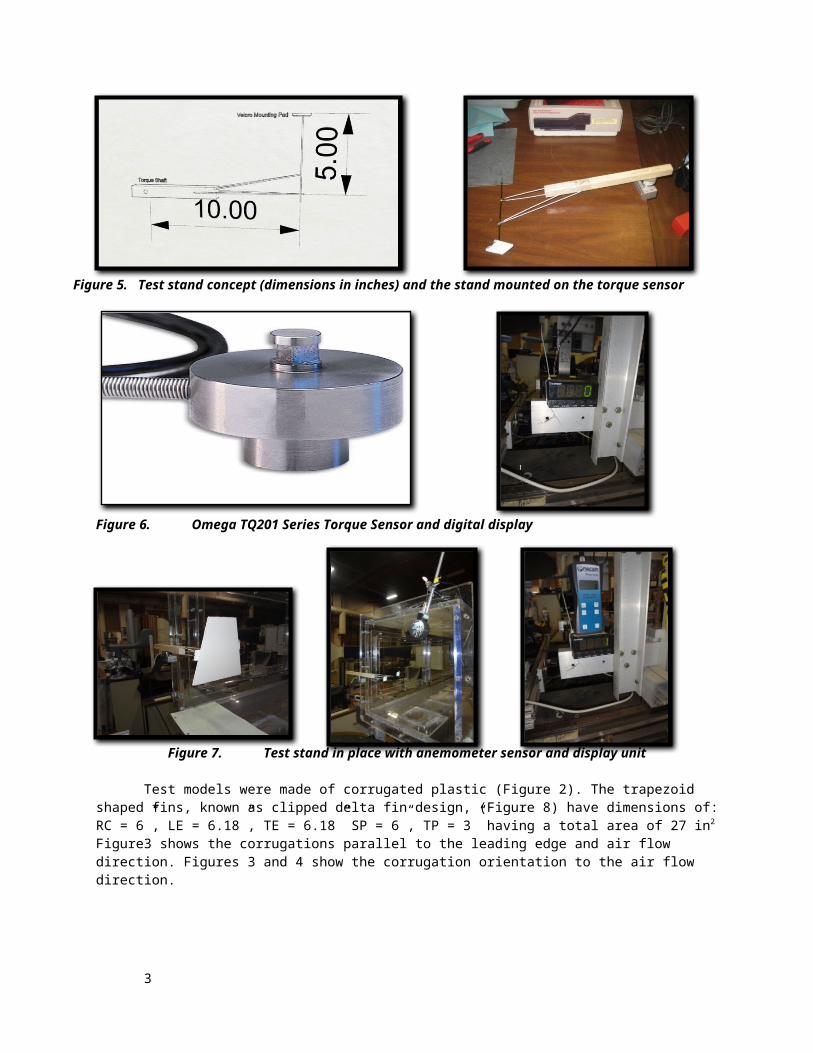
Figure 7. Test stand in place with anemometer sensor and display unit
Test models were made of corrugated plastic (Figure 2). The trapezoid shaped fins, known as clipped delta fin design, (Figure 8) have dimensions of: RC = 6”, LE = 6.18”, TE = 6.18” SP = 6”, TP = 3” having a total area of 27 in2 Figure3 shows the corrugations parallel to the leading edge and air flow direction. Figures 3 and 4 show the corrugation orientation to the air flow direction.
Figure 8. Clipped Delta Fin
The torque load cell sensor has an output of 2 mV/V with a load range of 25 ounce-inches. The test stand was mounted on the rotating shaft of the torque sensor which meant that any rotating movement of the test stand would cause the torque sensor to display a reading.
First the stand was mounted to the torque sensor the combination of sensor and stand hereinafter referred to as the fin mount, and then the torque sensor was connected to a digital display instrument. A near frictionless pulley was mounted and place behind the fin mount in such as fashion that the calibrating weights could be tied to a piece of string in order to cause the torque sensor to register movement (Figure 9). Increasing gram weights were tied to the string in order to collect a set of data points that would be used to convert the torque load cell readings to equivalent grams. The fin mount was mounted in center of the exit end of the wind tunnel. The wind tunnel was turned on and torque readings were recorded to ensure that the drag of the fin mount did not exceed the load capacity of the torque sensor.
3
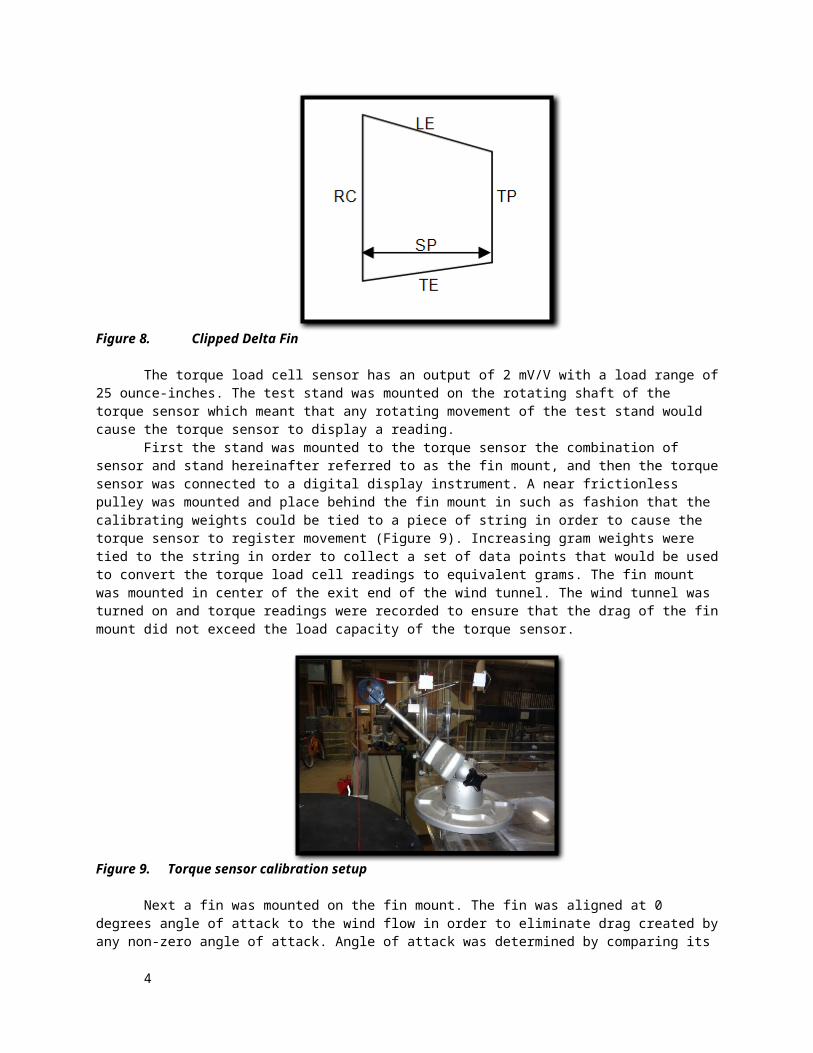
Figure 9. Torque sensor calibration setup
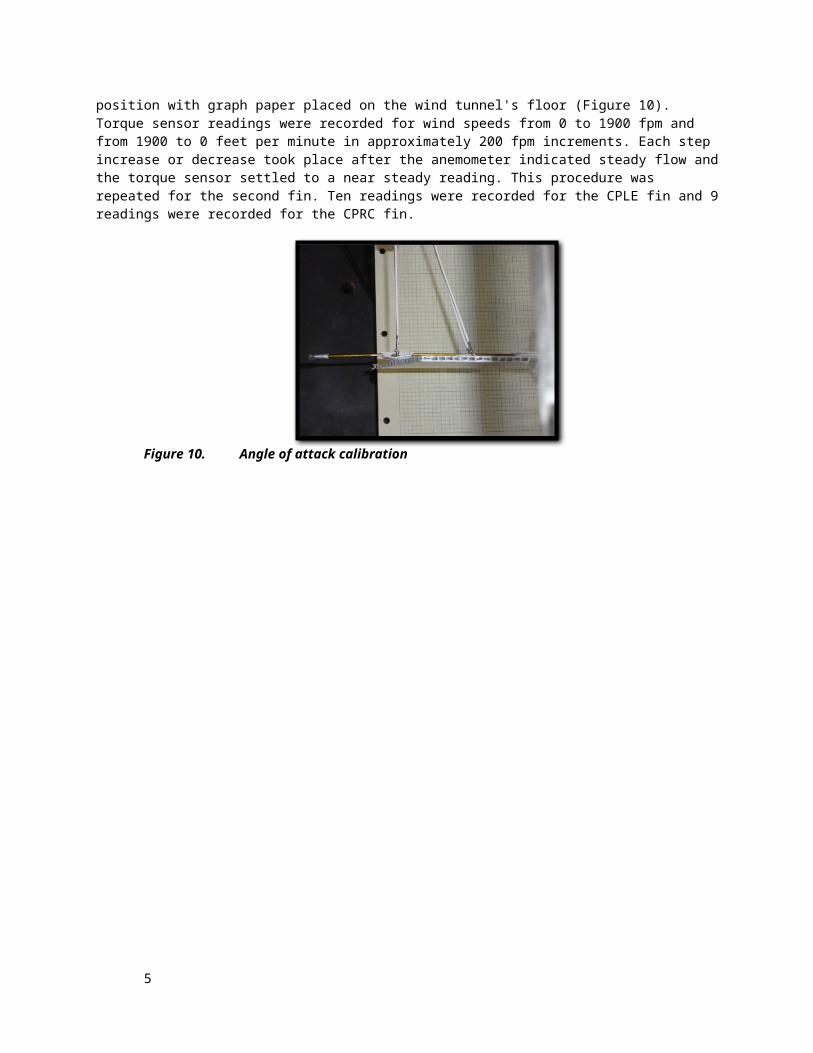
Next a fin was mounted on the fin mount. The fin was aligned at 0 degrees angle of attack to the wind flow in order to eliminate drag created by any non-zero angle of attack. Angle of attack was determined by comparing its position with graph paper placed on the wind tunnel's floor (Figure 10). Torque sensor readings were recorded for wind speeds from 0 to 1900 fpm and from 1900 to 0 feet per minute in approximately 200 fpm increments. Each step increase or decrease took place after the anemometer indicated steady flow and the torque sensor settled to a near steady reading. This procedure was repeated for the second fin. Ten readings were recorded for the CPLE fin and 9 readings were recorded for the CPRC fin.
Figure 10. Angle of attack calibration
4
IV Analysis and Results
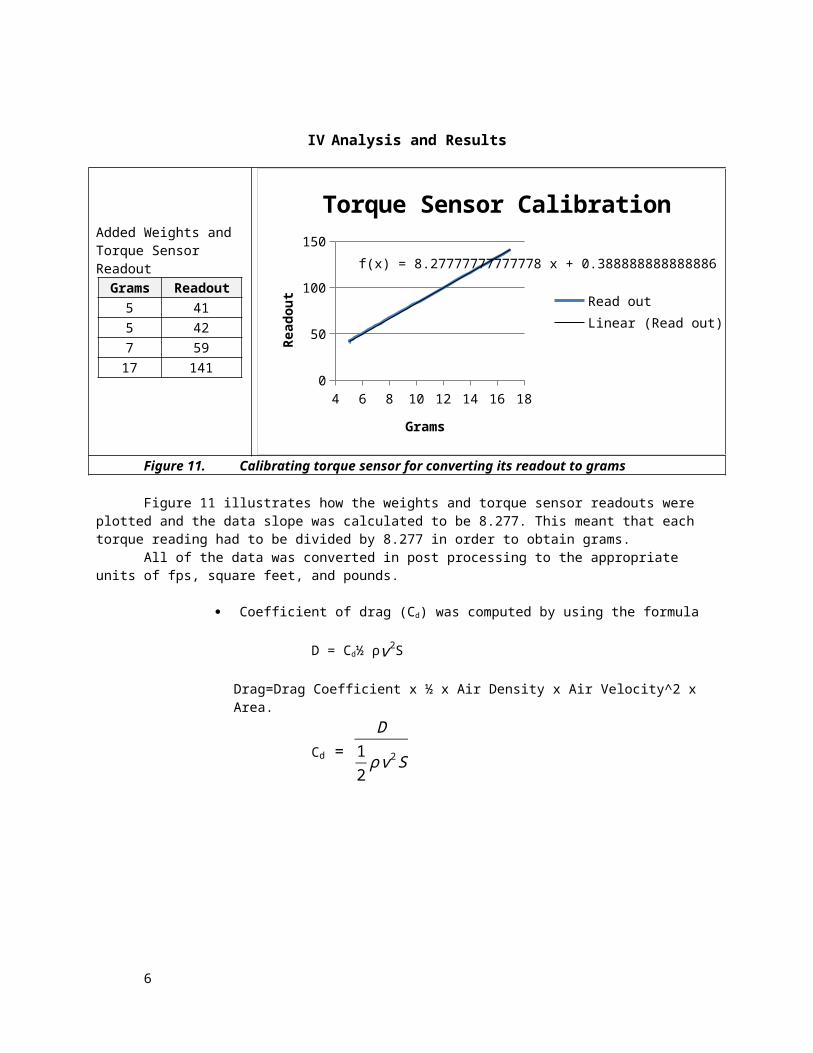
Added Weights and Torque Sensor Readout
Grams Readout5 415 427 5917 141
4 6 8 10 12 14 16 180
20406080
100120140160
f(x) = 8.27777777777778 x + 0.388888888888886
Torque Sensor Calibration
Read outLinear (Read out)
Grams
Read
out
Figure 11. Calibrating torque sensor for converting its readout to grams
Figure 11 illustrates how the weights and torque sensor readouts were plotted and the data slope was calculated to be 8.277. This meant that each torque reading had to be divided by 8.277 in order to obtain grams.
All of the data was converted in post processing to the appropriate units of fps, square feet, and pounds.
Coefficient of drag (Cd) was computed by using the formula
D = Cd½ ρv2S
Drag=Drag Coefficient x ½ x Air Density x Air Velocity^2 x Area.
Cd = D
12
ρ v2 S
5
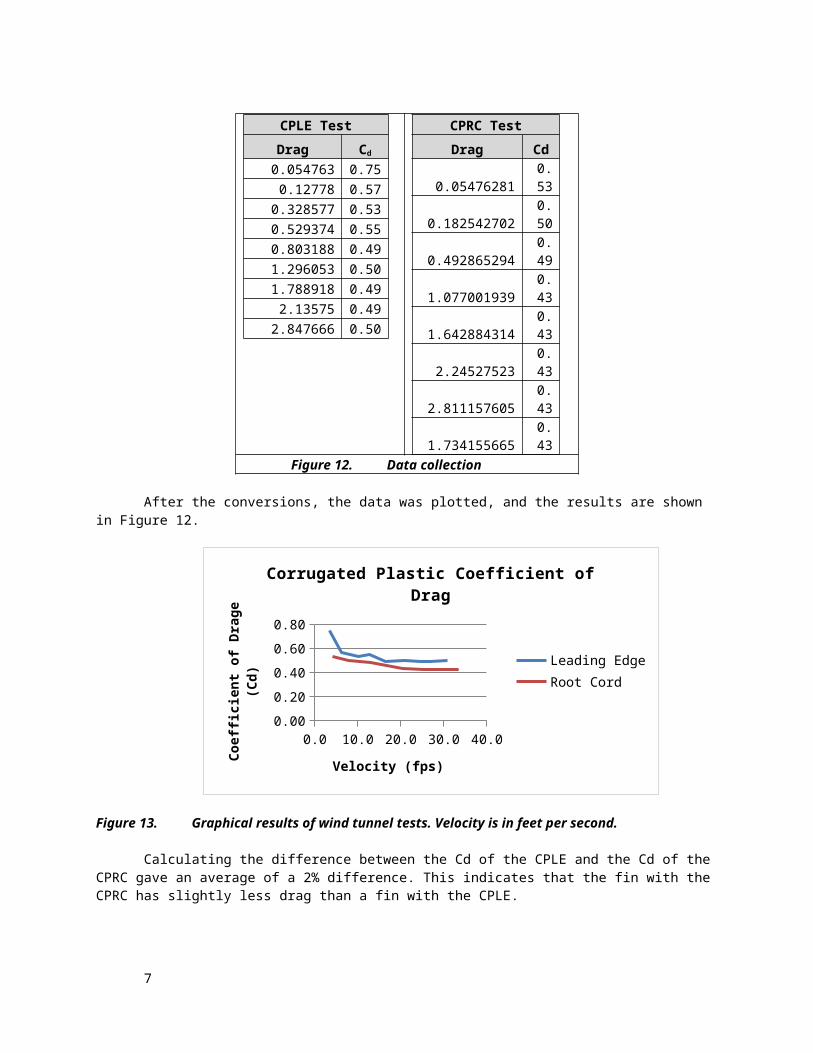
CPLE Test
Drag Cd
0.054763 0.750.12778 0.57
0.328577 0.530.529374 0.550.803188 0.491.296053 0.501.788918 0.492.13575 0.49
2.847666 0.50
CPRC Test
Drag Cd0.05476281 0.53
0.182542702 0.500.492865294 0.491.077001939 0.431.642884314 0.432.24527523 0.43
2.811157605 0.431.734155665 0.43
Figure 12. Data collection
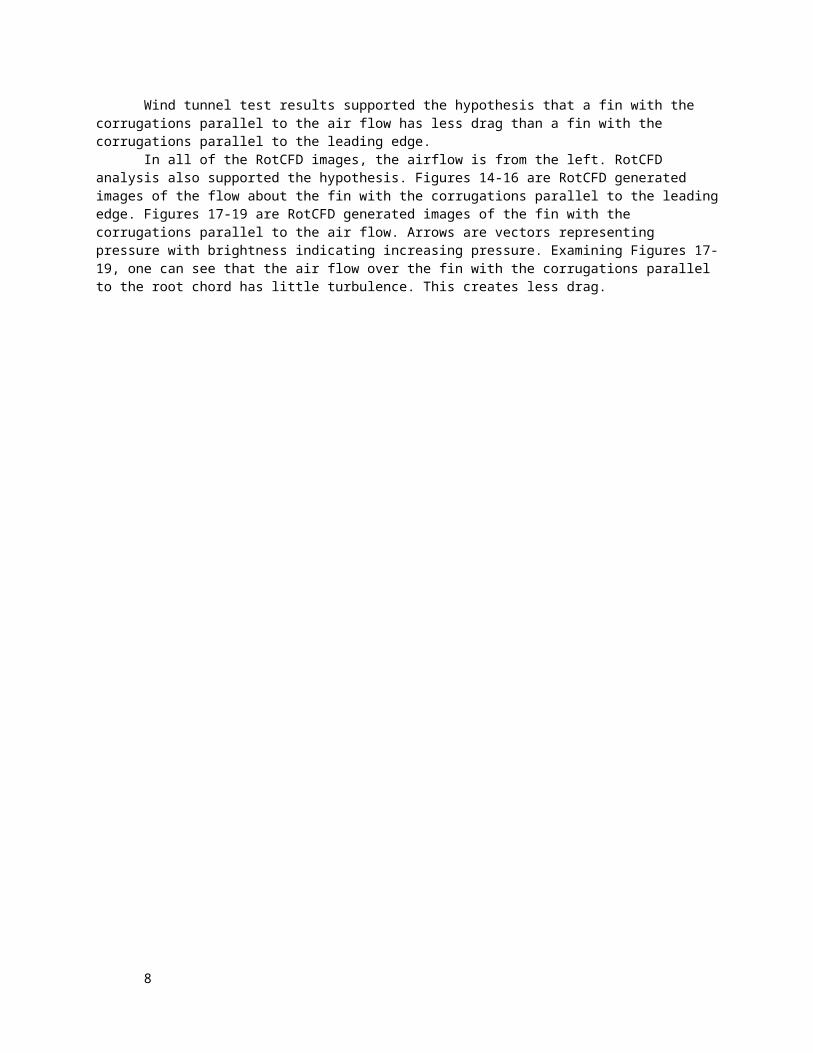
After the conversions, the data was plotted, and the results are shown in Figure 12.
0.0 5.0 10.0 15.0 20.0 25.0 30.0 35.00.000.100.200.300.400.500.600.700.80
Corrugated Plastic Coefficient of Drag
Leading EdgeRoot Cord
Velocity (fps)
Coeffi
cient
of D
rage
(Cd)
Figure 13. Graphical results of wind tunnel tests. Velocity is in feet per second.
Calculating the difference between the Cd of the CPLE and the Cd of the CPRC gave an average of a 2% difference. This indicates that the fin with the CPRC has slightly less drag than a fin with the CPLE.
Wind tunnel test results supported the hypothesis that a fin with the corrugations parallel to the air flow has less drag than a fin with the corrugations parallel to the leading edge.
In all of the RotCFD images, the airflow is from the left. RotCFD analysis also supported the hypothesis. Figures 14-16 are RotCFD generated images of the flow about the fin with the corrugations parallel to the leading edge. Figures 17-19 are RotCFD generated images of the fin with the corrugations parallel to the air flow. Arrows are vectors representing pressure with brightness indicating increasing pressure. Examining Figures 17-19, one can see that the air flow over the fin with the corrugations parallel to the root chord has little turbulence. This creates less drag.
6
RotCFD images of fin with corrugations parallel to its leading edge
Figure 14. Cross section with Leading Edge on left Figure 15. Top view with Leading Edge on left
Figure 16. Front view looking down the span toward the root
RotCFD images of fin with corrugations parallel to air flow
Figure 17. Cross section with Leading Edge on left Figure 18. Top view with Leading Edge on left
Figure 19. Front view looking down the span toward the root
7
V ConclusionsWind tunnel tests and RotCFD modeling indicate that fins with CPRC have slightly less drag than fins with CPLE.
VI Acknowledgments I would like to express my deepest appreciation to everyone who provided me the possibility to complete
my report. A special gratitude I give to my mentors Gary Brandt and Kurt Long, whose contribution to my project, testing, and encouragement, helped me to coordinate my project especially in writing this report. I would also like to thank AIHEC, TCUP, Navajo Technical University, the NART Team, Ames Aeromechanics Branch, Dr. William Warmbrodt, and Jessica Williams. Special thanks to Christine Gregg and Larry Young for editing and offering helpful suggestions.
VII Bibliography
Brandt, Gary. July 17, 2013.Department of Physics, http://van.physics.illinois.edu/qa/listing.php?id=2140. July 17, 2013.Long, Kurt. July 17, 2013.NASA, The Coefficient Drag. http://www.grc.nasa.gov/WWW/k-12/rocket/dragco.html. July 29, 2013.NASA, Rocket Stability. http://exploration.grc.nasa.gov/education/rocket/rktstab.html. July 17, 2013.NASA, http://www.nasa.gov/. July 15, 2013.THE PHYSICS HYPERTEXTBOOK, Aerodynamic Drag. http://physics.info/drag/. July 19, 2013.U.S. DEPARTMENT OF TRANSPORTATION FEDERAL AVAITION ADMINISTRATION.ROTORCRAFT FLYING HANDBOOK. Washington, DC: 2000. Print.
8