narrow river – 20 years of river monitoring! · • nr11 - mettatuxet brook (1996) ... • the...
TRANSCRIPT

Narrow River – 20 years of River Monitoring!
Veronica M. Berounsky, Ph.D. & Annette DeSilva A presentation to the Narrow River Preservation Association’s
Annual Meeting October 4, 2012

Topics to be covered • The River Watch volunteer
monitoring program –overview • A review of Twenty Years of
Data • Observations and Trends • What can we do? • How has the data been used? • Partners and Funding • 2012 Narrow River Volunteers
Photo by Veronica Berounsky

River Watch – Background Information
• 1991 - The Narrow River Stormwater Management Project - As part of this project, funds were allocated for citizen water quality monitoring.
• 1992 - “River Watch” officially begins with 10 monitoring locations and is part of the URI Watershed Watch Program
• 2011 – Completed 20 years of volunteer monitoring of the Narrow River! – 14 sites
Watershed Watch & River Watch Goals:
• To promote active citizen participation in water quality protection.
• To educate the public about water quality issues.
• To obtain multi-year surface water quality information in order to ascertain current conditions and to detect trends.
• To encourage sound management programs based upon water quality information.

Satellite view of Narrow River and its Watershed • Watershed boundary is
approximately Rt. 1 and Rt. 1A • Watershed area is 8,700 acres
or 14.4 sq. miles or 35.5 sq. km
• Length is 7 miles or 9 km long • Located in North Kingstown,
South Kingstown & Narragansett
Land use is primarily residential (Photo from Google Earth)

The Narrow River is actually an estuary, not just a river, and has flows of both freshwater and salt water. Salt water from RI Sound reaches into Gilbert Stuart Stream at high tide.
Diagram by David Smith (2008)

Narrow River - Monitoring Locations • NR1 - Gilbert Stuart Stream • NR2 - Upper Pond • NR3 - Lower Pond A • NR4 - Lower Pond B • NR5 - Lacey Bridge • NR6 - Mettatuxet Beach • NR7 - End of the Narrows • NR8 - Middlebridge • NR9 - Pettaquamscutt Cove • NR10 - Sprague Bridge • NR11 - Mettatuxet Brook (1996) • NR12 - Mumford Brook (2000) • NR13 – Near Lakeside Rd (2004) • NR14 – Lakeside Outfall (2004)

What is monitored?
• Monitoring Season: May – Oct • Temperature • Salinity • Dissolved Oxygen • Chlorophyll • Bacteria • Nutrients
Photo by Annette DeSilva

Twenty Years in Review
• 170 volunteers have participated in the Narrow River Watch Program!
• # of monitoring days = 2576 (= 130/year) • Total Field Measurements = ~ 30,534 • Total Lab Analyses = ~10,400 • Volunteer Hours = 4,200+ hours

River Watch Data ~ a brief summary ~
Monitor Robert Schelleng 1992 (Photo by Annette DeSilva)

Bacteria Data and Trends
Photo by Annette DeSilva

Bacteria – Why are we concerned? • Bacteria analyses screen for suitability for
recreational water uses (swimming) and shellfishing, and may indicate sewage contamination.
Figure 1: Potential sources of bacteria to a waterway (from Ely, 1997).
Marine standards: • Recreation (safe
swimming) = 50 fecal coliform/100 ml
• Shellfishing = 14 fecal coliform/100 ml
Fresh Water Standard: • Recreation = 200 fecal
coliform/100 ml

Sites and Bacteria Trends
• The next slides will include a photograph of a selected River Watch site followed by a graph of the 20 years of bacteria values at that site.
• Graphs of nutrient trends will follow.

NR 3 - Lower Pond Is home to the URI Crew Teams and the annual
Narrow River Turnaround Swim
Photo above by Veronica Berounsky Photo right by John McNamara

NR-3: Lower Pond (marine water)
020406080
100120140160180200
Feca
l Col
iform
per
100
mL
NR-3: Bacteria - Fecal Coliform
May June July Aug Sept
Safe Swimming = <50 FC/100mL
Safe for Shellfishing = <14 FC/100mL

NR 6 - Mettatuxet Beach Detention Pond outfall
Photo by Veronica Berounsky

NR-6: Mettatuxett Beach
0
20
40
60
80
100
120
140
160
180
200
Feca
l Col
iform
per
100
mL
NR-6: Bacteria - Fecal Coliform
May June July August Sept
Safe Swimming = 50 FC/100 mL Shellfishing = 14 FC/100 mL

NR 8 = Middlebridge Bridge
Photo by Veronica Berounsky
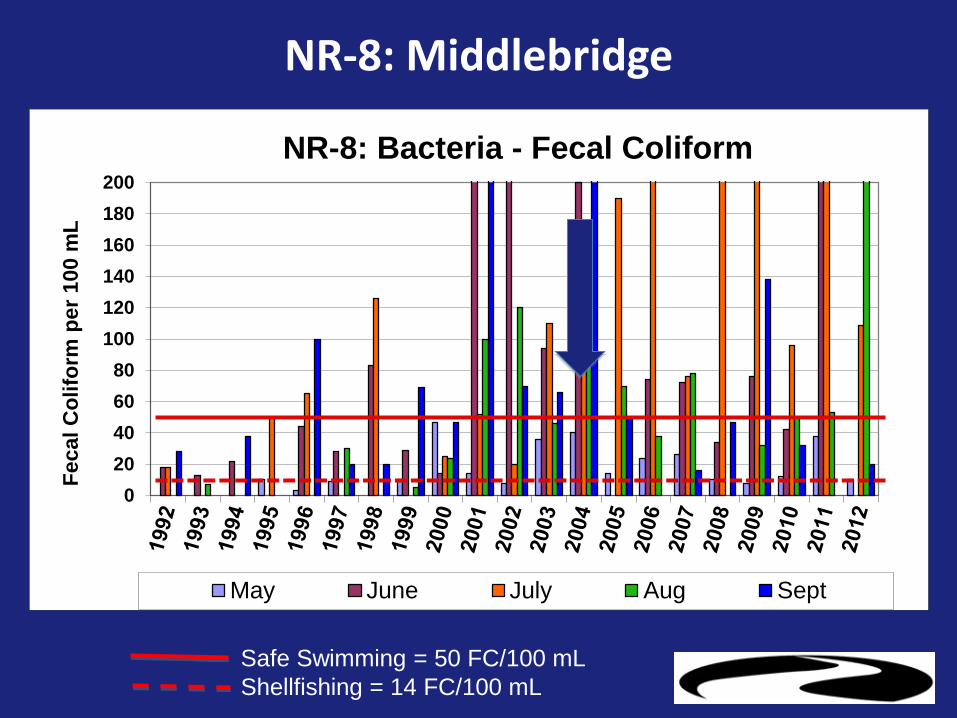
NR-8: Middlebridge
020406080
100120140160180200
Feca
l Col
iform
per
100
mL
NR-8: Bacteria - Fecal Coliform
May June July Aug Sept
Safe Swimming = 50 FC/100 mL Shellfishing = 14 FC/100 mL

NR 9 – Pettaquamscutt Cove
Kayakers near Gooseberry Island - Photo by Jason Considine

NR-9 Pettaquamscutt Cove
020406080
100120140160180200
Feca
l Col
iform
per
100
mL
NR-9: Bacteria - Fecal Coliform
May June July August Sept
Safe Swimming = 50 FC/100 mL Shellfishing = 14 FC/100 mL - - - - - - - -

Now we will look at monitoring trends at sites where waters enter Narrow River….

NR-13: Near Lakeside Drive
photo by Veronica Berounsky
Dock = NR13
Outfall = NR14
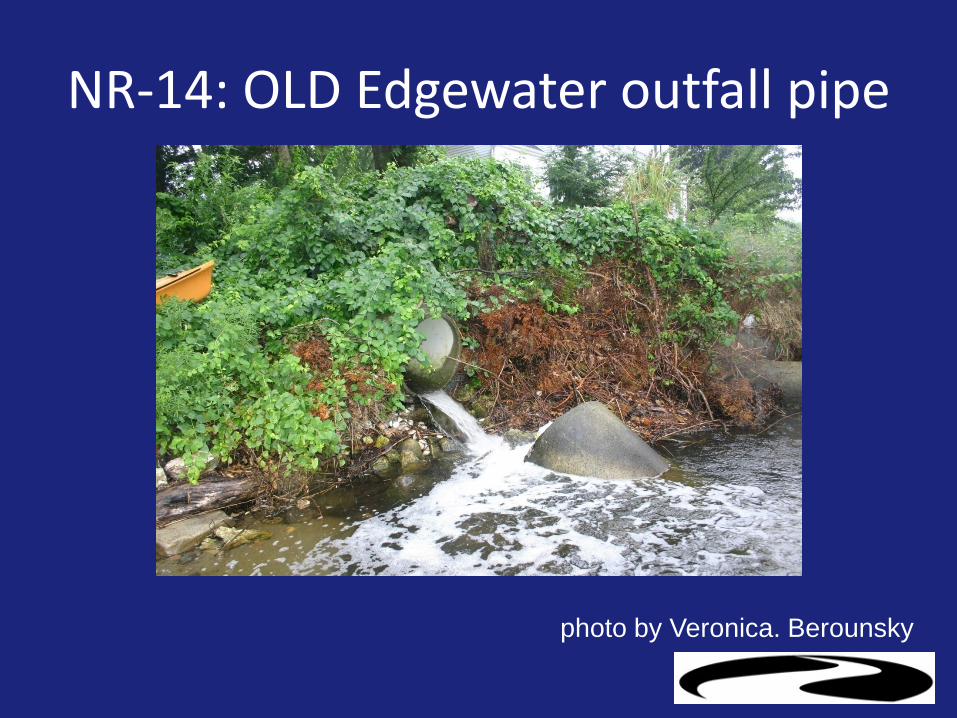
NR-14: OLD Edgewater outfall pipe
photo by Veronica. Berounsky

The NEW Edgewater BMP system: sand filter and outfall
The sand filter slows down the flow of stormwater, keeps it in the sunlight, and filters it to reduce the amount of bacteria and nitrogen
Photos by Veronica Berounsky

NR-14: Lakeside Outfall
050
100150200250300350400450500550600
Feca
l Col
iform
per
100
mL
NR-14: Bacteria - Fecal Coliform
May June July August Sept
Safe Swimming = 200 FC/100 mL

NR-13: Near Lakeside Drive
050
100150200250300350400450500550600
Feca
l Col
iform
per
100
mL
NR-13: Bacteria - Fecal Coliform
May June July Aug Sep
Safe Swimming = 50 FC/100 mL Shellfishing = 14 FC/100 mL -----------------

NR-1: Gilbert Stuart Stream entering Narrow River
Photo by Richard Benjamin 2007 Station NR 1 is just north of here

NR-1: Gilbert Stuart Stream (fresh water)
0
100
200
300
400
500
600
700
800
900
1000
Feca
l Col
iform
per
100
mL
NR-1: Bacteria - Fecal Coliform
May June July August Sept
Safe Swimming = 200 FC/100 mL

NR-12 = Mumford Brook = fresh water stream
entering Pettaquamscutt Cove
Photo above by John McNamara Photo right by Annette DeSilva
Culvert carrying Mumford Brook under Mumford Rd.

NR-12- Mumford Brook (fresh water)
0100200300400500600700800900
1000
Feca
l Col
iform
per
100
mL
NR-12: Bacteria - Fecal Coliform
May June July AugustSafe Swimming = 200 FC/100 mL

Nitrogen Data and Observations
Why do we worry about Nitrogen?
• Excess fertilizer use leads to runoff of excess nitrogen to the River
• Stormwater runoff is often high in nitrogen and fecal coliform bacteria
• Nitrogen leads to algal blooms that decrease sunlight and harm eelgrass beds
• Decaying algae depletes dissolved oxygen forming hypoxic (low oxygen) conditions and harming fish and shellfish.

Too many nutrients = eutrophication = enriched waters
P-fresh Or N-salt
Algae Water Clarity
Dissolved Oxygen
Eelgrass
Fish & Shellfish
Adapted from URI WW graphic

Observations and Trends
looked at today:
• 5 stations along the River: NR3 = Lower Pond (at surface & at 3m deep) NR 6 = Mettatuxet Beach NR 8 = Middlebridge NR 9 = Pettaquamscutt Cove NR 10 = Sprague Bridge

0
10
20
30
40
50
60
70
80
90
1992 1993 1994 1995 1996 1997 1998 1999 2000 2001 2002 2003 2004 2005 2006 2007 2008 2009 2010
umol
/l
Total Nitrogen River Watch Season Lower Pond (NR 3)
Surface
May
June
July
August
September
October
November

0
10
20
30
40
50
60
70
80
90
1992 1993 1994 1995 1996 1997 1998 1999 2000 2001 2002 2003 2004 2005 2006 2007 2008 2009 2010
umol
/l
Total Nitrogen River Watch Season Lower Pond (NR 3)
3.0 meters
May
June
July
August
September
October

0
10
20
30
40
50
60
70
80
90
1992 1993 1994 1995 1996 1997 1998 1999 2000 2001 2002 2003 2004 2005 2006 2007 2008 2009 2010
umol
/l
Total Nitrogen River Watch Season
Mettatuxet Beach (NR 6) Surface
May
June
July
August
September
October
November

0
10
20
30
40
50
60
70
80
90
1992 1993 1994 1995 1996 1997 1998 1999 2000 2001 2002 2003 2004 2005 2006 2007 2008 2009 2010
umol
/l
Total Nitrogen River Watch Season Middlebridge (NR 8)
Surface
May
June
July
August
September
October
November

0
10
20
30
40
50
60
70
80
90
1992 1993 1994 1995 1996 1997 1998 1999 2000 2001 2002 2003 2004 2005 2006 2007 2008 2009 2010
umol
/l
Total Nitrogen River Watch Season
Pettaquamscutt Cove (NR 9) Surface
May
June
July
August
September
October
November

0
10
20
30
40
50
60
70
80
90
1992 1993 1994 1995 1996 1997 1998 1999 2000 2001 2002 2003 2004 2005 2006 2007 2008 2009 2010
umol
/l
Total Nitrogen River Watch Season
Sprague Bridge (NR 10) Surface
May
June
July
August
September
October
November

Water Quality Trends :
What we have learned from
20 years of River Watch data…..

Conclusions for bacteria and nitrogen • Streams and the outfall have highest levels of
bacteria and nitrogen- these are inputs • After major rain events, see elevated levels of
bacteria and nutrients -so stormwater is a source • Pond sites have lower bacteria levels than other
sites – more land area for filtering? • Sites close to the mouth have lower nitrogen –
because less nitrogen offshore • Fewer spikes in nitrogen after about 2004 in
Middlebridge and Mettatuxet – due to BMP and bridge span increase?

Also, we haven’t yet seen a consistent reduction in levels of nitrogen
and sewers were supposed to help… • Why don’t we see a decrease in nitrogen right after the
sewers went in? • Information from other watersheds shows a 5-10 year lag
after sewers are put in and before any improvements are seen. It’s a long term investment.
• Sewers make “unbuildable” lots buildable, so there are more houses with more pavement
• See upcoming graphs…..

Important Issue for Narrow River: Increase in residential development
Why is this a problem? • more people = more paved surfaces (roads
and driveways and sidewalks) = more stormwater runoff volume
• More people = more fertilizer and pets = more nitrogen in the runoff

Houses in the Narrow RIver Watershed
0
500
1000
1500
2000
2500
3000
3500
4000
4500
1940 1950 1960 1970 1980 1990 2000 2010
year
num
ber o
f hou
ses
all houses unsewered houses
Numbers of houses (both as total and as those not connected to a sewer system) in the Narrow River watershed for 1944, 1957, 1975, 1985, 1992, and 2005. From Berounsky and Nixon 2007.

Changes in Narrow River watershed over time
0
500
1000
1500
2000
2500
3000
3500
4000
4500
1940 1950 1960 1970 1980 1990 2000 2010
year
num
ber o
f hou
ses
0.00
20.00
40.00
60.00
80.00
100.00
120.00
140.00
160.00
180.00
200.00
nitro
gen
load
(lbs
/day
)
all houses unsewered houses N load (rain+fert+septic)
Includes the calculated nitrogen load (SAIC 1994) from three sources: from rain that falls on the watershed and is not taken up by vegetation; from lawn fertilizer; and from septic systems
1944 - 1980 – as housing increased, nitrogen load increased Since 1980 – most houses on municipal sewer system Since 1980 – some decrease in nitrogen load, but load remains high since

Important Issue for Narrow River: Stormwater
• Stormwater brings both bacteria and nitrogen to the River
• Highest levels are in “first flush” of rain that pushes most material down the streets
• The town of Narragansett has been pro-active in seeking funds to design and implement “best management practices” structures to replace outfall pipes

The stormwater is often high in bacteria and nitrogen….
Before, During, and After Rain Event July 18, 2009
0
10,000
20,000
30,000
40,000
Pre-rain 20 minutes later 12 hrs later
Feca
l col
iform
s pe
r 100
mL
NR 14 - Lakeside Drive Outfall

Outfalls and streams have the same pattern in storm events.
Pre vs. Post Rain Data
0
500
1000
1500
2000
2500
3000
August - Pre-rain August - Post-rain
Ente
roco
cci p
er 1
00 m
L
NR 12 - Mumford Brook
NR 14 - Lakeside Outfall

The problem: • “Since 1959, the Narrow River has failed to
meet state standards for total coliform bacteria levels”
• “In 1979, parts of the Narrow River were
closed to shellfishing” • “Beginning in 1994, the entire expanse of the
Narrow River was closed to shellfishing and remains closed today due to high coliform bacteria levels.”
from The Narrow River Special Area Management Plan, CRMC, April 1999
The actions: This has brought about reports, actions, and
funds from the town of Narragansett, the state of Rhode Island, the Coastal Resources Management Council, and the Army Corps of Engineers
Important Issue: Shellfishing Ban due to high bacteria levels

The Good News:
• The Narrow River has no commercial or industrial enterprises on its banks.
• But this means that most contamination and pollution to the River is from human and wildlife sources
• And the good news is that we can help by our actions

What can we do about nitrogen and bacteria entering the River?
• Support and encourage municipal stormwater BMPs (go to town meetings)
• Develop other ways to keep pollutants away such as raingardens (public and private)
• Don’t feed the birds and do educate others. • Keep trash and waste away from the River. • Don’t dump down stormdrains. • Help determine levels in the River as a
volunteer monitor.

Support BMPs (Detention Ponds, etc.)
Purpose: • Temporarily store
excess stormwater runoff
• Filter this water by nutrient uptake from aquatic plants
• Sunlight also kills bacteria
• Trap sediment and trash for later removal Photo by V.
Berounsky

Rain gardens allow nitrogen to stay in the soil and vegetation
and not flow to the River
Example of a rain garden at North Kingstown Town Hall

DON’T feed the birds, they add nitrogen and bacteria to the River
Photo by Veronica Berounsky

Don’t dump trash, waste or even lawn clippings into the River.
They can add bacteria and nitrogen
Do your part and pick up! Photos by Rosemary Smith

Do Keep Pet Waste Away From the River
Photos by Rosemary Smith

Storm drain marking
Photo by Veronica Berounsky

River watch testing of the Water: sign up today!
Photos by Rosemary Smith and Veronica Berounsky

The future of the communities of life in the Narrow River Watershed depends on you !
Photo by Jason Considine Sunset over Pettaquamscutt Cove

Who has used the River Watch data? • Tri-town Stormwater Study • URI Researchers and Students • Army Corps of Engineers • Department of Environmental Management • Save the Bay • Bryant College • Environmental Protection Agency • The Nature Conservancy • And others

NRPA’s Partners and Funding • RIDEM’s Aqua Fund – funded first 3 years of River
Watch. • Towns of Narragansett, North Kingstown, South
Kingstown • EPA equipment grant • 2007 – The Washington Trust Co. • US Fish & Wildlife (funds for Mumford Brook Study) • URI Watershed Watch Office • Rhode Island River’s Council – Funding supported the
creation of this 20-year database NRPA greatly appreciates the support provided for River Watch

Linda Green and Elizabeth Herron URI Watershed Watch Office
Thank You!
Thank you to Rahat Sharif – for all of her help populating and Q/A of the River Watch database

We could not do this without our 2012 Volunteer Monitors
• Lynne Finnegan & Daughter – 1 year • Lynn Wolslegel – 2 years • Laura and Howard Reed – 2 years • Elizabeth Castro – 3 years • Annie and Susan Hall – 3 years • Liz Hill – 3 years • Abby & Perry Moylan - 3 years • Craig Wood – 3 years • Omar Zaki – 3 years

2012 Volunteer Monitors (continued)
• Will Cummer – 6 years • Rosemary Smith – 6 years • Dave Adelman – 7 years • The Sarubbi Family – 7 years • Bette Carey - 8 years • The Kaprielian Family – 8 years • Marc Lamson – 8 years • Dorothy & Dudley Mann – 8 years • Veronica Berounsky – 9 years

And 2012 Volunteer Monitors who have been with us for over 10
years: Sue Van Ness – 11 years Jennifer Carey – 15 years Robert Schelleng – 20+ years
(in photo in 2012) Annette DeSilva – 21 years Thank you all! We would not
have this data without you!