“napoleon's hair and old lace: proactive water management” patrick louchouarn columbia...
TRANSCRIPT
““Napoleon's hair and old lace: Napoleon's hair and old lace: proactive water managementproactive water management””
Patrick LouchouarnPatrick Louchouarn
Columbia University - MPA ESSPMColumbia University - MPA ESSPM
““How is it possible to find meaning in a finite world,How is it possible to find meaning in a finite world,given my waist and shirt size?given my waist and shirt size?””
Woody AllenWoody Allen

OutlineOutline Arsenic: From South Texas to Arsenic: From South Texas to
Central Arizona (a case for water Central Arizona (a case for water management)management)
1)1) Identification of metal sources to Identification of metal sources to surface water systemssurface water systems
2)2) Long term metal cyclingLong term metal cycling
3)3) What’s cooking…What’s cooking…

Napoleon’s hair and an old lace…Napoleon’s hair and an old lace…
““The level of arsenic found in The level of arsenic found in Napoleon's hair is higher than 10-Napoleon's hair is higher than 10-40 times the normal amounts and 40 times the normal amounts and
is an unmistakable sign of is an unmistakable sign of poisoning”poisoning”
Pascal Kintz,Pascal Kintz,
Strasbourg Forensic InstituteStrasbourg Forensic Institute
Arsenic in Bangladesh Drinking WaterArsenic in Bangladesh Drinking WaterIt’s pretty bad…...It’s pretty bad…...
““If I die, I will die, but I will not fetch water from another If I die, I will die, but I will not fetch water from another man’s house”man’s house”
Bangladeshi villagerBangladeshi villager
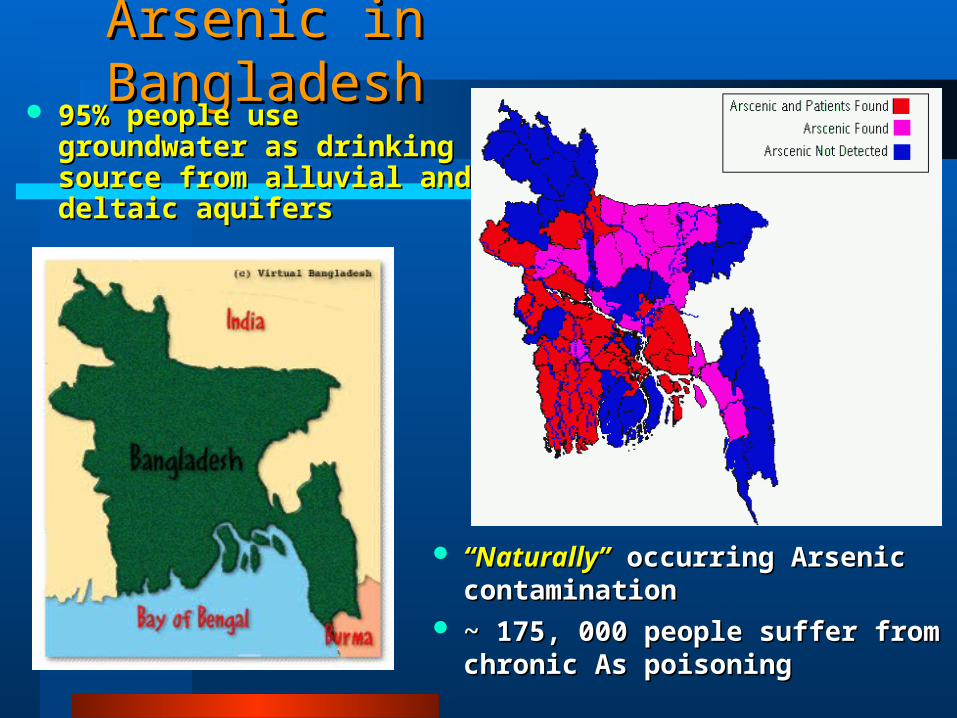
Arsenic in BangladeshArsenic in Bangladesh 95% people use groundwater 95% people use groundwater
as drinking source from as drinking source from alluvial and deltaic aquifersalluvial and deltaic aquifers
““Naturally”Naturally” occurring Arsenic occurring Arsenic contamination contamination
~ 175, 000 people suffer from ~ 175, 000 people suffer from chronic As poisoningchronic As poisoning

Symptoms of Chronic ArsenicosisSymptoms of Chronic Arsenicosis

Dealing with chronic As poisoningDealing with chronic As poisoning

Arsenic in Texas Drinking WaterArsenic in Texas Drinking WaterIt’s not so bad…...It’s not so bad…...
““If it donna kill ya, it probably ain’t bad for ya”If it donna kill ya, it probably ain’t bad for ya”
Texas villagerTexas villager

Finalized EPA Drinking Standard for ArsenicFinalized EPA Drinking Standard for Arsenic The Safe Drinking Water Act, as amended
in 1996, requires EPA to revise the existing drinking water standard for arsenic.
EPA reduced the maximum level of arsenic allowed in drinking water that reduces the maximum level allowed from 50 parts per billion (ppb) to 10 ppb.
This has been challenged by the Bush Administration
New standard will be applied to all community water systems (serving 254 million people)
12% of these systems will likely have to take corrective action
Estimated National Cost:
3 ppb = 645 M$, 5 ppb = 379 M$10 ppb = 166 M$, 20 ppb = 65 M$
Fallonites, Don Cooper, 82, and wife Norma, 81, raise a toast to Nevada's arsenic-rich homebrew on the outskirts of town. Concentrations in drinking water are approximaately 100 ppb.
Outside magazine, February 2001
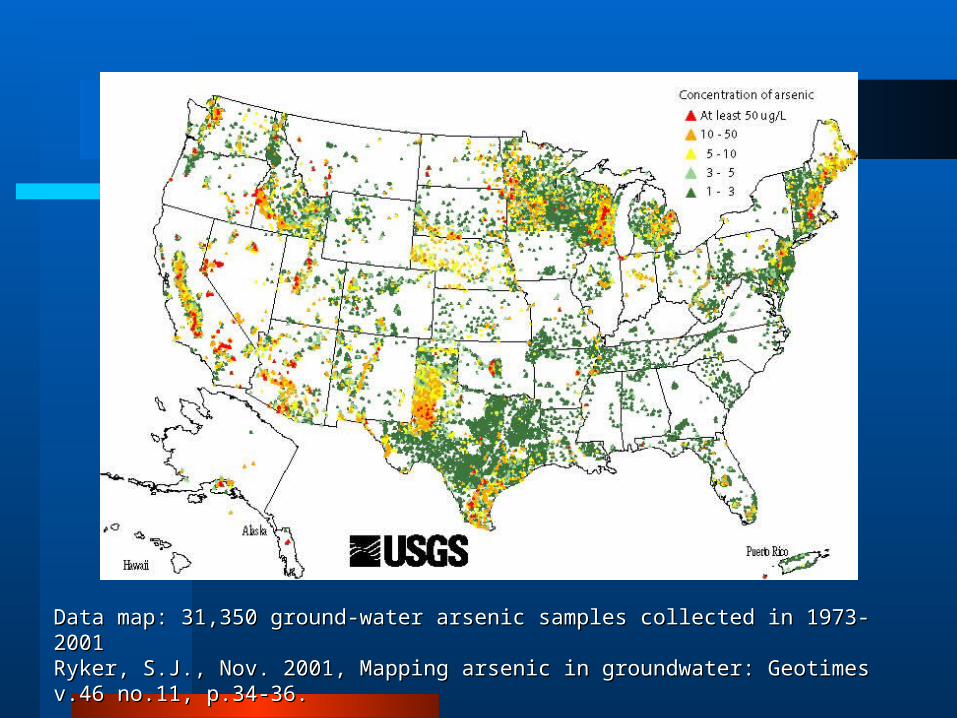
Data map: 31,350 ground-water arsenic samples collected in 1973-2001Data map: 31,350 ground-water arsenic samples collected in 1973-2001Ryker, S.J., Nov. 2001, Mapping arsenic in groundwater: Geotimes v.46 no.11, p.34-36.Ryker, S.J., Nov. 2001, Mapping arsenic in groundwater: Geotimes v.46 no.11, p.34-36.
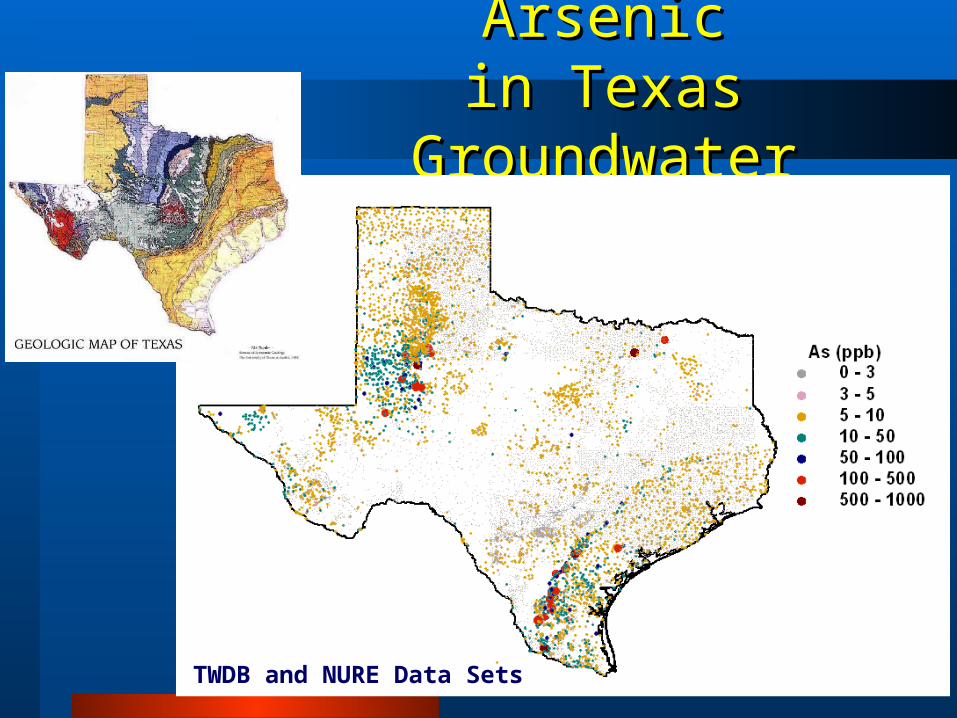
ArsenicArsenicin Texas Groundwaterin Texas Groundwater
TWDB and NURE Data Sets

TWDB and NURE Data Sets
MolybdenumMolybdenumin Texas Groundwaterin Texas Groundwater

Geogenic Source of MetalsGeogenic Source of Metals
Catahoula formation, an oxidized Catahoula formation, an oxidized volcanic ash is a source of U, As, volcanic ash is a source of U, As, Mo and other trace metalsMo and other trace metals

Chromatographic SeparationChromatographic SeparationChromatographic SeparationChromatographic Separation
U MoSe As
Adopted from Devoto (1978)
OxidizedRegionally Reduced

South Texas Uranium Roll South Texas Uranium Roll FrontFront

Texas’ Uranium HistoryTexas’ Uranium History
““Oxidized” uranium ores were Oxidized” uranium ores were open-pit mined from sandstone-open-pit mined from sandstone-hosted roll-front deposits (1960 - hosted roll-front deposits (1960 - 1983)1983)
Open pit mining feasible because Open pit mining feasible because of shallow depth to ore (<300 feet) of shallow depth to ore (<300 feet) and the poorly cemented nature of and the poorly cemented nature of overburden overburden
Voluminous spoils stockpiled near Voluminous spoils stockpiled near pits. Two processing mills in pits. Two processing mills in western Karnes Co. generated large western Karnes Co. generated large tailings pilestailings piles

U Mining in the Nueces and U Mining in the Nueces and San Antonio River BasinSan Antonio River Basin
NuecesRiver
San AntonioRiver
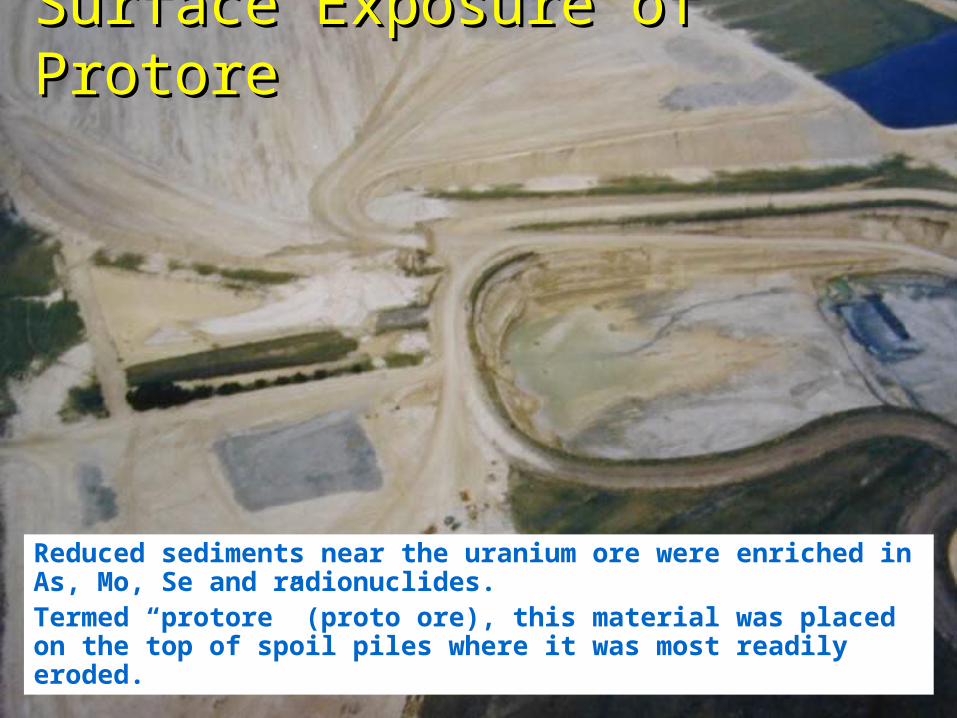
Reduced sediments near the uranium ore were enriched in As, Mo, Se and radionuclides.Termed “protore” (proto ore), this material was placed on the top of spoil piles where it was most readily eroded.
Surface Exposure of ProtoreSurface Exposure of Protore
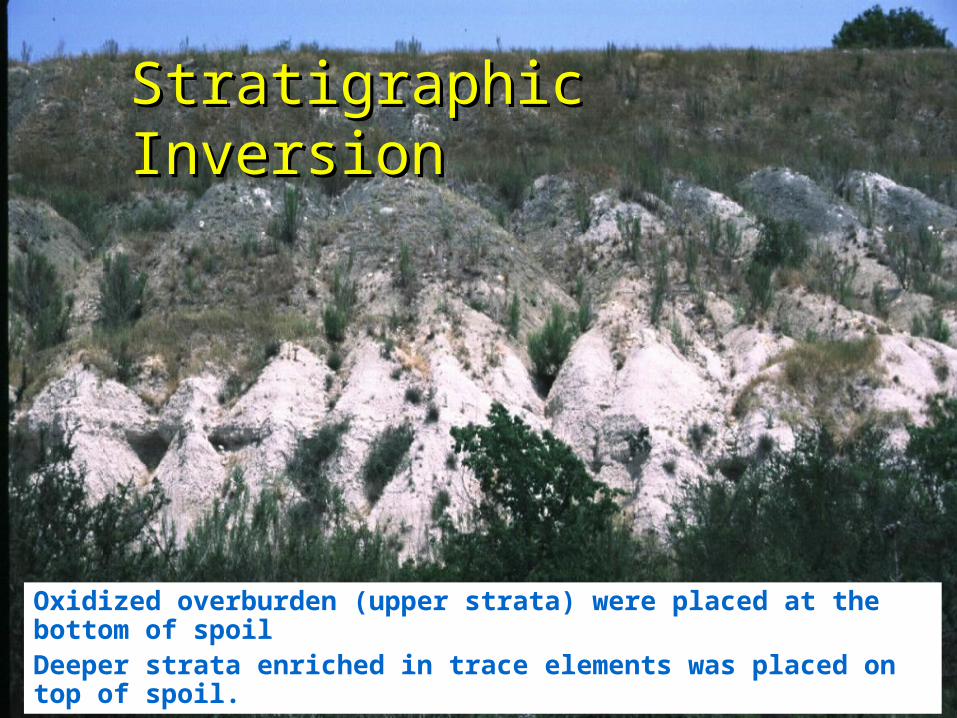
Oxidized overburden (upper strata) were placed at the bottom of spoilDeeper strata enriched in trace elements was placed on top of spoil.
Stratigraphic InversionStratigraphic Inversion
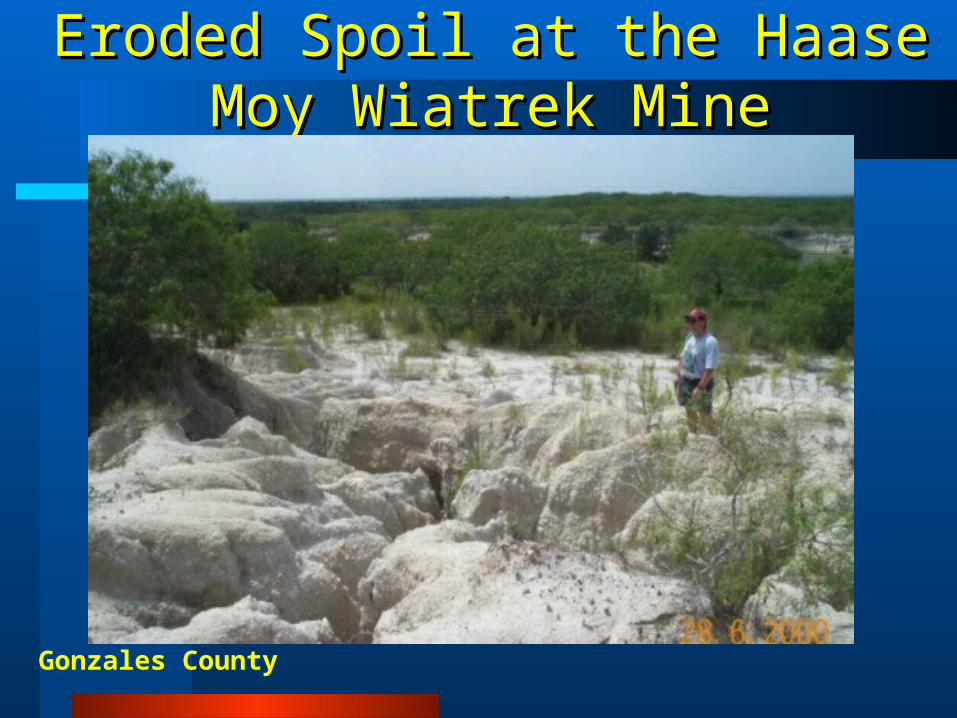
Eroded Spoil at the Haase Moy Eroded Spoil at the Haase Moy Wiatrek MineWiatrek Mine
Gonzales County

South Texas Ecological South Texas Ecological Impacts of MetalsImpacts of Metals
Molybdenosis in Black Angus Cattle, South Texas
Arsenic exposure to wildlife at ground water seeps in the Nueces River watershed

Arsenic in Texas Drinking WaterArsenic in Texas Drinking Water
What is the environmental legacy of What is the environmental legacy of U mining in South Texas…...U mining in South Texas…...

A littl’ TexasAdventure…A littl’ TexasAdventure…

Water Sample Collection
Water Sample Collection
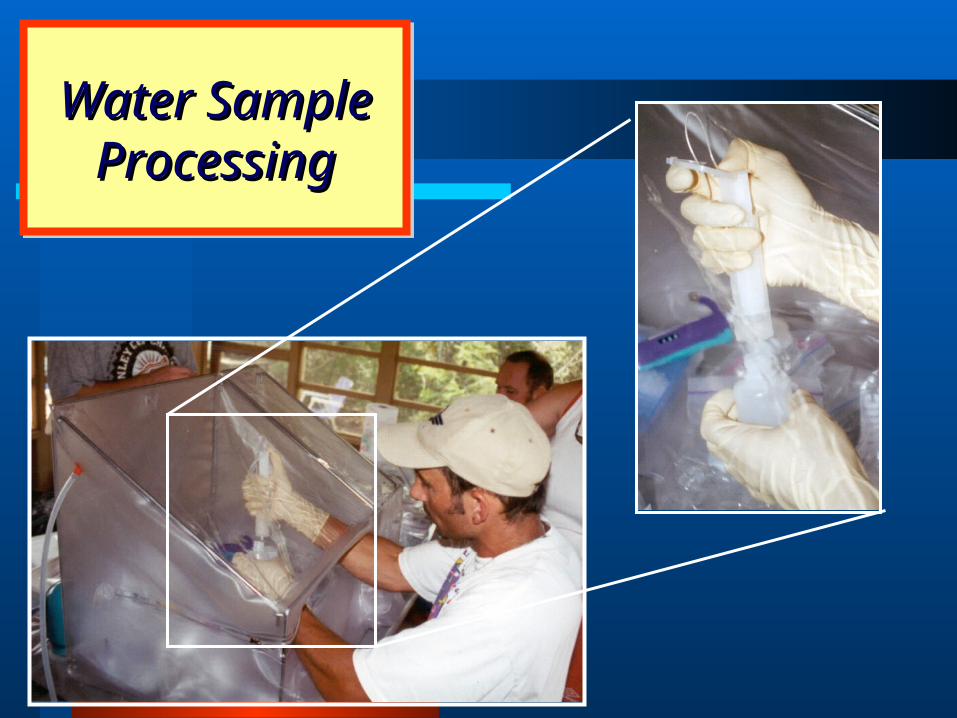
Water Sample Water Sample ProcessingProcessing
Water Sample Water Sample ProcessingProcessing
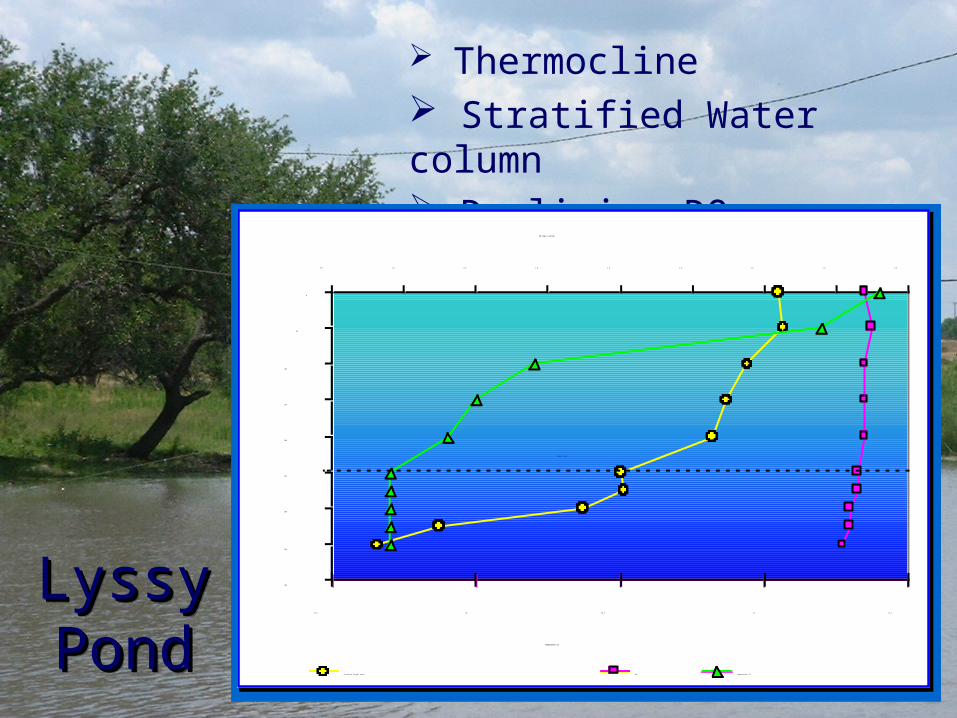
Lyssy Lyssy PondPondLyssy Lyssy PondPond
Thermocline Stratified Water column Declining DO
0
50
100
150
200
250
300
350
400
0.0 1.0 2.0 3.0 4.0 5.0 6.0 7.0 8.0
DO (mg/L) and pH
19.5 20 20.5 21 21.5
Temperature (C)
Dissolved Oxygen (mg/L) pH Temperature (C)
Redox cline

Arsenic Arsenic vs.vs. other oxyanions other oxyanionsLyssy Pond Profile - oxyanion ratios
0
50
100
150
200
250
300
350
400
0 20 40 60As/U
Depth (cm)
0 5 10 15
As/V
As/U
As/V

Station 1: DO Water Profile
0
2
4
6
8
10
12
14
0.0 2.0 4.0 6.0 8.0 10.0 12.0
Dissolved Oxygen (mg/L)
Depth (m)
July August January
O2 Boundary
O2 Boundary
Station 4: DO Water Profile
0
2
4
6
8
10
0.0 2.0 4.0 6.0 8.0 10.0 12.0
Dissolved Oxygen (mg/L)
Depth (m)
July August January
Virtually homogenous in Virtually homogenous in January and following the January and following the
episodic mixing event in Julyepisodic mixing event in July
Partial Partial stratification in stratification in
AugustAugust
Lake CCLake CC
DO ProfileDO Profile
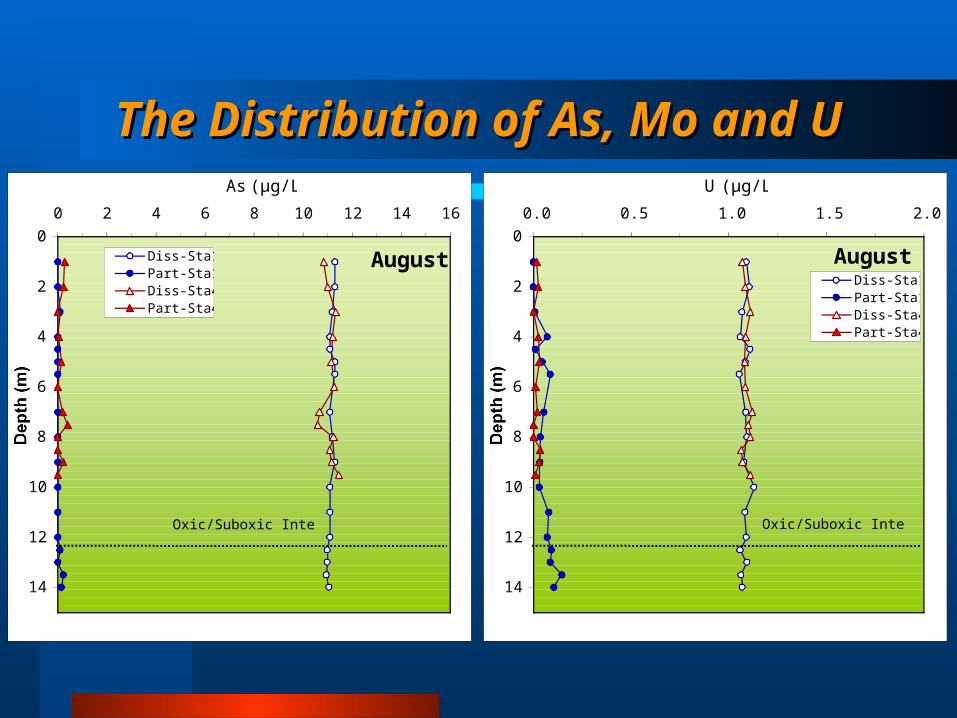
August0
2
4
6
8
10
12
14
0 2 4 6 8 10 12 14 16
As (µg/L)
Depth (m)
Diss-Sta1Part-Sta1Diss-Sta4Part-Sta4
Oxic/Suboxic Interface
August0
2
4
6
8
10
12
14
0.0 0.5 1.0 1.5 2.0
U (µg/L)
Depth (m)
Diss-Sta1Part-Sta1Diss-Sta4Part-Sta4
Oxic/Suboxic Interface
The Distribution of As, Mo and UThe Distribution of As, Mo and U
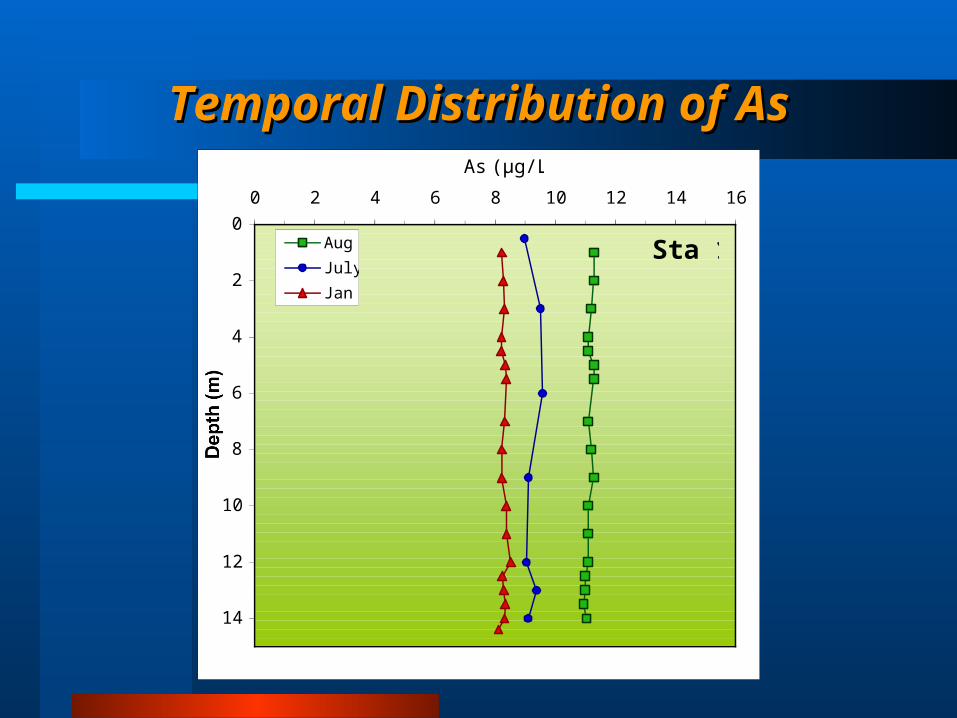
Sta 10
2
4
6
8
10
12
14
0 2 4 6 8 10 12 14 16
As (µg/L)
Depth (m)
Aug
July
Jan
Temporal Distribution of AsTemporal Distribution of As
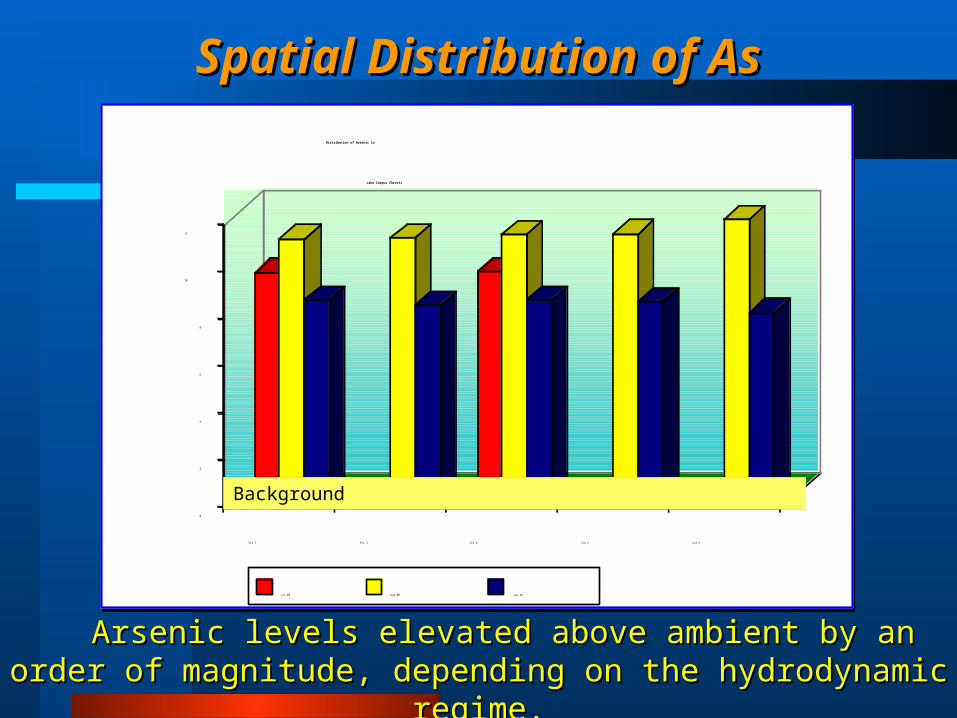
Arsenic levels elevated above ambient by an order of Arsenic levels elevated above ambient by an order of magnitude, depending on the hydrodynamic regime.magnitude, depending on the hydrodynamic regime.
Spatial Distribution of AsSpatial Distribution of As
0
2
4
6
8
10
12
Sta 1 Sta 2 Sta 4 Sta 5 Sta 6
Distribution of Arsenic in
Lake Corpus Christi
Jul-00 Aug-00 Jan-01
Background
0
5
10
15
20
25
30
35
40
45
50
ppb
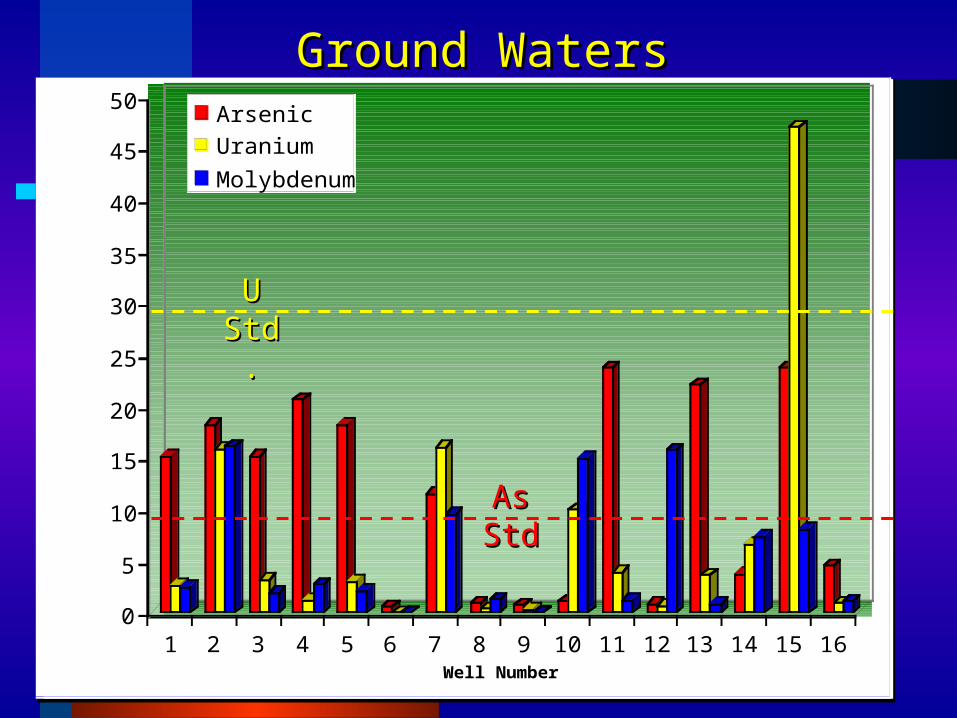
1 2 3 4 5 6 7 8 9 10 11 12 13 14 15 16Well Number
Arsenic
Uranium
Molybdenum
Ground WatersGround Waters
As As StdStd
U U Std.Std.

““Making prediction is very difficult, Making prediction is very difficult, especially about the future” – especially about the future” – Casey StengelCasey Stengel
Water scenarios: Projected and actual global withdrawals.Water scenarios: Projected and actual global withdrawals.From Gleick (2000): From Gleick (2000): The World’s Water, 2000-2001The World’s Water, 2000-2001
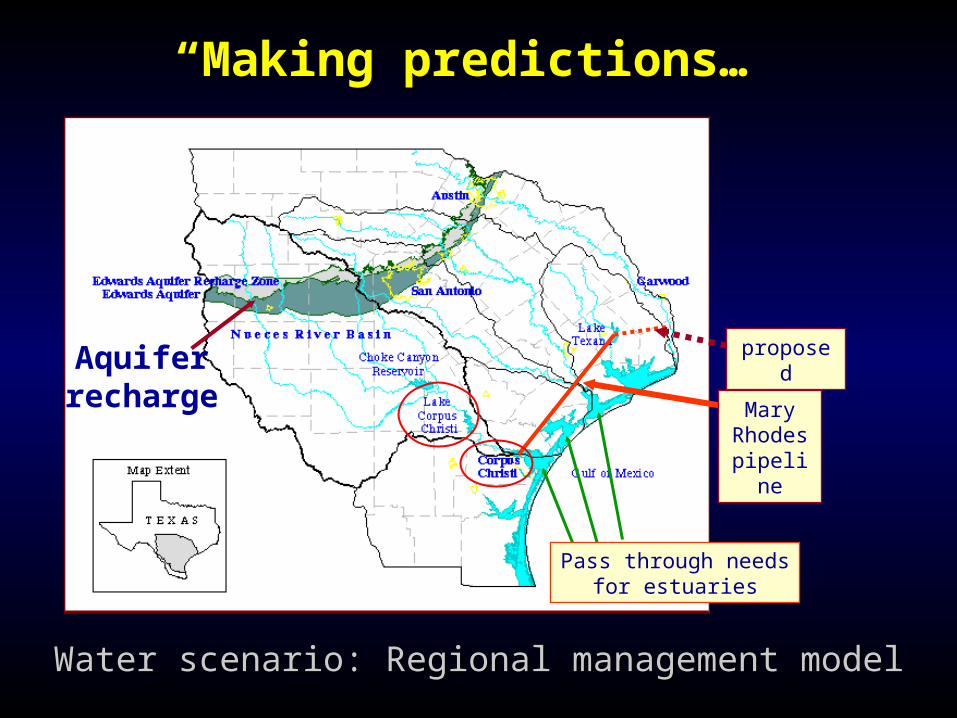
““Making predictions…”Making predictions…”
Water scenario: Regional management modelWater scenario: Regional management model
Aquiferrecharge
proposed
Pass through needsfor estuaries
Mary Rhodes pipeline
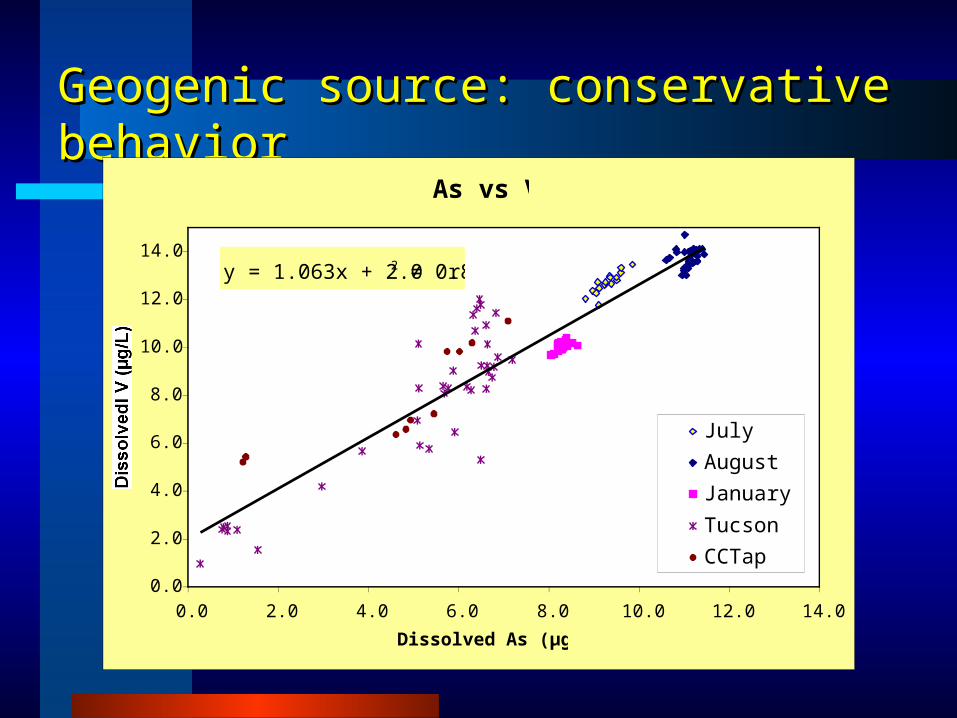
Geogenic source: conservative behavior Geogenic source: conservative behavior
As vs V
y = 1.063x + 2.0 r2 = 0.89
0.0
2.0
4.0
6.0
8.0
10.0
12.0
14.0
0.0 2.0 4.0 6.0 8.0 10.0 12.0 14.0
Dissolved As (µg/L)
Dissolvedl V (µg/L)
July
August
January
Tucson
CCTap
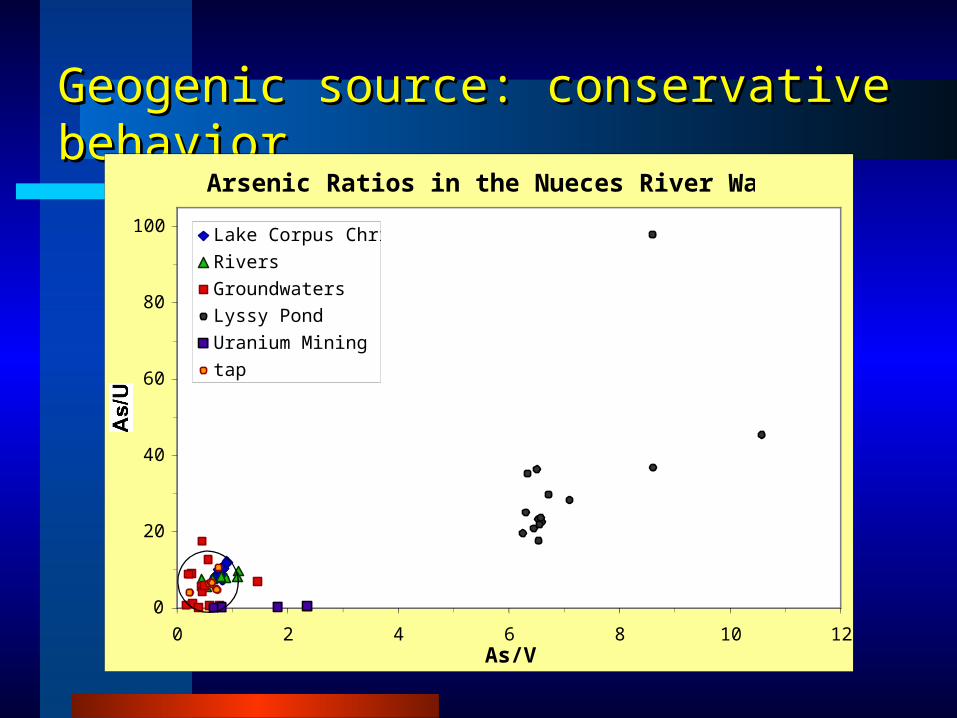
Geogenic source: conservative behavior Geogenic source: conservative behavior Arsenic Ratios in the Nueces River Watershed
0
20
40
60
80
100
0 2 4 6 8 10 12As/V
As/U
Lake Corpus Christi
Rivers
Groundwaters
Lyssy Pond
Uranium Mining
tap

Hydrodynamic control: evapoconcentration Hydrodynamic control: evapoconcentration
As Mass Balance - Lake CC
0.0
3.0
6.0
9.0
12.0
15.0
April MayJune JulyAugust
Sept Oct Nov Dec Jan FebMarchApril MayJune July
AugustMonth
As (ug/l)
0%
10%
20%
30%
40%
50%
60%
70%
CalculatedMeasured%Vol
M/M/t = Ct = CiiQQii – CQ – CQoo + R + Rdd – R – Rpp
AsAsLL((tt) = As) = AsLL((t-1t-1) + ([As]) + ([As]iiQQii) - ([As]Q) - ([As]Qoo))
[As]([As](tt) = As) = AsLL((tt)/Vol()/Vol(tt))
Implications of evapoconcentration Implications of evapoconcentration
1)1) Water management practices that take into Water management practices that take into consideration temporal changes (short-scale and consideration temporal changes (short-scale and short-lived)short-lived)
2)2) Management of water resources and overdrawn Management of water resources and overdrawn environments: Owens Lake and Salton Sea environments: Owens Lake and Salton Sea (California)(California)

Tucson’s Drinking WaterTucson’s Drinking Water
““Access to safe water is a Access to safe water is a fundamental human need and, fundamental human need and, therefore, a basic human right.therefore, a basic human right.
Contaminated water jeopardizes both Contaminated water jeopardizes both the physical and social health of all the physical and social health of all
people. It is an affront to human people. It is an affront to human dignity” dignity”
Kofi AnnanKofi Annan – – UN Secretary-General on UN Secretary-General on World Water DayWorld Water Day
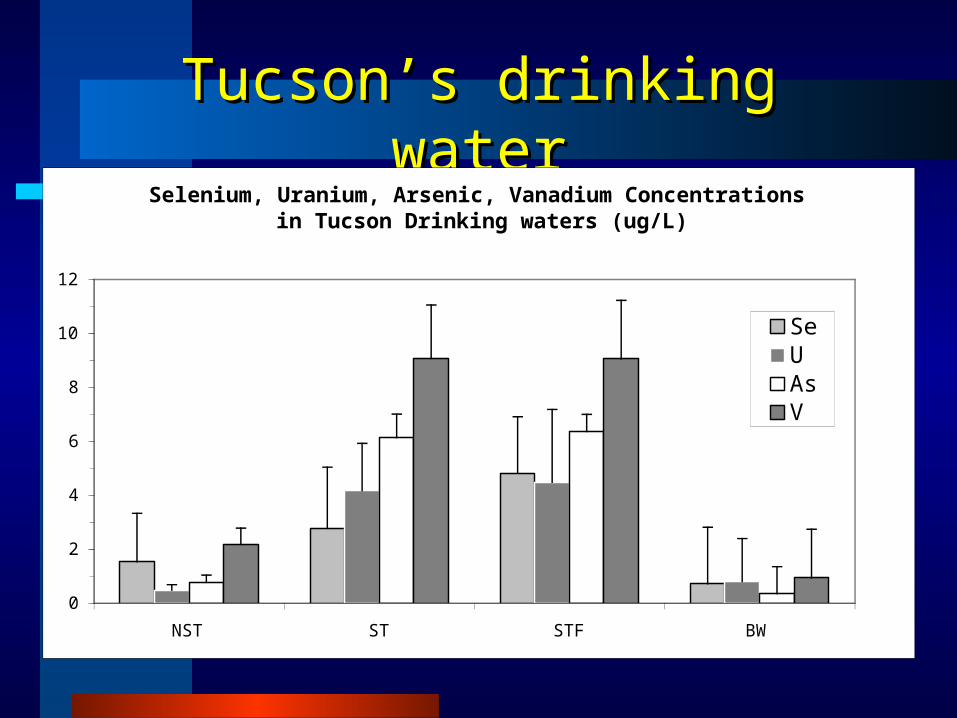
Tucson’s drinking waterTucson’s drinking waterSelenium, Uranium, Arsenic, Vanadium Concentrations
in Tucson Drinking waters (ug/L)
0
2
4
6
8
10
12
NST ST STF BW
SeUAsV
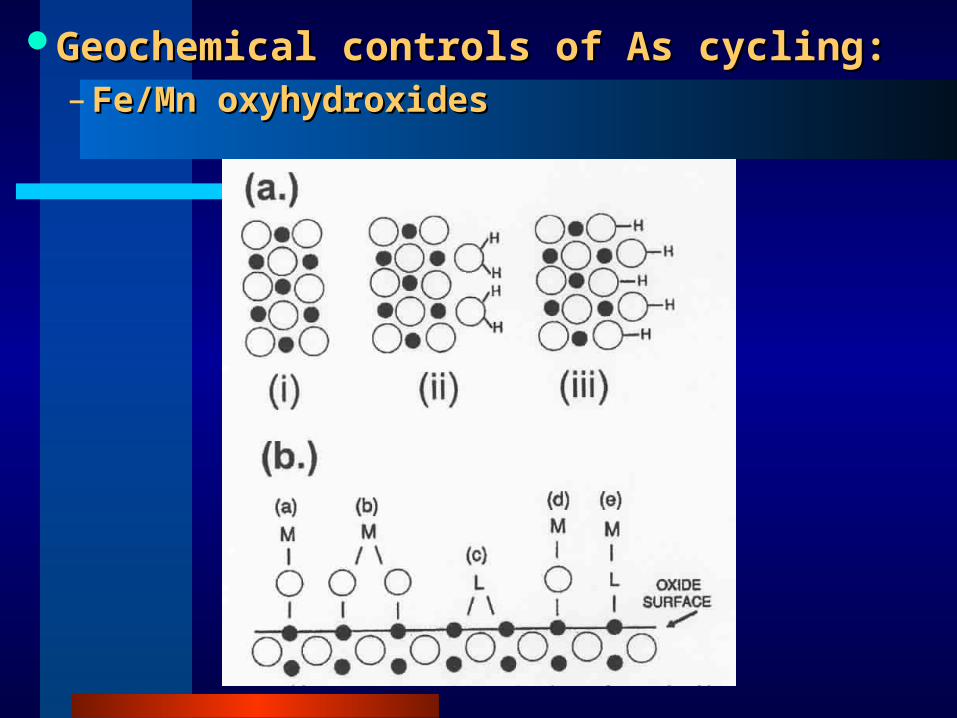
Geochemical controls of As cycling:Geochemical controls of As cycling:– Fe/Mn oxyhydroxidesFe/Mn oxyhydroxides
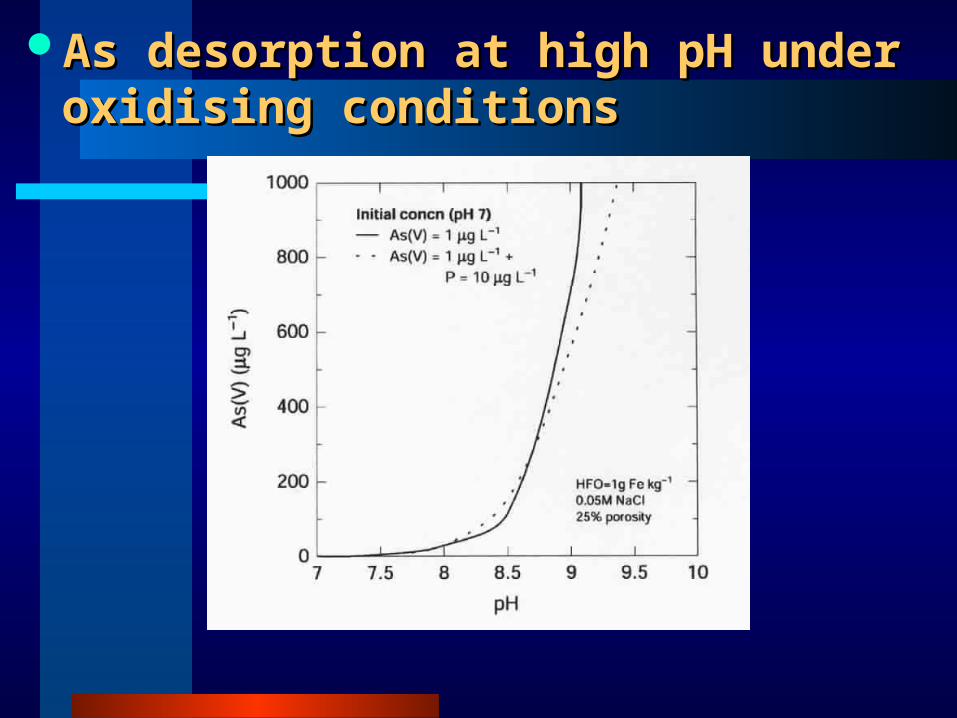
As desorption at high pH under As desorption at high pH under oxidising conditionsoxidising conditions

As desorption and dissolution due to As desorption and dissolution due to changes in reducing conditionschanges in reducing conditions

Tucson’s water rechargeTucson’s water recharge
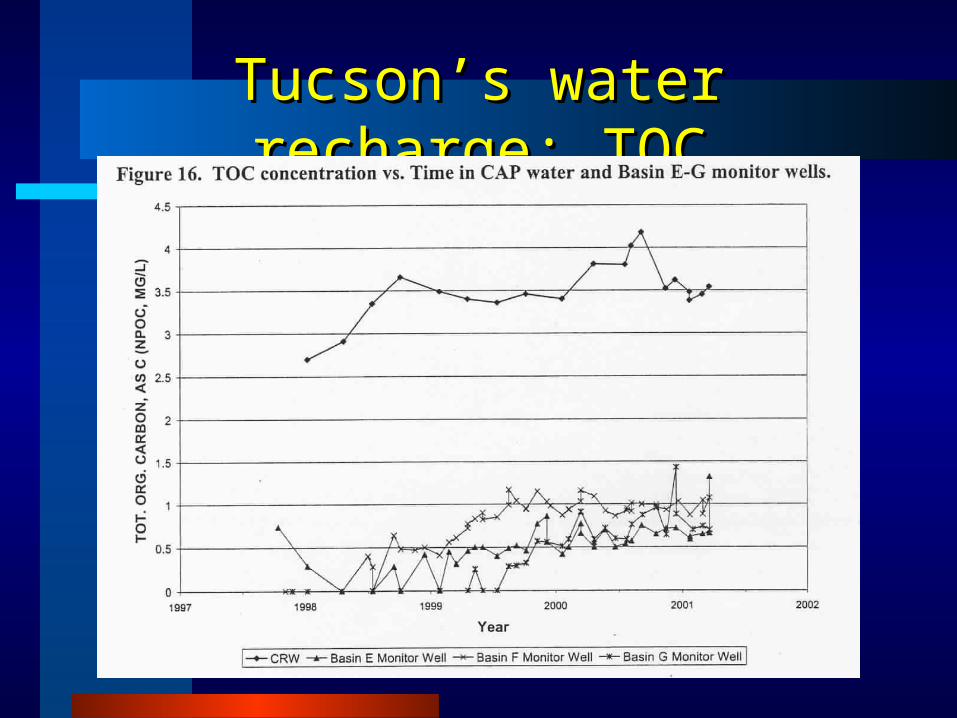
Tucson’s water recharge: TOCTucson’s water recharge: TOC
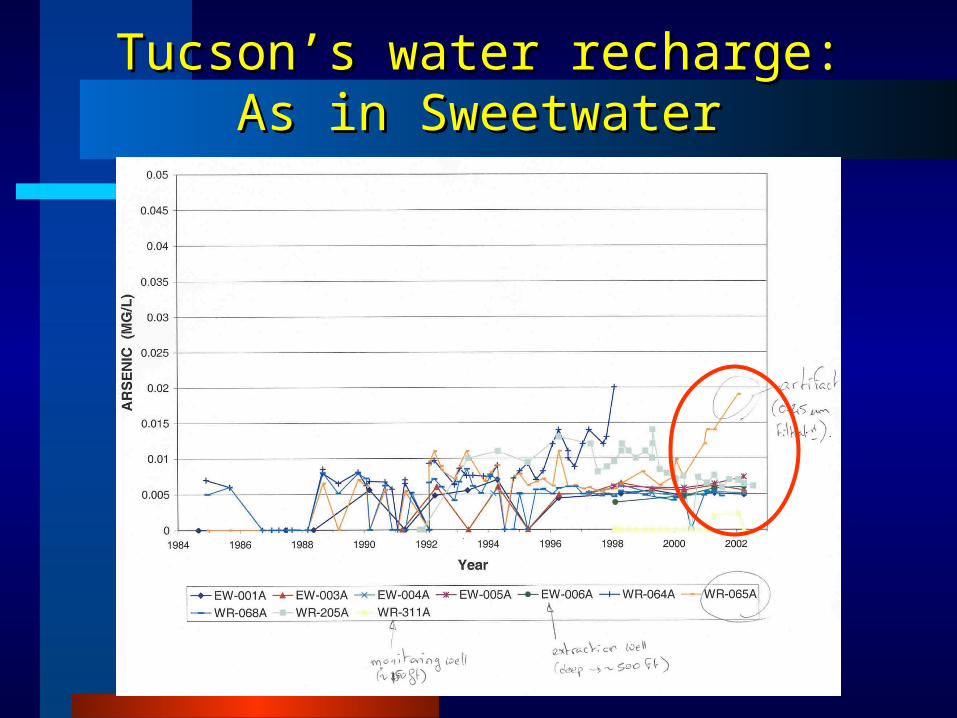
Tucson’s water recharge:Tucson’s water recharge:As in SweetwaterAs in Sweetwater
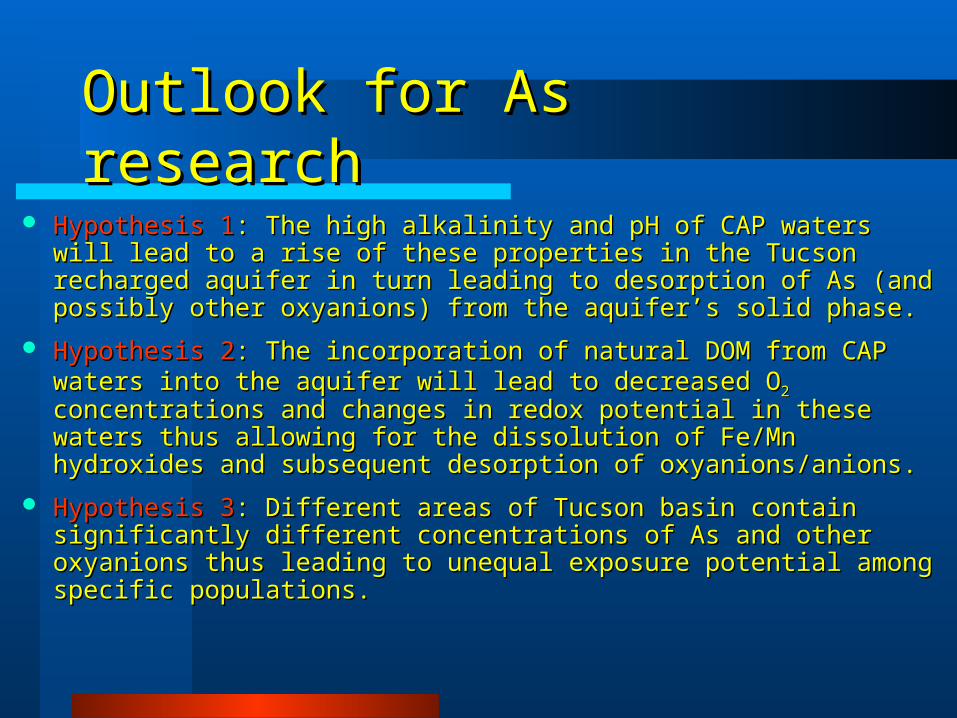
Outlook for As researchOutlook for As research
Hypothesis 1Hypothesis 1: The high alkalinity and pH of CAP waters will lead to : The high alkalinity and pH of CAP waters will lead to a rise of these properties in the Tucson recharged aquifer in turn a rise of these properties in the Tucson recharged aquifer in turn leading to desorption of As (and possibly other oxyanions) from the leading to desorption of As (and possibly other oxyanions) from the aquifer’s solid phase.aquifer’s solid phase.
Hypothesis 2Hypothesis 2: The incorporation of natural DOM from CAP waters : The incorporation of natural DOM from CAP waters into the aquifer will lead to decreased Ointo the aquifer will lead to decreased O22 concentrations and concentrations and changes in redox potential in these waters thus allowing for the changes in redox potential in these waters thus allowing for the dissolution of Fe/Mn hydroxides and subsequent desorption of dissolution of Fe/Mn hydroxides and subsequent desorption of oxyanions/anions.oxyanions/anions.
Hypothesis 3Hypothesis 3: Different areas of Tucson basin contain significantly : Different areas of Tucson basin contain significantly different concentrations of As and other oxyanions thus leading to different concentrations of As and other oxyanions thus leading to unequal exposure potential among specific populations.unequal exposure potential among specific populations.