names new president - ta instruments · new product introductions ar 550 rheometer the ar 550 is a...
TRANSCRIPT

S u m m e r 2 0 0 2
TECH Talk
Characterization of PolymorphicTransitions in a Pharmaceutical
Drug by DSC and MDSC®
L. C. Thomas
Crystalline compounds are generally
preferred in the development of new drug
formulations but a frequent problem is the
ability of the drug to exist in multiple
crystal forms termed polymorphs. Mr.
Thomas explains how DSC and MDSC
can be used to detect these species.Full Story
Featured Technical Articles
How Tzero™ Technology ImprovesDSC Performance
Part IV: MDSC® EnhancementR. Bruce Cassel
Modulated DSC (MDSC) has been the
most significant recent advancement in
materials characterization by thermal
analysis. Dr. Cassel shows how the advent
of Tzero Technology has led to significant
improvements in the efficiency of MDSC
experiments. Full Story
Rheological Characterization ofPressure Sensitive Adhesives
F. Mazzeo
Shear Resistance,
Tack and Peel
Strength describe
product perform-
ance in a pressure
sensitive adhesive
(PSA). Dr. Mazzeo
shows how these
properties are
directly related to
the PSA’s response
to the application of
stress and may be measured using
rheology. Full Story
Click here tosee promotion
New Products
New ProductBrochures
QuickStart e-Training Courses
New Staff atTA Instruments
Conferences &Exhibitions
FREE PostersRheology
Thermal Analysis
FREE PolymerReference Card
2002 Parts andAccessories Price Guide
Names New President

Tech TalkThis section will provide technical notes, helpful hints, service advice, and specific information on thermal analysis and
rheology instrumentation and use. The goal is to help you get the maximum value from your TA Instruments’ equipment.
Technical DocumentsAvailable for easy download is a thermal analysis application note entitled “ISO Thermal Methods”. This is a listing of
copyrighted standard methods available from the International Standards Organization and the American National
Standards Institute. A listing of the individual methods and titles is provided. (ISO Thermal Standards.pdf)
HINTSSome recommended ways of providing a vibration free surface for your measurement module include use of a) a granite
table; b) an air table; and c) a table based upon a magnetic repulsion principle (e.g. visit http://www.kineticsystems.com).
Where budgets do not permit this expense, the module can be placed on a suitably rigid and flat material supported by
several rubber stoppers placed at points to balance the stresses imposed by the mass of the module. These stoppers pro-
vide the vibration insulation and the flat material provides a stable platform upon which to operate.
Thanks to Keith Kociba (Lubrizol Corp.) for the original version of this Hint
In high sensitivity TGA experiments, where one is looking for a very small weight loss on a large sample, the buoyancy of
the sample may produce baseline drift as the sample is heated. This effect may be minimized through the use of
helium as a purge gas. The low helium density reduces the mass of the gas that is displaced by the sample. Additionally,
the high thermal conductivity of helium ensures rapid sample equilibrium to the furnace temperature.
HOME
REWARDS FOR HINTSThis HINTS section, with its suggestions on how to do better or easier thermal analysis and rheology, has proven to
be very popular. So we are looking for even more HINTS to pass along. Do you have one that you would like to offer?
Send it to us and if we use it, we’ll send to you a certificate worth $50 on your next purchase of supplies, services or
equipment. Send your hints to [email protected].

New Product Introductions
AR 550 RheometerThe AR 550 is a general-purpose rheometer that is ideal for applications where a robust, cost-effective instrument with
outstanding basic performance is required. Upgradeable and with many features of our more advanced models, the
AR 550 is well equipped to handle a wide variety of research or quality control applications for liquids, semi-solids and
polymers. The AR 550 replaces the AR 500 rheometer.
For information and technical specs (AR 550 Rheometer.pdf)
Advantage Thermal / Rheology Software TA Instruments has released the latest Advantage software (V 2.8.0). It will be provided with
all new system shipments and as a retrofit to all current Q Series™ Thermal Advantage
users. A summary of the main new features is outlined below.
Instrument Control
• Support for Q Series Photocalorimeter Accessory (PCA). Includes ability to work
at temperatures up to 250ºC (using quartz light guides); data collection rates as
fast as 0.05 seconds / point; ability to perform dual sample PCA and limited
MDSC / PCA studies.
• Support for the Q600 SDT.
• Support for the Q Series Pressure Cell.
• Support for DMA enhancements (low temperature heater control screens, ability to perform fiber clamp compliance
calibration, and support for submersion clamps).
• Tzero™ upgrades (heat / cool Tzero calibration).
• Saving data files to a network.
Data Analysis
• Supports export of graphs to “PDF” format.
• New (right click) pop-up options for improved curve labeling.
• Ability to overlay Mass Spectrometer and TGA weight loss data.
HOME

NEWBROCHURES –
Click on the cover to download abrochure
OVERVIEW
DMATGADSC
RHEOLOGY
Service Brochure
Applicable in U.S. Only
HOME
Training Brochure
Applicable in U.S. Only
New Brochures Summer 2002 8/1/02 3:30 PM Page 1

QuickStart e-Training Courses
QuickStart e-Training Courses are designed to teach a new user how to set up and run samples on their thermal
analyzer or rheometer. The 60-90 minute online courses are offered on a regular basis and cost $250. New system
purchases will include a waiver for one free class per instrument purchased. Typically, these courses should be
attended shortly after installation.
Individual courses cover our Q Series™ DSC, TGA, and DMA systems, the AR Series Rheometers, as well as
Universal Analysis (data analysis for thermal analysis systems). Attendees will receive the following:
• A basic understanding of the instrument
• Instructions on set-up, running, and analyzing data for a typical experiment
• Instructions on calibration, routine maintenance, and tips on sample preparation
• Instructions on using the extensive, built-in help system
As an introductory offer, register before August 30th and pay only $125 each for the Quickstart e-Training
Courses, a 50% discount! To take advantage of this offer, click on the registration link below and enter Coupon Code
“quickstart” (case sensitive). For more information, email [email protected].
Click Here To Register Now!
Theory & Applications Training Courses
The TA Instruments Thermal Analysis and Rheology training courses (lecture-based) are designed to familiarize the user
with applications, method development, and operating techniques of our thermal analysis and rheology instrumentation.
Each course is specific to a particular technique and costs $400 per person, per day. New system purchases will include
a waiver for one free class per instrument purchased. Typically, these courses should be attended within 3-6 months of
purchase and assume the customer knows how to operate the instruments.
To register visit www.tainst.com/support/training.html (U.S. only)
2002 U.S. COURSE SCHEDULEThermal Analysis and Rheology Training Courses
Monday Tuesday Wednesday Thursday Friday
TGA DSC MDSC DMA RheologyFebruary 18 February 19 February 20 February 21 February 22
TGA DSC MDSC DMAApril 15 April 16 April 17 April 18
DSC TGA DMA RheologyJune 10 June 11 June 12 June 13
TGA DSC MDSC DMAAugust 12 August 13 August 14 August 15
DSC TGA DMA RheologyOctober 7 October 8 October 9 October 10
TGA DSC MDSC DMA RHEOLOGYDecember 9 December 10 December 11 December 12 December 13
The TMA training course will be taught over the Internet in 2002.
TMA Part I TMA Part IISeptember 9 September 10 10:00 AM- 12:00 PM (Eastern Time)
More Information and Course Outlines
For information on training courses offered outside of the U.S., contact your local office.
www.tainst.com/contact/tadirectory.html HOME

New President of TA Instruments
We are pleased to announce the appointment of Dr. Robert L. Hassel as the new
company president – replacing Dr. P. Howard, who resigned for personal reasons. Bob is a
graduate of Elizabethtown College and the University of Delaware, and has a long and
distinguished career with TA Instruments. His experience in sales and marketing aspects
of the business, coupled with his extensive technical and operational knowledge will be
invaluable in his new assignment.
Bob has served in a number of diverse roles over his 28-year career with TA Instruments. Upon graduation in 1974, he
joined Du Pont Instruments as an applications chemist with later assignments in international and domestic sales. In 1990,
Bob became VP Market Communications for the newly divested TA Instruments. His experience has also included
positions in market research, product management, and most recently VP Research and Development.
New Staff at TA Instruments
TA Instruments continues to grow and add staff worldwide. Some of our new employees are detailed below.
Director of Research & Development
We are also pleased to announce that Jan Wenstrup has been promoted to Director,
Research & Development, replacing Dr. Hassel. Jan will assume responsibility for the
development of both thermal analysis and rheology products. Prior to his promotion,
Jan was Manager, Research & Development and had responsibility for the development of
the Q Series™ products. He graduated with a BSME from Villanova University, an
MSME from the University of Pennsylvania and has over 25 years of experience in key
engineering and management positions with several world leading companies in technical
product development.HOME

Conferences and Exhibitions
JAIMA 2002Meeting: September 4-6, 2002 – Makuhari Messe, Japan
For on-line information: Please visit www.jaima.or.jp/show/english/
TA Instruments will display our full line of Q Series™ thermal analysis and AR Series rheometers.
30th Annual Conference — North American Thermal Analysis SocietyConference: September 23-25, 2002 Short Course: September 21-22, 2002
Pittsburgh Marriott City Center, Pittsburgh, Pennsylvania
Register or join on-line: please visit www.natasinfo.org
For more information call: 916-922-7032
TA Instruments will have another strong presence at NATAS with 11 technical papers, a Tuesday (September 24)
lunchtime seminar, and a display of our latest Q Series thermal analyzers and AR Series rheometers. We invite you to
attend our papers and visit with us at our large booth.
ESTAC8 – 8th European Symposium on Thermal Analysis and CalorimetryESTAC8: August 25-29, 2002 – Barcelona, Spain
For further on-line information: Please visit http://harsnet.iqs.url.es/estac8/
TA Instruments will be a sponsor at ESTAC8, present four technical papers and display our Q Series
thermal analyzers. We invite you to attend our papers and visit with us at our booth.
74th Annual Meeting of The Society of Rheology Meeting: October 13-17, 2002 – Minneapolis Minnesota
For on-line information: Please visit www.societyofrheology.org
TA Instruments will again be a sponsor and display our AR Series rheometers. Please plan to visit our booth if you are
attending the meeting.
Additional EventsA listing of other national conferences / exhibitions being held during the 3Q / 4Q of 2002, where TA Instruments thermal
analysis and rheology equipment will be displayed:
HOME
2002 NORTH AMERICAN EVENT SCHEDULEDate Meeting Location
Aug. 19-21 ACS National Hynes Convention Center, Boston, MA
Oct. 2-4 National Printing Marco Island Marriott, Marco Island, FLInk Research Inst
Oct. 30 – Nov. 1 International Coatings Expo Morial Conv. Center, New Orleans, LA
Nov. 10-14 AAPS Annual Meeting Metro Toronto Convention Center, Toronto, Ontario, Canada
2002 EUROPEAN EVENT SCHEDULEDate Meeting Location Country
Sept. 1-6th Eurheo Erlangen Germany
Sept. 18-20 Gefta Bochum Germany
Sept. 25-27 Polymerwerkstoffe Halle Germany
Nov. 26 Thermische Analyse und Rheologie Dresden Germany
More Information: [email protected] [email protected] [email protected]
[email protected] [email protected] [email protected]
Conf and Exhib Summer 2002 8/14/02 9:38 AM Page 1

1 TA282
How Tzero Technology Improves DSC PerformancePart IV: MDSC Enhancement
R. Bruce CasselTA Instruments, 109 Lukens Drive, New Castle DE 19720
INTRODUCTION
The benefits of MDSC© are well known (1, 2). MDSC is used to improve theDSC analysis of glass transition, melting, crystallization and reaction phenomena. As apractical matter, it allows for the separation of overlapping processes, the measurement ofspecific heat capacity, thermoconductivity and enthalpy of physical aging. It has beenthe subject of numerous symposia, and it is said to be the most important advance inthermal analysis of the last 30 years (3). When using MDSC, typical heating rates are3 °C/min or less. Faster heating rates are now possible with the Q Series differentialscanning calorimeters that incorporate Tzero Technology (Q100) or Advanced TzeroTechnology (Q1000). To understand the improvements, we need to understand MDSC.
MDSC Utility
Differential scanning calorimetry is used to characterize the thermal behavior ofmaterials. This thermal behavior consists in 1) how much energy is required to heat thematerial (e.g., its heat capacity), 2) the characterization of thermodynamic transitions,such as melting; and 3) the characterization of thermally induced kinetic processes suchas cross linking reactions. Unfortunately, in multiple component systems there are oftenmultiple processes overlapping one another. For example, polymers undergo softeningover a glass transition temperature range. Over this interval not only does the specificheat capacity increase, but also there may be enthalpic relaxation related to thermalhistory, mechanical stress relief, a loss of volatile components and/or partialcrystallization. All these effects involve the release or adsorption of energy, and so affectthe DSC curve. Without further information, most of these effects are not separable, andthey therefore produce uncertainty in the quantitation of the thermal process.
MDSC Separations
MDSC produces two DSC experiments at once: a constant, underlying rate ofincrease in temperature, and a small amplitude temperature modulation. Volatilization,crystallization, stress relief, and chemical reactions proceed at a rate determined by theabsolute (underlying) temperature. A small change in temperature caused by themodulations hardly changes the rate of these kinetically controlled processes. Specificheat capacity and melting, however, are quite different. Their DSC response isproportional to the amplitude of the modulation. From deconvolution of the data from asingle MDSC experiment three analytical curves are produced: the total heat flow, whichwould have been obtained without the modulation; the reversing heat flow, which

2 TA282
quantifies specific heat capacity and melting; and the non-reversing heat flow, which isthe purely kinetic component. Hundreds of technical papers have been publishedshowing how to use this technique to separate the thermal processes in a wide range ofmaterials.
MDSC Limitations
The challenge for MDSC is the need for heat capacity calibration that isdependent on the experimental conditions, especially on the frequency of modulation.Typically, a modulation period of 60 seconds is recommended. The second challenge isthe necessary to have a minimum of 4-6 complete cycles across a transition. This meansthat when the sample material’s specific heat capacity is changing rapidly withtemperature (e.g., in a transition or reaction),it is necessary to use a very low underlyingheating rate. As a result, underlying heatingrates of 3 ºC/min, or less are common. Thisresults in a long test time for MDSCmethods.
TzeroTM Technology and MDSC©
The new Q Series DSC cell designdramatically changes MDSC analysis. Anew To thermocouple separates the sampleand reference positions and also is used tocontrol the furnace. This thermocouple canbe seen in figure 1 midway between thesample and reference platforms. Thiseffectively isolates the sample and referenceheat flows and allows a simple thermalmodel for the cell to be utilized (4). Aspecial calibration procedure is used to determine the thermal resistances andcapacitances in the new DSC cell. By incorporating the detailed cell description into theMDSC equations, the cell response to the modulation is addressed. Thus, by using theTzero technology MDSC equations, thefrequency dependence of the MDSCcalibration curve is dramaticallyreduced. The practical benefit is thatfaster periods (40 s) and therefore fasterheating rates (up to 5 °C/min) canbe used resulting in a 40 %improvement in sample throughput forMDSC methods. Tzero technology isrequired to obtain this benefit and comesstandard with the Q100 DSC.
Advanced Tzero Technology
In an extension of this approach, the thermal resistances and capacitances of thesample and reference pans are also incorporated into the heat flow equations. Thisfurther enhancement to the heat flow relationships is referred to as Advanced Tzero
Figure 1 - Cutaway of the Qseries DSCCell Design
Figure 2 - MDSC Calibration Factor
0 10 20 30 40 50 60 70 80 90
Period (sec)
0.5
1.0
1.5
2.0
2.5
3.0
3.5
4.0
Hea
t C
apac
ity
Cal
ibra
tion
Fac
tor
2920 MDSCTzero MDSCAdvanced Tzero MDSC

3 TA282
Technology (5). By compensating for all the resistance-capacitance lags in the system,Advanced Tzero Technology accounts for virtually all the instrumental effects. Theresult for ordinary DSC is unprecedented resolution (6), and the ability to obtain specificheat capacity data from a single DSC scan (7). For MDSC, this results in a calibrationcurve that is virtually independent of modulation frequency (see figure 2) permittingmodulation periods down to 20 seconds to be used without incurring substantialcalibration error. As a result of using the shorter period, underlying heating rates of up to10 ºC/min may be used for many applications. As an example, the glass transitionanalysis of polystyrene in figure 3.
Benefits of Advanced Tzero MDSC
The advantages of using Advanced Tzero technology for MDSC are several. First,the use of an underlying rate of 10 ºC/min reduces experimental time to only one-thirdthe time of traditional MDSC. This means that an MDSC experiment can be carried outin nearly the same amount of time asa standard DSC experiment. Second,signal strength in standard DSC isproportional to heating rate, while inmodulated DSC signal strength isproportional to frequency. So, byincreasing both the underlying rateand the frequency of oscillation, bothcomponents of the MDSCexperiment are amplified. The resultis higher sensitivity withoutsacrificing Cp accuracy. The result isaccurate Cp data, and on a separatecurve, quantitative analysis of kineticevents.
CONCLUSION
MDSC is a proven aid tounderstanding material behavior witha large body of literature from whichto draw when selecting methodparameters. The productivity and sensitivity of MDSC experiments is improved throughthe use of Tzero (Q100) and Advanced Tzero Technology (Q1000).
REFERENCES
1. Material Characterization by Dynamic and Modulated Thermal AnalyticalTechniques, A.T. Riga and L. Judovits (Eds.), American Society for Testing andMaterials, West Conshohocken, PA, Special Technical Publication 1402, 2001.
2. Modulated DSC is a high performance version traditional DSC in which asinusoidal temperature profile in superimposed upon the traditional linear heatingrate or isothermal operation. Fourier transformation of the resulting oscillatoryseparates the total heat flow into its reversing and nonreversing component parts.
3. B. Wunderlich, Y. Jin, and A. Boller, “Mathematical Description of DifferentialScanning Calorimetry Based on Periodic Temperature Modulation”,Thermochimica Acta, 1994, 238, pp. 277-293.
Figure 3 - Accurate Cp of Polystyrene byMDSC using 20 s period and 10 ºC/min
Polystyrene Beads9.67 mg at 10cpm+/- 0.2c and 20 sec.
1.4
1.6
1.8
2.0
2.2
2.4H
eat
Cap
acit
y (J
/g/°
C)
95 100 105 110 115 120Temperature (°C)
Universal V3.1B TA Instrumen

4 TA282
4. R. L. Danley and P. A. Caulfield, “DSC Baseline Improvements Obtained by aNew Heat Flow Measurement Technique”, Proceedings of the 29th Conference ofthe North American Thermal Analysis Society, 2001, pp. 667-672.
5. R. L. Danley and P. A. Caulfield, “DSC Resolution and Dynamic ResponseImprovements Obtained by a New Heat Flow Measurement Technique”,Proceedings of the 29th Conference of the North American Thermal AnalysisSociety, 2001, pp. 673-678.
6. R. B. Cassel, “How Tzero Technology Improves DSC Performance, Part II:Peak Shape and Resolution”, TA Instruments Applications Brief TA298.
7. R. B. Cassel, “How Tzero Technology Improves DSC Performance, Part III:The Measurement of Specific Heat Capacity”, TA Instruments Applications BriefTA299.
KEYWORDS
modulated differential scanning calorimetry
1 TA265
Characterization of Pressure Sensitive Adhesives by Rheology
Fred A. Mazzeo, Ph.D.TA Instruments, 109 Lukens Drive, New Castle, DE, USA
ABSTRACT
Three properties, shear resistance, tack and peel strength, generallycharacterized pressure sensitive adhesives (PSA). These properties are directlyrelated to the PSA’s response to the application of stress and may be measuredusing rheology. For example, tack describes the ability to spontaneously form abond to another material under light pressures within a short application time. Asthe contact time increases, higher shear resistance and peel strength properties(related to a materials long time flow behavior) are found. A single rheologicaltest is described to directly determine the response of a PSA to varyingdeformation times, related directly to its shear resistance, tack and peel strengthbehavior.
INTRODUCTION
An adhesive is usually a polymeric material applied between two solid layers thatform a bond with cohesive strength (1). Most adhesives exhibit viscoelastic behavior.Rheology, using small amplitude oscillations, may be used to test adhesives throughoutthe whole viscoelastic profile. Applying small amplitudes causes the shear stress to beproportional to the shear strain, a necessary condition for linear viscoelasticity. In linearviscoelasticity, the dynamic modulus (G[ω]) is the ratio of shear stress to shear strain andis independent of the shear amplitude. Dynamic modulus may be separated into elastic(storage) modulus (G’) and the viscous (loss) modulus (G”). The ratio of the G” to G’ isequal to the tangent of the phase angle between them: tan δ = G”/G’.
The ability to form a bond and resist debonding from a substrate determines howappropriate a particular PSA is for a certain application. Oscillatory frequency sweepsare well suited for characterizing the bonding and debonding behavior of a PSA. In anoscillatory frequency sweep, a constant sinusoidal amplitude is applied to a material,within the linear viscoelastic region, while varying the frequency of the oscillation. Lowrates of deformation (i.e., low frequency) characterize the bond formation, while highfrequency (i.e., high rates of deformation) is used to characterize debonding behavior.The latter describes a materials shear resistance and the former relates to PSA’s tack andpeel strength. Chiu describes how the modulus values at high frequency are related topeel or quick stick tests, and at low frequencies, to shear resistance of adhesives (2).
Further information can be obtained by using the Cox-Merz rule (3) to predictshear viscosity ( )(γη & ) from oscillatory frequency sweep measurements. The Cox-Merzrule is an empirical relationship that describes the relationship between the steady stateshear viscosity (plotted against shear rate), and the magnitude of the complex viscosity

2 TA265
(plotted against angular frequency). The complex viscosity, |η*|, is defined by |η*| =|G*| / ω where G* is the complex modulus and ω is the angular frequency.
Table 1 shows a summary of the rheological properties that indicate specificadhesive behavior using dynamic mechanical properties. Pressure sensitive adhesives andother polymeric materials (because of their viscoelastic nature) exhibit temperature andtime (frequency) dependent behavior during deformation and flow. Such data can betreated using time-temperature superposition (TTS) theory, overcoming the difficulty ofextrapolating limited laboratory tests at shorter times to longer term, more real world,conditions. TTS treatment is well grounded in theory (4, 5, 6) and may be applied to therheology data obtained from oscillation experiments. The underlying basis fortime/temperature super-positioning are (a) that the processes involved in molecularrelaxation or rearrangements in viscoelastic materials occur at accelerated rates at highertemperatures and (b) that there is a direct equivalency between time the stress is applied(the frequency of measurement) and temperature. Thus, oscillatory frequency sweepsare commonly used. The time over which these processes occur can be reduced byconducting the measurement at elevated temperatures and shifting the resultant data tolower temperatures. The result of this shifting is a "master curve" where the materialproperty of interest at a specific end-use temperature can be predicted over a broadtime/frequency scale.
Table 1 – Viscoelastic Properties Related to PSA Characteristics
Tack –Low tan δ peak and Low G’–Low cross-links (G”>G’) @ ~ 1 Hz⇒ High tack
Shearresistance
–High G’ modulus @ low frequencies <0.1 Hz–High Viscosity at low shear rates⇒ High shear resistance
PeelStrength
–High G” @ higher frequencies (~>100 Hz)⇒ High peel strength
CohesiveStrength
–High G’ and low tan δ⇒ High cohesive strength (Bulk property)
AdhesiveStrength
–High G” and high tan δ⇒ High adhesion strength with surface
EXPERIMENTAL
For illustrative purposes, three examples of hot melt, pressure sensitive adhesivesare characterized using an AR2000 Advanced Rheometer.
Sample A: high cohesive strength, low tack properties, moderate peel strength,possible low temperature adhesive
Sample B: lower cohesive strength, higher tack, lower viscosity, low shearresistance compared to A
Sample C: lower tack, higher cohesive strength, lower peel strength, lower shearresistance compared to A
The Smart Swap Parallel Plate temperature stage with 8 mm plates is used inconjunction with the Environmental Test Chamber to control the temperature from the

3 TA265
glassy to the terminal region of each sample. Oscillatory frequency sweeps areconducted at different isothermal temperatures, ranging from –100 to 130 °C, steppingevery 10 °C for each frequency sweep. The range of frequencies is 0.1 to 100 Hz at anoscillation amplitude of 0.025 % strain. The normal force is controlled to account for thethermal expansion of the sample throughout the test.
RESULTS AND DISCUSSION
The modulus values in the frequency range of 0.1 to 100 Hz describe the wettingand creep behavior of PSA’s. When the modulus becomes too large, the ability to wetthe substrate reduces (2). The unshifted TTS profile for sample A is shown in Figure 1and the TTS master curve for A and B at 20 °C is shown in Figure 2. In the frequencyrange of 0.1 to 100 Hz of Figure 2, sample A possesses a higher G’ and a lower tan δvalue than B, indicating that the PSA has a higher cohesive strength or low creepcompliance. Sample B exhibits a lower G’ and a higher tan δ value than A. The lowermodulus value indicates that the adhesive will deform more easily when in contact withthe substrate.
For tack enhancement, tan δ should be greater than unity within the frequencyrange 0.1 to 100 Hz. That is, G” is greater than G’ indicating that the polymer dissipatesenergy through its own deformation. This allows the material to adhere and easily formgood contact to the substrate. In Figure 2, tan δ for both samples A and B are greaterthan unity within the 0.1 to 100 Hz frequency range. Also, B is greater than A in thisrange showing that it has greater tack properties. This correlated well with the supplier’sobservations.
20 1Log [frequency (Hz)]
9
2
3
4
5
6
7
8
Log
[G' (
Pa)]
TTS step at -90.0 °CTTS step at -80.0 °CTTS step at -70.0 °CTTS step at -60.0 °CTTS step at -50.0 °CTTS step at -40.0 °CTTS step at -30.0 °CTTS step at -20.0 °CTTS step at -10.0 °CTTS step at 0 °CTTS step at 10.0 °CTTS step at 20.0 °CTTS step at 30.0 °CTTS step at 40.0 °CTTS step at 50.0 °CTTS step at 60.0 °CTTS step at 70.0 °CTTS step at 80.0 °CTTS step at 90.0 °CTTS step at 100.0 °CTTS step at 110.0 °CTTS step at 120.0 °CTTS step at 130.0 °C
Figure 1 – Raw Data

4 TA265
16-8 -7 -6 -5 -4 -3 -2 -1 0 1 2 3 4 5 6 7 8 9 10 11 12 13 14 15Log [frequency (Hz)]
10
-1
0
1
2
3
4
5
6
7
8
9
Log
[G' (
Pa)]
3
-3
-2
-1
0
1
2
Log [tan(delta)]
AB
Master Curve at 20°C
Figure 2 – TTS Master Curves (Samples A and B)
Rheological information at high frequency is related to the peel strength of thematerials. These rheological behaviors for samples A and B indicate that similar peelstrength properties should exist. The low frequency information (<0.1 Hz) shows thatsample B drops off in properties faster than sample A, directly related to its observed lowshear resistance behavior.
Figure 3 shows the master curves at 20 °C of samples A and B after beingtransformed to steady shear via the Cox-Merz rule. At lower shear rates, sample B haslower viscosities than sample A, correlating to their observed behavior. As the shear rateincreases, both samples converge to have the same profile, as is expected.
9-6 -5 -4 -3 -2 -1 0 1 2 3 4 5 6 7 8Log [shear rate (1/s)]
8
0
1
2
3
4
5
6
7
Log
[vis
cosi
ty (P
a.s)
]
Master Curve @ 20°CViscosity via Cox-Merz rule
AB
Figure 3 – TTS Master Curves with Steady Shear Treatment (Samples A and B)
Another way to analyze the information from Figure 1 is to convert therheological information verses frequency to that verses temperature. This is shown inFigure 4 and 5. The spread in the curves shows the dependence of the rheological

5 TA265
properties with frequency. Each set of connected data points represents G’ as it changeswith temperature at a fixed frequency of 0.1 to 100 Hz.
Low temperature limit for an adhesive is indicated by the glass transition. Figure4 shows that the elastic modulus, G’, within the glassy region (i.e., the transition near0 °C) is independent of frequency, as expected. As the temperature is increased, a largedependence on frequency is seen during the glass transition region and into the terminalregion. Taking the peak of tan δ to represent the glass transition temperature (Figure 5),a value of Tg at 15 °C is observed indicating that sample A is not suitable for lowtemperature applications.
150.0-100.0 -75.0 -50.0 -25.0 0 25.0 50.0 75.0 100.0 125.0temperature (°C)
10
1
2
3
4
5
6
7
8
9
Log
[G' (
Pa)]
AB
Figure 4 – Temperature Dependence of Modulus (Sample A and B)
150.0-100.0 -75.0 -50.0 -25.0 0 25.0 50.0 75.0 100.0 125.0temperature (°C)
2
-3
-2
-1
0
1
Log
[tan(
delta
)]
AB
Figure 5 – Temperature Dependence of Phase Angle (Sample A and B)
Sample C exhibits high cohesive strength, low shear resistance and low viscosity.In Figure 6 sample C is compared to sample A showing similar values for modulus and alower tan δ value over a broad range of frequency. This indicates that the cohesive

6 TA265
strength of sample C out performs that of sample A. The low shear resistance and thelow viscosity behaviors are observed in Figures 6 and 7. Figure 6 shows that the terminalregion for sample C begins at higher frequencies compared to sample A at referencetemperature of 20 °C, indicating a lower shear resistance. After converting theoscillatory information to steady flow by the Cox-Merz rule, shown in Figure 7, theviscosity profile of C is found to have a lower overall behavior, as described by thesupplier. Temperature sweeps, in Figure 8, indicate that the Tg occurs at about –10 °C,making this material more suitable for low temperature applications, compared tosamples A and B.
17-8 -7 -6 -5 -4 -3 -2 -1 0 1 2 3 4 5 6 7 8 9 10 11 12 13 14 15 16Log [frequency (Hz)]
10
-1
0
1
2
3
4
5
6
7
8
9
Log
[G' (
Pa)]
3
-3
-2
-1
0
1
2
Log [tan(delta)]
Master Curve at 20°C
AC
Figure 6 – TTS Master Curve (Sample A and C)
9-6 -5 -4 -3 -2 -1 0 1 2 3 4 5 6 7 8Log [shear rate (1/s)]
8
0
1
2
3
4
5
6
7
Log
[vis
cosi
ty (P
a.s)
]
Master Curve @ 20°CViscosity via Cox-Merz rule
AC
Figure 7 – TTS Master Curves with Steady Shear Treatment (Sample A and C)

7 TA265
150.0-100.0 -75.0 -50.0 -25.0 0 25.0 50.0 75.0 100.0 125.0temperature (°C)
1
-3
-2
-1
0
Log
[tan(
delta
)]
1
1
1
11
1
11
1
1
1
1
1
1
1
1
1
1
1
11111111
1
1
1
1
1
1
1
1 A1 C
Figure 8 – Temperature Dependence of Phase Angle (Sample A and C)
Another powerful TTS technique is to determine the overall behavior of amaterial at a different reference temperature; by shifting the multiple frequency sweeps,shown in Figure 1, to another reference temperature and overlaying the profiles. This isvaluable in determining the best working temperature of a material to yield specificrheological behavior. By changing the reference from 20 to 50 °C for sample A, inFigure 9, the properties of peel strength for sample A is similar to sample C, while theproperties of shear resistance and tack are drastically reduced.
17-6 -5 -4 -3 -2 -1 0 1 2 3 4 5 6 7 8 9 10 11 12 13 14 15 16Log [frequency (Hz)]
10
2
3
4
5
6
7
8
9
Log
[G' (
Pa)]
1
-3
-2
-1
0
Log [tan(delta)]
A @ 20°CA @ 50°CC @ 20°C
Figure 9 – TTS Master Curves Referenced to 50 °C
8 TA265
SUMMARY
The rheological behavior of three different pressure sensitive adhesives is wellcharacterized using rheometry and successful correlations to describe PSA behavior areshown. All of the results for each PSA were determined by using one Time-Temperature-Superposition (TTS) procedure. Since all the information is collected froma single test, time and cost savings for the end user is tremendous. From this test, theinformation was easily transformed using TTS theory and Cox-Merz rule.
REFERENCES
1. I.. Krieger, and L-H. Lee, Lieng-Huang (Eds.), “Flow Properties of Adhesives”,Adhesive Bonding, Plenum Publishing, 1991, pp. 31-45
2. S. G. Chu, L-H. Lee, (Eds.), “Dynamic Mechanical Properties of PressureSensitive Adhesives”, Adhesive Bonding, Plenum Publishing, 1991, pp. 97-115
3. W. P. Cox and E. H. Merz, Journal of Polymer Science, 1958, 28, p. 6194. A. V. Tobolsky, Properties and Structures of Polymers, Wiley, New York, 19605. J. D. Ferry, Viscoelastic Properties of Polymers, 3rd ed., Wiley, New York, 19806. M. L. Williams, R. F. Landel, and J. D. Ferry, Journal of the American Chemical
Society, 1955, 77, p. 3701
KEYWORDS
adhesives, flow properties, glass transition, thermoplastic polymers, rheology,viscosity

1
Characterization of Polymorphic Transitions in a Pharmaceutical Drug byDSC and MDSC®
Leonard C. Thomas, TA Instruments � Waters LLC109 Lukens Drive, New Castle, DE 19720
BACKGROUNDBecause crystalline drugs generally have better storage stability,
Pharmaceutical companies prefer to use crystalline compounds for developmentof new drug formulations. However, a frequent problem encountered is theability of the drug to exist in multiple crystal forms called polymorphs. Sincepolymorphs can have significantly different physical properties such asdissolution rate and therefore bioavailability, it is important to control bothconcentration and crystal form.
DETAILSDSC and MDSC® are often used to detect polymorphic forms because
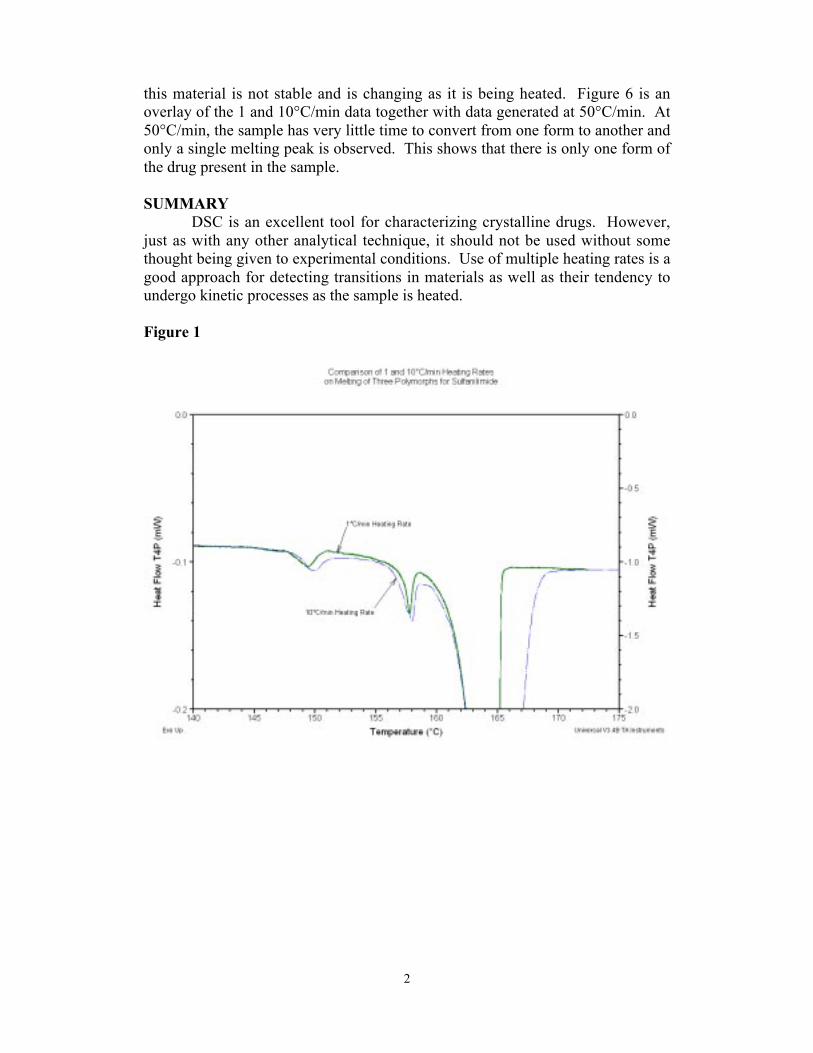
they typically have different melting points and heats of fusion. The threecrystalline forms of Sulfanilimide are seen in Figure 1 at heating rates of 1 and10ºC/min. As seen in the data, heating rate has no significant effect on the meltingpeaks except for the width of the largest peak near 165ºC. This shows that thesample is quite stable and there is little tendency for one polymorph to transforminto another.
Use of multiple heating rates is an excellent way to detect kinetic eventssuch as decomposition or transformation of one crystalline form into another.This can be seen from the data in Figures 2 and 3 that show the effect of heatingrate on two different drugs, Phenacetin and Ciprofloxacin Hydrochloride (Cipro).At high heating rates (20°C/min) the melting peak of Phenacetin is broader butonly about 0.3°C higher than the melt observed at 1°C/min. This small differenceindicates that the sample is truly melting and there are no observed kinetic events.
Cipro behaves quite differently when the heating rate is increased from 1to 20°C/min. According to the Material Safety Data Sheet for Cipro, it is said todecompose upon melting. If a single heating rate is used, such as seen in the5°C/min data, it could easily be interpreted as melting at 319°C followed bydecomposition. However, this would be wrong. The difference of 29°C betweenthe observed �melting� endotherms for the 1 and 20°C/min data shows that theendotherm is really part of the decomposition process and not due to melting.
The value of using multiple heating rates for characterizing crystallinedrugs that have the ability to exist in several polymorphic forms is seen in Figures4 � 6. At 10°C/min heating rate (Figure 4), there appear to be two melting peaksat 155 and 161°C and it might be interpreted that both forms exist in the originalsample. At 1°C/min (Figure 5), the peaks at 155 and 161°C still exist but theyhave a very different size ratio and an additional peak is seen at 175°C. Clearly,
2
this material is not stable and is changing as it is being heated. Figure 6 is anoverlay of the 1 and 10°C/min data together with data generated at 50°C/min. At50°C/min, the sample has very little time to convert from one form to another andonly a single melting peak is observed. This shows that there is only one form ofthe drug present in the sample.
SUMMARYDSC is an excellent tool for characterizing crystalline drugs. However,
just as with any other analytical technique, it should not be used without somethought being given to experimental conditions. Use of multiple heating rates is agood approach for detecting transitions in materials as well as their tendency toundergo kinetic processes as the sample is heated.
Figure 1

3
Figure 2
Figure 3

4
Figure 4
Figure 5

5
Figure 6

1 TN 46
THERMAL APPLICATIONS NOTEISO THERMAL METHODS
TA Instruments, 109 Lukens Drive, New Castle DE 19720
All methods are copyrighted, and available from theInternational Standards Organization (ISO):
International Standards Organization1, rue de Varembe
Case postale 56CH-1211 Geneve 20
SWITZERLANDFax: +41-22-734-10-79
American National Standards Institute11 West 42nd Street
13th FloorNew York, NY 10036
USATel: (212) 642-4900
METHOD TITLE
6721-1:1994 Determination of dynamic mechanical properties - Generalprinciples
6721-4:1994 Determination of dynamic mechanical properties - Tensile vibration - Non-resonance method
6271-11:2000 Determination of dynamic mechanical properties - Glass transitiontemperature
7111:1987 Thermogravimetry of polymers - Temperature scanning method
9924-1:1993 Determination of the composition of vulcanizates and uncured compounds by thermogravimetry
11358:1996 Thermogravimetry of polymers - General principles11357-1:1997 Differential scanning calorimetry - General principles11357-2:1996 Differential scanning calorimetry - Determination of glass
transition temperature11357-3:1996 Differential scanning calorimetry - Determination of temperature
and enthalpy of melting and crystallization11357-4:2000 Differential scanning calorimetry - Determination of specific heat
capacity

2 TN 46
11357-5:1998 Differential scanning calorimetry - Determination of reactiontemperatures, reaction times, heats of reaction and degreesof conversion
11357-6:2000 Differential scanning calorimetry - Determination of oxidationinduction time
11357-7:2000 Differential scanning calorimetry - Determination of crystallizationkinetics
11357-8:2000 Differential scanning calorimetry - Determination of amount of bound water sorbed by polymers
11358-1:1996 Thermogravimetry - General principles11358-2:2000 Thermogravimetry - Determination of kinetic parameters11369-1:1999 Thermomechanical analysis - General principles11369-2:1999 Thermomechanical analysis - Determination of coefficient of
linear thermal expansion and glass transition temperature11369-3:1997 Thermomechanical analysis - Determination of penetration
temperature
iso01.doc(Rev. 11-15-00)
TA Instruments
United States, 109 Lukens Drive , New Castle, DE 19720Phone: 1-302-427-4000 • Fax: 1-302-427-4001 • E-mail: [email protected] United Kingdom • Phone: 44-1-372-360363 • Fax: 44-1-372-360135 • E-mail: [email protected]
Spain • Phone: 34-93-600-9300 • Fax: 34-93-325-9896 • E-mail: [email protected]
Belgium/Luxembourg • Phone: 32-2-706-0080 • Fax: 32-2-706-0081 • E-mail: [email protected]
Netherlands • Phone: 31-76-508-7270 • Fax: 31-76-508-7280 • E-mail: [email protected]
Germany • Phone: 49-6023-9647-0 • Fax: 49-6023-96477-7 • E-mail: [email protected]
France • Phone: 33-1-304-89460 • Fax: 33-1-304-89451 • E-mail: [email protected]
Italy • Phone: 39-02-27421-283 • Fax: 39-02-2501-827 • E-mail: [email protected]
Sweden/Norway • Phone: 46-8-594-69-200 • Fax: 46-8-594-69-209 • E-mail: [email protected]
Japan • Phone: 813 5479 8418)• Fax: 813 5479 7488 • E-mail: [email protected]
Australia • Phone: 613 9553 0813 • Fax: 61 3 9553 0813 • E-mail: [email protected]
To contact your local TA Instruments representative visit our website at www.tainst.com

TA Instruments • 109 Lukens Drive, New Castle, DE 19720 telephone 302.427.4000 • facsimile 302.427.4001 • email [email protected] • www.tainst.com
AR 550 RHEOMETER
The AR 550 is a general-purpose rheometer that is ideal for applications where arobust, cost-effective instrument with outstanding basic performance is required.Upgradeable and with many features of our more advanced models, the AR 550 iswell equipped to handle a wide variety of research or quality control applications forliquids, semi-solids and polymers. The AR 550 replaces the AR 500 rheometer.
A controlled stress rheometer is only as good as its ability to apply torque and measure displacement. The AR 550 drive system features a low inertia, non-contactmotor that delivers smooth torque over a wide operating range. This allows the studyof a broad variety of materials from low viscosity fluids to polymer melts. The AR 550’s long-life jet style air bearings provide frictionless support of the drive shaftand measuring geometry. It also uses a proprietary optical encoder to measure smallangular deflections with high resolution.
A high-sensitivity, temperature-isolated Normal Force Transducer is available for the AR 550. Located below the sample plate, it directly and quantitatively measures a wide variety of normal forces exerted by samples with nochange in gap. It is also commonly used to monitor normal forces generated during sample loading and to track normal force changes during flow experiments.
The AR 550 also incorporates the following performance and reliability enhancing features:
• A new ball slide, gearbox and motor assembly
• A new wide range Peltier plate for temperature control
• New advanced electronics
• Auto Gap Set
• Rigid one-piece aluminum casting
TEMPERATURE CONTROL SYSTEMS• Peltier Plate – the most commonly used temperature control system. It has a range of –10 to 150 ºC,
an accuracy of +/- 0.1 ºC, and typical heating rates of 20 ºC per minute.
• Concentric Cylinder system – used for low viscosity samples and those with large particles and / or limited stability. The fluid jacket temperature system provides precise temperature control from -10 to 150 ºC.
• Environmental Test Chamber – used mainly for elevated temperature analysis of polymeric materials. The ETCprovides controlled convection / radiant heating and cooling (LN2) over the range from –150 to 400 ºC, with heating rates to 15 ºC per minute.
• Extended Temperature Module – ideal for analyzing the isothermal cure of thermosetting materials. The ETM provides rapid heating / cooling (up to 120 ºC / min) with precise temperature control from –100 to 400 ºC.
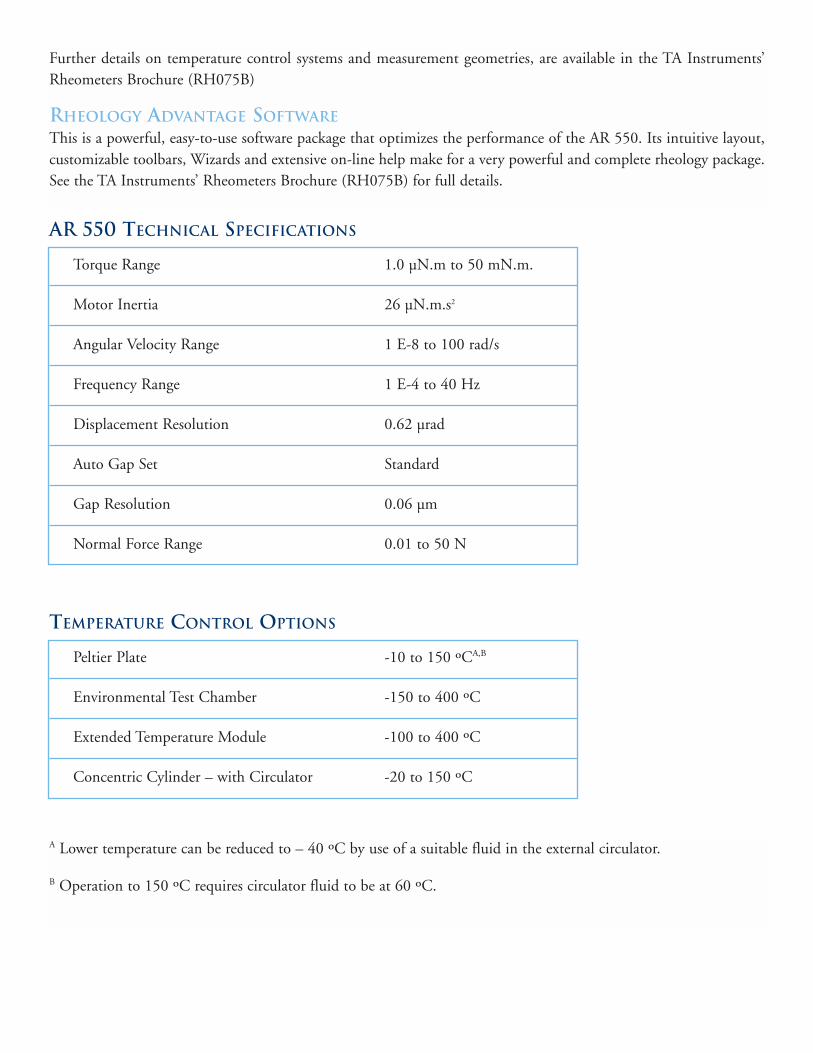
Further details on temperature control systems and measurement geometries, are available in the TA Instruments’Rheometers Brochure (RH075B)
RHEOLOGY ADVANTAGE SOFTWAREThis is a powerful, easy-to-use software package that optimizes the performance of the AR 550. Its intuitive layout,customizable toolbars, Wizards and extensive on-line help make for a very powerful and complete rheology package.See the TA Instruments’ Rheometers Brochure (RH075B) for full details.
AR 550 TECHNICAL SPECIFICATIONS
Torque Range 1.0 µN.m to 50 mN.m.
Motor Inertia 26 µN.m.s2
Angular Velocity Range 1 E-8 to 100 rad/s
Frequency Range 1 E-4 to 40 Hz
Displacement Resolution 0.62 µrad
Auto Gap Set Standard
Gap Resolution 0.06 µm
Normal Force Range 0.01 to 50 N
TEMPERATURE CONTROL OPTIONS
Peltier Plate -10 to 150 ºCA,B
Environmental Test Chamber -150 to 400 ºC
Extended Temperature Module -100 to 400 ºC
Concentric Cylinder – with Circulator -20 to 150 ºC
A Lower temperature can be reduced to – 40 ºC by use of a suitable fluid in the external circulator.
B Operation to 150 ºC requires circulator fluid to be at 60 ºC.


FREE Rheology Poster FREE Thermal Analysis Poster HOME
For your FREE Polymer Reference Card email – [email protected]
w w w . t a i n s t . c o m
i n f o @ t a i n s t . c o m e - m a i l
i n t e r n e t
TA Instruments109 Lukens Drive, New Castle, DE 19720
(302) 427-4000
compliments of
Common PolymersReference Card
Symbol Reference Standard Tm(˚C) Hm(J/g)
In Indium 156.61 28.71Sn Tin 231.95 60.6Pb Lead 327.46 23.1Zn Zinc 419.53 108.0Ag Silver 961.93 –Au Gold 1064.43 –
C a l i b r a t i o n s t a n d a r d s
w w w . t a i n s t . c o m
U s e f u l C o n v e r s i o n s1 Pa = 10 dynes/cm2
1 psi = 6895 Pa1 psi = 6.895 x 10⁻³ MPa
1 Pa = 0.000145 psi1 MPa = 1,000,000 Pa
1 GPa = 1,000 MPa1 Newton = 101.97 g force
1 Joule = 0.239 calories1 calorie = 4.184 Joules
˚F = 9/5 (˚C) + 32˚C = 5/9 (˚F - 32)
10 Poise = 1 Pa sec
C o m m o n P o l y m e r s R e f e r e n c e
ABS Acrylonitrile 110 – 125 – 375 65 – 95 2070 – 4140Butadiene styrene
PMMA Polymethylmethacrylate 85 – 110 160 313 50 – 90 2240 – 3170Acrylonitrille 95 135 – 66 3450 – 4070
PTFE Polytetrafluoroethylene 126* 327 525 70-120 525PVDF Polyvinylidene fluoride -60 – -20 170 – 178 470 70-142 1724 – 2896Nylon 6 Nylon 6 40 – 87* 210 – 220 400 80 – 83 2690Nylon 6,6 Nylon 6,6 50* 255 – 265 426 80 2830 – 3240PC Polycarbonate 140 – 150 – 473 68 2350PBT Polybutylene terephthalate – 220 – 287 386 60 – 95 2280 – 2760PET Polyethylene terephthalate 73 – 80 245 – 265 414 65 2410 – 3100PEEK Polyetheretherketone 150 334 575 40 – 108 3860PEI Polyetherimide 215 – 217 – – 47 – 56 3310LDPE Low density Polyethylene -25 98 – 115 459 100 – 220 240 – 330HDPE High Density Polyethylene 60 – 80 130 – 137 469 59 – 110 1000 – 1550PI Polyimide – 310 – 365 – 45 – 56 3100 – 3450PPO Polyphenylene Oxide 100 – 142 – 400 38 – 70 2250 – 2760PPS Polyphenylene Sulfide 88 285 – 290 508 49 3790PP Polypropylene -20 160 – 175 417 81 – 100 1170 – 1720PS Polystyrene 74 – 109 240 – 250 351 50 – 83 2620 – 3380PSO Polysulfone 190 – 510 56 2690PES Polyethersulfone 220 – 230 – – 55 2400 – 2620PVC Polyvinyl Chloride 75 – 105 – 265 50 – 100 2070 – 3450
Acronym Polymer Tg(˚C) Tm(˚C) TGA** Linear CTE FlexuralDecomp T (˚C-1) Modulus (MPa)
Source: Modern Plastics Encyclopedia, Mid-October Issue, Vol. 66, No. 11, McGraw Hill, Inc., New York, New York, 1989.*Polymer Handbook, Second edition, J. Brandrup, E.H. Immergut, John Wiley and Sons, New York, New York, 1975.**TA Instruments Library (heating rate of 20˚C/min.).