name: period: section 2.5 best fitting lines
TRANSCRIPT
Name: _______________________ Period: ______________________
Reflection: 1
Section 2.5 Best Fitting Lines Objective(s): Write the equation of a line or linear function given a set of data.
Essential Question: The points of a scatter plot lie on a horizontal line. What type of correlation does
this show? Explain your answer.
Homework: Assignment 2.5. #1 – 5 in the homework packet.
Notes:
Vocabulary
A scatter plot is a graph of a set of ordered pairs used to determine if there is a relationship between the
variables.
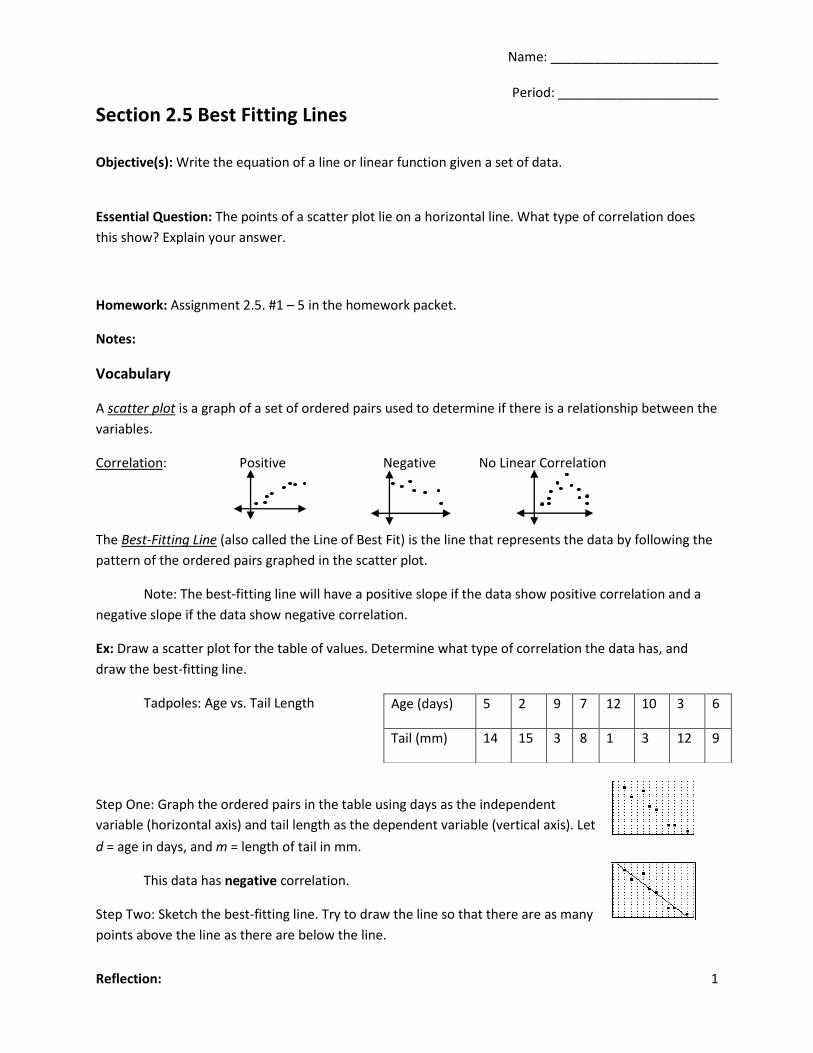
Correlation: Positive Negative No Linear Correlation
The Best-Fitting Line (also called the Line of Best Fit) is the line that represents the data by following the
pattern of the ordered pairs graphed in the scatter plot.
Note: The best-fitting line will have a positive slope if the data show positive correlation and a
negative slope if the data show negative correlation.
Ex: Draw a scatter plot for the table of values. Determine what type of correlation the data has, and
draw the best-fitting line.
Tadpoles: Age vs. Tail Length
Step One: Graph the ordered pairs in the table using days as the independent
variable (horizontal axis) and tail length as the dependent variable (vertical axis). Let
d = age in days, and m = length of tail in mm.
This data has negative correlation.
Step Two: Sketch the best-fitting line. Try to draw the line so that there are as many
points above the line as there are below the line.
Age (days) 5 2 9 7 12 10 3 6
Tail (mm) 14 15 3 8 1 3 12 9
Reflection: 2
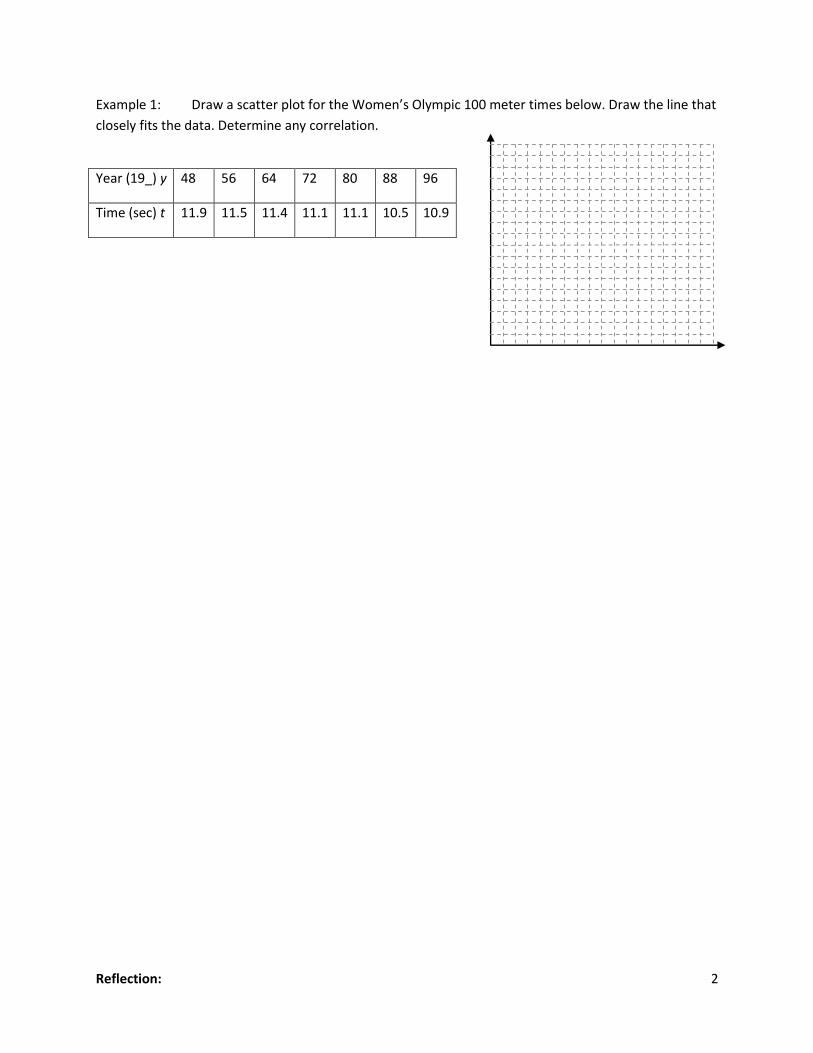
Example 1: Draw a scatter plot for the Women’s Olympic 100 meter times below. Draw the line that
closely fits the data. Determine any correlation.
Year (19_) y 48 56 64 72 80 88 96
Time (sec) t 11.9 11.5 11.4 11.1 11.1 10.5 10.9
Reflection: 3
Section 2.6 Linear Inequalities in Two Variables Objective(s): Sketch the graphs of linear inequalities.
Essential Question: Explain how to determine which half-plane to shade and whether to draw a solid or
dashed line when graphing a linear inequality.
Homework: Assignment 2.6. #6 – 14 in the homework packet.
Notes:
Vocabulary
The statement Ax + By > C is called a linear inequality in two variables.
A half-plane is one of the two regions formed by a line graphed in the coordinate plane.
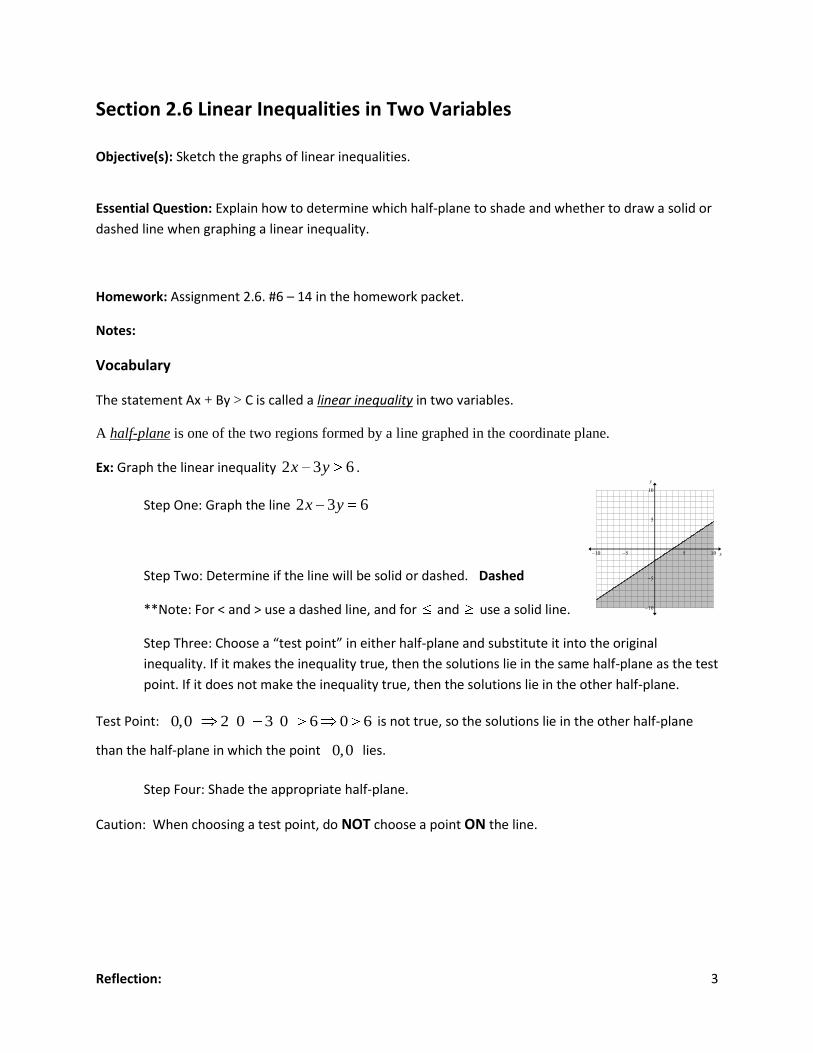
Ex: Graph the linear inequality 2 3 6x y .
Step One: Graph the line 2 3 6x y
Step Two: Determine if the line will be solid or dashed. Dashed
**Note: For < and > use a dashed line, and for and use a solid line.
Step Three: Choose a “test point” in either half-plane and substitute it into the original
inequality. If it makes the inequality true, then the solutions lie in the same half-plane as the test
point. If it does not make the inequality true, then the solutions lie in the other half-plane.
Test Point: 0,0 2 0 3 0 6 0 6 is not true, so the solutions lie in the other half-plane
than the half-plane in which the point 0,0 lies.
Step Four: Shade the appropriate half-plane.
Caution: When choosing a test point, do NOT choose a point ON the line.
Reflection: 4
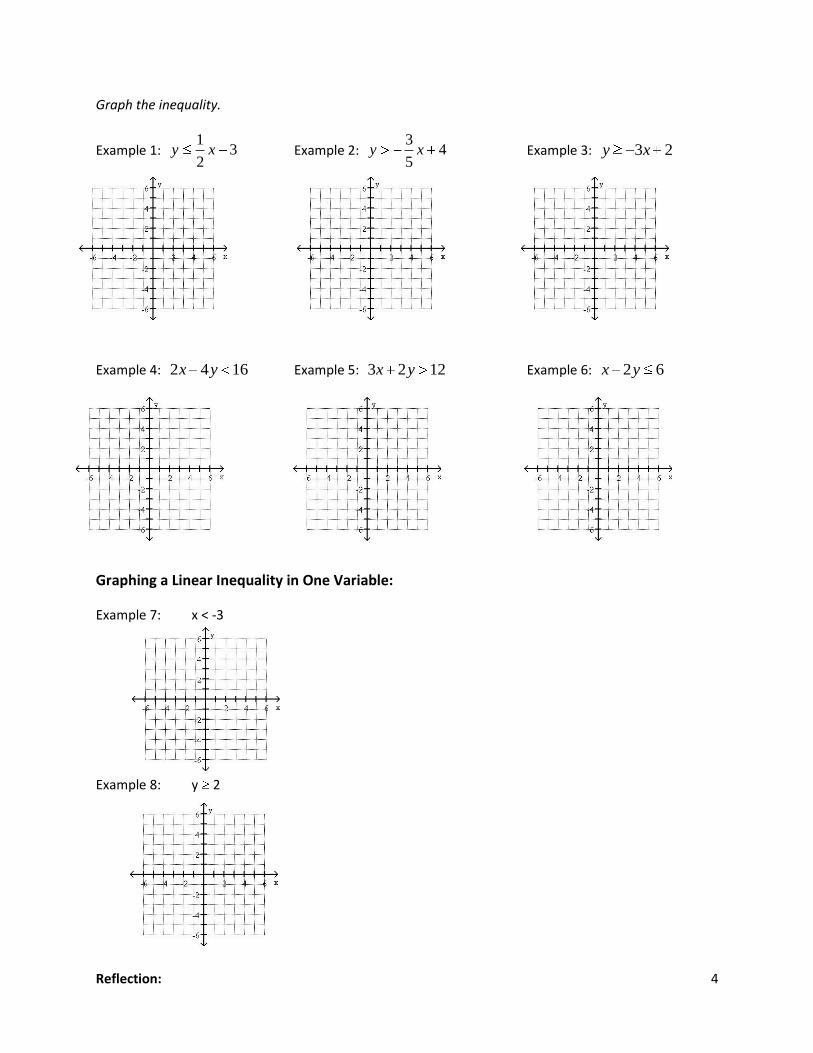
Graph the inequality.
Example 1: 1
32
y x Example 2: 3
45
y x Example 3: 3 2y x
Example 4: 2 4 16x y Example 5: 3 2 12x y Example 6: 2 6x y
Graphing a Linear Inequality in One Variable:
Example 7: x < -3
Example 8: y 2
Reflection: 5
Section 2.7 Piecewise Functions Objective(s): Define and graph piecewise functions including the greatest integer function.
Essential Question: In a piecewise function, why must one part of the graph have an open circle as an
endpoint, and the other have a closed circle as an endpoint?
Homework: Assignment 2.7. #15 – 19 in the homework packet.
Notes:
Vocabulary
A piecewise function is a function that is represented by a combination of equations, each corresponding
to a part of the domain.
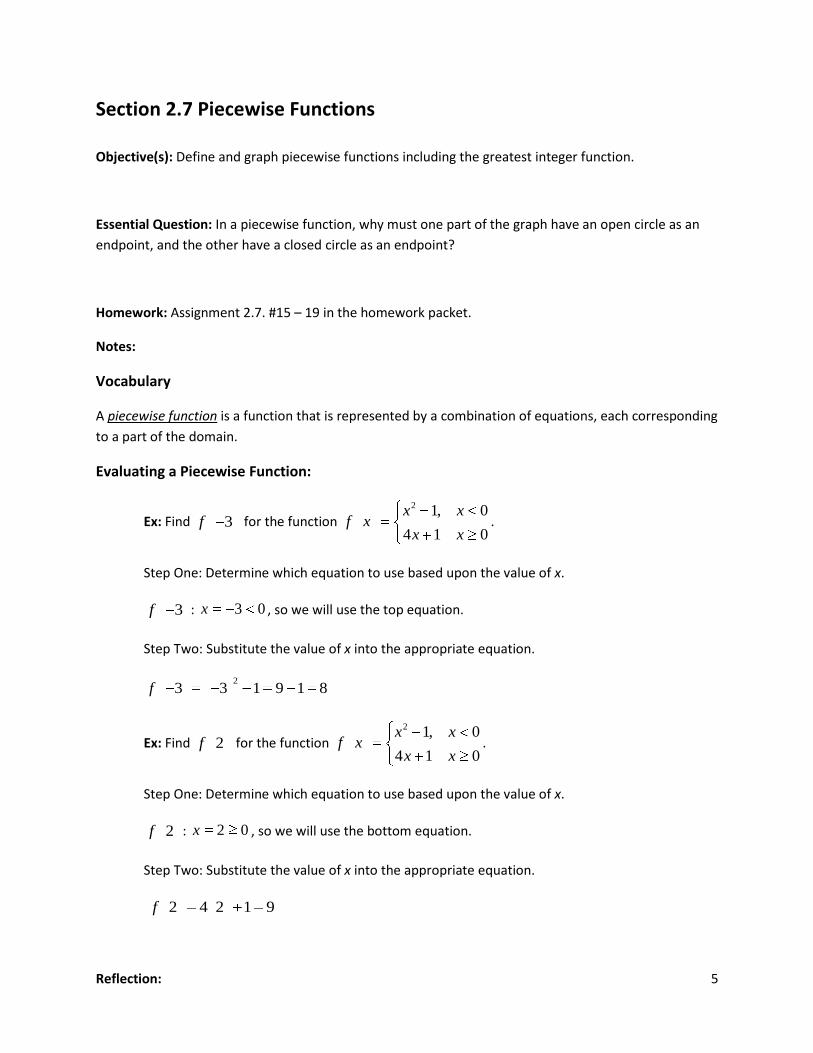
Evaluating a Piecewise Function:
Ex: Find 3f for the function 2
1, 0
4 1 0
x xf x
x x.
Step One: Determine which equation to use based upon the value of x.
3f : 3 0x , so we will use the top equation.
Step Two: Substitute the value of x into the appropriate equation.
2
3 3 1 9 1 8f
Ex: Find 2f for the function 2
1, 0
4 1 0
x xf x
x x.
Step One: Determine which equation to use based upon the value of x.
2f : 2 0x , so we will use the bottom equation.
Step Two: Substitute the value of x into the appropriate equation.
2 4 2 1 9f
Reflection: 6
Find the given function value for5, 4
2 1 4
xf x
x x .
Example 1: Find f(0) Example 2: Find f(7) Example 3: Find f(4)
f(0) = __________________ f(7) = __________________ f(4) = __________________
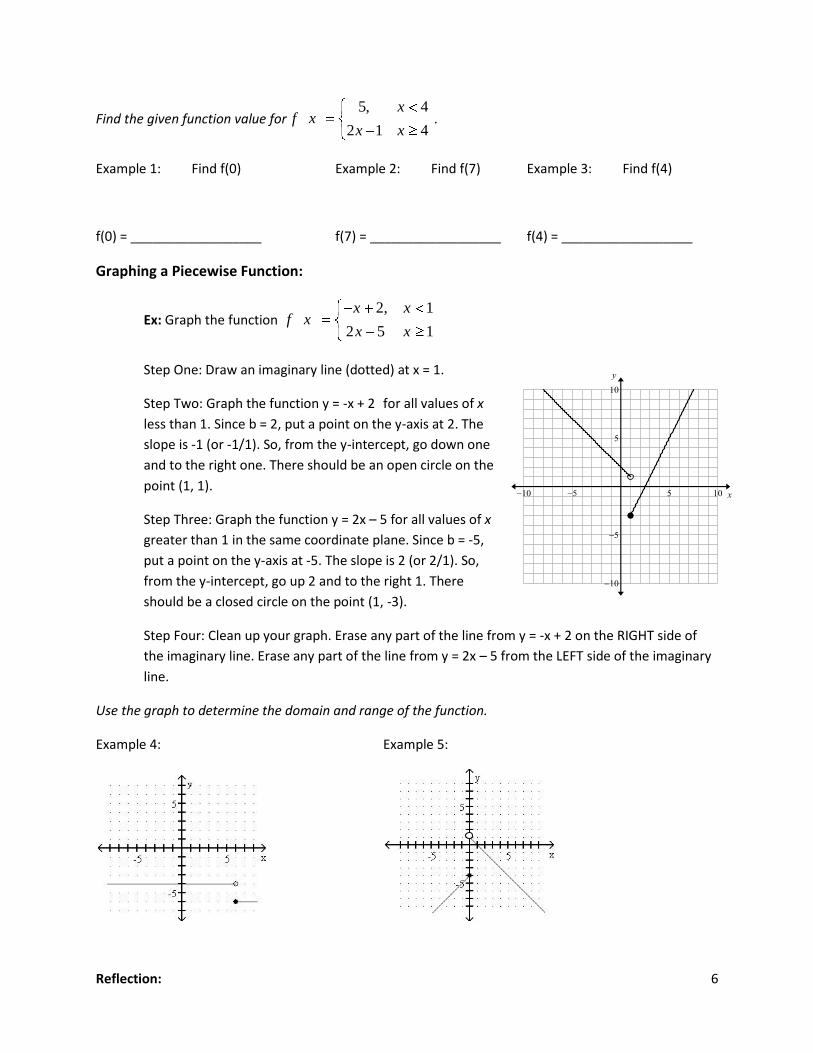
Graphing a Piecewise Function:
Ex: Graph the function 2, 1
2 5 1
x xf x
x x
Step One: Draw an imaginary line (dotted) at x = 1.
Step Two: Graph the function y = -x + 2 for all values of x
less than 1. Since b = 2, put a point on the y-axis at 2. The
slope is -1 (or -1/1). So, from the y-intercept, go down one
and to the right one. There should be an open circle on the
point (1, 1).
Step Three: Graph the function y = 2x – 5 for all values of x
greater than 1 in the same coordinate plane. Since b = -5,
put a point on the y-axis at -5. The slope is 2 (or 2/1). So,
from the y-intercept, go up 2 and to the right 1. There
should be a closed circle on the point (1, -3).
Step Four: Clean up your graph. Erase any part of the line from y = -x + 2 on the RIGHT side of
the imaginary line. Erase any part of the line from y = 2x – 5 from the LEFT side of the imaginary
line.
Use the graph to determine the domain and range of the function.
Example 4: Example 5:
Reflection: 7
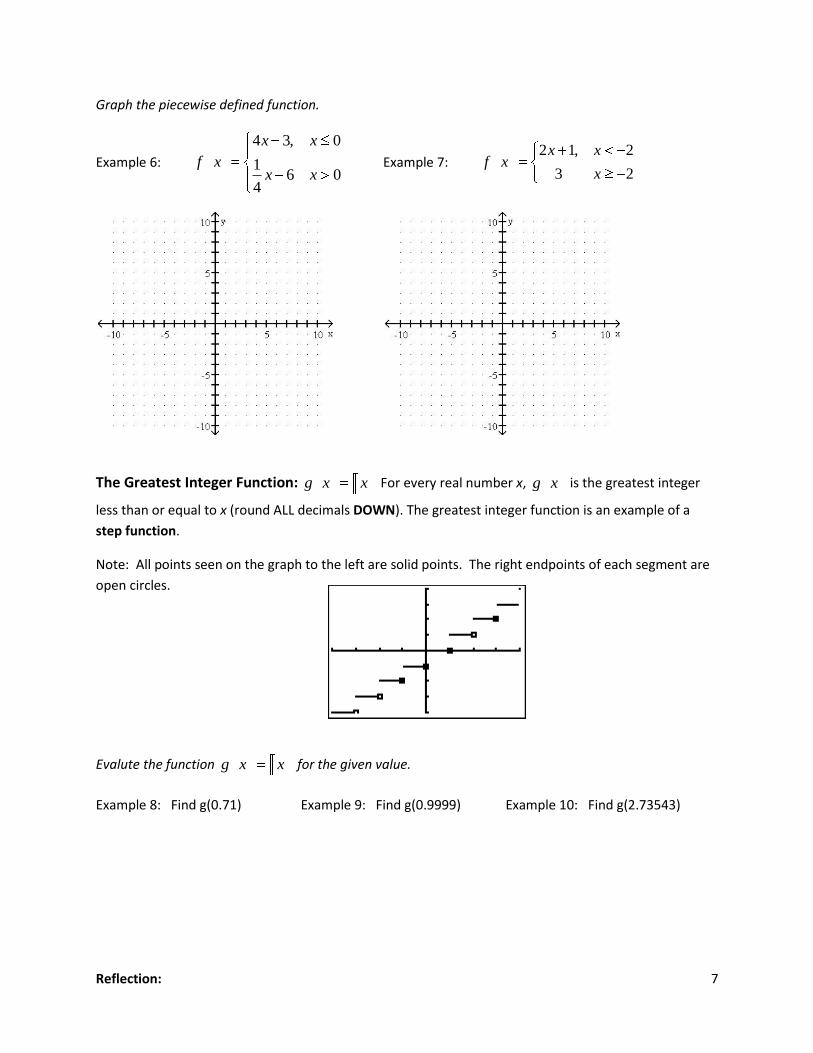
Graph the piecewise defined function.
Example 6:
4 3, 0
16 0
4
x x
f xx x
Example 7: 2 1, 2
3 2
x xf x
x
The Greatest Integer Function: g x x For every real number x, g x is the greatest integer
less than or equal to x (round ALL decimals DOWN). The greatest integer function is an example of a
step function.
Note: All points seen on the graph to the left are solid points. The right endpoints of each segment are
open circles.
Evalute the function g x x for the given value.
Example 8: Find g(0.71) Example 9: Find g(0.9999) Example 10: Find g(2.73543)
Reflection: 8
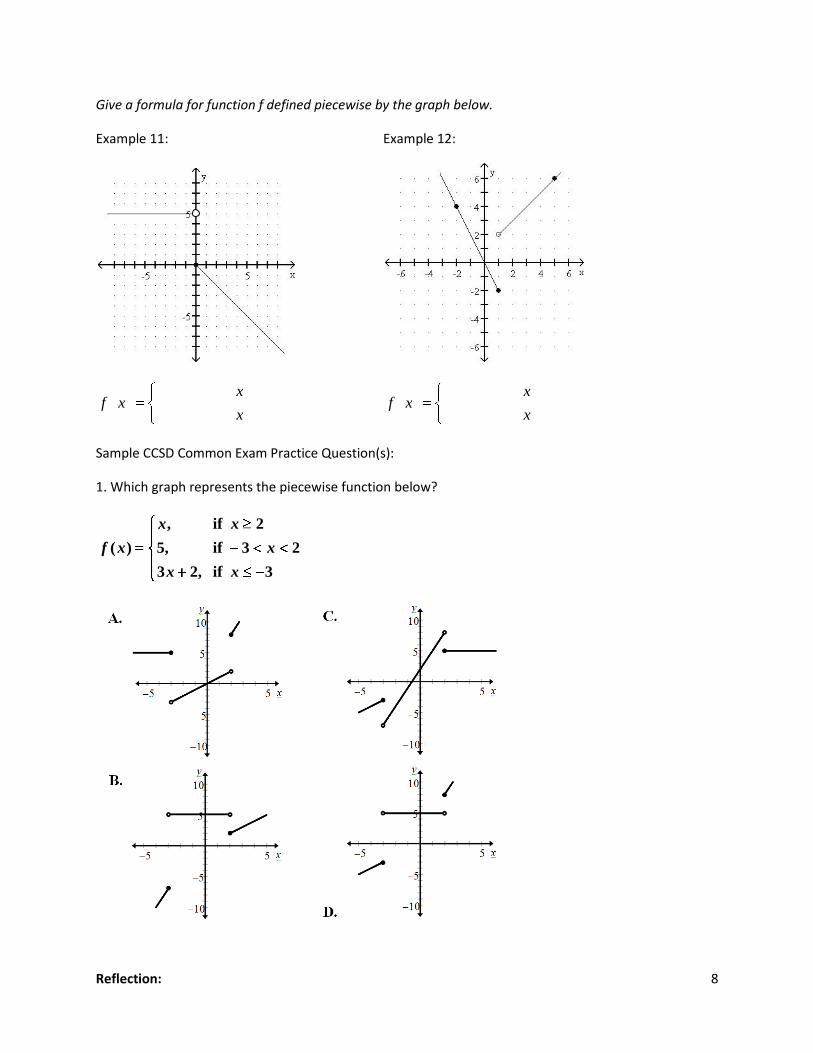
Give a formula for function f defined piecewise by the graph below.
Example 11: Example 12:
xf x
x
xf x
x
Sample CCSD Common Exam Practice Question(s):
1. Which graph represents the piecewise function below?
, if 2
( ) 5, if 3 2
3 2, if 3
x x
f x x
x x
Reflection: 9
Section 2.8 Absolute Value Functions Objective(s): Sketch the graph of absolute value equations.
Essential Question:
Homework: Assignment 2.8. #20 – 26 in the homework packet.
Notes:
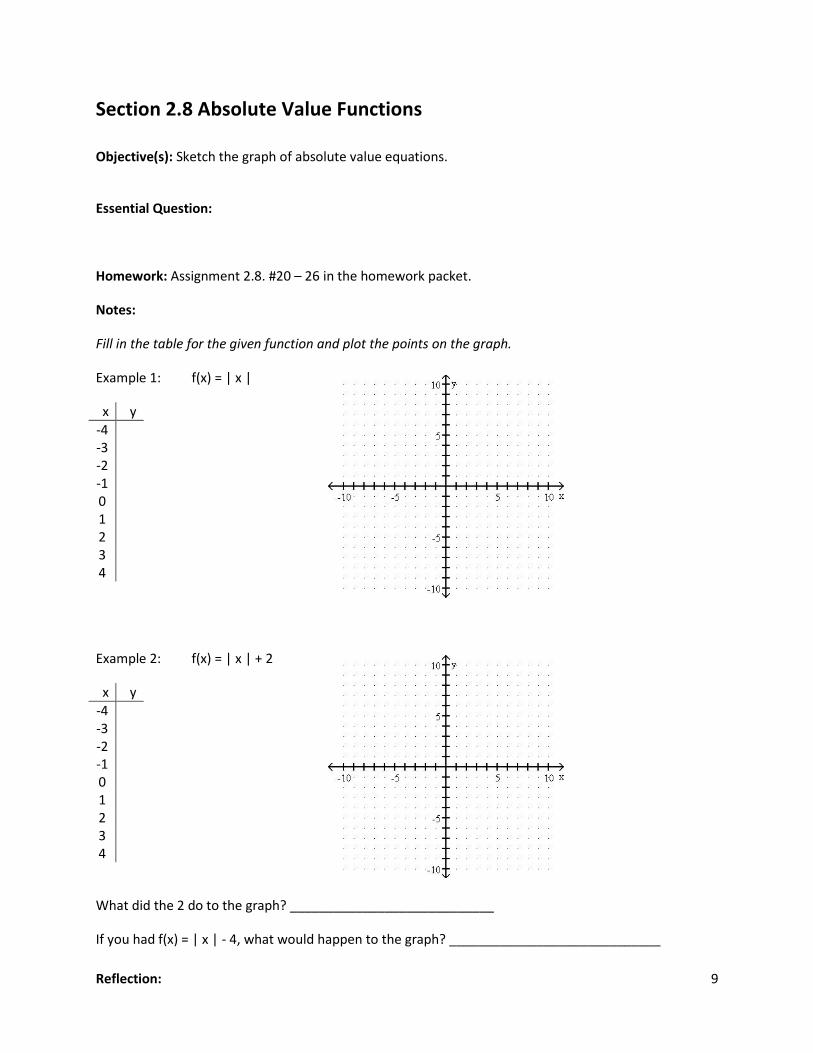
Fill in the table for the given function and plot the points on the graph.
Example 1: f(x) = | x |
x y
-4 -3 -2 -1 0 1 2 3 4
Example 2: f(x) = | x | + 2
x y
-4 -3 -2 -1 0 1 2 3 4
What did the 2 do to the graph? ____________________________
If you had f(x) = | x | - 4, what would happen to the graph? _____________________________
Reflection: 10
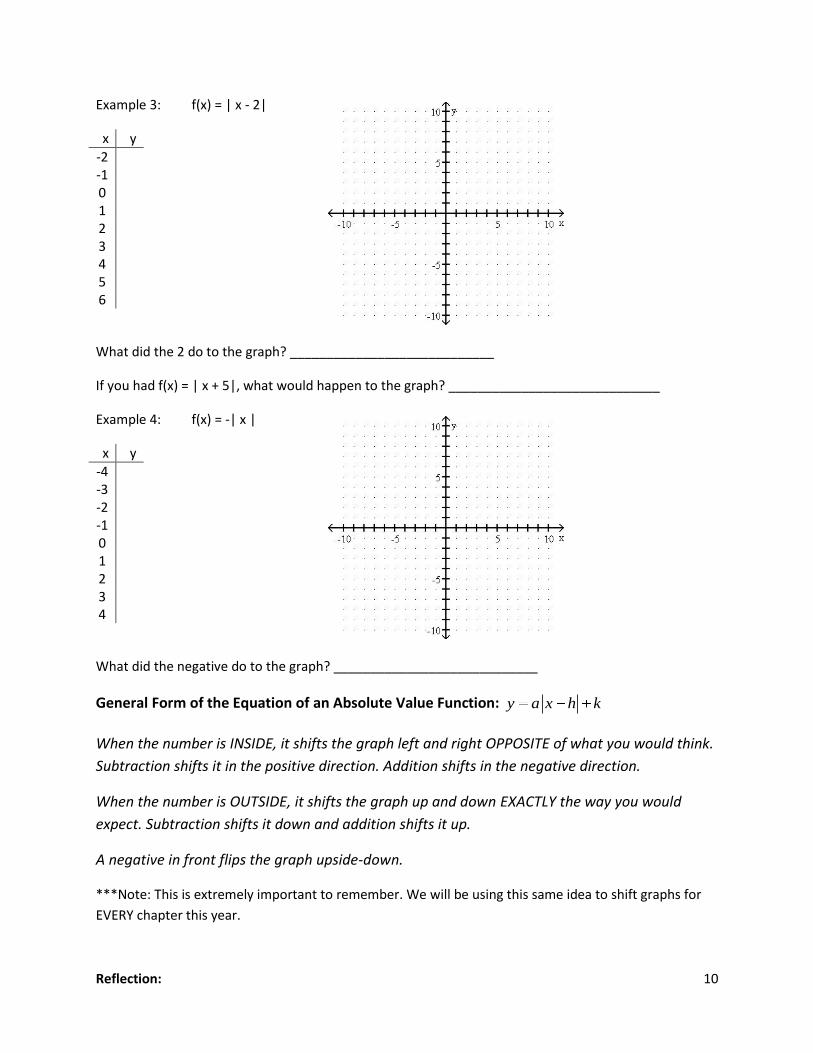
Example 3: f(x) = | x - 2|
x y
-2 -1 0 1 2 3 4 5 6
What did the 2 do to the graph? ____________________________
If you had f(x) = | x + 5|, what would happen to the graph? _____________________________
Example 4: f(x) = -| x |
x y
-4 -3 -2 -1 0 1 2 3 4
What did the negative do to the graph? ____________________________
General Form of the Equation of an Absolute Value Function: y a x h k
When the number is INSIDE, it shifts the graph left and right OPPOSITE of what you would think.
Subtraction shifts it in the positive direction. Addition shifts in the negative direction.
When the number is OUTSIDE, it shifts the graph up and down EXACTLY the way you would
expect. Subtraction shifts it down and addition shifts it up.
A negative in front flips the graph upside-down.
***Note: This is extremely important to remember. We will be using this same idea to shift graphs for
EVERY chapter this year.
Reflection: 11
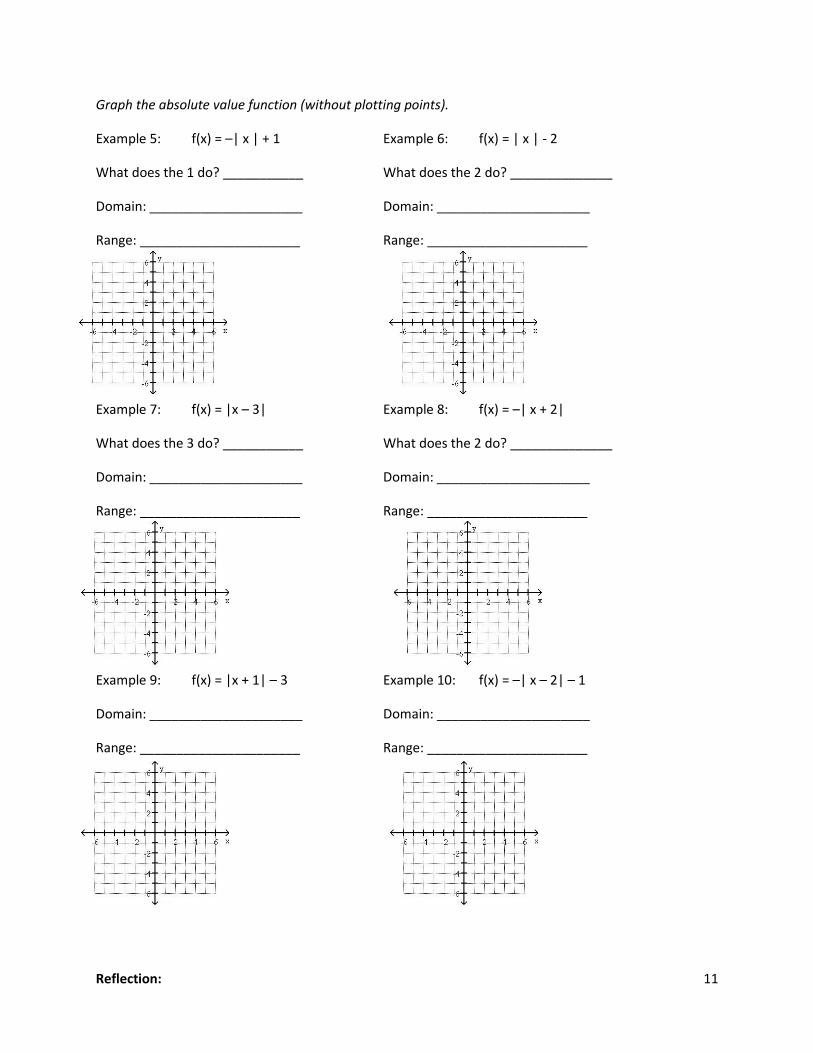
Graph the absolute value function (without plotting points).
Example 5: f(x) = –| x | + 1 Example 6: f(x) = | x | - 2
What does the 1 do? ___________ What does the 2 do? ______________
Domain: _____________________ Domain: _____________________
Range: ______________________ Range: ______________________
Example 7: f(x) = |x – 3| Example 8: f(x) = –| x + 2|
What does the 3 do? ___________ What does the 2 do? ______________
Domain: _____________________ Domain: _____________________
Range: ______________________ Range: ______________________
Example 9: f(x) = |x + 1| – 3 Example 10: f(x) = –| x – 2| – 1
Domain: _____________________ Domain: _____________________
Range: ______________________ Range: ______________________
Reflection: 12
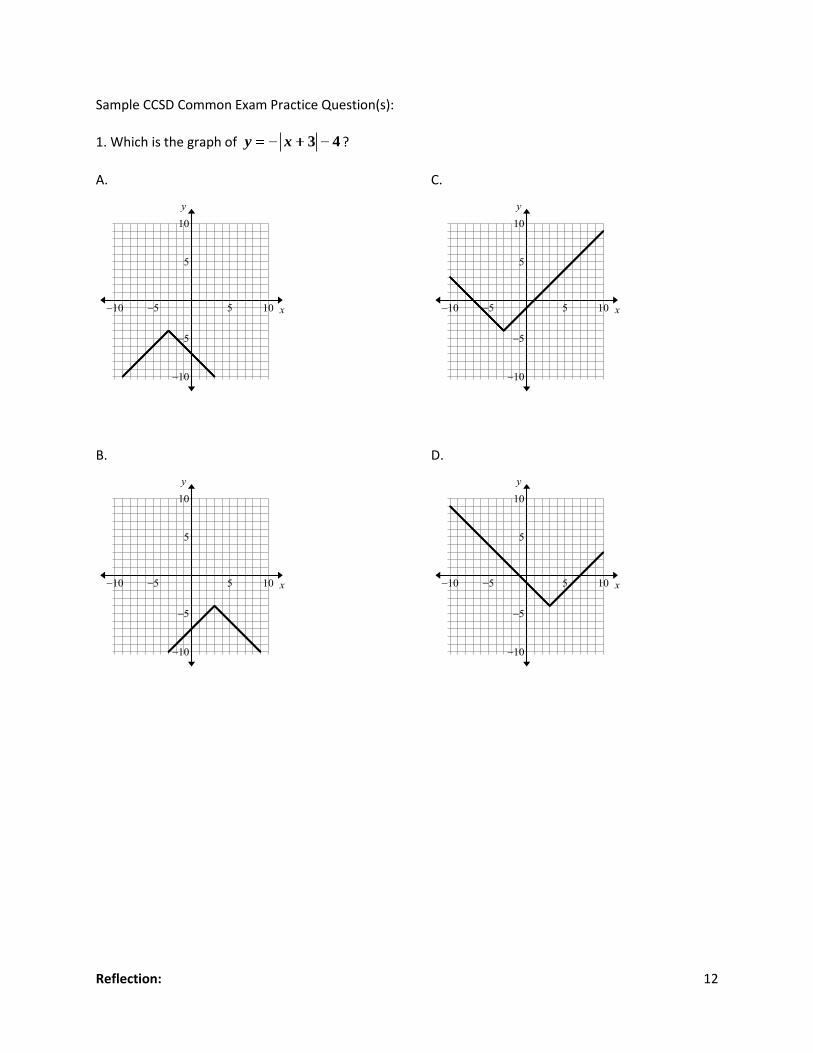
Sample CCSD Common Exam Practice Question(s):
1. Which is the graph of 3 4y x ?
A.
B.
C.
D.