nalljral convection heat exchangers for solar …/67531/metadc697482/m2/1/high... · nalljral...
TRANSCRIPT

NAllJRAL CONVECTION HEAT EXCHANGERS FOR SOLAR WATER HEATING SYSTEMS
Technical Progress Report February 1,1996 to March 31,1996
Jane H. Davidson Department of Mechanical Engineering
University of Minnesota Minneapolis, MN 55455
Prepared for the United States Dep w Under Contract No. DE-FG36-9 p?:uaM
1

This report was prepared as an account of work sponsored by an agency of the United States Government. Neither the United States Government nor any agency thereof, nor any of their employees, makes any warranty, express or implied, or assumes any legal liability or responsibility for the accuracy. completeness, or use- fulness of any information, apparatus, product, or process disclosed, or represents that its use would not infringe privately owned rights. Reference herein to any spe- cific commercial product, process, or senice by trade name, trademark, manufac- turer, or otherwise does not necessarily constitute or imply its endorsement, morn- mendhtion, or favoring by the United States Government or any agency thereof. The views and opinions of authors expressed herein do not necessarily state or reflect thosc of the United States Government or any agency thereof.

DISCLAIMER
Portions of this document may be illegible electronic image products. Images are produced from the best availabie original document.

NATlJRAL CONVECTION HEAT EXCHANGERS FOR SOLAR WATER HEATING SYSTEMS
DE-FG36-94GO 10030
Jane H. Davidson University of Minnesota
Reporting Period:
Project Personnel:
Project Objectives:
February 1,1996 to March 31,1996
Jane H. Davidson Scott Dahl, Graduate Research Assistant
The goals of this project are 1) to develop guidelines for the design and use of thermosyphon heat exchangers external to the storage tank in solar domestic water heating systems and 2) to establish appropriate modeling and testing criteria for evaluating the performance of systems using this type of heat exchanger.
ExDerinnental Wo rk
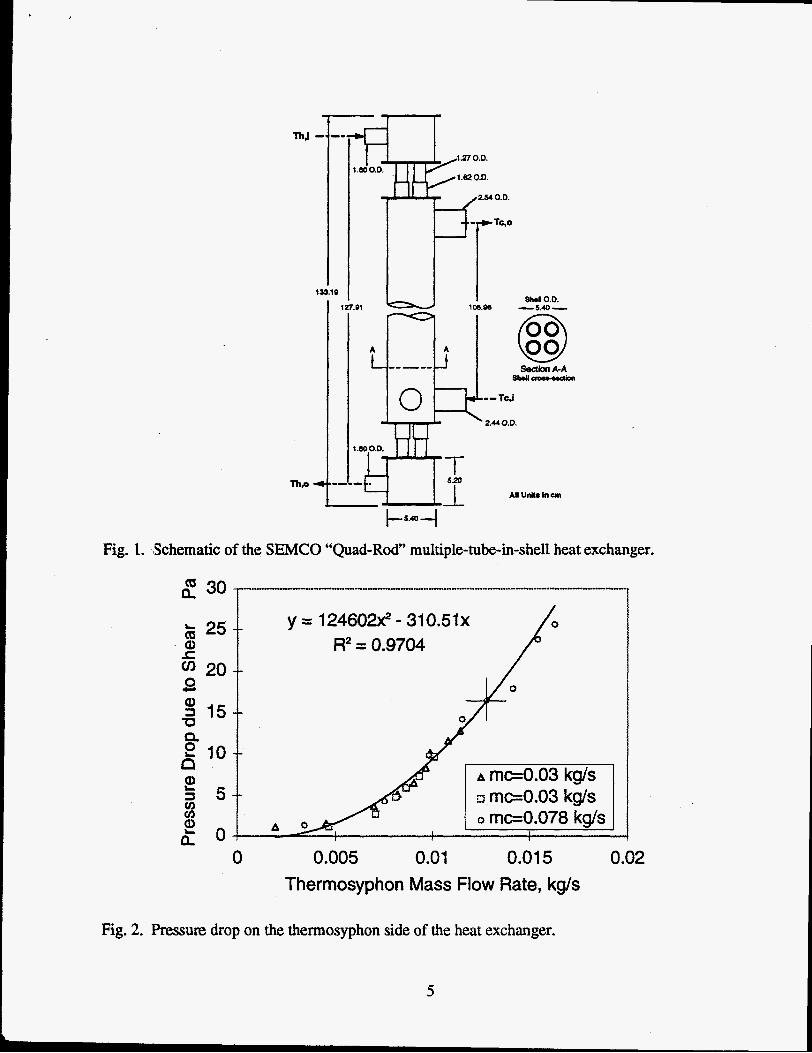
We have completed testing of a four tube-in-shell thermosyphon heat exchanger manufactured by AAA Solar Service and Supply Inc, SEMCO, of Albuquerque and given to us by Richard Lane of Public Energy Systems located in Green Bay, Wisconsin. A sketch of the “Quad-Rod‘’ heat exchanger is shown in Fig. 1. Cool water from the bottom of the tank enters the shell side of the heat exchanger near the bottom and exits near the top. Hot anti-freeze fluid from the collector enters the exchanger through a manifold at the top, flows through the four tubes and returns to the collector through another manifold. The double walled tubes are constructed of 1/2 inch copper ACR tubing inside a 1/2 inch Nom. copper water tube. A small gap between the two tubes allows for leak detection. The inside of the tubes is fit with a helical wire. However, since the Reynolds number is calculated to have a value less than 2300 at a collector flow rate of 0.03 kg/s with the 50/50 mixture of ethylene glycol and water at a temperature of 90 OC, flow is expected to remain laminar and the wire is not expected to have much effect on heat transfer. Nominal exterior heat transfer area is 0.228 m2.
The heat exchanger was tested using the same protocol we used to evaluate the two-pass and single tube-in-shell heat exchangers made by Heliodyne. The test consisted of two parts. During the first part of the test, the storage tank temperature was maintained at a uniform temperature of 25 degC while the temperature of the collector fluid was increased every 30 minutes in increments of 10 degC from 30 degC to 95 degC. The tank was held isothermal by the slow addition of cold mains water to the bottom of the tank as warm water from the top of the tank was dumped. The second part of the test began after 200 minutes when the collector fluid was 95 degc‘. At this point in the test, the cold mains water was disconnected from the tank and the tank was allowed to heat up. Collector outlet temperature, Th,i, was held constant. Two collector flow rates were used: 0.015 kg/s and 0.03 kg/s.
2

Measured values include collector-side forced flow rate, temperature differences across the heat exchanger, vertical temperature distribution in the storage tank, vertical water temperature profile in the heat exchanger, and pressure drop on the thennosyphon side of the heat exchanger. Thermosyphon mass flow rate was determined from an energy balance across the heat exchanger.
Pressure drop on the thermosyphon side of the heat exchanger was measured and is plotted as a function of flow rate in Fig. 2. Unfortunately, our pressure transducer had an electronic problem that caused drift in the zero pressure offset. This problem would cause a random vertical shift in data of Fig. 2. Although we calibrated the transducer just prior to obtaining these measurements, we are not positive that they are completely accurate and plan to repeat them once the pressure transducer has been repaired.
Tempecatures at the inlets and outlets of the heat exchanger are plotted over the duration of the tests in Figs. 3 and 4. During the test with a collector flow rate of 0.015 kg/s, cold water was accidentally introduced into the storage tank for a short period at the beginning of the second part of the test procedure (time = 200 minutes). This event caused the water at the bottom of the storage *tank (thus TcJ ) to decrease. As a result, he driving force in the loop increased slightly as the hydrostatic pressure difference between the water in storage tank and the heat exchanger increased. The increased driving force created a small upward shift in the thermosyphon mass flow rate plotted in Fig. 5.
The axial temperature distributions in the water on thennosyphon side of the heat exchanger are presented at various times during the test in Fig. 6. These measurements were made with 0.5 mm diameter thermocouple probes inserted inside the shell. Temperatures measured on the outer surface of the shell were approximately 1 "C less than temperatures measured in the fluid. The measurement uncertainty for the temperature difference is 0.71 O C which nearly accounts for the difference. The temperature profde in this heat exchanger design is nearly linear. Previous temperature measurements obtained from surface mounted thermocouples for the two-pass, tube- in-shell heat exchanger (Heliodyne) indicated the temperature profile was nonlinear. The reason for the difference in the shape of the temperature profdes is the difference in geometry.
Measured values of UA are plotted as a function of time in Fig. 7. The measured value of UA is determined from,
During the fust part of the test, UA values obtained with a collector flow rate of 0.03 kg/s are approximately 15% larger than those measured with a 0.015 kg/s collector flow rate. During the second part of the test, the measured UA values are nearly identical. The cold water surge that accidentally occurred in the test with collector flow rate equal to 0.015 kg/s resulted in a higher temperature difference between Th,i and Tc,i. The increased influence of natural convection appears to compensate for the difference in the collector flow rates in the second part of the test.
Figure 8 presents a plot of measured UA as a function of the thermosyphon flow rate for the two collector flow rates. This plot confirms what we found during testing of the Heliodyne heat exchangers. Models which assume UA depends solely on thermosyphon flow rate (i.e. forced flow) do not adequately characterize thermosyphon heat exchangers. Heat transfer is in the mixed convection regime. During the first 200 minutes of testing, when thermosyphon flow rate increased due to a decrease in water density in the heat exchanger (with no change in the isothermal tank), UA increased as temperature differences across the heat exchanger increased. After 200 minutes, the glycol temperature was held constant and the tank was allowed to heat up.
3

As a result of a decrease in the pressure in the water tank, thermosyphon flow rate decreased but with no appreciable change in UA. Under these operating conditions, heat transfer coefficients did not change significantly because both the temperature difference controlling natural convection and Re of the glycol flow remained nearly constant.
A better method of predicting UA from the Prandtl, Reynolds and Grashof numbers is shown in Fig. 9. ‘The data for both collector flow rats have been combined in attempts to obtain a single correlation for UA which is not dependent on the collector flow rate. A linear regression technique was used assuming
The parameters P1 through P4 were solved using linear regression. The dimensionless parameters are based on fluid properties calculated for a temperature equal to the average of the hot and cold inlet temperatures, The Grashof number is also based on the temperature difference between TSi and TGi. We are currently investigating methods of incorporating similar models into a shnpwied testing and modeling procedure.
The paper “Issues of Predicting Performance of Thennosyphon Heat Exchangers in Solar Water Heaters” was presented at the 1995 ASME International Solar Energy Conference in San Antonio, April 1, 1996. The paper won the best paper award given by the Fundamentals Technical Committee of The ASME Solar Energy Division.
Future Activity
Continued fundamental analysis of the thennosyphon heat exchanger is underway and modeling efforts hiave begun.
4
133.19
1
Fig. 1. Schematic of the SEMCO "Quad-Rod" multiple-tube-in-shell heat exchanger.
2 30 ,-. ..._..__._.._.__..._ ..................................................................
'D !! 1 5 t
10
5
0
I z rne0.03 kg/s
0 0.005 0.01 0.01 5 0.02 Thermosyphon Mass Flow Rate, kg/s
Fig. 2. Pressure drop on the thermosyphon side of the heat exchanger.
5

loo
90 c 80
70 v 3 50 f 6o a E“ 40
30
20
10
0 200 400 600 800 1000 1200 Time, minutes
Fig. 3. Measured temperatures at the inlet and outlets of the “Quad-Rod” tube-in-shell heat exchanger plotted versus test duration. Collector flow rate is 0.015 kg/s.
100 .................................. .. ........................................................................................................
. . . . . . *.’*.-- . . . 30 f 20 r r
0 200 400 600 800 1000 1200 Time, minutes
Fig. 4. Measured temperatures at the inlet and outlets of the “Quad-Rod” tube-in-shell heat exchanger plotted versus test duration. Collector flow rate is 0.03 kg/s.
6

0.01 8
0.01 6
x 0.014 d
3 0 0.01
5 0.008
@ 0.006
s g 0.012 U
L
c P
g 0.004 0.002
0
e
12' e
1: i
1 mc = 0.030 kg/s/ 10 mc = 0.01 5 kg/s]
0 200 400 600 Time, minutes
800 1000 1200
Fig. 5. Thermosyphon flow rate plotted versus test duration for collector flow rates of 0.015 kg/s and 0.03 kg/s.
90
80
70 v - 60
E 50
E ' 40
C
30
20 0 0.2 0.4 0.6
Heat exchanger position, XR 0.8 1
Fig. 6. Axial temperatwe distribution on the thermosyphon side of the heat exchanger.
7

0 200 400 600 800 1000 1 200 Time, minutes
Fig. 7. Measured values of UA plotted versus test duration for collector flow rates of 0.015 kg/s and 0.03 kg/s.
50
45
40
8
15 t
$* og 8
lo 5 I 0 0.005 0.01 0.015
Themosyphon Flow Rate, kg/s 0.02
Fig. 8. Measured UA plotted as a function of thermosyphon flow rate.
8

50
45 40
-.-.................. I...”... .... ............” .... .. ........... ..
y = 0.9883~ R2 = 0.91 71
l o / 5
Measurement Uncertslnty +
0 10 20 30 40 2.88Pr+O.08)Reh(-0.21 )Gr*( .26)
50 60
Fig. 9. Measured UA expressed as a function of Gr, Pr, and Re numbers for both collector flow rates, (0..015 and 0.03 kg/s).
9