musical instrument fund - royal conservatoire of … · musical instrument fund the scottish...
TRANSCRIPT

Musical
Instrument
Fund THE SCOTTISH GOVERNMENT’S £1M INVESTMENT IN MUSICAL INSTRUMENTS
DR STEPHEN BROAD
JULY 2015

2 Royal Conservatoire of Scotland
Executive Summary
This report explains how the £1m investment was spent and what difference it made to the supply of instruments for tuition in local authorities across Scotland.
In particular, it provides for the first time a baseline analysis of musical instrument stocks held by Instrumental Music Services.
An analysis of the data suggests that:
Before the investment, around 40,000 musical instruments were held by Music Services, of which around 2200 were in need of replacement.
Before the investment, at most 6 out of every 10 Music Service pupils had access to a Local Authority instrument, and perhaps as many as half of all Music Service pupils providing their own instrument.
Following the investment, at least 2700 new instruments have been purchased, 500 more than were earmarked for replacement, meaning that the investment has made a clear net contribution to instrument stocks.
Following the investment, 7 out of every 10 Music Service pupils now has access to a Local Authority instrument
In addition:
There is considerable variation in the size of instrument stocks, with some Music Services having far fewer instruments than others, even when pupil population is accounted for.
Music Services chose, in general, to invest the money in new instruments rather than in the repair of existing stocks and a small number of Scottish retailers provided a large number of new instruments and were significant beneficiaries of the initiative.
Dr Stephen Broad
Head of Research and Knowledge Exchange
Royal Conservatoire of Scotland, July 2015.

Musical Instrument Fund 3
Contents Executive Summary .................................................................................................... 2
Contents ..................................................................................................................... 3
1. List of Tables and Figures .................................................................................... 5
2. Background and Context ..................................................................................... 6
Background ............................................................................................................ 6
The Decision to Invest ............................................................................................ 6
The Process in Summary ........................................................................................ 6
3. Method ............................................................................................................... 8
The Process in Detail .............................................................................................. 8
Interpreting the Numbers: Data Quality, Terminology and the Problem of Counting ................................................................................................................. 9
Project Timeline ................................................................................................... 11
4. Baseline data on musical instruments in Local Authority Music Services before investment ............................................................................................................... 12
Introduction ......................................................................................................... 12
Summary Baseline Data ....................................................................................... 12
Baseline Data in detail ......................................................................................... 15
5. The Scottish Government investment .............................................................. 22
Introduction ......................................................................................................... 22
Allocations to Local Authority Music Services ..................................................... 22
Repair or Replace? ............................................................................................... 22
Purchase of new instruments .............................................................................. 27
The Outcome of the Investment .......................................................................... 30
6. Analysis and commentary ................................................................................. 33
Introduction ......................................................................................................... 33
Management of Instrument Stocks ..................................................................... 33
Diversity of Approaches, Diversity of Contexts ................................................... 34

4 Royal Conservatoire of Scotland
The Decision to Buy.............................................................................................. 34
A Limited Marketplace ......................................................................................... 35
Concluding remarks ............................................................................................. 36
7. Selected Bibliography ....................................................................................... 37

Musical Instrument Fund 5
1. List of Tables and Figures
Table 1: Total Instruments by Authority, with reported condition ............................. 13
Table 2: Total instruments by Authority, with ‘best guess’ of condition for instruments whose condition was unknown ....................................................... 14
Table 3: Instruments per 100 pupils ............................................................................ 17
Table 4: Instruments per 10 IMS pupils ....................................................................... 18
Table 5: Breakdown of instrument numbers by family, with those reported 'fit for purpose' (FFP) ...................................................................................................... 20
Table 6: Funds Allocated and Disbursed to Local Authorities ..................................... 23
Table 7: Use of Funds to Repair Existing or Purchase New ......................................... 25
Table 8: New Instruments Purchased .......................................................................... 28
Table 9: Instruments per 10 IMS Pupils, after investment .......................................... 31
Figure 1: Local Authority spending, by retailer ............................................................ 35

6 Royal Conservatoire of Scotland
2. Background and Context
Background In Scotland, music lessons in schools are provided by centralised Instrumental Music Services that operate within Local Authority education departments or their equivalent. Every Local Authority makes provision for a Music Service but each Service is managed and funded according to decisions made at the Local Authority level. Although the pattern of provision varies from Authority to Authority, there is nonetheless a basic infrastructure for supporting the learning and teaching of music beyond the classroom.
In the last decade, this provision has been supplemented by the Scottish Government’s Youth Music Initiative, which ensures that every child can access at least one year’s free music tuition by Primary 6. This major sustained investment has provided essential initial experiences for large numbers of young people. Nonetheless, these same young people may face barriers to their continued participation if resources to support them after that initial experience are limited.
There is no doubt that the question of access to music education inspires passionate debate. There have been important popular campaigns around the various barriers that may affect young people’s ability to access it, and a number of initiatives to ensure that music in schools is well supported. The wider personal, social and developmental benefits that participation in music brings have been explored in a range of research, and the contribution music can make to the development of the four capacities of Curriculum for Excellence has also been noted. There is widespread consensus that music lessons should not simply be considered an engaging, but essentially dispensable, ‘extra’ in schools, but should be available to all.
The Decision to Invest The decision to invest in musical instruments specifically was announced on 16 December 2012, by the Minister for Learning, Science and Scotland’s Languages, Dr Alasdair Allan. A total of £1m was earmarked for the purchase of new instruments and the repair of existing stocks, with the aim of widening access to music provision. Writing at the time, the Minister explained: ‘We believe that every child should have the opportunity to learn to play a musical instrument as part of the broad general education they are entitled to under Curriculum for Excellence. Currently, there are too many children being put off taking up music because of the cost of the instrument’.
Concurrent with the investment in instruments, the Instrumental Music Group was established, chaired by David Green, with the role of examining and reporting on a range of issues around the provision of instrumental music in Scottish schools.
The Process in Summary The Royal Conservatoire of Scotland was charged with administering the investment and liaising with Local Authority Music Services, the Instrumental Music Group and

Musical Instrument Fund 7
the Scottish Government. Heads of Instrumental Teaching Scotland (HITS) was consulted to ensure broad consensus on the approach adopted.
It was agreed that the total investment of £1m would be allocated in two phases: phase one would be a direct formulaic allocation to Local Authorities for instruments to be used by the Instrumental Music Service, and phase two would be a open bidding process, which would also permit instruments to be purchased for community use.
It was further agreed that funding would be contingent on Local Authorities providing baseline data on existing stocks of musical instruments and their state of repair, reflecting the fact that there was no national picture of instrument stocks across Local Authorities to inform future policy.
This report is based on both on the data received from Local Authorities, and on the records generated during the allocation process.

8 Royal Conservatoire of Scotland
3. Method
The Process in Detail The management of the musical instrument investment was discussed in detail with the Scottish Government, HITS and the Royal Conservatoire to ensure an equitable distribution of funds across Scotland, and a good shared understanding of the Minister’s aims, which included taking specific steps to reach pupils who are barred by economic circumstances from accessing an instrument.
It was agreed that half of the investment, £500,000, would be used in an initial allocation to all 32 Local Authorities, and Jordanhill School, using the same formula that is applied to disburse Youth Music Initiative (YMI) Local Authority funding. This formula funding was for repair of existing instruments, or the purchase of new instruments, for use in Local Authority Instrumental Music Services.
Each Local Authority was informed of their allocation and asked to submit proposals detailing how that allocation would be spent, giving particular attention to the Minister’s intention that the investment should reach children whose families would otherwise be unable to afford them.
In both phases, a scrutiny panel (including Royal Conservatoire and HITS representatives, with an external advisor) was specially convened to ensure that Local Authorities’ use of the money was congruent with the wider intentions of the Minister. Each proposal was scrutinized by this panel, and in around a third of cases (n=11), Local Authorities were asked for more detailed plans or clarification of specific points as a result of that scrutiny.
Following approval, Local Authorities made their purchases directly, as this was thought to be the most cost effective procurement method. Invoices were then submitted to the Royal Conservatoire for checking before the funds were transferred.
In general, this process ran smoothly. In a number of cases, the final invoices were for a sum less than the total allocation, usually as a result of an instrument being available at a cost lower than the original estimate, or through a special discount being applied. In such cases, the Royal Conservatoire reimbursed only those funds that were actually spent, and never exceed the allocated sum. In a number of cases, especially in Phase 2, Local Authorities contributed their own funds to the purchase.
A small number of Authorities underspent by an amount that was sufficient to cover the purchase or repair of further instruments. They were requested to review their plans and submit a supplementary order such that the maximum amount possible would be spent as planned.
In Phase 2, Authorities were given the opportunity to make an open bid for an investment in instruments, within the same criteria established for Phase 1, but with the added option to include a partner community organization in the bid. In a small number of instances, Authorities delayed making a Phase 2 bid, and to ensure equity, a sum was held back from the initial allocation for the phase to ensure that these late bids would not be cut off from funding.

Musical Instrument Fund 9
Again, these bids were considered by the scrutiny panel to ensure that they met the aims of the investment. Bids totaling £791,689 were received, meaning that not all Authorities could be allocated the sum requested.
Although the Royal Conservatoire administered the distribution of the investment and established a scrutiny process for proposals and an audit trail for funds, individual Local Authorities were responsible for ensuring that the investment was used as directed by the Minister.
The provision of baseline data on existing instrument stocks was a prerequisite for funding in Phase 1, and it became clear that the diversity of approaches to managing instrument stocks in different Local Authorities meant that this requirement was challenging to some respondents. The Royal Conservatoire, in consultation with HITS, therefore agreed that respondents could provide data in a range of formats, to ensure the most comprehensive dataset possible. Given that range of formats, the different approaches to managing stocks, and a number of issues around terminology (see below), this data was of variable quality. The Royal Conservatoire therefore recruited a Research Assistant to work through the data received, and bring it into a consistent format: nonetheless some caution must be used when interpreting figures on instruments.
Interpreting the Numbers: Data Quality, Terminology and the Problem of Counting This report gives a range of figures on musical instruments in Scotland, both before and after the investment of £1m. For a number of reasons, these figures have to be considered with some caution, and in this section we explore the issues that contribute to a degree of uncertainty in the figures presented, and what we have done to reduce these.
The first aspect of uncertainty arises from the range of ways in which musical instrument stocks are managed in the difference Instrumental Music Services in Scotland. Based on the data received, it is apparent that in some Authorities, all musical resources are managed centrally, and have been accounted for in the returns made by Authorities: in these Authorities, the lists include instruments such as classroom pianos, classroom percussion, sets of recorders located in Primary Schools. In other Authorities, the Instrumental Music Service has a narrower managerial responsibility, dealing only with instruments that are allocated to individual pupils who are taking lessons through the Service. There is therefore a danger in comparing the raw number of instruments available in different Authorities, since the management approaches in different Authorities may mean that we are not comparing equivalent data.
More specifically, we found particular problems with data on the state of repair of musical instruments. In some Authorities, this information was readily available, but in others, it was available for only a subset of instruments, or for none at all. In the main analysis, we therefore distinguish between instruments whose state is ‘confirmed’ (i.e. directly reported) and our own best estimate of the actual state of instruments whose state is unknown (the main analysis gives details of how this estimation is made).

10 Royal Conservatoire of Scotland
A second issue around the data on musical instrument stocks concerns terminology: essentially, what we consider a musical instrument to be. Some returns from Local Authorities included all the resources managed by the Music Service, including music stands and printed music, which we have not included in the totals for musical instruments. Although these instances are clear-cut, there are many that are less so: should we, for example, count a violin bow as a musical instrument? Or a bagpipe chanter? We have tried to account for such issues in our summaries of music instrument numbers: broadly speaking, if the item being counted can be played by itself, then we have considered it to be a musical instrument and have included it in our counting. (Thus, chanters have been counted as individual instruments, but violin bows, and amplifiers for electric instruments have not.) This is not to ignore the absolute necessity of components like bows amplifier or drumsticks, and the fact that their purchase or repair is a legitimate use of the £1m investment; it is merely to help ensure that our totals are not significantly skewed by the inclusion of large numbers of these components.
Even given this methodological decision, there are further issues with counting instruments. Percussion instruments provide the most obvious example: typically (and on the receipts generated by a purchase) a drum kit is regarded as one instrument, even though it usually comprises of at least three cymbals and five drums, including a snare drum, and a range of essential stands and pedals. In contrast, a snare drum purchased by itself for orchestral use would be considered a single instrument.
Data on percussion instruments is especially problematic and should be considered in the light of these complexities. This is why we deal with instrument families in the main analysis – so that the less problematic numbers for string, wind and brass instruments are separated out from percussion. A similar issue arises with instruments for pipe bands (bagpipes, chanters, drums), however, so caution should be used here too.
Finally, in a report that deals with investment in musical instruments, we have to note the potential problems of equating total investment with total number of instruments. The cheapest instruments (according to our working definition) will cost a few pounds. At the other extreme, a high quality ‘auxiliary’ instrument such as a bass clarinet may cost several thousand pounds – and the purchase of either could in principle meet the aims of the investment. Thus, it is essential when considering the data in the main analysis to bear in mind that we should expect very different numbers of instruments to have been purchased using the same (or similar) allocations.

Musical Instrument Fund 11
Project Timeline
December 2012 Ministerial announcement
March 2013 The Royal Conservatoire invites bids from Instrumental Music Services
May 2013 Scrutiny panel established to review bids
August 2013 First payments to Local Authorities made
December 2013 Research assistant contracted to collate data on instrument stocks
April 2014 Majority of payments to Local Authorities completed
Sept 2014 Report commissioned
Oct 2014 Dataset on instrument stocks completed
July 2015 Report completed

12 Royal Conservatoire of Scotland
4. Baseline data on musical instruments in Local Authority Music Services before investment
Introduction In this chapter, we present summary analyses from the baseline data on musical instruments owned by Local Authority Music Services before the present investment of £1m.
Since the quality of data on the condition of instruments is variable, we make a distinction between those instruments whose condition Music Services have confirmed, and those whose state is unknown. To provide a ‘best guess’ of the condition of instruments whose state has not been confirmed, we assume that, across Scotland, those whose condition is known are broadly representative of those whose state is not known, and have divided the instruments of unknown state according to the proportions found nationally for instrument reported as ‘Fit for Purpose’, ‘In Need of Attention’ and ‘In Need of Replacement’.
Summary Baseline Data Table 1 summarises the total number of instruments reported in each Local Authority area, together with their reported state of repair. In total, just over 40,000 instruments were held by Instrumental Music Services before the investment of £1m, of which around 26,000 were confirmed as fit for purpose.
Over 9,000 of the c.40,000 instruments reported by Local Authorities were in an unknown state. Our ‘best guess’ of the state of these instruments, based on the known state of instruments across all Local Authorities, is given in Table 2. Our estimate of the number of instruments that required replacement, before the investment, is around 2200.
These tables indicate that instruments are not evenly distributed geographically around the country.

Musical Instrument Fund 13
Table 1: Total Instruments by Authority, with reported condition
Local Authority Fit for
Purpose Needing
Repair Needing
Replaced Unknown TOTAL
Aberdeen City 0 0 0 3754 3754 Aberdeenshire 1708 117 0 596 2421 Angus 138 49 7 9 203 Argyll and Bute 496 191 34 0 721 Clackmannanshire 220 41 29 0 290 Comhairle nan Eilean Siar 606 5 0 0 611 Dumfries and Galloway 1207 248 75 0 1530 Dundee 1293 166 160 0 1619
East Ayrshire 711 34 33 207 985 East Dunbartonshire 660 171 53 9 893 East Lothian 44 4 0 244 292 East Renfrewshire 0 0 0 611 611 Edinburgh 2295 280 66 0 2641 Falkirk 343 41 27 0 411 Fife 3313 0 0 0 3313 Glasgow 917 241 190 1467 2815 HIghland 2865 122 0 0 2987 Inverclyde 479 66 64 0 609 Midlothian 551 122 15 0 688
Moray 831 34 83 0 948 North Ayrshire 1293 60 0 0 1353 North Lanarkshire 1624 204 85 96 2009 Orkney 0 0 0 99 99 Perth and Kinross 892 375 142 0 1409
Renfrewshire 354 110 55 279 798 Scottish Borders 690 263 47 0 1000 Shetland 0 0 0 1357 1357 South Ayrshire 0 0 0 1088 1088 South Lanarkshire 495 8 0 0 503 Stirling 179 85 10 36 310 West Dunbartonshire 876 209 240 0 1325
West Lothian 1542 362 249 0 2153 SCOTLAND 26622 3608 1664 9852 41746

14 Royal Conservatoire of Scotland
Table 2: Total instruments by Authority, with ‘best guess’ of condition for instruments whose condition was unknown
Local Authority Fit for
Purpose In Need of Attention
In Need of Replacement TOTAL
Aberdeen City 3133 425 196 3754 Aberdeenshire 2205 184 31 2421 Angus 146 50 7 203 Argyll and Bute 496 191 34 721 Clackmannanshire 220 41 29 290 Comhairle nan Eilean Siar 606 5 0 611 Dumfries and Galloway 1207 248 75 1530 Dundee 1293 166 160 1619 East Ayrshire 884 57 44 985 East Dunbartonshire 668 172 53 893 East Lothian 248 32 13 292 East Renfrewshire 510 69 32 611 Edinburgh 2295 280 66 2641 Falkirk 343 41 27 411 Fife 3313 0 0 3313 Glasgow 2142 407 267 2815 Highland 2865 122 0 2987 Inverclyde 479 66 64 609 Midlothian 551 122 15 688 Moray 831 34 83 948 North Ayrshire 1293 60 0 1353 North Lanarkshire 1704 215 90 2009 Orkney 83 11 5 99 Perth and Kinross 892 375 142 1409 Renfrewshire 587 142 70 798 Scottish Borders 690 263 47 1000 Shetland 1133 154 71 1357 South Ayrshire 908 123 57 1088 South Lanarkshire 495 8 0 503 Stirling 209 89 12 310 West Dunbartonshire 876 209 240 1325 West Lothian 1542 362 249 2153 SCOTLAND 34845 4723 2178 41746

Musical Instrument Fund 15
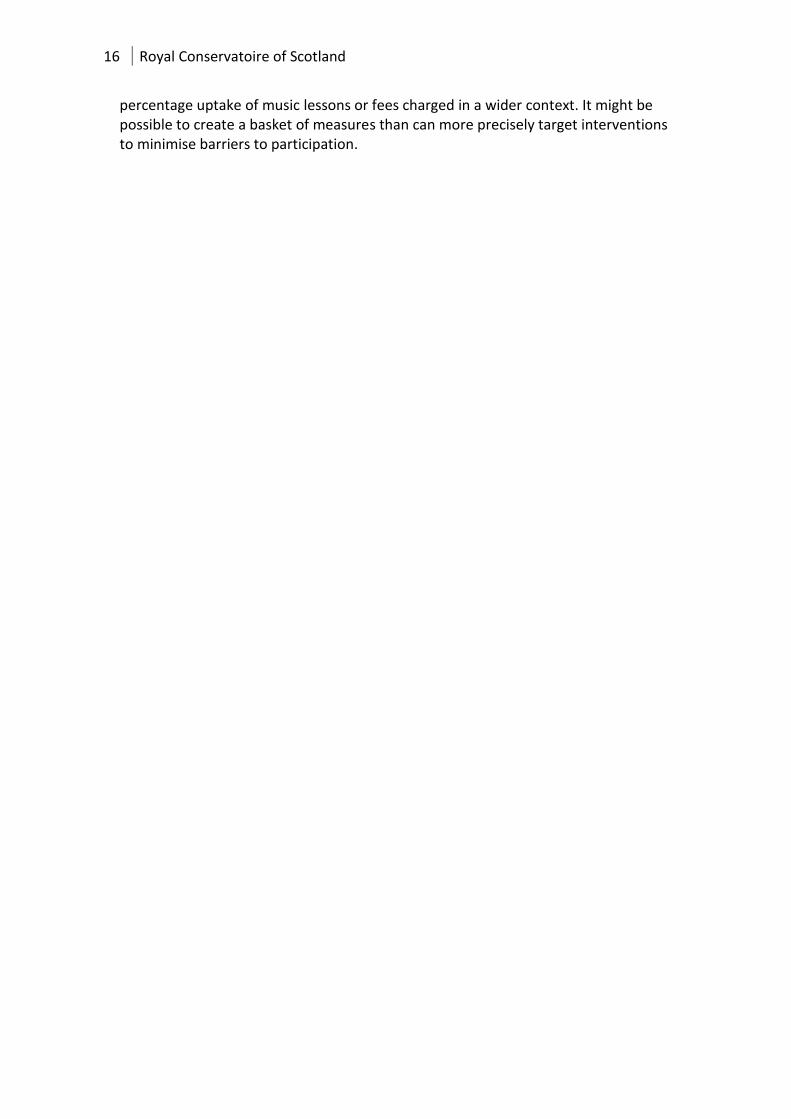
Baseline Data in detail The tables above show considerable variation in the size of musical instrument stocks. In Table 3, below, the number of instruments in each Authority area is compared firstly with the total number of pupils enrolled (2014), with the number expressed as ‘instruments per 100 pupils’. Bearing in mind the proportion of instruments in need of repair or replacement, and our method of estimating the state of instruments whose condition is unknown, a similar ratio is then calculated for the number of instruments estimated to be fit for purpose (FFP), per 100 pupils.
This table reveals some startling variation across the country, and is our best estimate of the distribution of instruments in different Local Authority areas. Given the caveats mentioned above regarding counting instruments, these numbers should be treated with some caution: nonetheless, the regional variations go beyond what might reasonably be expected from variations in reporting, and show some areas that seem to have particularly small instrument stocks. If access to an instrument is a barrier to accessing the learning offered by an Instrumental Music Service, then this data suggests that that barrier is felt more acutely in some areas than in others. Those in the bottom 25% of Authorities in terms of estimated FFP instruments per 100 pupils are indicated in italics.
Table 4 takes the same approach, but compares the number of instruments to the number of Instrumental Music Service pupils (2013). Once again, the total number of instruments is compared to the total number of pupils, expressed here as ‘Instruments per 10 IMS pupils’. Then, the same ratio is given for our best estimate of fit for purpose instruments.
Once again, this table reveals considerable variation across the country. Bearing in mind that our total number of instruments includes a considerable number of percussion instruments, it is likely that these numbers are an overestimate of the provision of instruments to Instrumental Music Service pupils: certainly, those authorities who seem to have more than one instrument per Music Service pupil are likely to be those whose reporting of instruments included more detail on classroom instruments and percussion: they should not be considered to have ‘surplus’ instruments on the basis of this analysis. Again, those in the bottom 25% of Authorities by in terms of FFP instruments per 10 Music Service pupils are indicated in italics: these are Authority areas where, on the basis of this data, it seems likely that private ownership of instruments is most prevalent in Instrumental Music Service pupils.
Across the nation as a whole, we estimate that around 6 in 10 Instrumental Music Service pupils had access to an instrument that is fit for purpose, with the remainder requiring to source an instrument privately. Given the previously mentioned caveats about numbers of instruments, the true availability of instruments is likely to be lower still – perhaps around half of all Instrumental Music Service pupils (some 28,000 pupils) are providing their own instrument.
Notwithstanding the caveats surrounding the quality of the data on which these statistics are calculated, there would be merit in comparing these results with other data on individual Instrumental Music Services, to place data on (for example)
16 Royal Conservatoire of Scotland
percentage uptake of music lessons or fees charged in a wider context. It might be possible to create a basket of measures than can more precisely target interventions to minimise barriers to participation.
Musical Instrument Fund 17
Table 3: Instruments per 100 pupils
Local Authority TOTAL Instruments
Estimated FFP
Instruments
Pupils enrolled
2014
Instruments per 100
pupils
Estimated FFP instruments
per 100 pupils
Aberdeen City 3754 3133 22,061 17 14 Aberdeenshire 2421 2205 35,040 7 6 Angus 203 146 15,114 1 1 Argyll and Bute 721 496 10,565 7 5 Clackmannanshire 290 220 6,564 4 3 Comhairle nan Eilean Siar 611 606 3,361 18 18 Dumfries and Galloway 1530 1207 18,847 8 6 Dundee 1619 1293 17,689 9 7 East Ayrshire 985 884 15,958 6 6 East Dunbartonshire 893 668 16,205 6 4 East Lothian 292 248 13,716 2 2 East Renfrewshire 611 510 16,446 4 3 Edinburgh 2641 2295 46,948 6 5 Falkirk 411 343 21,341 2 2 Fife 3313 3313 48,556 7 7 Glasgow 2815 2142 65,516 4 3 Highland 2987 2865 30,791 10 9 Inverclyde 609 479 10,011 6 5 Midlothian 688 551 12,041 6 5 Moray 948 831 12,048 8 7 North Ayrshire 1353 1293 18,169 7 7 North Lanarkshire 2009 1704 49,028 4 3 Orkney 99 83 2,662 4 3 Perth and Kinross 1409 892 17,750 8 5 Renfrewshire 798 587 23,245 3 3 Scottish Borders 1000 690 14,553 7 5 Shetland 1357 1133 3,226 42 35 South Ayrshire 1088 908 14,005 8 6 South Lanarkshire 503 495 43,240 1 1 Stirling 310 209 12,339 3 2 West Dunbartonshire 1325 876 26,273 5 3 West Lothian 2153 1542 12,365 17 12 SCOTLAND 41746 34845 675,673 6 5

18 Royal Conservatoire of Scotland
Table 4: Instruments per 10 IMS pupils
Local Authority TOTAL
Instruments
Estimated FFP
Instruments
IMS Pupils (2013)
Instruments per 10 IMS
pupils
Estimated FFP Instruments
per 10 IMS pupils
Aberdeen City 3754 3133 2,642 14 12 Aberdeenshire 2421 2205 3,025 8 7 Angus 203 146 1,200 2 1 Argyll and Bute 721 496 1,435 5 3 Clackmannanshire 290 220 448 7 5 Comhairle nan Eilean Siar 611 606 500 12 12 Dumfries and Galloway 1530 1207 1,317 12 9 Dundee 1619 1293 2,669 6 5 East Ayrshire 985 884 783 13 11 East Dunbartonshire 893 668 1,600 6 4 East Lothian 292 248 1,318 2 2 East Renfrewshire 611 510 1,938 3 3 Edinburgh 2641 2295 4,912 5 5 Falkirk 411 343 965 4 4 Fife 3313 3313 3,161 11 10 Glasgow 2815 2142 4,551 6 5 Highland 2987 2865 3,200 9 9 Inverclyde 609 479 - - - Midlothian 688 551 1,100 6 5 Moray 948 831 850 11 10 North Ayrshire 1353 1293 1,627 8 8 North Lanarkshire 2009 1704 3,670 6 5 Orkney 99 83 500 2 2 Perth and Kinross 1409 892 1,605 9 6 Renfrewshire 798 587 1,280 6 5 Scottish Borders 1000 690 862 12 8 Shetland 1357 1133 561 24 20 South Ayrshire 1088 908 1,319 8 7 South Lanarkshire 503 495 3,029 2 2 Stirling 310 209 844 4 2 West Dunbartonshire 1325 876 891 15 10 West Lothian 2153 1542 2,395 9 6 SCOTLAND 41746 34845 56,197 7 6

Musical Instrument Fund 19
The total number of instruments in each instrumental ‘family group’ – strings, woodwind, etc. – in each Local Authority area is given in Table 5 below, together, for reference, with the number in each family that has been reported as fit for purpose.
The ‘families’ are conventionally conceived, and within the table below, ‘Strings’ includes guitars; saxophones are considered woodwind instruments, and keyboards includes both electronic keyboards and pianos. ‘Pipe Band Instruments’ includes pipes, chanters and drums, where these are specifically earmarked for Pipe Band use.
The numbers for Music Technology are low, perhaps because these resources tend to be managed at the school level and overseen by classroom teachers, rather than instrumental instructors. Likewise, it is likely that ‘Keyboards’ includes some instruments that are mainly used for classroom use.
The numbers of percussion instruments should be treated with caution for the reasons mentioned above: nonetheless, this disaggregation is useful because it illustrates the extent of the uncertainty in counting that percussion instruments introduce: such instruments account for just over 3000 instruments out of nearly 42000 recorded, which is why we are reasonably justified in saying that there are around 40000 instruments in total.
This table demonstrates the range of profiles of opportunities on offer in Music Services, with some services, for example, having a relatively large stock of brass instruments to support a local brass band tradition. There is considerable variety across the nation.

20 Royal Conservatoire of Scotland
Table 5: Breakdown of instrument numbers by family, with those reported 'fit for purpose' (FFP)
Local Authority Strings Woodwind Brass Percussion Keyboards Pipe Band Instruments
Music Technology
Harps Miscellaneous TOTAL
All FFP All FFP All FFP All FFP All FFP All FFP All FFP All FFP All FFP All FFP
Aberdeen City 1412 0 1042 0 1094 0 151 0 11 0 41 0 3 0 0 0 0 0 3754 0
Aberdeenshire 1286 875 544 344 501 408 62 59 28 22 0 0 0 0 0 0 0 0 2421 1708
Angus 44 17 72 50 85 69 0 0 0 0 2 2 0 0 0 0 0 0 203 138
Argyll and Bute 149 115 353 201 191 152 28 28 0 0 0 0 0 0 0 0 0 0 721 496
Clackmannanshire 143 106 59 43 73 64 0 0 0 0 15 7 0 0 0 0 0 0 290 220
Comhairle nan Eilean Siar
168 166 0 0 0 0 20 20 150 150 273 270 0 0 0 0 0 0 611 606
Dumfries and Galloway
514 421 569 395 444 388 0 0 0 0 3 3 0 0 0 0 0 0 1530 1207
Dundee 714 565 296 257 535 413 0 0 39 25 35 33 0 0 0 0 0 0 1619 1293
East Ayrshire 186 157 179 169 505 270 23 23 0 0 92 92 0 0 0 0 0 0 985 711
East Dunbartonshire
368 276 176 120 225 140 122 122 0 0 1 1 0 0 0 0 1 1 893 660
East Lothian 174 14 58 10 56 18 4 2 0 0 0 0 0 0 0 0 0 0 292 44
East Renfrewshire 186 0 202 0 147 0 45 0 8 0 15 0 0 0 8 0 0 0 611 0
Edinburgh 1059 940 466 362 364 310 523 472 204 190 0 0 0 0 25 21 0 0 2641 2295
Falkirk 172 150 98 82 141 111 0 0 0 0 0 0 0 0 0 0 0 0 411 343
Fife 1695 169 833 833 661 661 109 109 0 0 0 0 0 0 15 15 0 0 3313 3313

Musical Instrument Fund 21
Local Authority Strings Woodwind Brass Percussion Keyboards Pipe Band Instruments
Music Technology
Harps Miscellaneous TOTAL
5
Glasgow 1000 396 420 213 456 187 600 74 285 46 19 0 29 1 6 0 0 0 2815 917
Highland 1292 1242
490 455 336 314 167 167 5 5 695 681 0 0 2 1 0 0 2987 2865
Inverclyde 125 103 232 179 244 189 0 0 0 0 8 8 0 0 0 0 0 0 609 479
Midlothian 235 182 190 142 211 180 43 41 0 0 0 0 0 0 9 6 0 0 688 551
Moray 510 484 338 279 55 55 45 13 0 0 0 0 0 0 0 0 0 0 948 831
North Ayrshire 499 473 399 386 328 309 64 62 0 0 63 63 0 0 0 0 0 0 1353 1293
North Lanarkshire 338 257 525 446 886 695 145 129 42 25 62 62 0 0 11 10 0 0 2009 1624
Orkney 47 0 0 0 0 0 19 0 32 0 0 0 1 0 0 0 0 0 99 0
Perth and Kinross 558 315 409 322 364 183 31 31 8 8 39 33 0 0 0 0 0 0 1409 892
Renfrewshire 99 80 203 144 481 115 15 15 0 0 0 0 0 0 0 0 0 0 798 354
Scottish Borders 391 179 249 207 278 224 82 80 0 0 0 0 0 0 0 0 0 0 1000 690
Shetland 291 0 172 0 1 0 717 0 157 0 1 0 5 0 1 0 12 0 1357 0
South Ayrshire 503 0 141 0 299 0 71 0 20 0 54 0 0 0 0 0 0 0 1088 0
South Lanarkshire 246 246 45 45 51 45 140 138 21 21 0 0 0 0 0 0 0 0 503 495
Stirling 150 69 72 49 86 59 0 0 0 0 2 2 0 0 0 0 0 0 310 179
West Dunbartonshire
582 420 380 242 363 214 0 0 0 0 0 0 0 0 0 0 0 0 1325 876
West Lothian 550 392 396 279 981 693 141 93 0 0 85 85 0 0 0 0 0 0 2153 1542
SCOTLAND 15686 9608 10442 3367 1010 1505 38 77 13 41746 26622

22 Royal Conservatoire of Scotland
5. The Scottish Government investment
Introduction In the previous chapter, we explored the baseline data that was provided by Local Authorities as a condition of receiving their allocated funds in Phase 1 of the investment. In this chapter, we look more closely at the investment itself, the distribution of funds, and the uses to which the money was put.
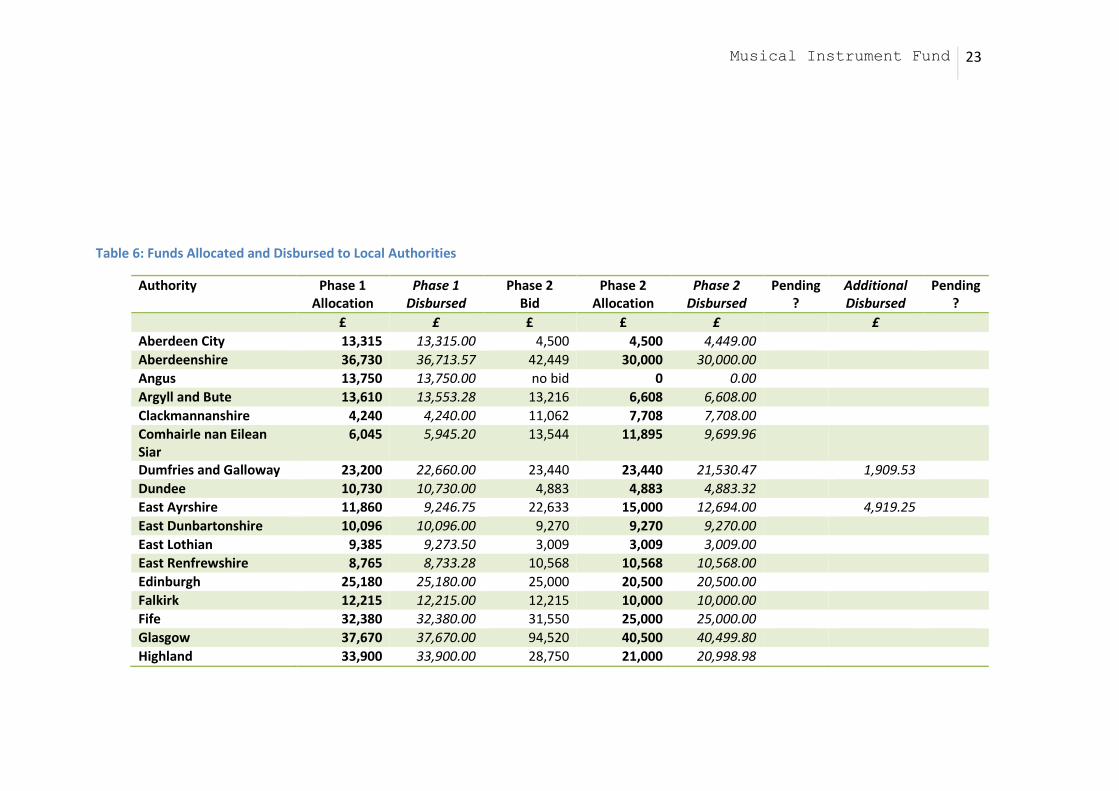
Allocations to Local Authority Music Services
Table 6 below gives the allocations made to each Local Authority in Phase 1 of the investment, together with each Authority’s bid for funds in Phase 2, and the actual allocation. Additional allocations, usually to take account of an underspend in Phase 1, are also given, and monies that remain unclaimed at the time of writing are marked ‘Pending’.
From this table, it will be observed that many Authorities made a bid in Phase 2 of the investment that was roughly equal to the amount they had been allocated in Phase 1, though there were notable exceptions. A small number of Authorities made no Phase 2 bid.
Repair or Replace? Instrumental Music Services were free to use the funding to purchase new instruments, or to repair existing stock. Many chose only to invest in new instruments, as Table 7 below, indicates – and only a very small proportion of the total investment was used to repair existing instruments.
Musical Instrument Fund 23
Table 6: Funds Allocated and Disbursed to Local Authorities
Authority Phase 1 Allocation
Phase 1 Disbursed
Phase 2 Bid
Phase 2 Allocation
Phase 2 Disbursed
Pending?
Additional Disbursed
Pending?
£ £ £ £ £ £
Aberdeen City 13,315 13,315.00 4,500 4,500 4,449.00
Aberdeenshire 36,730 36,713.57 42,449 30,000 30,000.00
Angus 13,750 13,750.00 no bid 0 0.00
Argyll and Bute 13,610 13,553.28 13,216 6,608 6,608.00
Clackmannanshire 4,240 4,240.00 11,062 7,708 7,708.00
Comhairle nan Eilean Siar
6,045 5,945.20 13,544 11,895 9,699.96
Dumfries and Galloway 23,200 22,660.00 23,440 23,440 21,530.47 1,909.53
Dundee 10,730 10,730.00 4,883 4,883 4,883.32
East Ayrshire 11,860 9,246.75 22,633 15,000 12,694.00 4,919.25
East Dunbartonshire 10,096 10,096.00 9,270 9,270 9,270.00
East Lothian 9,385 9,273.50 3,009 3,009 3,009.00
East Renfrewshire 8,765 8,733.28 10,568 10,568 10,568.00
Edinburgh 25,180 25,180.00 25,000 20,500 20,500.00
Falkirk 12,215 12,215.00 12,215 10,000 10,000.00
Fife 32,380 32,380.00 31,550 25,000 25,000.00
Glasgow 37,670 37,670.00 94,520 40,500 40,499.80
Highland 33,900 33,900.00 28,750 21,000 20,998.98

24 Royal Conservatoire of Scotland
Authority Phase 1 Allocation
Phase 1 Disbursed
Phase 2 Bid
Phase 2 Allocation
Phase 2 Disbursed
Pending?
Additional Disbursed
Pending?
Inverclyde 6,770 6,770.00 38,396 5,920 5,920.00
Midlothian 7,845 7,678.00 18,965 8,000 6,603.60 1,563.40 Pending
Moray 11,087 11,079.70 38,700 11,070 10,871.67
North Ayrshire 13,230 13,230.00 43,548 30,717 30,717.00
North Lanarkshire 27,860 27,857.50 35,068 35,068 35,054.16
Orkney 4,230 3,764.23 3,416 3,416 3,416.00
Perth and Kinross 17,055 17,033.00 17,055 17,055 17,055.00 Pending
Renfrewshire 14,520 14,520.00 39,342 15,000 15,000.00
Scottish Borders 15,430 13,980.53 27,410 14,006 14,006.00 888.94
Shetland 5,205 3,979.46 no bid 0 0.00 1,225.54 Pending
South Ayrshire 11,200 11,200.00 13,377 13,377 13,367.55
South Lanarkshire 28,547 28,547.00 29,940 25,000 25,000.00
Stirling 10,040 10,040.00 22,321 10,470 10,470.00 Pending
West Dunbartonshire 7,800 7,749.24 80,548 31,169 31,168.68
West Lothian 15,360 15,360.00 32,994 32,994 32,994.00
Jordanhill School 750 639.60 no bid 0 0.00
Total 500,000 493,029.84 791,689 497,143 489,062.19 10,506.66

Musical Instrument Fund 25
Table 7: Use of Funds to Repair Existing or Purchase New
Authority Phase 1 Disbursed Use of Phase 1 funds
Phase 2 Disbursed
Additional Disbursed
Use of Phase 2 and additional funds
£ New Repair £ £ New Repair Aberdeen City 13315.00 13315.00
4449.00
4449.00
Aberdeenshire 36713.57 34442.57 2271.00 30000.00
30000.00 Angus 13750.00 13750.00
0.00
0.00
Argyll and Bute 13553.28 13553.28
6608.00
6608.00 Clackmannanshire 4240.00 2888.00 1352.00 7708.00
7708.00
Comhairle nan Eilean Siar
5945.20 5375.20 570.00 9699.96
9699.96
Dumfries and Galloway 22660.00 19829.84 2830.16 21530.47 1909.53 23440.00 Dundee 10730.00 10730.00
4883.32
4883.32
East Ayrshire 9246.75 7926.75 1320.00 12694.00 4919.25 17613.25 East Dunbartonshire 10096.00 10096.00
9270.00
9270.00
East Lothian 9273.50 8086.00 1187.50 3009.00
3009.00 East Renfrewshire 8733.28 8733.28
10568.00
10568.00
Edinburgh 25180.00 13139.00 12041.00 20500.00
20500.00 Falkirk 12215.00 12215.00
10000.00
10000.00
Fife 32380.00 30069.64 2310.00 25000.00
25000.00 Glasgow 37670.00 37285.00 385.00 40499.80
40499.80
Highland 33900.00 33900.00
20998.98
20998.98

26 Royal Conservatoire of Scotland
Authority Phase 1 Disbursed Use of Phase 1 funds
Phase 2 Disbursed
Additional Disbursed
Use of Phase 2 and additional funds
Inverclyde 6770.00 6770.00
5920.00
5920.00 Midlothian 7678.00 5878.00 1800.00 6603.60 1563.40 8167.00
part pending Moray 11079.70 11079.70
10871.67
10871.67
North Ayrshire 13230.00 10190.44 3039.56 30717.00
29817.00 900.00 North Lanarkshire 27857.50 27857.50
35054.16
35054.16
Orkney 3764.23 3764.23
3416.00
3416.00 Perth and Kinross 17033.00 17033.00
17055.00
17055.00
pending
Renfrewshire 14520.00 14520.00
15000.00
15000.00 Scottish Borders 13980.53 13980.53
14006.00 888.94 14894.94
Shetland 3979.46 3979.46
0.00 1225.54 1225.54
pending South Ayrshire 11200.00 11200.00
13367.55
13367.55
South Lanarkshire 28547.00 28547.00
25000.00
24500.00 500.00 Stirling 10040.00 10040.00
10470.00
10470.00
pending
West Dunbartonshire 7749.24 7749.24
31168.68
31168.68 West Lothian 15360.00 8770.00 6590.00 32994.00
32994.00
Jordanhill School 639.60 639.60
0.00
SCOTLAND 493029.84 457333.26 35696.22 489062.19 10506.66 498168.85 1400.00 % 92.8% 7.2% 99.7% 0.3%

Musical Instrument Fund 27
Purchase of new instruments When counting the numbers of new instruments purchased as a result of the investment, the same caveats surrounding the counting of instruments that have been mentioned previously apply. Table 8 below, gives numbers of instruments in each instrumental family purchased by each Local Authority, based on the proposals and invoices received.
Drawing on our working definition of a musical instrument, a number of new purchases made by Instrumental Music Services are not reflected in this table, even though these represent legitimate purchases within the aims of the scheme. Such items include new cases for instruments or stands, elements such as mouthpieces or bows, and ‘consumables’ such as strings and bridges for string instruments.
It is worth noting the variety of profiles in the purchases made by individual authorities, which suggests that the procurement approach taken allowed individual Music Services the flexibility to make the purchases that were necessary in their local context. It is important to remember that these numbers include instruments that are very inexpensive alongside those that are especially expensive: many cheaper instruments or fewer expensive instruments could represent a good use of the investment in the context of a particular Music Service. The scrutiny group gave special consideration to bids that seemed overly narrow, but was sensitive to the requirement for the investment to match local needs. Thus, the raw number of instruments purchased reflects the nature of the investment decision made within the Music Service and a higher number should not be considered a marker of particular success.
The disaggregation of percussion instruments allows for a particular source of uncertainty in counting to be taken account of, and allows us to say that the purchase of between 2700 and 3055 individual new instruments was made possible by the investment. Note that this number exceeds our best estimate of the number of instruments that were in need of replacement by at least 500: we are justified in suggesting that the investment has allowed the replacement of all worn out instruments and added at least 500 new instruments to the total stock of instruments in the ownership of Music Services.
In this analysis, guitars have been separated out from ‘Strings’, since it was clear that for a number of Music Services, this was an area of special priority.

28 Royal Conservatoire of Scotland
Table 8: New Instruments Purchased
Local Authority
Strings Woodwind Brass Percussion Keyboards Pipe Band Instruments
Music Technology
Harps Guitars TOTAL
Aberdeen City 17 2 10 29 Aberdeenshire 16 18 29 2 65 Angus 22 39 4 65
Argyll and Bute 37 31 22 90 Clackmannanshire 7 4 8 19 Comhairle nan Eilean Siar 32 12 23 67
Dumfries and Galloway 15 27 40 27 109 Dundee 34 22 20 66 30 172 East Ayrshire 1 47 26 4 78 East Dunbartonshire 12 8 10 21 51
East Lothian 15 12 16 43 East Renfrewshire 24 23 13 26 86 Edinburgh 51 44 26 2 1 10 134 Falkirk 16 17 19 13 3 36 104 Fife 5 2 1 29 96 11 144 Glasgow 22 75 175* 40 24 56 392 Highland 28 5 18 35 24 110

Musical Instrument Fund 29
Local Authority
Strings Woodwind Brass Percussion Keyboards Pipe Band Instruments
Music Technology
Harps Guitars TOTAL
Inverclyde 1 33 34 Midlothian 15 30 15 1 61 Moray 32 8 24 2 66
North Ayrshire 48 50 44 15 157 North Lanarkshire 55 55 23 3 24 135 295 Orkney 4 3 16 21 44 Perth and Kinross 12 18 54 34 118 Renfrewshire 20 72 5 97 Scottish Borders 4 11 10 25 Shetland 2 1 3
South Ayrshire 30 1 20 48 99 South Lanarkshire 28 20 16 4 68 Stirling 35 6 24 65 West Dunbartonshire 13 25 18 56 West Lothian 28 30 39 6 5 108 Jordanhill School 1 1 SCOTLAND 565 680 753 345 42 237 62 11 360 3055
Excluding Percussion 2710 *est.

30 Royal Conservatoire of Scotland
The Outcome of the Investment The overall outcome of the investment in musical instruments can be estimated by returning to our baseline figures for the number of instruments for every 10 Instrumental Music Service pupils. Above, we calculated this ratio for all instruments, and also for our best guess of the number of instruments that are fit for purpose.
Following the investment of £1m, and the purchase of new instruments, a small but clearly discernible impact on these ratios is demonstrated, as shown in Table 9 below.
Once again, this number should be considered indicative, and is likely to be an overestimate of the number of instruments available. Nonetheless, the figures indicate that where there were around 7 instruments for every 10 Instrumental Music Service pupils before the investment, there are now 8. Before investment, we estimate that there were 6 fit-for-purpose instruments for every 10 Instrumental Music Service pupils; by the same method of estimation, there are now 7.
Table 9 present a relatively crude measure and is prone to rounding errors.1 In particular, it should not be used to indicate the relative success of the different approaches in different Local Authorities: where Instrumental Music Services invested in a smaller number of more expensive instruments, they will appear not to have achieved as great an increase by this measure: this does not mean that that investment was not worthwhile.
Nonetheless, the results suggest that an additional instrument for every 10 Instrumental Music Service pupils has been achieved in more than half of all Authorities, and nationally.
1 In Table 9, the difference between pre- and post-investment stocks has been calculated according to the rounded numbers for instruments per 10 IMS pupils; when calculated on unrounded ratios, the differentials change, although the overall picture remains the same.

Musical Instrument Fund 31
Table 9: Instruments per 10 IMS Pupils, after investment
Local Authority TOTAL
Instruments
Estimated FFP
Instruments
IMS Pupils (2013)
Instruments per 10 IMS pupils pre-
investment
Instruments per 10 IMS
pupils post-investment
∂
Estimated FFP Instruments
per 10 IMS pupils pre-
investment
Estimated FFP Instruments per
10 IMS pupils post-
investment
∂
Aberdeen City 3754 3133 2,642 14 14 0 12 12 0 Aberdeenshire 2421 2205 3,025 8 8 0 7 8 1 Angus 203 146 1,200 2 2 0 1 2 1 Argyll and Bute 721 496 1,435 5 6 1 3 4 1 Clackmannanshire 290 220 448 7 7 0 5 5 0 Comhairle nan Eilean Siar 611 606 500 12 14 2 12 13 1 Dumfries and Galloway 1530 1207 1,317 12 12 1 9 10 1 Dundee 1619 1293 2,669 6 7 1 5 5 0 East Ayrshire 985 884 783 13 14 1 11 12 1 East Dunbartonshire 893 668 1,600 6 6 0 4 4 0 East Lothian 292 248 1,318 2 3 1 2 2 0 East Renfrewshire 611 510 1,938 3 4 1 3 3 0 Edinburgh 2641 2295 4,912 5 6 1 5 5 0 Falkirk 411 343 965 4 5 1 4 5 1 Fife 3313 3313 3,161 11 11 0 10 11 1 Glasgow 2815 2142 4,551 6 7 1 5 6 1 Highland 2987 2865 3,200 9 10 1 9 9 0 Inverclyde 609 479 - - - - - - - Midlothian 688 551 1,100 6 7 1 5 6 1 Moray 948 831 850 11 12 1 10 11 1 North Ayrshire 1353 1293 1,627 8 9 1 8 9 1

32 Royal Conservatoire of Scotland
North Lanarkshire 2009 1704 3,670 6 6 0 5 5 0 Orkney 99 83 500 2 3 1 2 3 1 Perth and Kinross 1409 892 1,605 9 10 1 6 6 0 Renfrewshire 798 587 1,280 6 7 1 5 5 1 Scottish Borders 1000 690 862 12 12 0 8 8 0 Shetland 1357 1133 561 24 24 0 20 20 0 South Ayrshire 1088 908 1,319 8 9 1 7 8 1 South Lanarkshire 503 495 3,029 2 2 0 2 2 0 Stirling 310 209 844 4 4 0 2 3 1 West Dunbartonshire 1325 876 891 15 15 0 10 10 0 West Lothian 2153 1542 2,395 9 9 0 6 7 1 SCOTLAND 41746 34845 56,197 7 8 1 6 7 1

Musical Instrument Fund 33
6. Analysis and commentary
Introduction The analysis in the previous chapters focuses on the data generated in the process of allocating the investment in musical instruments, analysing data returned by Instrumental Music Services and the records generated by the Royal Conservatoire in managing the fund.
In this chapter, we turn from the data to consider briefly some of the wider issues that arise from a review of the data and the process of allocating the funds.
Management of Instrument Stocks The most striking issue to arise from the data collected on existing instrument stocks is the way musical instrument stocks are managed in Local Authorities. Colleagues in Instrumental Music Services made great efforts to provide comprehensive data on the instruments that are available to pupils, and the raw data returned to the Royal Conservatoire clearly indicates that there are a number of different approaches to managing musical instrument stocks across the country. These may be summarised as follows:
1. The Local Authority or Instrumental Music Service manages all music resources centrally, including school-based and classroom resources. This was evident from some returns, which included large numbers of classroom percussion, pianos, music technology and printed music.
2. The Local Authority or Instrumental Music Service centrally manages a more narrowly defined set of resources, namely the instruments and associated items (stands, cases etc.) that are used by pupils of the Music Service. Probably the most prevalent form of managing instrument stocks, evident in the returns that were comprehensive in listing the sorts of instruments for which the Music Service provides lessons, but did not include so many classroom instruments.
3. Management of instruments is devolved to individual schools, both Primary and Secondary. A small number of returns indicated that this approach was taken, perhaps reflecting a cluster-based management of Instrumental Music Service staff.
4. Management of instruments is devolved to individual music instructors. A small number of returns indicated that this was how the instruments were managed, with each instructor responsible for a pool of instruments relevant to their specialism.
While those Authorities that took approach 1 or 2 seemed to be able to provide the information more readily, the quality of the data received, particularly in terms of the state of each instrument, seemed to be higher when individual music instructors managed the instrument stock.
There may be value in HITS discussing the different approaches taken in members’ Local Authorities to investigate whether it can assist in supporting members to

34 Royal Conservatoire of Scotland
manage the instrument stocks they have more effectively. There may be lessons to learn from the different approaches that are taken across Local Authorities.
Diversity of Approaches, Diversity of Contexts The data analysed in the preceding chapters clearly indicates the great diversity of approaches and contexts across Scottish Instrumental Music Services.
On the one hand, there is the diversity of provision: the data on instrument stocks, particularly when read in conjunction with other data on Instrumental Music Services, demonstrates the different traditions and tendencies that prevail in different Local Authority areas. The importance of the brass band tradition in certain Authorities, for example, is not only reflected in the numbers of brass instruments held, but actually explains why we find concentrations of brass in certain authorities and not in others. Likewise, the engagement with traditions such as the pipe band varies from Authority to Authority. This diversity is surely a strength, in the sense that in many Authorities, the Music Service’s provision reflects, at some level, local traditions.
On the other hand, the variation in the number of instruments available to each Music Service, when controlled for the total number of pupils in the Authority, or the total number of pupils taking music lessons, is clearly highly problematic, with some Local Authority areas having significantly fewer instruments in proportion to the number of pupils. For some Authorities, this might reflect their relative affluence (with more parents who are able to purchase or hire instruments privately, the need for Authority-owned instruments is perhaps reduced), but it does not augur well for equity of access to music lessons.
The parameters of this investment were necessarily agreed at the outset, before data on instrument stocks was requested or analysed. In the light of the analysis above, a case could be made for a smaller, and more carefully targeted investment in particular areas of need. Given the potentially long working life of a musical instrument, it is reasonable to suspect that these regional variations are the result of historic investment (or lack thereof), perhaps stretching back decades.
The Decision to Buy It is notable that such a large proportion of the available funds was invested in the purchase of new instruments, rather than the repair of existing ones. There may be a number of reasons for this imbalance.
Firstly, it might reflect a decision to increase the overall stock of instruments when the opportunity presented itself – and, bearing in mind the Minister’s intention that the investment should be used to support young musicians who would otherwise miss out on music lessons, this would be a reasonable approach. Alternatively, it might reflect a limited supply of musical instrument repairers (for more on this, see: Apprenticeships in Musical Instrument Repair), and the relative ease of procurement for new instruments (and, perhaps, the question of whether a repair is cost-effective). Finally, it might be the result of purely operational concerns: where instruments are in use by pupils distributed across an Authority, it is much easier to

Musical Instrument Fund 35
purchase new instruments that it is to retrieve existing instruments from pupils, assess and, where necessary, them to a range of specialist instrument repairers.
A Limited Marketplace With almost all the funds invested in new instruments, it is instructive to see where the money was spent. The vast majority of the money was spent with Scottish retailers and, given the small size of the marketplace for musical instruments in Scotland, this meant that a very large proportion of the funds went to a very small number of retailers. Indeed, almost half of the entire fund was spent with a single retailer.
The following chart breaks down the spending according to retailer, picking out the 5 biggest beneficiaries of the funding.
£435,310
£158,882
£112,684
£27,901
£21,863
£53,596
BandSupplies
HaydockMusic
TheWindSec on
Stringers
MacCallum
Others
Figure 1: Local Authority spending, by retailer
Many Music Services were able to secure discounts from the retailers on account of buying in bulk, but given the concentration on a limited number of suppliers, there may be value in exploring a shared procurement process in any future investments – the flexibility of the approach taken on this occasion was certainly a strength, but the almost exclusive focus on a small number of retailers may mean that a shared process would secure better value for money.

36 Royal Conservatoire of Scotland
Concluding remarks The Scottish Government’s decision to invest in musical instruments has paid clear dividends: it has increased the total number of instruments available to Instrumental Music Services, reducing in a modest but clearly discernable way the barrier to participation that exists when instruments are in limited supply. Local Authorities were able to respond according to need, and in a way that reflected their distinctive individual profiles.
In addition to achieving this core aim, the initiative has revealed a range of information about the stocks of musical instruments that are held by Local Authorities across Scotland; the significant regional variations that exist even when the size of different Authorities is taken into account; and the different approaches to managing these stocks that are taken.
The process of analysing the data received from Music Services and generated during the management of the initiative underlines some important issues that may be useful as this work is taken forward: the ambiguities around counting musical instruments and establishing comparisons between Authorities that have different musical traditions, different policy approaches, and different historic inheritances.
Notwithstanding these ambiguities, this analysis offers, for the first time, a picture of the musical instrument stocks in Scotland: how these valuable resources are distributed across the country, their state of repair, and the way they have been reinforced and extended through the strategic investment of the Scottish Government.

Musical Instrument Fund 37
7. Selected Bibliography
Pupils and School Statistics Unit, Scottish Government (2014). Pupil Census 2014 Supplementary Data. Edinburgh: Scottish Government/National Statistics. Available at: http://www.scotland.gov.uk/Topics/Statistics/Browse/School-Education/dspupcensus/dspupcensus, accessed 23 July 2015.
Improvement Service (2014). Instrumental Music Services (IMS): Results from IMS Survey, June 2014. Broxburn: Improvement Service. Available at: http://www.improvementservice.org.uk/documents/research/Music-tuition-report-2014.pdf, accessed 23 July 2015.
Stephen Broad, John De Simone (2015). Apprenticeships in Musical Instrument Repair. Unpublished.
Stephen Broad, Celia Duffy and David Price (2003). What’s Going On? An Audit of Youth Music in Scotland. Edinburgh: Scottish Arts Council. Available at: http://www.scottisharts.org.uk/resources/publications/research/pdf/RES4%20What%27s%20Going%20On-%20Youth%20Music%20Audit.pdf, accessed 30 January 2015
A. B. Cameron et al (1978). Music in Scottish Schools. Edinburgh: HMSO
Rachel Drury (2015). The Wider Benefits of Instrumental Music Learning in Childhood. Unpublished.
David Green et al (2013). Instrumental Music Tuition in Scotland: A Report by the Scottish Government’s Instrumental Music Group. Edinburgh: Scottish Government. Available at: http://www.scotland.gov.uk/Topics/Education/Schools/curriculum/ACE/InstrumentalMusicGroup/GroupReport/InstrumentalMusicTuitioninScotlandReportV2pdf, accessed 30 January 2015.