muscat electricity distribution company - prefaceamna ahmed al zubaidi acting/ chief distribution...
TRANSCRIPT


MEDC Distribution System Capability Statement (2020-2022) – V1.0
P R E F A C E
This Distribution System Capability
Statement (DSCS) is provided by Muscat
Electricity Distribution Company (MEDC) to
fulfil its regulatory obligations under
Condition number 32 of the MEDC
Distribution and Supply Licence as well as the
Oman Distribution Planning Code 4.4.
MEDC supplies electricity to customers
throughout the Muscat Governate as the
owner and operator of its electricity
distribution system originating from the 33kV
busbars of the Oman Electricity Transmission
Company (OETC) 132/33kV grid stations
down to the final customer’s point of
connection; which incorporates 33kV, 11kV
and Low Voltage (LV) distribution system
voltage levels and associated assets.
The aim of this DSCS is to provide an up-to-date distribution system capability for the next three
years (2020-2022) along with data to enable customers in identifying parts of the system; which
offer opportunities for future connections or upgrading of existing connections to the MEDC system
and where constraints currently exist or potentially could exist in future.
In addition to the required data made available annually as part of DSCS; MEDC additionally has
provided improved detailed system connectivity and additional technical asset data, impact analysis
of Cost Reflective Tariff (CRT) on MEDC customers and an overview of the photovoltaic (PV)
system penetration in the MEDC distribution system which is gaining momentum in our licence area
as well. These additions are expected to provide customers and other stakeholders with a
transparent understanding of MEDC distribution system and operational overview, sufficient
technical parameters to undertake initial system capabilities assessment and the overall distribution
system development.
MEDC have determined this three-year plan to clarify and highlight MEDC’s key priorities over the
DSCS planning period. The plan will form the basis for the company’s investments to provide
economic and efficient system development along with serving to inform MEDC’s contributions to
the Oman electricity sector.
Eng. Ala Hassan Moosa
Acting/MEDC Chief Executive Officer

MEDC Distribution System Capability Statement (2020-2022) – V1.0
TABLE OF CONTENTS
PREFACE 1
LIST OF TABLES 5
LIST OF FIGURES 6
LIST OF ABBREVIATIONS 7
1. INTRODUCTION 9
1.1. PURPOSE OF THE STATEMENT ............................................................................................................................ 9 1.2. STRUCTURE OF THIS DSCS .................................................................................................................................. 9
2. PLANNING PHILOSOPHIES AND PRACTICES 11
2.1. OBLIGATIONS OF THE DISTRIBUTION AND SUPPLY LICENCE (D&SL) ............................................................ 11 2.2. REQUIREMENTS OF THE DISTRIBUTION CODE................................................................................................. 12 2.3. DISTRIBUTION SYSTEM SECURITY STANDARD ................................................................................................ 12 2.4. SYSTEM VOLTAGE LEVELS AND CONFIGURATION........................................................................................... 13 2.5. FREQUENCY DEVIATIONS ................................................................................................................................... 14 2.6. VOLTAGE WAVEFORM QUALITY ......................................................................................................................... 14 2.7. VOLTAGE FLUCTUATIONS ................................................................................................................................... 14 2.8. AUTO-RECLOSING AND SINGLE-PHASE PROTECTION OPERATION ............................................................... 14 2.9. DESIGN FAULT LEVELS ........................................................................................................................................ 15 2.10. STANDARD EQUIPMENT SIZES ........................................................................................................................... 15
2.11. TECHNICAL STANDARDS ..................................................................................................................................... 17 2.12. SPECIFICATION OF APPARATUS AND PLANT .................................................................................................... 17 2.13. EARTHING ............................................................................................................................................................. 17 2.14. VOLTAGE REGULATION AND CONTROL ............................................................................................................. 18 2.15. PROTECTION......................................................................................................................................................... 18
3. PLANNING DRIVERS 19
3.1. BACKGROUND ...................................................................................................................................................... 19 3.2. ZONE 1 – (THE EASTERN ZONE) ......................................................................................................................... 21 3.3. ZONE 2 - (THE CENTRAL ZONE) .......................................................................................................................... 24 3.4. ZONE 3 - (THE WESTERN ZONE) ......................................................................................................................... 26
4. MEDC DISTRIBUTION SYSTEM 29
4.1. EXISTING DISTRIBUTION SYSTEM ...................................................................................................................... 29 4.2. SYSTEM DEMAND AND LOAD DURATION ........................................................................................................... 30 4.3. COST REFLECTIVE TARIFF (CRT) ....................................................................................................................... 33 4.4. DEMAND NOT SECURED (DNS) ........................................................................................................................... 34 4.5. SYSTEM DEMAND FORECAST ............................................................................................................................. 35
4.6. GRID SUPPLY POINTS .......................................................................................................................................... 37 4.7. DISTRIBUTION SYSTEM MODELLING AND ANALYSIS ....................................................................................... 40

MEDC Distribution System Capability Statement (2020-2022) – V1.0
4.8. CONTINUOUS IMPROVEMENT AREAS ................................................................................................................ 43 4.9. INFORMATION ON DISTRIBUTION NETWORK ASSETS ..................................................................................... 45
5. CHALLENGES AND OPPORTUNITIES WITHIN THE SYSTEM 46
5.1. NEW CONNECTION APPLICATIONS .................................................................................................................... 46
5.2. SYSTEM CONSTRAINTS AND OPPORTUNITIES ................................................................................................. 48
6. THE INVESTMENT PLAN 49
6.1. SYSTEM DEVELOPMENT PROJECTS DURING THE PERIOD 2020– 2022 ......................................................... 49
APPENDIX A: DISTRIBUTION LICENCE CONDITION 32: DSCS 56
APPENDIX B: DSSS NON-COMPLIANCES 57
APPENDIX C: LIST OF 2019 PV SOLAR APPLICATIONS 58
APPENDIX D: SYSTEM STUDY RESULTS 59

MEDC Distribution System Capability Statement (2020-2022) – V1.0
APPENDIX E: INFORMATION ON DISTRIBUTION SYSTEM ASSETS 125
APPENDIX E1 – 33KV CIRCUITS/FEEDERS DATA ...................................................................................................... 125

MEDC Distribution System Capability Statement (2020-2022) – V1.0
APPENDIX E2 – PRIMARY SUBSTATION TRANSFORMER DATA .............................................................................. 135

MEDC Distribution System Capability Statement (2020-2022) – V1.0
L I S T O F T A B L E S
Table 1 DSSS Classifications and Defined Restoration Times ...................................................... 12
Table 2 System Nominal Voltages and Tolerance ......................................................................... 13
Table 3 Short Circuit Rating of Switchgear .................................................................................... 15
Table 4 Standard 33kV Conductor Sizes and Ratings ................................................................... 15
Table 5 Standard 11kV Conductor Sizes and Ratings ................................................................... 15
Table 6 Standard LV Mains Conductor Sizes and Ratings ............................................................ 16
Table 7 Standard Switchgear Ratings ............................................................................................ 16
Table 8 Zone 1 - Grid and Primary Substations Connectivity ........................................................ 22
Table 9 Zone 2 - Grid and Primary Substations Connectivity6 ....................................................... 25
Table 10 Zone 3 - Grid and Primary Substations Connectivity6 ..................................................... 27
Table 11 Summary of Distribution System Assets ......................................................................... 29
Table 12 Summary of Installed and Firm Capacities of MEDC Distribution System ...................... 29
Table 13 Area Wise Compound Annual Growth Rate[CAGR] % of MEDC Distribution System ... 30
Table 14 Maximum and Minimum System Demands ..................................................................... 31
Table 15 CAGR% Evaluation on the System Maximum Day ......................................................... 36
Table 16 System Maximum Demand in MW [Historical and Forecast] .......................................... 36
Table 17 Technical Losses ............................................................................................................. 43
Table 18 Number of Connection Applications for Bulk Load Application, 11kV and LV Application
........................................................................................................................................................ 46
Table 19 : PV Application and Connection Classification .............................................................. 47
Table 20 2022 Projected Capacity Constraints in MVA ................................................................. 48
Table 21 Status of the Primary Substations at a Glance [2020-2022] .......................................... 49
Table 22 Summary of Sponsored Projects .................................................................................... 49
Table 23 Summary of Planned Projects in MEDC Distribution System to meet Summer 2020
Maximum Demand ......................................................................................................................... 50
Table 24 Summary of Planned Projects in MEDC Distribution System and OETC to meet Summer
2021 Maximum Demand ................................................................................................................ 50
Table 25 Summary of Planned Projects in MEDC Distribution System and OETC to meet Summer
2022 Maximum Demand ................................................................................................................ 50

MEDC Distribution System Capability Statement (2020-2022) – V1.0
L I S T O F F I G U R E S
Figure 1 MEDC Distribution System with GSS ............................................................................... 20
Figure 2 Zone 1 Distribution System with PSS .............................................................................. 21
Figure 3 Zone 2 Distribution System with PSS .............................................................................. 24
Figure 4 Zone 3 Distribution System with PSS .............................................................................. 26
Figure 5 Hourly Demand – System Maximum Day Profile 2012-2019 .......................................... 31
Figure 6 Load Duration Curve ........................................................................................................ 32
Figure 7 Maximum & Minimum Demand with Customer Numbers Growth ................................... 32
Figure 8 MEDC 2018 CRT and Non-CRT Units Sold (MWh) ......................................................... 33
Figure 9 CRT Customer’s Profile on the System Peak Day for 2017 - 2019 ................................. 34
Figure 10 DNS Historical Data ....................................................................................................... 34
Figure 11 System Historical and Forecast Maximum Demand (2006-2022) ................................. 37
Figure 12 33kV Existing System (2019) ......................................................................................... 38
Figure 13 33kV Expected System Development (2020 to 2022) ................................................... 39
Figure 14 No. of Connection Applications (Bulk Load Application, 11kV and LV) Received in 2019
........................................................................................................................................................ 47

MEDC Distribution System Capability Statement (2020-2022) – V1.0
L I S T O F A B B R E V I A T I O N S
AER Authority for Electricity Regulation
CAGR Compound Annual Growth Rate
CRT Cost Reflective Tariff
DCC Distribution Connection Code
DNS Demand Not Secured
DPC Distribution Planning Code
DSCS Distribution System Capability Statement
DSSS Distribution System Security Standard
D&SL Distribution & Supply Licence
GSS Grid Substation
IEC International Electrotechnical Commission
MEDC Muscat Electricity Distribution Company
OES Oman Electrical Standards
OETC Oman Electricity Transmission Company
PCR-5 Price Control Review-5 (2018-2021)
PSS Primary Substation
PSS®SINCAL Power System Simulator®Siemens Network Calculation
PV Photovoltaic
SCADA Supervisory Control And Data Acquisition

MEDC Distribution System Capability Statement (2020-2022) – V1.0
Document Issue and Approval
Issued Date: 31st October 2019
Author: System Planning Department
Name of Document: Three - Year Distribution System Capability Statement (2020-
2022)
Document Version: V 1.0
Quality Assurance & Approval
Author Aisha Saif Al Muqarshi Head of Planning
Reviewer Rimnesh Shah Planning & GIS Manager
Approval Abdul Aziz Mubarak Al Sinani Senior Manager Planning & Asset Management
Authorisation to Issue
Risk,Regulation & Compliance Manager
Amna Ahmed Al Zubaidi
Acting/ Chief Distribution Officer
Yousuf Mohammed Al Mahrooqi
Acting/ Chief Executive Officer
Ala Hassan Moosa
Contact details for further info:
Request for a copy of this DSCS, the associated system studies or for any assistance in interpreting
or clarifying any information contained within it; please contact:
MEDC Planning and GIS Manager
P.O. Box: 1239 Hamriya
P.C. 131 - Oman
Phone: +968 24588514
Email: [email protected]

MEDC Distribution System Capability Statement (2020-2022) – V1.0 9
1 . I N T R O D U C T I O N
1.1. Purpose of the Statement
The information in the Distribution System Capability Statement (DSCS) is published annually to fulfil
MEDC regulatory obligation under Condition 32 of its Distribution and Supply Licence (D&SL) and
Distribution planning code 4.4 of the Oman Distribution Code.
This DSCS is intended to provide an understanding of MEDC’s 33kV, 11kV and LV distribution system
along with presenting MEDC’s development plans for the 33kV and 11kV distribution system for the
years 2020-2022. This statement includes power system data for the station loads, overhead lines,
cable circuits, transformers, switchgear and capacitors which forms the MEDC distribution system and
used in the preparation of distribution system models for the power system studies. The results of
load flow, short circuit studies and system technical losses are presented thereby providing an
assessment of the capability of the distribution system.
Implementation of the system development plans is necessary to meet future forecast demand growth,
maintain and/or improve the capability in the distribution system to meet the system growth and to
address the issues of actual or forecast non-compliance with the Distribution System Security
Standard (DSSS). Implementation of these plans will enhance the available system capacity as well
as potentially increase the number of 33/11.5kV primary substations (PSS) providing enhanced
opportunities for new and increased customer connections.
The impact of MEDC’s forecast demand growth and distribution system development plans on the
Transmission System, which is owned and operated by Oman Electricity Transmission Company
(OETC), has been fully assessed in the development of MEDC’s development plans. Where
appropriate 33kV load transfers from one 132/33kV grid substation (GSS) to another are feasible they
have been considered and where this option is not feasible; applications for additional 132/33kV GSS
capacity have been submitted to OETC, resulting in OETC plans to construct and build additional
132/33kV GSS capacity within the MEDC licence area.
1.2. Structure of this DSCS
The following summarises the structure of this Distribution System Capability Statement:
• Chapter 2 and Chapter 3 provide relevant information associated with MEDC’s licence obligations,
technical standards and system planning drivers along with distribution system connectivity.
• Chapter 4 provides a summary view of the distribution system, together with details of the 2019
demand profile along with projected demand forecast, CRT impact analysis of MEDC system,
system constraints, update on continuous improvement areas on the system for the DSCS,
template of the complete system asset data published this year and a summary of the required
technical power system analysis of the distribution system.
• Chapter 5 summarises the current levels of connection activity within the MEDC system and
provides an overview of the opportunities/challenges new customers potentially could face whilst
identifying the challenges that MEDC face currently along with measures to address them. It also
details the Photovoltaic (PV) system penetration within the distribution system.

MEDC Distribution System Capability Statement (2020-2022) – V1.0 10
• Chapter 6 provides detail of the MEDC and OETC development projects; proposed over the three-
year period 2020 to 2022 to be undertaken within the MEDC licence area.
• Appendices detail the summary of the estimated Distribution System Security Standard (DSSS)
non-compliances, PV system connections; results of the associated power system studies and a
complete set of technical data for the 33kV Circuits and Primary Transformers.

MEDC Distribution System Capability Statement (2020-2022) – V1.0 11
2 . P L A N N I N G P H I L O S O P H I E S A N D P R A C T I C E S
MEDC recognise that it is fundamental to provide sufficient guidance to enable relevant stakeholders
along with current and potential customers to understand the quality of supply that they may receive
from the distribution system; also to enable any person seeking a connection to the system to be able
to understand the distribution system at the intended point of connection.
The DSCS below briefly identifies relevant conditions of the Sector Law and the associated Planning
Codes and Security Standards that MEDC as a regulated entity must adhere to. It further outlines the
key technical standards to which MEDC distribution system is designed and constructed to.
Royal Decree 78/2004 promulgated the Law for the Regulation and Privatisation of the Electricity and
Related Water Sector. Article 90 of the D&SL places an obligation on Distribution Companies to
undertake financing, operation, maintenance, development and expansion of the distribution system
in a safe, economic and efficient manner and in accordance with the relevant performance and
security standards.
2.1. Obligations of the Distribution and Supply Licence (D&SL)
Condition 4 of MEDC Distribution Licence as entitled ‘Implementation of and Compliance with the
Distribution Code’; requires MEDC to become and remain a party to and comply with the provisions
of the Distribution Code. It also requires MEDC to co-operate with other Licensed System operators
in the maintenance and development of the Distribution Code.
Distribution Licence Condition 32 is titled ‘Distribution System Capability Statement’ and requires
MEDC to:
‘On an annual basis, prepare a statement in a form approved by the Authority, showing in
respect of each of the three succeeding financial years, circuit capacity, forecast power flows
and loading on each part of its Distribution System and fault levels for each transmission node.’
Licence Condition 32 also describes further information that needs to be included within the DSCS
relating to:
• Information on the status of the Distribution System, its capacity and envisaged future needs.
• Advising potential customers on parts of the system that are best suited to new connections.
• Information on the potential system constraints to development.
• Provide an overview of current system developments.
• Assessment of technical losses.
The full requirements of Licence Condition 32 are found in Appendix A of this document.
The intent of this DSCS is to provide the information as stated above in a form that is relevant and
useful to its customers; Authority for Electricity Regulation (AER) and other stakeholders.

MEDC Distribution System Capability Statement (2020-2022) – V1.0 12
2.2. Requirements of the Distribution Code
The Distribution Code covers all material technical aspects relating to connections to, and the
operation and use of, the distribution system. The Distribution Code is structured into a number of
specific sections.
The Distribution Planning Code (DPC) 2 states that its objectives include for:
‘the exchange of information and interaction between Licensed Distributors and Distribution System
Users concerning any proposed development of Distribution System User Systems that are to be
connected to the Distribution System’.
DPC 4.4 relates to the obligations of MEDC under its Distribution Licence to produce, on an annual
basis, the Distribution System Capability Statement relating to the three succeeding years.
2.3. Distribution System Security Standard
As part of maintaining an adequate electricity supply to our consumers; MEDC is obliged under its
distribution licence to:
‘plan and develop its Distribution System in accordance with the approved Distribution System
Security Standard’1 and to ‘operate and maintain a safe, efficient and economic Distribution
System in accordance with the Security Standards’2.
Table 1 provides a summary of the DSSS classifications.
Table 1 DSSS Classifications and Defined Restoration Times
Class Demand Group First Outage Second Outage
A Less than 2 MW Repair Time No Requirement
B 2MW to 6MW 3 Hours* No Requirement
C 6MW to 20MW Within 15 minutes Restoration time of planned outage
D 20MW to 100MW Immediately Restoration time of planned outage
E Greater than 100MW Immediately Immediately, 2/3 of demand**
*For 11kV networks in remote areas this restoration time may be extended by the time it reasonably takes for a repair crew to
reach the area with the outage as long as the total restoration time will not exceed 6 hours
**Planned Outages area assumed to be restricted to non-summer periods when due to lower ambient temperatures demand
is reduced and equipment ratings enhanced
The DSSS places an obligation on MEDC to restore supply following a circuit or transformer outage
within maximum time limits determined by the total demand within a Demand Group as highlighted in
Table 1.
1 Licence Condition 31 (4a)
2 Licence Condition 31 (4a) and (4b)
MEDC Distribution System Capability Statement (2020-2022) – V1.0 13
A first outage is a fault or planned outage occurring at any time of the year including the period of
maximum demand. A second outage is a fault outage occurring when an integral part of the system
under consideration is not available due to planned maintenance.
The MEDC 33kV system and 33/11.5kV primary substations fall into DSSS classes B to D with the
majority being in Class C.
Primary substations in Class B have a maximum demand between 2MW and 6MW. Following a first
outage the affected load must be re-supplied within 3 hours. This may be achieved by repair and
restoration of the faulted circuit, manual switching at the 33/11.5kV primary substation with two or
more transformers to re-supply customers from an alternative transformer or manual switching of the
11kV network feeders to re-supply customers from an alternative 33/11.5kV primary substation.
Substations in Class C have a maximum demand between 6MW and 20MW. Following a first outage
the affected load must be re-supplied within 15 minutes. This is achieved by the system configuration
and operational control, operating with parallel circuits and remotely operating the circuit breakers
from the MEDC Distribution Control Centre via SCADA.
The majority of existing MEDC 33/11.5kV primary substations have 2 x 20 MVA transformers with a
N-1 firm capacity of 20MVA. These substations fall into the DSSS Class C classification.
33/11.5kV primary substations in Class D have a maximum demand between 20MW and 100MW.
Following a first outage, the affected load must be re-supplied immediately. Immediate restoration
means allowing an adequate time for an interruption followed by restoration through an automated
transfer switching scheme with restoration effected typically within 60 seconds and upto 3 minutes.
Typically, all new primaries constructed are 33/11.5kV primary substations with 3x20MVA
transformers which fall into the Class D classification.
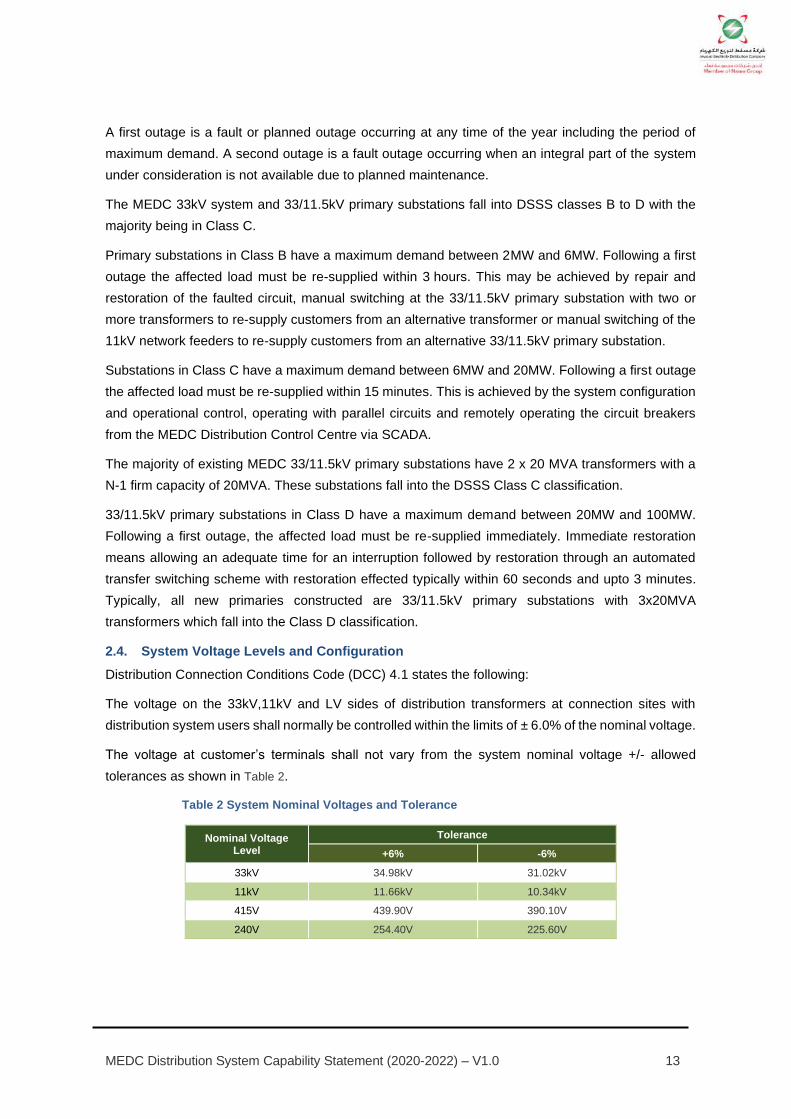
2.4. System Voltage Levels and Configuration
Distribution Connection Conditions Code (DCC) 4.1 states the following:
The voltage on the 33kV,11kV and LV sides of distribution transformers at connection sites with
distribution system users shall normally be controlled within the limits of ± 6.0% of the nominal voltage.
The voltage at customer’s terminals shall not vary from the system nominal voltage +/- allowed
tolerances as shown in Table 2.
Table 2 System Nominal Voltages and Tolerance
Nominal Voltage Level
Tolerance
+6% -6%
33kV 34.98kV 31.02kV
11kV 11.66kV 10.34kV
415V 439.90V 390.10V
240V 254.40V 225.60V

MEDC Distribution System Capability Statement (2020-2022) – V1.0 14
2.5. Frequency Deviations
Distribution Connection Conditions Code (DCC) 4.2 states the following:
During normal operating conditions, the nominal system frequency of the transmission and distribution
systems is 50.00 Hz and normally will be controlled by OETC between 49.95 Hz and 50.05 Hz. During
exceptional steady state conditions, frequency deviations will not exceed 49.90 Hz to 50.10 Hz unless
disturbed circumstances prevail. Under disturbed conditions, System Frequency could rise transiently
to 51.50 Hz or fall to 48.00 Hz.
2.6. Voltage Waveform Quality
Distribution Connection Conditions Code (DCC) 4.3 states the following:
All apparatus and plant connected to the Distribution System and that part of the Distribution System
at each connection point, must be capable of withstanding the distortions of the voltage waveform in
respect of harmonic content and phase unbalance.
The maximum total levels of harmonic distortion on the Distribution System at 33kV and 11kV, from
all sources under both normal, planned outage and fault outage conditions is required to not exceed
a total harmonic distortion of 2.0%, with no individual harmonic greater than 1.5% unless abnormal
conditions prevail. At Low Voltage (LV) the maximum total levels of harmonic distortion from all
sources is required to not exceed a total harmonic distortion of 2.5%.
The maximum negative phase sequence component of the phase voltage on the Distribution System
should remain below 1.0% unless abnormal conditions prevail.
A maximum value of 2.0% is permitted for phase unbalance.
2.7. Voltage Fluctuations
Distribution Connection Conditions Code (DCC) 4.4 states the following:
Voltage fluctuations arising from disturbing or fluctuating loads connected at a connection point to the
distribution system shall not exceed 1.0% of the voltage level for step changes that may occur
repetitively. Any large voltage excursions other than step changes may be allowed up to a level of
3.0% provided that this does not constitute a risk to the distribution system or to any user.
2.8. Auto-reclosing and Single-Phase Protection Operation
Distribution Connection Conditions Code (DCC) 4.5 states the following:
Users should be aware that MEDC may use auto-reclosing or automated sequential switching features
on the distribution system. MEDC will on request provide details of the auto-reclosing or sequential
switching features in order that the user may take this into account in the design of the user system
and protection arrangements.
Distribution system users should be aware that the protection arrangements on some distribution
systems may cause disconnection of one phase or two phases only of a three-phase supply for certain
types of fault.

MEDC Distribution System Capability Statement (2020-2022) – V1.0 15
2.9. Design Fault Levels
The design fault levels for the 33kV, 11kV and LV distribution system are stated in OES 11- General
Specifications for Electrical Materials and Equipment and is shown in Table 3.
Table 3 Short Circuit Rating of Switchgear
Voltage Level Rated Short Circuit Capacity
33 kV 25kA (1429 MVA) for 3 sec
11 kV 18.4kA (350 MVA) for 3 sec
11kV (New)* 25kA (476 MVA) for 3 sec
LV 40kA (29MVA) for 1 sec
*Note that MEDC has adopted the standard for new 11kV primary equipment to be 25kA for 3 seconds.
The 33kV system is earthed via a 12.5-ohm neutral earthing resistor connected to the neutral point of
each grid transformer, thereby limiting the maximum prospective 33kV earth fault current to 1,500 A
per transformer. The 11kV system is solidly earthed.
2.10. Standard Equipment Sizes
Conductors
The standard 33kV to LV feeder conductors along with continuous ampere ratings used by MEDC are
as specified in OES 1-33kV and 11kV Overhead Lines and OES 2-33kV & Pilot,11kV & LT
underground cable installations are shown in Table 4, Table 5 and Table 6.
The continuous ampere ratings shown in Table 4, Table 5 and Table 6 are based on typical
manufacturers data and de-rated for the standard installation conditions mentioned in OES 2-33kV &
Pilot,11kV & LT underground cable installations. These ratings ensure safe working on the MEDC
distribution system given the high temperatures experienced during the summer maximum demand
period.
Table 4 Standard 33kV Conductor Sizes and Ratings
Conductor Type Conductor Size Rated
Capacity De-rated Capacity
33kV Cable 300 sq.mm Cu XLPE 435 Amps (25 MVA)
385 Amps (22 MVA)
33kV Overhead 200 sq.mm ACSR
(Panther) 420 Amps (24 MVA)
*33kV Overhead 150 sq.mm ACSR (Wolf) 350 Amps (20 MVA)
*33kV Overhead 100 sq.mm ACSR (Dog) 269 Amps (15.4 MVA)
* Existing overhead conductor present on system; new lines will typically be constructed of 200sq mm ACSR.
Table 5 Standard 11kV Conductor Sizes and Ratings
Conductor Type Conductor Size Rated
Capacity De-rated Capacity
11kV Cable 240 sq.mm Cu XLPE 431 Amps (8.2 MVA)
351.6 Amps (6.7 MVA)
11kV Cable 185 sq.mm Cu XLPE 374 Amps (7.1 MVA)
304.4 Amps (5.8 MVA)
11kV Overhead 150 sq.mm ACSR (Wolf) 350 Amps (6.7 MVA)
11kV Overhead 100 sq.mm ACSR (Dog) 269 Amps (5.1 MVA)

MEDC Distribution System Capability Statement (2020-2022) – V1.0 16
Table 6 Standard LV Mains Conductor Sizes and Ratings
Conductor Type Conductor Size Rated Capacity
LV mains Cable 240 sq.mm XLPE 455A
LV mains Cable 185 sq.mm XLPE 394A
LV mains Overhead 200 sq.mm ACSR 420A
Transformers
Standard 33/11.5kV transformer sizes are specified in OES 6-33/11.5kV Transformers as being 1, 3,
6, 10MVA ONAN and 20MVA ONAF, although other sizes such as 5 and 16MVA do still exist on the
system. The overload capability above the transformer name-plate rating has been confirmed through
modelling3 and supported by a limited number of measurements. MEDC has standardized on 20MVA
ONAF transformers in the urban areas.
MEDC is studying the feasibility of increasing the 33/11.5kV transformer rating for new substations in
areas of high demand density to cope with the high demand growth and the limitation of available land
in such areas.
Standard as a minimum 11/0.433kV ground mounted transformer sizes specified in OES 5-11kV/433V
distribution transformers are 1000, 500, 315, 200 and 100kVA, whereas 1250,1600,2000,2500 and
3000kVA distribution transformers do exist in the network. The most commonly used distribution
transformers in the network are the ground mounted 500, 1000 and 2000kVA units; which form circa
87% of the distribution transformers on the system. The system also has a range of pole mounted
transformers from 50, 100, 200 and 250kVA to be used as required.
Switchgear
Minimum 33kV and 11kV switchgear ratings are specified in accordance to OES 14-11kV Indoor
Switchgear and OES 15-33kV Indoor Switchgear as shown in Table 7.
Table 7 Standard Switchgear Ratings
Voltage Description Ratings
33kV Feeder 600 A
33kV Bus Section 1200 A
11kV TX Incomer 1200 A
11kV Bus Section 1200/1250* A
11kV Feeder 400/630* A
*MEDC have adopted and standardised to these based on market availability
Capacitors
All new 125 MVA grid substations are designed with a single 20 MVAr capacitor bank connected to
each 33kV busbar section. All new 20 MVA primary substations are designed with a single 5 MVAr
capacitor bank connected to each 11kV busbar section.
3 Based on IEC 60076-7 calculations

MEDC Distribution System Capability Statement (2020-2022) – V1.0 17
The capacitor banks are as specified in OES 13-11.5kV 5MVAr Capacitor Banks and consist of 5 x
1MVAr units with one set of capacitor banks connected to each bus section. The aim of the capacitors
is to ensure that MEDC maintains power factor and voltage to be within prescribed limits to start with
at the 11kV busbars but certainly at the 33kV busbars in accordance to the Grid Code.
2.11. Technical Standards
In order that MEDC can operate a safe and efficient electricity distribution system all apparatus and
plant associated with the connection to the distribution system are required to comply with the
following standards, as applicable:
(a) Health and Safety Rules;
(b) Oman Electrical Standards (OES), which are such national standards as may be approved by and
amended by the AER as necessary;
(c) Grid Code;
(d) Distribution Code;
(e) The standards and recommendations of the International Standards Organisation and the
International Electro Technical Commission (IEC); and
(f) national standards and codes, which are accepted internationally.
2.12. Specification of Apparatus and Plant
The specifications of all connected plant are required to allow the safe operation of the MEDC
distribution system within its operational procedures. Details of this can be obtained by contacting
MEDC directly.
Apparatus and Plant must be suitable to use at the operating frequency and within the intended
operating voltage range. This associated equipment should also be suitable to operate to the
maximum design short-circuit rating of the distribution system to which it is connected having due
regard to fault carrying capabilities including making and breaking duties. As necessary MEDC will
provide additional details of the system at the point at which a specific connection is to be made.
Apparatus and plant must be operated within the thermal rating conditions contained in the appropriate
standards, specifications, and other relevant publications, taking into account its intended use. Upon
request MEDC will provide this information .
2.13. Earthing
MEDC will provide advice on the method of earthing of the distribution system, for example, whether
it is connected solidly to earth or through impedance. The specification of associated apparatus and
plant of the connected customer equipment must meet the voltages that will be imposed on the
apparatus and plant as a result of the method of earthing. The method of earthing must comply with
the requirements of Distribution Connections Code Cl 5.2.1.
Users should take precautions to limit the occurrence and effects of circulating currents in respect of
the neutral points connected with Earth where there is more than one earthed neutral point.

MEDC Distribution System Capability Statement (2020-2022) – V1.0 18
2.14. Voltage regulation and control
Any extension or Connection to the distribution system should be designed so as to not adversely
affect the voltage control employed by MEDC on the distribution system. MEDC will make information
on the voltage regulation and control arrangements available if requested by the User.
2.15. Protection
MEDC’s system and the system of any User must incorporate protective devices to ensure that
apparatus and plant with electrical faults are disconnected from the system promptly and that the
effects of faults on one system do not impose unreasonable risks to other systems.
To ensure satisfactory operation of the distribution system; protection systems, operating times,
discrimination and sensitivity at the ownership boundary must be agreed between MEDC and the User
during the process of application for Connection and may be reviewed from time to time by MEDC
with the agreement of the User.
Back-up protection by operation of other circuit breakers or apparatus and plant having a similar
function must normally be provided to safeguard the system against a circuit breaker, or apparatus
and plant having a similar function, failing to operate correctly to interrupt the fault current on a high
voltage system. During the process of application for Connection, MEDC will advise the User if back-
up protection is not required.
Users must not use protection or associated equipment to limit the fault current infeed to the
distribution system unless expressly permitted by MEDC to avoid protection operation malfunctioning
loading to system assets exceeding short-circuit ratings.

MEDC Distribution System Capability Statement (2020-2022) – V1.0 19
3 . P L A N N I N G D R I V E R S
3.1. Background
MEDC’s electricity distribution system serves around 398,364 customers (as of July 2019) over an
approximate area of 3,900 sq.km and is divided into three geographic zones. Figure 1 represents an
overview of the MEDC distribution system within the Muscat Governorate including the system
boundaries, zones, the GSS and 33/11kV circuits. The characteristics of the distribution system within
the MEDC licence areas differ mainly because of three major parameters:
1) The load density;
2) The type and usage pattern of the customer;
3) The majority type of feeder circuits (i.e. overhead or underground).
The 2019 maximum demand4 recorded for MEDC system was 2479.2 MW (2609.7 MVA on Sunday
- 30th June 2019 at 14:49 Hrs).
The total existing number of 132/33kV grid substations is 345, 33/11.5kV primary substations
connected to the MEDC distribution system is 179 with a Total Installed Capacity of 6,624 MVA and
a firm capacity of 3,735.5 MVA. The tables identifying each Primary Substation capacity and current
demand can be found in the Appendix D.
The sections remaining from this chapter provide the following:
1) An indicative geographical view of the complete MEDC distribution system and zone wise view of
the grid substations, primary substations, 33kV and 11kV circuits;
2) A summary of the individual zone built up and the planning drivers for each zone;
3) It also provides an overview of the complete current MEDC system connectivity including the area
classification for the primaries.
Area name classification in Table 8-Table 10 below refers to the area what that PSS falls under and
hence the associated Compound Annual Growth Area (CAGR) % being applied to that PSS. The
concept of CAGR % and the area classification are explained in detail in Section 4.1.
4 The 2019 OETC system maximum demand day was the same day as well (30th June 2019;afternoon at 14:55 Hrs).
5 The summation of the GSS in the table 8-10 shows 33 as two GSS namely Airport Height and Misfah are duplicated due to the dual feeder
arrangements.

MEDC Distribution System Capability Statement (2020-2022) – V1.0 20
Figure 1 MEDC Distribution System with GSS

MEDC Distribution System Capability Statement (2020-2022) – V1.0 21
3.2. Zone 1 – (The Eastern Zone)
The Zone 1 region includes the capital city of Muscat, Muttrah and an extensive rural network, which
covers the wilayats of Amerat and Quriyat. The number of customers served in the Zone 1 region is
126,956 which is approximately 32% of the total customer population. Figure 2 below provides the
geographical overview of the primary MEDC distribution system in Zone 1.
Figure 2 Zone 1 Distribution System with PSS

MEDC Distribution System Capability Statement (2020-2022) – V1.0 22
Amerat has seen the highest demand growth for the last 4 years within the Zone 1 region validating for
a significant demand growth forecasted for the current planning horizon.
The Muttrah Tourism Development project along with Yitty Tourism Development and Fins Project are
the major upcoming development projects in the planning horizon of this DSCS as of yet. Table 8 below
provides the GSS and primary distribution system connectivity for Zone 1.
Table 8 Zone 1 - Grid and Primary Substations Connectivity6
S. No
Grid Station [G-No]
P-No Primary Station Name Tx -
Config
Installed Capacity
(MVA)
Firm Capacity
(MVA) Area Name
1
Falaj[G23]
P178 Falaj 2 x 16 32 16 Mutrah
2 P018 Darsait 2 x 20 40 20 Mutrah
3 P085 Mutrah Store 2 x 20 40 20 Mutrah
4 P041 Jibrooh 3 x 20 60 40 Ruwi
5 P086 Seaport 2 x 6 12 6 Private
6 P144 P.D.O 4 x 20 80 60 Private
7
Mutrah[G21]
P173 C.B.D 3 x 16 48 32 Mutrah
8 P108 Ruwi Office 2 x 20 40 20 Ruwi
9 P143 M.O.D 1 x 6 6 0 Private
10 P142 Bait Al Falaj 3 x 20 60 40 Mutrah
11 P099 Riyam 2 x 20 40 20 Muscat
12
Wadi Al Kabir[G19] -A
P075 M.B.D. South 2 x 20 40 20 WadiKabir
13 P090 Qasr Al Alam 2 x 20 40 20 Muscat
14 P130 Waljah 2 x 20 40 20 Ruwi
15 P119 Sidab 2 x 6 12 6 WadiKabir
16 P126 Wadi Al Kabir Workshop
2 x 6 12 6 WadiKabir
17 P127 Wadi Al Kabir Housing 1 x 6 6 0 WadiKabir
18 P125 Ali Shihani 2 x 20 40 20 WadiKabir
19 P066 Majlis Oman 2 x 20 40 20 WadiKabir
20
Wadi Al Kabir[G19] -B
P174 Ruwi Valley 2 x 20 40 20 WadiKabir
21 P076 Ruwi Market 2 x 20 40 20 Ruwi
22 P107 Old Airport 2 x 20 40 20 Ruwi
23 P128 Wadi Al Kabir Height 2 x 20 40 20 WadiKabir
24
Wadi Adai[G22]
P005 Amerat 1 2 x 16 32 16 Amerat
25 P089 Qantab 1 x 3 3 0 WadiKabir
26 P017 Al Bustan Palace 2 x 16 32 16 Private
27 P035 Al Hamryah 2 x 20 40 20 WadiAdai
28 P175 Wadi Adai 2 x 20 40 20 WadiAdai
29 P131 Wattaya 2 x 20 40 20 WadiAdai
30 P132 Khoula Hospital 3 x 20 60 40 WadiAdai
31 P136 Al Mahaj 2 x 6 12 6 Amerat
6 All single transformer primary substations firm capacity will be equivalent to the available 11kV transfer capacity on the distribution system; which
is not added to the total firm capacity of the MEDC system due to the dynamic nature.

MEDC Distribution System Capability Statement (2020-2022) – V1.0 23
S. No
Grid Station [G-No]
P-No Primary Station Name Tx -
Config
Installed Capacity
(MVA)
Firm Capacity
(MVA) Area Name
32
Jahloot[G03]
P112 Sawaqim 1 2 x 6 12 6 Sawaqam-O/D
33 P113 Sawaqim 2 1 x 6 6 0 Sawaqam-O/D
34 P137 Tunis Heium 1 x 6 6 0 Hajir-O/D
35 P040 Jahloot 2 x 6 12 6 Jahloot-O/D
36 P120 Siya 2 x 6 12 6 Jahloot-O/D
37 P044 Barr Al Jissah 2 x 20 40 20 Private
38 P068 Al Masarat 2 x 10 20 10 Private
39 P031 Al Hajir 2 x 20 40 20 Hajir-O/D
40 P129 Wadi Al Mayh 1 x 3 3 0 Hajir-O/D
41 P169 Hussan Yiti 2 x 6 12 6 Private
42 P114 Debah 1 x 6 6 0 Sawaqam-O/D
43 P162 ROP Al Saleel 2 x 6 12 6 Private
44 P182 Al Atkiya 1 x 6 6 0 Hajir-O/D
45 P193 Water Pumping 2 x 6 12 6 Private
46 P121 Arqi 1 x 3 3 0 Jahloot-O/D
47
Yiti[G08]
P045 Al Khairan 1 x 6 + 1
x 3 9 3 Yiti-O/D
48 P133 Yenket 1 x 1 + 1
x 3 4 1 Yiti-O/D
49 P145 Saraya Bander 3 x 20 60 40 Private
50 P159 Jabal Al Sifah 3 x 20 60 40 Private
51 P134 Yiti 2 x 3 6 3 Yiti-O/D
52 P135 Al Salam Yiti 1 x 6 6 0 Yiti-O/D
53
Quriyat[G05]
P091 Quriyat 2 x 20 40 20 QuriyatGroup
54 P092 Al Shahbari 2 x 20 40 20 QuriyatGroup
55 P021 Dhagmar 1 4 x 6 24 18 QuriyatGroup-
O/D
56 P019 Dhabab 2 x 6 12 6 QuriyatGroup-
O/D
57 P036 Hail Al Ghaf 2 x 6 12 6 QuriyatGroup-
O/D
58 P074 Al Mazara 2 x 6 12 6 QuriyatGroup-
O/D
59 P124 Wadi Al Arbyeen 1 x 6 6 0 QuriyatGroup-
O/D
60 P020 Street Light 1 x 6 6 0 Private
61 P170 RoyalCamp 1 x 3 3 0 Private
62
Amerat[G10]-A
P177 Amerat 2 1 x 6 6 0 Amerat
63 P006 Al Nahdah 2 x 20 40 20 Amerat
64 P150 Post Office 2 x 20 40 20 Amerat
65 P152 Amerat Heights 2 x 20 40 20 Amerat
66 P179 Amerat 3 3 x 20 60 40 Amerat
67
Amerat[G10]-B
P194 Al Jufaina 1 x 6 6 0 Amerat
68 P118 Seih Dhabi 2 x 16 32 16 Amerat
69 P065 Madinat Al Nahdah7 2 x 20 40 20 Amerat
Dhagmar [GP11] It is a 132/11kV Grid Station. So, no PSS is connected in this Grid.
7 Madinat Al Nahdah – P065 is having split feeder source arrangement with Feeder 1 connected from Amerat B grid and Feeder 2 connected from
Jahloot grid.

MEDC Distribution System Capability Statement (2020-2022) – V1.0 24
3.3. Zone 2 - (The Central Zone)
The Zone 2 region covers the commercial and residential areas of Bousher, Al Khuwair, Al Ansab,
Azaibah, Al Gubrah, Madinat Al-Sultan Qaboos (MSQ) and Qurum. The number of customers served
in the Zone 2 region is 115,033 which is approximately 29% of the total customer population. Figure 3
below provides the geographical overview of the primary MEDC distribution system in Zone 2.
Figure 3 Zone 2 Distribution System with PSS
The Mall of Oman is the largest expected commercial project along with Intercontinental Hotel
(Expansion), Sarooj area developments, ROP projects in Airport Height area, Madinat Al Irfan
Development project to come in the planning horizon of this DSCS as of yet. Table 9 below provides
the GSS and primary distribution system connectivity for Zone 2.

MEDC Distribution System Capability Statement (2020-2022) – V1.0 25
Table 9 Zone 2 - Grid and Primary Substations Connectivity6
S. No Grid Station [G-No] P-No Primary Station Name Tx -Config Installed Capacity
(MVA) Firm Capacity
(MVA) Area Name
1
Ghubrah 2[G09]
P012 Azaibah North 2 2 x 20 40 20 Azaibah
2 P014 Azaibah South 1-A 2 x 20 40 20 Azaibah
3 P149 Ghubrah North 2 3 x 20 60 40 Azaibah
4 P023 Ghubrah North 1 3 x 20 60 40 Azaibah
5 P022 Diplomatic City 3 x 20 60 40 Sarooj
6 P166 Ghubrah GPS 2 x 16 32 16 Private
7
MSQ[GP06]-A
P054 Al Khuwair North 3 x 20 60 40 Khuwair
8 GP06 MSQ Grid 2 x 20 40 20 MSQ
9 P097 Royal Office 2 x 20 40 20 Private
10 P109 Intercontinental 2 x 20 40 20 Sarooj
11 P038 Information City 2 1 x 5 5 0 Private
12 P110 Sarooj -Shati Al Qurum 2 x 20 40 20 Sarooj
13
MSQ[GP06]-B
P053 Al Khuwair 25 2 x 20 40 20 Khuwair
14 P146 Al Khuwair School 3 x 20 60 40 Khuwair
15 P083 MSQ 1 2 x 20 40 20 MSQ
16 P111 ROP -Shati Al Qurum 2 x 20 40 20 Sarooj
17 P039 Digital TV Studio 2 x 20 40 20 Private
18
Qurum[G06]
P037 Information City 1 2 x 20 40 20 Sarooj
19 P093 Qurum 1 2 x 16 32 16 Qurum
20 P094 Qurum 2 2 x 20 40 20 Qurum
21 P095 Lulai 2 x 20 40 20 Qurum
22 P155 MSQ 2 3 x 20 60 40 MSQ
23 P096 Rabiat Al Qurum 2 x 20 40 20 Qurum
24
Bousher[GP02]-A
P147 Azaibah South 1-B 3 x 20 60 40 Azaibah
25 GP02 Bousher Grid 2 x 20 40 20 Bousher
26 P052 Al Khuwair South 3 x 20 60 40 Khuwair
27 P050 Al Khuwair 17/1 2 x 20 40 20 Khuwair
28 P024 Royal Hospital 3 x 20 60 40 GhubrahSouth
29
Bousher[GP02]-B
P007 Al Ansab 1 2 x 20 40 20 Ansab
30 P011 Azaibah North 1 2 x 20 40 20 Azaibah
31 P026 Ghubrah South 1 3 x 20 60 40 GhubrahSouth
32 P051 Holiday Inn 3 x 20 60 40 Khuwair
33 P084 Al Muna 2 x 20 40 20 Bousher
34 P163 Bousher 2 3 x 20 60 40 Bousher
35 P055 Tilal Al Khuwair 3 x 20 60 40 Khuwair
36
Ghala[G11]
P008 Al Ansab 2 2 x 20 40 20 Ansab
37 P165 Oman Exhibition 3 x 20 60 40 Private
38 P156 Ghala 2 3 x 20 60 40 Ansab
39 P167 MOD Al Ansab 2 x 10 20 10 Private
40 P009 Al Ansab STP 2 x 20 40 20 Private
41
Airport Height [G01]
P015 Ghala 1 2 x 20 40 20 Azaibah
42 P002 Airport Height 2 2 x 20 40 20 Airport
43 P001 Airport Height 1 2 x 20 40 20 Airport
44 P013 Azaibah North 3 3 x 20 60 40 Azaibah
45 P151 Airport Height 5 2 x 20 40 20 Airport
46 P003 Airport Height 3 2 x 20 40 20 Airport
47 P172 ROP Hospital 1 x 6 6 0 Private
48 P004 Airport Height 4 2 x 20 40 20 Airport
49 Ghala Heights[G24] P171 Mall of Oman 3 x 20 60 40 Private
50 Misfah[G04] P139 Al Awabi 3 x 6 18 12 Misfah

MEDC Distribution System Capability Statement (2020-2022) – V1.0 26
3.4. Zone 3 - (The Western Zone)
The Zone 3 region includes the Muscat International Airport, Rusail Industrial Area, Seeb, Mawalleh, Al
Khoud ,Al Hail and Mabelah areas. The number of customers served in the Zone 3 region is 156,375
which is approximately 39% of the total customer population. Figure 4 below provides the geographical
overview of the primary MEDC distribution system in Zone 3.
Figure 4 Zone 3 Distribution System with PSS
Mabelah area is one of the largest commercial and residential areas located within the Zone 3 region.
These developments will be in the commercial and residential areas.
Rusail industrial area is earmarked for some significant development projects by Public Establishment
for Industrial Estates(PEIE) and Knowledge Oasis Muscat(KOM), Al Mouj Expansion and Naseem
A’Saba development within this planning horizon. Table 10 below provides the GSS and primary
distribution system connectivity for Zone 3.

MEDC Distribution System Capability Statement (2020-2022) – V1.0 27
Table 10 Zone 3 - Grid and Primary Substations Connectivity6
S. No Grid Station [G-No] P-No Primary Station Name Tx -Config Installed Capacity
(MVA)
Firm Capacity
(MVA) Area Name
1 Airport Height[G01] P081 MOD Technical College 2 x 20 40 20 Airport
2
Misfah[G04]
P080 Al Misfah 3 x 20 60 40 Misfah
3 P192 Orpic 2 x 6 12 6 Private
4 P079 Cement Factory 1 2 x 31.5 + 3x20 123 91.5 Private
5
Rusail Industry[G13]-A
P122 SQU 1 3 x 16 48 32 Private
6 P123 SQU 2 2 x 16 32 16 Private
7 P103 Rusail Industrial 1 2 x 16 32 16 Rusail
8 P104 Rusail Industrial 28 2 x 20 40 20 Rusail
9 P042 Al Jifnain 1 x 6 6 0 Jifnain-O/D
10 P088 Cement Housing 2 x 5 10 5 Private
11
Rusail Industry[G13]-B
P105 Rusail Industrial 3 2 x 20 40 20 Rusail
12 P056 Rusail Housing 2 x 20 40 20 Rusail
13 P106 Rusail Private Factory 2 x 20 40 20 Rusail
14 P164 Rusail08(KOM) 3 x 20 60 40 Rusail
15 P161 ROP Al Khoud 2 x 20 40 20 Private
16 P158 Rusail Industrial 4 3 x 20 60 40 Rusail
17 P160 SQU 3 3 x 20 60 40 Private
18
Barka[G02]
P067 Manomah 2 x 20 40 20 Private
19 P061 Mabelah South 2 x 20 40 20 Mabelah
20 P033 Palace Communication 1 x 6 6 0 Private
21 P034 RGO Halban Camp 1 x 5 5 0 Private
22
Mabelah[GP04]
GP04 Mabelah Grid 2 x 20 40 20 Mabelah
23 P063 Mabelah A 3 x 20 60 40 Mabelah
24 P116 Sur Al Hadid 2 x 20 40 20 Seeb
25 P059 Old Mabelah9 2 x 20 40 20 Mabelah
26 P016 Botanic Garden 2 x 20 40 20 Private
27 P141 Mabelah South PH-7 3 x 20 60 40 Mabelah
28 P191 Mabelah Industrial 1 x 6 6 0 Mabelah
29 P183 ROP Dog Kennel 2 x 6 12 6 Private
30 P190 Mabelah PH-5 1 x 6 6 0 Mabelah
31 P140 Mabelah STP 2 x 10 20 10 Private
32
Mabella 2[G12]
P060 Mabelah Shabiya 3 x 20 60 40 Mabelah
33 P064 Mabelah C 3 x 20 60 40 Mabelah
34 P062 Mabelah South PH-4 3 x 20 60 40 Mabelah
35 P157 Mabelah South PH-8 3 x 20 60 40 Mabelah
36 P168 Palm Mall 3 x 20 60 40 Mabelah
37
Seeb[GP08]-A
P046 Al Khoud Shabiya 2 x 20 40 20 Khoud
38 P047 New Al Khoud10 2 x 20 40 20 Khoud
39 P098 Wadi Bahayis (RGO) 2 x 20 40 20 Seeb
40 P115 Wadi Al Aresh 2 x 20 40 20 Seeb
41 P117 Wadi Al Lawami 3 x 20 60 40 Seeb
42 P154 Al Khoud PH-7 3 x 20 60 40 Khoud
43
Seeb[GP08]-B
GP08 Seeb Grid 2 x 20 40 20 Seeb
44 P029 Sultan School 2 x 20 40 20 Hail
45 P153 Al Hail South 2 3 x 20 60 40 Hail
8 Rusail Industrial 2 – P104 is having split feeder source arrangement with Feeder 1 connected from Rusail Industry Grid A and Feeder 2 connected
from Rusail Industry Grid B.
9 Old Mabelah - P059 is having a split feeder source arrangement with Feeder 1 from Barka Grid and Feeder 2 from Mabelah 1 Grid.
10 New Al Khoud – P047 is having split feeder source arrangement with Feeder 1 connected from Seeb B Grid and Feeder 2 connected from Seeb
A Grid.

MEDC Distribution System Capability Statement (2020-2022) – V1.0 28
S. No Grid Station [G-No] P-No Primary Station Name Tx -Config
Installed
Capacity (MVA)
Firm
Capacity (MVA)
Area Name
46
Mawaleh South[GP05]-A
P028 Al Hail North 2 2 x 20 40 20 Hail
47 GP05 Mawaleh South Grid 2 x 20 40 20 Mawaleh
48 P072 Mawaleh C 2 x 20 40 20 Mawaleh
49 P048 Al Khoud PH-3 2 x 20 40 20 Khoud
50 P101 Rusail B 2 x 10 20 10 Mawaleh
51 P100 Royal Flight 2 x 20 40 20 Private
52
Mawaleh South[GP05]-B
P070 Mawaleh A11 3 x 20 60 40 Mawaleh
53 P071 Mawaleh B12 3 x 20 60 40 Mawaleh
54 P049 Al Khoud PH-6 2 x 20 40 20 Khoud
55 P030 Al Hail South 1 2 x 20 40 20 Hail
56 P148 Mawaleh South05 3 x 20 60 40 Mawaleh
57
Mawaleh North [GP01]
P027 Al Hail North 1 2 x 20 40 20 Hail
58 P069 Mawaleh North 2 x 20 40 20 Hail
59 GP01 Mawaleh North Grid 3 x 20 60 40 Private
60 P073 City Centre 2 x 20 40 20 Mawaleh
11 Mawaleh A – P070 is having split feeder source arrangement with their Feeders 1&3 for each primary connected from Mawaleh South B Grid
and Feeder 2 from Mawaleh South A grid.
12 Mawaleh B – P071 is having split feeder source arrangement with their Feeders 1&3 for each primary connected from Mawaleh South B Grid
and Feeder 2 from Mawaleh South A grid.

MEDC Distribution System Capability Statement (2020-2022) – V1.0 29
4 . M E D C D I S T R I B U T I O N S Y S T E M
MEDC is authorized to undertake all regulated activities of electricity distribution and supply business
at 33kV and below across the whole area of Muscat including Seeb, Bousher, Muscat, Muttrah, Amerat
and Quriyat Wilayats.
The distribution system has three nominal voltages; i.e. 33kV, 11kV and 415V.
Most customers connect at LV (415 Volt) and there are bulk customers connected at 11kV and 33kV.
Similarly there are 4 no. large customers connected on the OETC 132kV side but are MEDC customers
for the purposes of energy supply and billing.
4.1. Existing Distribution System
The existing MEDC distribution system asset statistics including the installed capacities are as shown
in Table 11 (as of July 2019).
Table 11 Summary of Distribution System Assets
33kV 11kV LV
Overhead Line 962.7km 1111.8km 1786.5km
Underground Cable 1344.8km 3534.9km 7562.7km
GSS PSS DSS
No. of Substations 34*13 179 8761
No. of Transformers 69* 387 11,562
Installed MVA 8400* 6624 13227.7
*Feeding MEDC Licence area; owned by OETC
Table 12 provides a summary of the existing 33/11.5kV primary power transformers installed and firm
capacity, out-of-firm and max demand per zone (as of July 2019).
Table 12 Summary of Installed and Firm Capacities of MEDC Distribution System
Zone
No of PSS
Installed Capacity
(MVA)
Firm Capacity
(MVA)
Out of Firm
(MVA)
Max. Demand
201914
(MVA)
1 69 1873 989 12.2 689.9
2 50 2213 1274 8.0 936.7
3 60 2538 1472.5 41.8 1154.1
Total 179 6624 3735.5 62.015 2780.7
Figure 12 (later in this section) illustrates electrically the existing 33kV MEDC system (2019).Table 13
provides a summary of the historic demand growth providing the context for demand growth seen in the
MEDC system. Over the previous 7 years, MEDC has seen significant growth in specific areas16. The
Compound Annual Growth Rate [CAGR]% for the year 2012-2019 has been used to inform our demand
13 The GSSs with 4x125 MVA configuration are counted as two grids.
14 Max.Load - based on summation of individual primary substation loads occurring at different times; hence is different from the MEDC system
level maximum demand of 2609.7MVA which is summation of primary demands on the system maximum demand day/time.
15 Unaudited figure for 2019 as an indication only. 16 The areas are defined on geographical and electrical connectivity basis as ratified by the zonal teams.

MEDC Distribution System Capability Statement (2020-2022) – V1.0 30
forecast going forward to 2022. In the below table a negative CAGR % indicates no growth in the past
years hence for the purposes of load forecasting a zero load growth will be applied on those areas.
Table 13 Area Wise Compound Annual Growth Rate[CAGR] % of MEDC Distribution System
Zone Area CAGR (%)
2012 -2019 2016 -2019
1 Amerat 11.2% 4.4%
1 QuriyatGroup 4.5% 4.7%
1 Ruwi 0.9% -2.1%
1 WadiAdai -1.7% -3.4%
1 WadiKabir -2.1% -4.9%
1 Muscat -1.7% -1.1%
1 Mutrah -1.1% -4.7%
1 QuriyatGroup-O/D 0.9% -5.8%
1 Yity-O/D -0.1% -11.2%
1 Jahlut-O/D 6.0% 3.9%
1 Sawaqam-O/D 1.3% -3.5%
2 Bousher 6.5% 6.8%
2 Ansab 7.1% 4.1%
2 Airport 3.4% 2.6%
2 Khuwair 6.4% 1.5%
2 Azaiba 4.0% -2.7%
2 MSQ 3.0% 1.7%
2 Sarooj -1.2% -4.4%
2 GhubrahSouth 4.3% 0.0%
2 Qurum 2.0% -1.6%
3 Mabelah 11.7% 5.7%
3 Misfah17 7.1% 10.9%
3 Seeb 7.1% -1.1%
3 Khoud 9.0% 4.2%
3 Jifnain-O/D 6.3% -5.2%
3 Rusail 5.3% 7.1%
3 Mawaleh 3.5% -4.1%
3 Hail 2.1% -0.4%
4.2. System Demand and Load Duration
The Maximum and Minimum Demand for the MEDC distribution system in 2019 is illustrated in Table
14 below. This shows that the 2019 minimum demand is circa 25.5% of the 2019 maximum demand
for the MEDC system.
17 The CAGR% used for Misfah is based on an area with similar load characteristics as are created post 2014.

MEDC Distribution System Capability Statement (2020-2022) – V1.0 31
Table 14 Maximum and Minimum System Demands
System Demand
Load (MW) Load (MVA) Date & Time
Maximum 2479.2 2609.7 30th June 2019 @ 14:49 Hrs
Minimum 631.4 664.6 9th February 2019 @ 04:00
Hrs
MEDC note that the date of system maximum demand has fluctuated throughout the years. System
maximum demand has occurred generally between the summer months starting from May to July;
although there seems to be no exact co-relation on the exact timing as expected. There are various
parameters which affect the occurrence of the system maximum demand and we expect more
parameters in the upcoming future especially due to the macro-economic condition of the Oman
economy and due to the developments in newer technologies; but few of the significant ones which
have impacted MEDC distribution system growth in 2019 are :
1) Temperature and Humidity;
2) Customer nos and types of customer growth;
3) Socio-economic factors like occurrence of Ramadan and state of economy due to oil prices;
4) Implementation of CRT.
This can result in a lack of consistent predictability as to the precise date of future system peaks;
although provides a good indication in general of the period and pattern. For this reason; associated
demand transfers are operationally planned to occur before May period each year to ensure MEDC are
in the best position possible to meet regulatory requirements and ensure quality and security of supply
to consumers.
Figure 5 below indicates that from the historical data [2012-2019]; the system maximum demand day
load profile pattern is generally consistent with each other18. As it can be seen from Figure 7; the
maximum demand % growth i.e. growth magnitude has been inconsistent especially between 2013 and
2019; due to the factors mentioned above.
Figure 5 Hourly Demand – System Maximum Day Profile 2012-2019
18 The 2013 hourly profile, compared with the previous capability statements; the data was verified and corrected in the 2018 DSCS to reflect reality.
1000.0
1300.0
1600.0
1900.0
2200.0
2500.0
2800.0
1 2 3 4 5 6 7 8 9 10 11 12 13 14 15 16 17 18 19 20 21 22 23 24
MW
Hours
System Peak Day Profile [2012-2019]
30-Jun-19 25-Jun-18 31-May-17 12-Jun-16 05-Jul-15 26-Jun-14 16-Jun-13 20-Jun-12

MEDC Distribution System Capability Statement (2020-2022) – V1.0 32
The maximum demand data is supplemented with the associated load duration curve shown in Figure
6. This graph below represents a period of last 9 months (Jan – Sept 2019). The peak demand was
circa 70% of the firm capacity [3,735.5MVA / pf (0.95) =3548.7MW] and the system load is greater than
1500MW for circa 49% of the time during the measurement period as indicated in Figure 6 below. The
associated distribution and utilisation of MEDC’s distribution assets are seen to be generally in line with
common distribution utility practice.
Figure 6 Load Duration Curve
Similar to the system maximum demand, the date of system minimum demand has fluctuated
throughout the years. System minimum demand has occurred generally between the winter months
starting from January to February between 03:00 AM to 05:00 AM. Figure 7 illustrates that the system
maximum/minimum demand including grid connected customers and total customer nos. have steadily
grown year on year following a similar growth trend.
Figure 7 Maximum & Minimum Demand19 with Customer Numbers Growth
19 Minimum Demand data available from 2009 onwards only and hence plotted starting 2009.

MEDC Distribution System Capability Statement (2020-2022) – V1.0 33
4.3. Cost Reflective Tariff (CRT)
In October 2016, The Regulator announced that the Council of Ministers had approved the introduction
of a new tariff for high value customers called the Cost Reflective Tariff (CRT) and implemented fully in
2017. The new tariff is designed to more accurately reflect the actual costs of providing a supply of
electricity to large government, commercial and industrial customers without government subsidy. The
current approval for CRT implementation is for application only to the high value customers who
consume 150 MWh and above in a year, for the above-mentioned customer categories.
As the full 2019 cycle hasn’t been completed yet an impact analysis was undertaken on 2018 MEDC
customer base to understand the full year impact of CRT on the MEDC distribution system and
described as below.
The number of CRT customers in 2018 was 4916, circa 1.2% of the total connected customers and as
shown in Figure 8 this 1.2% of the CRT customers out of the MEDC total customer base consumed
38% of total energy distributed by MEDC in 2018 as shown in Figure 8.
Figure 8 MEDC 2018 CRT and Non-CRT Units Sold (MWh)
Post implementation of the CRT; the revenue realization per MWh for 2018 MEDC CRT customers was
24.60 OMR. The economic cost of electricity supply in MEDC was approximately 27.5 OMR per MWh
in 2018; hence this results in a government subsidy of 2.9 OMR per MWh for CRT customers. As a total
this resulted in a government subsidy of 12.6M OMR for CRT customers in 2018 compared to 15.0M
OMR in 2017 resulting in net reduction for government subsidies.
The average realization rate across all customers (non-CRT to CRT from 2018) per MWh for MEDC in
2018 was 17.73 OMR/MWh compared to 17.90 OMR/MWh in 2017.
The effect of CRT implementation on the MEDC system maximum demand profile is quite evident in
the form of peak shaving; especially due to the industrial customers.
From the observed 2019 load curve; on the MEDC system maximum demand (30th June 2019); two
large industrial customers load contribution to the MEDC system maximum demand during the peak
hours (i.e. 1:00 pm to 5:00pm) of the week has been effectively reduced to zero in comparisons to
previous year’s as visible from the demand profile’s as shown in Figure 9. As seen from Figure 9
Industrial customer no.1 load on the MEDC system reduced from the normal circa 7MW during the peak
hours in 2017 to circa 0MW in 2018 and 2019.
4,339,310,
38%7,198,901
62%
2018 CRT & Non CRT Units Sold (MWh)
CRT Non CRT

MEDC Distribution System Capability Statement (2020-2022) – V1.0 34
Figure 9 CRT Customer’s Profile on the System Peak Day for 2017 - 2019
4.4. Demand Not Secured (DNS)
As per the licence condition; MEDC is obliged to comply with the DSSS and moreover one of our major
investment drivers for the CAPEX programme is to meet the N-1 operational capability for each Primary
Substation. Figure 10 below provides a trend of the MEDC Demand Not Secured (DNS) MVA
performance; as a measure to show DSSS compliance improvement along with number of Primary
Substations contributing to the DNS. It can be seen that in the recent years the DNS performance in
consistently improving and the unaudited 2019 DNS for MEDC realised is 62.0MVA which is a circa
31% reduction compared to 2018 DNS value of 89.3MVA.
Figure 10 DNS Historical Data

MEDC Distribution System Capability Statement (2020-2022) – V1.0 35
4.5. System Demand Forecast
Accurate and realistic load demand forecasting is critical for the effective operation of the distribution
system and is the principal driver for capital expenditure. Realistic assumptions must be made for
inherent uncertainties in forecasting and the underlying socio-economic factors, such as the sustained
low oil price.
Load growth can vary from year-to-year and is not uniform across the whole system. It is not unusual
to find parts of the system growing at significantly higher rates than for the system as a whole, while
other parts of the system can experience periods of low growth or demand reduction.
MEDC high voltage distribution system operates at 33kV and 11kV, both voltages being standard IEC
voltages. The 33kV system is normally operated with duplicated radial while the 11kV system is
operated as a radial configuration, normally with interconnection through normally open points except
in the more remote areas. The system covers both urban and rural areas and the characteristics depend
on the load density.
Distribution Load Forecasting
MEDC considers the following features are necessary to produce an accurate demand forecast in line
with best practice:
• Accurate and unbiased actual demand data – careful management of data and forecasting model
construction based on sound theoretical grounds that closely fits the sample data.
• Transparency and repeatability – as evidenced by good documentation, including documentation
of the use of judgment, which ensures consistency and minimises subjectivity in forecasts.
MEDC also considers the following elements to be relevant to maximum demand forecasting:
• Independent forecasts – spatial (bottom up) forecasts should be validated by independent system
level (top down) forecasts and both spatial and system level forecasts should be prepared
independently of each other. The impact of macroeconomic and demographic trends is better able
to be identified and forecast in system level data, whereas spatial forecasts are needed to capture
underlying characteristics of specific areas within the system. Generally, the spatial forecasts
should be constrained (or reconciled) to system level forecasts;
• Adjusting for temporary transfers – spatial data is adjusted for historical spot loads arising from
peak load sharing and maintenance, before historical trends are determined;
• Adjusting for discrete block loads – large new developments, such as shopping centres and housing
developments, are incorporated into the forecasts, taking account of the probability that each
development might not proceed. Only block loads exceeding a certain size threshold are included
in the forecasts, to avoid potential double counting, as historical demands incorporate block loads
and general demand growth.
System Demand Growth
Historical data indicates that the demand rate of growth across MEDCs distribution system has slowed
in recent years. This may be attributed to the sustained low price and general macro-economic factors.
Over the 2012 to 2019 period the CAGR % system-wide load growth was as shown in Table 15.

MEDC Distribution System Capability Statement (2020-2022) – V1.0 36
Table 15 CAGR% Evaluation on the System Maximum Day
System Maximum Demand 2012-2019 CAGR system load
growth %
Non-Grid connected customers 4.7%
Grid connected customers 5.0%
After the declaration of maximum and minimum load in 2019, the minimum to maximum load ratio %
was calculated for each PSS. The calculated ratio % of each PSS was then applied in the maximum
forecasted load [2020-2022] to forecast the minimum load.
Table 16 and Figure 11 shows the historical trend in system maximum demand with the forecast
maximum demand over the period 2020 to 2022. Despite the general slowing in demand growth at the
system level, there are areas within the system where maximum demand is forecast to grow well
beyond the system average level, while other parts of the system are forecast to experience no load
growth or a small reduction in maximum demand. This particularly applies to Muscat and Muttrah
(except any potential bulk load connections) where the geography of the area (city area predominantly
domestic property) can be considered saturated with little room for property expansion. Significant
demand growth is expected in the South of Zone 1 and Zone 3, largely due to new developments
associated with urban sprawl towards the edge of the urban growth zone. As a result of this urban
sprawl, we expect to see continued strong growth in the Amerat and Mabelah areas.
Especially, in the last two years the growth at system level has reduced and dropped to 0.8% in 2018
and 4.5% in 2019 as seen in Table 16; MEDC shall closely monitor the growth for the remaining years
of the PCR-5 period and reflect the effects in the coming years as necessary for the reasons below:
1) The period when the reduction is observed is very small to be confident to change the growth % for
the upcoming years; especially that MEDC expect the % growth to change compared to recently
observed in the coming years as the price of oil continues to improve as evident from the 2018 to
2019 maximum demand growth;
2) Secondly we expect additional parameters like new technologies; photovoltaics and electric-
vehicles to impact the pattern of the growth;
3) Lastly as also observed from the table below in periods 2010-2012 and 2013-2015 have seen
drastic swings in the system growth percentage due to a multitude of factors in a very short period
of time i.e. MEDC believe that a larger period is required to determine the future growth percentage
rather than last 2-3 years only.
Table 16 System Maximum Demand in MW [Historical and Forecast]
Actual Demand [MW] Forecast Demand [MW]
System Maximum Demand
2006 2007 2008 2009 2010 2011 2012 2013 2014 2015 2016 2017 2018 2019 2020 2021 2022
Excluding Grid
Connected Customers
(MW)
1146 1246 1342 1525 1567 1618 1763 1738 2014 2154 2254 2305 2323 2427 2541 2682 2794
Yearly Growth
- 8.7% 7.7% 13.6% 2.8% 3.3% 9.0% 1.4% 15.9% 7.0% 4.6% 2.3% 0.8% 4.5% 4.7% 5.6% 4.2%
Including Grid
Connected Customers
(MW)
1146 1246 1342 1525 1567 1618 1763 1738 2014 2184 2304 2349 2367 2479 2600 2759 2880
Yearly Growth
- 8.7% 7.7% 13.6% 2.8% 3.3% 9.0% 1.4% 15.9% 8.4% 5.5% 1.9% 0.8% 4.7% 4.9% 6.1% 4.4%

MEDC Distribution System Capability Statement (2020-2022) – V1.0 37
Figure 11 System Historical and Forecast Maximum Demand (2006-2022)
4.6. Grid Supply Points
By 2023, it is forecasted that there will be 38 grid supply points within the MEDC licenced area. There
are 3 new and/or upgraded grid supply points currently in the construction phase. The investment
drivers for grid supply points is to relieve existing overloaded (above the firm) grid supply points and to
provide new 33kV connection points to accommodate new primary substations. MEDC provides
annually a demand forecast for five years to OETC. The existing system (2019) and expected system
development for the primary substations is updated in Figure 12 and Figure 13 [expansion for the next
3 years].

MEDC Distribution System Capability Statement (2020-2022) – V1.0 38
Figure 12 33kV Existing System (2019)
Amerat[G10]
Wadi Al Kabir
A&B[G19]
Muttrah [G21]
Falaj[G23]
Qurum[G06]
MSQ -A & B [GP06]
Bousher-A&B [GP02]
Ghubrah 2[G09]
Misfah[G04]
Ghala-A&B[G11]
AirportHeight-A&B
[G01]
Mawaleh North[GP01]
Mawalleh South A & B
[GP05]
Seeb A & B[GP08]
Mabelah[GP04]
Mabella 2 (A’Salam)
(A & B)[G12]
Barka[G02]
Falaj(P178)
Darsait(P018)
Jibrooh(P041)
Sea Port(P086)
Muttrah Store(P085)
Ruwi Office(P108)
CBD(P173)
Bait Al Falaj(P142)
Riyam(P099)
Waljah(P130)
Qasr Al Alam(P090)
Old Airport(P107)
M.B.D South(P075)
Sidab(P119)
Ruwi Market(P076)
Wadi Al Kabir Height(P128)
Ruwi Valley(P174)
250
Majlis Oman(P066)
Amerat-1(P005)
125
125
Qurum-1(P093)
Qurum-2(P094)
Lulai (P095)
Rabiat Al Qurum (P096)
Information City 1(P037)
MSQ Grid(GP06)
MSQ-1(P083)
Royal Office(P097)
Intercontinental(P109)
Sarooj-Shati Al Qurum(P110)
Digital TV Studio(P039)
Al Khuwair 25(P053)
ROP -Shati Al Qurum(P111)
Al Khuwair School(P146)
Post Office(P150)
Amerat Heights(P152)
Bousher Grid(GP02)
Al Khuwair 17/1(P050)
Khuwair South(P052)
Ghubrah South
-1 (P
026)
Azaibah South 1-B(P147)
Azaibah North-1(P011)
Al Muna(P084)
Tilal Al Khuwair(P055)
Royal Hosp
ital
(P024)
Azaibah South1-A(P014)
Ghubrah North-1(P023)
Ghubrah North-2(P149)
Airport Height-2(P002)
Airport Height-1(P001)
Airport Height-3(P003)
Airport Height-4(P004)
Azaibah North-3(P013)
Airport Height-5(P151)
Al Hail North-2(P028)
Royal Flight(P100)
Mawaleh South Grid
(GP05)
New Al Khoud(P047)
Al Jifnain(P042)
Cement Housing(P088)
Cement Factory(P079)
Seeb Grid(GP08)
Wadi Bahayis RGO)
(P098)
Wadi Al Aresh(P115)
Sultan School(P029)
Al Khoud Shabiya(P046)
City Centre(P073)
Mawaleh-C(P072)
Rusail-B(P101)
Mawalleh-B(P071)
Mawalleh-A(P070)
Al Khoud PH-6(P049)
Manomah(P067)
Mabelah South(P061)
125
Mabelah Grid(GP04)
Mabelah South PH-7(P141)
Sur Al Hadid (P116)
Mabelah South(P061)
Botanic Garden(P016)
Mabelah S
outh PH-4
(P062)
Mabelah-C(P064)
Rusail Industrial-1(P103) Rusail Industrial-2
(P104)
250
Rusail Industrial-3(P104)
Rusail Housing(P056)
Private Factory(P106)
SQU-1(P122)
SQU-2(P123)
Mabelah South PH-8(P157)
Al Ansab STP(P009)
Al Ansab-2(P008)
PDO(P144)
Al Khuwair North(P054)
MOD Technical College(P081)
Al Misfah(P080)
Mabelah Shabiya(P060)
Wadi Al Lawami(P117)
Al Hail South-2(P153)
Al Khoud PH-3(P048)
Mawalleh North(P069)
Hail North-1(P027)
Muscat Electricity Distribution Company - 33kV Primary Substations (2019 Network Diagram)
(2x16MVA)
(2x20MVA)
(2x20MVA)
(3x20MVA)
(2x6MVA)
(3x16MVA)
(2x20MVA)
(3x20MVA)
(2x20MVA)
(2x20MVA)
(2x20MVA)
(2x20MVA)
(2x20MVA)
(2x6MVA)
(2x20MVA)
(2x20MVA)
(2x20MVA)
(2x20MVA)
(2x20MVA)
(2x20MVA)
(3x20MVA)
(3x20MVA)
(2x20MVA)
(2x20MVA)
(3x20MVA)
(2x20MVA)(3x20MVA)(2x20MVA)
(2x20MVA)
(2x20MVA)
(1x5MVA)
(2x20MVA)
(2x20MVA)
(2x16MVA)
(2x20MVA)
(2x20MVA)
(3x20MVA)
(2x20MVA)
(3x20MVA)
(2x20MVA)
(2x20MVA)
(3x20MVA)
(3x2
0MVA)
(2x20MVA)
(3x2
0MVA)
(2x20MVA)
(2x20MVA)
Ghala-1(P015)(2x20MVA)
(2x20MVA)
(2x20MVA)
(2x20MVA)
(3x20MVA)
(2x20MVA)
(2x20MVA)
(2x20MVA)
(2x16MVA)
(2x20MVA)
(2x20MVA)
(2x20MVA)
(2x20MVA)(2x16MVA)
(3x16MVA)
(1x6MVA)
(2x5MVA)
(3x20MVA)
(2x31.5 MVA)
(2x20MVA)
(2x20MVA)
125
(2x20MVA)(2x20MVA)
(2x20MVA)
(2x20MVA)
(3x20MVA)
(3x20MVA)
(3x20MVA)
(3x2
0MVA)
(3x20MVA)
(2x20MVA)
(2x20MVA)
(2x20MVA)
(2x20MVA)
(3x20MVA)
(3x20MVA)
(2x20MVA)
(3x20MVA)
(2x10MVA)
(2x20MVA)
(2x20MVA)
(3x20MVA)
(2x20MVA)
(2x20MVA)
(2x20MVA)
(2x20MVA)
(2x20MVA)
(2x20MVA)
(2x20MVA)
(2x20MVA)
(2x20MVA)
(2x20MVA)
Sea of Oman
N
Note:All connection lines are either two circuits or three circuits for 3 x20MVA except the single lines are indicated as one circuit or more.
Prepared by Planning DepartmentThis diagram only for planning purpose
125
Legend
125
125
132/33kV Grid Station with Firm Capacity(MVA)
New 132/33kV Grid Station with Firm Capacity(MVA)
33/11kV Primary Station
Private Shifted 33/11kV Primary Station
132 kV Line
33 kV Line
New 33kV Lines
New 33/11kV Primary Station
New 132 kV Line
Upgrading 33/11kV Primary Station
New Private 33/11kV Primary Station
Private 33/11kV Primary Station
(4x20MVA)
Quriyat[G
05]Jahloot [G03]
Yiti[G08]
Wadi Adai [G22]
Wadi Al Kabir Workshop(P126)
Wadi Al Kabir Housing(P127)
Ali Al Shihani(P125)
Al Bustan Palace(P017)
Al Hamryah(P035)
Wattaya(P131)
Wadi Adai(P175)
Khoula Hospital(P132)
125
Sawaqim-1(P112)
Al Nahdah(P006)
Madinat Al Nahdah(P065) Al Shahbari
(P092)
Dhaghmar 1(P021)
Dhabab(P019)
Quriyat(P091)
Al Masarat(P068)
Siya
(P120)
Jahloot
(P040)
Al Hajir
(P031)
Yiti
(P134)
(2x3MVA)
Wadi Al
Mayh
(P129)
Yenket
(P133)
(1x1+1x3MVA)
Saraya Bander(P145)
Al Khairan
(P045)
(1x6+1x3MVA)
Al Mazara(P074)
Royal Camp(P170)
Arqi(P121)
Tunis Heium(P137)
Hail Ghaf(P036)
(2x6MVA)
(1x6MVA)(2x20MVA)
(2x16MVA)
(2x16MVA)
(2x20MVA)
(2x20MVA)
(2x20MVA)
(3x20MVA)
(2x20MVA)
(1x6MVA)
(2x6MVA)
(2x6MVA)
(2x6MVA)
(2x6MVA)
(1x6MVA)Wadi Al Arbyeen
(1x3MVA)
(1x6MVA)
(2x10MVA)
(2x20MVA)
(1x3MVA)
(2x20MVA)
(3x20MVA)
(2x20MVA)
(2x20MVA)
(4x6MVA)
(1x3MVA)
(2x6MVA)
1
1
1
1
Hussan Yiti(P169)
(2x6MVA)
off
1
1
1
Sea of Oman
Sea of Oman
125
RGO Halban Camp(P034)
(1x5MVA)
1
1
Direct Connected Transformer
Off
1
1
1
1
250
125 Upgrading 132/33kV Grid Station with Firm Capacity(MVA)offOff
Amerat 2(P177)
(1x6MVA)Al Mahaj
(P136)
(2x6MVA)
11
1
1
off1
off
off
off
off
off
Seih Dhabi (P118)
(2x16MVA)
off
125125
1
off
off
Shifted 33/11kV Primary Station
Private Upgrading 33/11kV Primary Station
4
MOD(P143)
(1x6MVA)
Qantab(P089)
(1x3MVA)
(2x6MVA)
off
Barr Al Jissa(P044)
(2x20MVA)
Ghubrah GPS(P166)
(2x16MVA)
33kV RMU/ C.B ( proposed Off Point)
250
Al Ansab 1
(P007)
(2x20MVA)
Yitti Hights
(2x6MVA)
Oman Exhibition(P165)
(3x20MVA)
3
off
off
off
Mabelah STP(P140)
(2x10MVA)
(3x20MVA)
Al Khoud PH-7(P154)
off
1
1
off
ABS ( existing Off Point)off
Off
250
125
1
off
off
off
125
1
Sawaqim-2(P113)
Debah(P114)(1x6MVA)
Al Salam Yiti
(P135)
(1x6MVA)
Information City-2(P038)
(2x20MVA)
Holiday Inn(P051)
(3x20MVA)
1
off
Al Awabi(P139)(3x6MVA)
Mabelah-A(P063)
(3x20MVA)
Old Mabelah(P059)
(2x20MVA)
Al Hail South-1(P030)
(2x20MVA)
250
100 132/11kV Grid Station with Firm Capacity(MVA)
Palace Communication
(P033)(1 x6MVA)
MSQ 2 (P155)
(3x20 MVA)
Rusail Industrial-4(P158)
(3x20 MVA)
Ghala 02(P156)
(3x20 MVA)
MOD Al Ansab(P167)
(2x10 MVA)
Mabelah Industrial(P191)
(1x6 MVA)
Orpic(P192)
2x6 MVA
(3x20 MVA)
Mabelah Phase 5(P190)
(1x6 MVA)
SQU-3(P160)
(3x20 MVA)
Al Atkiya(P182)
(1x6 MVA)
Jabal Al Sifah (P159)
(3x20MVA)
Amerat 3(P179)
(3x20MVA)
off
off
Mawalleh North Grid
(GP01)(3x20MVA)
Street Light
(P020)
(1x6 MVA)
off
off
off
off
Diplomatic City(P022)
(3x20MVA)
Azaibah North-2(P012)
(2x20MVA)
off
Rusail Industry (A&B)[G13]
250
250
Al Jufaina (P194)
1 x6 MVA
250
ROP Al Saleel [P162](2x6MVA)
100
Dhaghmar[GP11](132/11kV)
Bousher 02
(P163)
(3x20 MVA)
Rusail08(KOM)(P164)
(3x20MVA)
ROP Dog Kennel (P183)
(2x6MVA)
ROP Al Khoud(P161)
(2x20MVA)
Palm Mall(P168)(3x20MVA)
Mobella South PH06(P185)
(3x20 MVA)
250
OffOff
Mawalleh South 5(P148)
(3x20MVA)
125
Water Pumping (P193)
(2x6MVA)
250
Ghala Heights
(A&B)
[G24]
Mall of Oman(P171)
(3x20MVA)

MEDC Distribution System Capability Statement (2020-2022) – V1.0 39
Figure 13 33kV Expected System Development (2020 to 2022)
Heading
Amerat[G10]
Wadi Al Kabir
A&B[G19]
Muttrah [G21]
Falaj[G23]
Qurum[G06]
MSQ -A & B [GP06]
Bousher-A&B [GP02]
Ghubrah 2[G09]
Misfah[G04]
Ghala-A&B[G11]
AirportHeight-A&B
[G01]
Mawaleh North[GP01]
Mawalleh South A & B
[GP05]
Seeb A & B[GP08]
Mabelah[GP04]
Mabella 2 (A’Salam)
(A & B)[G12]
Barka[G02]
Falaj(P178)
Darsait(P018)
Jibrooh(P041)
Sea Port(P086)
Muttrah Store(P085)
Ruwi Office(P108)
CBD(P173)
Bait Al Falaj(P142)
Riyam(P099)
Waljah(P130)
Qasr Al Alam(P090)
Old Airport(P107)
M.B.D South(P075)
Sidab(P119)
Ruwi Market(P076)
Wadi Al Kabir Height(P128)
Ruwi Valley(P174)
250
Majlis Oman(P066)
Amerat-1(P005)
125
125
Qurum-1(P093)
Qurum-2(P094)
Lulai (P095)
Rabiat Al Qurum (P096)
Information City 1(P037)
MSQ Grid(GP06)
MSQ-1(P083)
Royal Office(P097)
Intercontinental(P109)
Sarooj-Shati Al Qurum(P110)
Digital TV Studio(P039)
Al Khuwair 25(P053)
ROP -Shati Al Qurum(P111)
Al Khuwair School(P146)
Post Office(P150)
Amerat Heights(P152)
Bousher Grid(GP02)
Al Khuwair 17/1(P050)
Khuwair South(P052)
Ghubrah South
-1 (P
026)
Azaibah South 1-B(P147)
Azaibah North-1(P011)
Al Muna(P084)
Tilal Al Khuwair(P055)
Royal Hosp
ital
(P024)
Azaibah South1-A(P014)
Ghubrah North-1(P023)
Ghubrah North-2(P149)
Airport Height-2(P002)
Airport Height-1(P001)
Airport Height-3(P003)
Airport Height-4(P004)
Azaibah North-3(P013)
Airport Height-5(P151)
Al Hail North-2(P028)
Royal Flight(P100)
Mawaleh South Grid
(GP05)
New Al Khoud(P047)
Al Jifnain(P042)
Cement Housing(P088)
Cement Factory(P079)
Seeb Grid(GP08)
Wadi Bahayis RGO)
(P098)
Wadi Al Aresh(P115)
Sultan School(P029)
Al Khoud Shabiya(P046)
City Centre(P073)
Mawaleh-C(P072)
Rusail-B(P101)
Mawalleh-B(P071)
Mawalleh-A(P070)
Al Khoud PH-6(P049)
Manomah(P067)
125
Mabelah Grid(GP04)
Mabelah South PH-7(P141)
Sur Al Hadid (P116)
Mabelah South(P061)
Botanic Garden(P016)
Mabelah S
outh PH-4
(P062)
Mabelah-C(P064)
Rusail Industrial-1(P103) Rusail Industrial-2
(P104)
250
Rusail Industrial-3(P104)
Rusail Housing(P056)
Private Factory(P106)
SQU-1(P122)
SQU-2(P123)
Mabelah South PH-8(P157)
Al Ansab STP(P009)
Al Ansab-2(P008)
PDO(P144)
Al Khuwair North(P054)
MOD Technical College(P081)
Al Misfah(P080)
Mabelah Shabiya(P060)
Wadi Al Lawami(P117)
Al Hail South-2(P153)
Al Khoud PH-3(P048)
Mawalleh North(P069)
Hail North-1(P027)
Muscat Electricity Distribution Company - 33kV Primary Substations (2020-2022 Network Diagram)
(2x16MVA)
(2x20MVA)
(2x20MVA)
(3x20MVA)
(2x6MVA)
(3x16MVA)
(2x20MVA)
(3x20MVA)
(2x20MVA)
(2x20MVA)
(2x20MVA)
(2x20MVA)
(2x20MVA)
(2x6MVA)
(2x20MVA)
(2x20MVA)
(2x20MVA)
(3x20MVA)
(3x20MVA)
(2x20MVA)
(3x20MVA)
(3x20MVA)
125
(2x20MVA)
(2x20MVA)
(3x20MVA)
(2x20MVA)(3x20MVA)(2x20MVA)
(2x20MVA)
(2x20MVA)
(1x5MVA)
(2x20MVA)
(2x20MVA)
(2x16MVA)
(2x16MVA)
(2x20MVA)
(3x20MVA)
(2x20MVA)
(3x20MVA)
(2x20MVA)
(2x20MVA)
(3x20MVA)
(3x20M
VA)
(2x20MVA)
(3x2
0MVA)
(2x20MVA)
(2x20MVA)
Ghala-1(P015)
(3x20MVA)
(2x20MVA)
(2x20MVA)
(2x20MVA)
(3x20MVA)
(2x20MVA)
(2x20MVA)
(2x20MVA)
(2x16MVA)
(2x20MVA)
(2x20MVA)
(2x20MVA)
(2x20MVA)(2x16MVA)
(3x16MVA)
(1x6MVA)
(2x5MVA)
(3x20MVA)
(2x31.5 MVA)
(2x20MVA)
(3x20MVA)
125
(2x20MVA)(3x20MVA)
(3x20MVA)
(2x20MVA)
(3x20MVA)
(3x20MVA)
(3x20MVA)
(3x20M
VA)
(3x20MVA)
(2x20MVA)
(2x20MVA)
(2x20MVA)
(2x20MVA)
(3x20MVA)
(3x20MVA)
(3x20MVA)
(3x20MVA)
(2x10MVA)
(2x20MVA)
(2x20MVA)
(3x20MVA)
(2x20MVA)
(2x20MVA)
(2x20MVA)
(2x20MVA)
(2x20MVA)
(2x20MVA)
(3x20MVA)
(3x20MVA)
(2x20MVA)
(2x20MVA)
Sea of Oman
N
Note:All connection lines are either two circuits or three circuits for 3 x20MVA except the single lines are indicated as one circuit or more.
Prepared by Planning DepartmentThis diagram only for planning purpose
125
Legend
125
125
132/33kV Grid Station with Firm Capacity(MVA)
New 132/33kV Grid Station with Firm Capacity(MVA)
33/11kV Primary Station
Private Shifted 33/11kV Primary Station
132 kV Line
33 kV Line
New 33kV Lines
New 33/11kV Primary Station
New 132 kV Line
Upgrading 33/11kV Primary Station
New Private 33/11kV Primary Station
Private 33/11kV Primary Station
(4x20MVA)
Quriyat[G
05]Jahloot [G03]
Yiti[G08]
Wadi Adai [G22]
Wadi Al Kabir Workshop(P126)
Wadi Al Kabir Housing(P127)
Ali Al Shihani(P125)
Al Bustan Palace(P017)
Al Hamryah(P035)
Wattaya(P131)
Wadi Adai(P175)
Khoula Hospital(P132)
125
Sawaqim-1(P112)
Al Nahdah(P006)
Madinat Al Nahdah(P065) Al Shahbari
(P092)
Dhaghmar 1(P021)
Dhabab(P019)
Quriyat(P091)
Al Masarat(P068)
Siya
(P120)
Jahloot
(P040)
Al Hajir
(P031)
Yiti
(P134)
(2x3MVA)
Wadi Al
Mayh
(P129)
Yenket
(P133)
(1x1+1x3MVA)
Saraya Bander(P145)
Al Khairan
(P045)
(1x6+1x3MVA)
Al Mazara(P074)
Royal Camp(P170)
Arqi(P121)
Tunis Heium(P137)
Hail Ghaf(P036)
(2x6MVA)
(1x6MVA)(2x20MVA)
(2x16MVA)
(2x16MVA)
(2x20MVA)
(2x20MVA)
(2x20MVA)
(3x20MVA)
(3x20MVA)
(1x6MVA)
(2x6MVA)
(2x6MVA)
(2x6MVA)
(2x6MVA)
(1x6MVA)Wadi Al Arbyeen
(1x3MVA)
(1x6MVA)
(2x10MVA)
(2x20MVA)
(1x3MVA)
(2x20MVA)
(3x20MVA)
(2x20MVA)
(2x20MVA)
(4x6MVA)
(1x3MVA)
(2x6MVA)
1
1
1
1
Hussan Yiti(P169)
(2x6MVA)
off
1
1
1
Sea of Oman
Sea of Oman
125
Direct Connected Transformer
250
125 Upgrading 132/33kV Grid Station with Firm Capacity(MVA)offOff
Amerat 2(P177)
(1x6MVA)Al Mahaj
(P136)
(2x6MVA)
11
1
1
off1
off
off
off
off
off
Seih Dhabi (P118)
(2x16MVA)
off
125125
1
1
off
off
Shifted 33/11kV Primary Station
Private Upgrading 33/11kV Primary Station
4
MOD(P143)
(1x6MVA)
Qantab(P089)
(1x3MVA)
(2x6MVA)
off
Barr Al Jissa(P044)
(2x20MVA)
Ghubrah GPS(P166)
(2x16MVA)
33kV RMU/ C.B ( proposed Off Point)
250
Al Ansab 1
(P007)
(2x20MVA)
Yitti Hights
(2x6MVA)
Oman Exhibition(P165)
(3x20MVA)
3
off
off
off
Mabelah STP(P140)
(2x10MVA)
(3x20MVA)
Al Khoud PH-7(P154)
off
1
1
off
ABS ( existing Off Point)off
250
125
1
off
off
off
125
Sawaqim-2(P113)
Debah(P114)(1x6MVA)
Al Salam Yiti
(P135)
(1x6MVA)
Information City-2(P038)
(2x20MVA)
Holiday Inn(P051)
(3x20MVA)
1
off
Al Awabi(P139)
(3x20MVA)
Mabelah-A(P063)
(3x20MVA)
Old Mabelah(P059)
(3x20MVA)
Al Hail South-1(P030)
(2x20MVA)
250
100 132/11kV Grid Station with Firm Capacity(MVA)
Palace Communication
(P033)(1 x6MVA)
MSQ 2 (P155)
(3x20 MVA)
Rusail Industrial-4(P158)
(3x20 MVA)
Ghala 02(P156)
(3x20 MVA)
MOD Al Ansab(P167)
(2x10 MVA)
Mabelah Industrial(P191)
(1x6 MVA)
Orpic(P192)
2x6 MVA
(3x20 MVA)
Mabelah Phase 5(P190)
(1x6 MVA)
SQU-3(P160)
(3x20 MVA)
Al Atkiya(P182)
(1x6 MVA)
Jabal Al Sifah (P159)
(3x20MVA)
Amerat 3(P179)
(3x20MVA)
off
off
Mawalleh North Grid
(GP01)(3x20MVA)
Street Light
(P020)
(1x6 MVA)
off
off
off
off
Diplomatic City(P022)
(3x20MVA)
Azaibah North-2(P012)
(2x20MVA)
off
Rusail Industry (A&B)[G13]
250(2021)Khoudh
250
250
Amerat 4(P180)
(3x20MVA)
250
ROP Al Saleel [P162](2x6MVA)
100
Dhaghmar[GP11](132/11kV)
250
Mall of Oman(P171)
(3x20MVA)
Bousher 02
(P163)
(3x20 MVA)
Rusail08(KOM)(P164)
(3x20MVA)
Seeb 05(Boulevard)(P186)
(3x20MVA)
ROP Dog Kennel (P183)
(2x6MVA)
ROP Al Khoud(P161)
(2x20MVA)
Palm Mall(P168)
(3x20MVA)
Mobella South PH06(P185)
(3x20 MVA)
Al Khoud Shabiya – B(P187)
(3x20 MVA)
Sarooj04(P181)
(3x20MVA)
ROP Hospital(P172)
(3x20 MVA)
250
Mabelah South(P061)
250
Halban
Off
Off
Off
Off
off
off
Mabelah South PH-9(P184)
(3x20MVA)
off
off
OffOff
off
Mawalleh South 5(P148)
(3x20MVA)
Off
Off
off
Al Jifnain-2(P196)
(1x6MVA)
ROP Airport Height (P195)
(3x20MVA)
Al Jufaina (P194)
1 x6 MVA
Water Pumping (P193)
(2x6MVA)
Off
RGO Halban Camp(P034)
(1x5MVA)
Ghala Heights
(A&B)
[G24]

MEDC Distribution System Capability Statement (2020-2022) – V1.0 40
4.7. Distribution System Modelling and Analysis
MEDC maintains up-to-date models of its power system for assessing distribution system performance
via power system studies, bulk loads modelling and undertaking customer connection studies where
required; to ensure the distribution system operates in a safe and an efficient manner along with
providing the required security of supply to its connected customers.
Power System Models
The planning tool utilised for system modelling and studies is PSS®SINCAL (Power System Simulator®
Siemens Network Calculation). The models for each grid substation with their respective connected
primary substations are established by representing the 33kV system on an electrical connectivity basis.
The system models contain network topology and details in terms of nameplate data for transformers
and their tap changers, capacitor banks and their controllers, conductor types along with associated
lengths and parameters and the non-coincident demand data on individual primary substations.
The load demands are modelled as lumped loads connected to the main 11kV bus bars and segregated
into motoric and non-motoric load types for load flow and fault current calculations. The recorded
maximum (summer) and minimum (winter) demands on each primary substation; derived from MEDC
SCADA system as of 2019 have been used to update the power system models. Forecasting principles
for load determination as mentioned in the previous sections have been adopted to forecast the future
year (2020-2022) maximum and minimum demands.
Under minimum demand conditions; the reactive power support from primary substation and grid
substation capacitor banks is switched off to avoid overvoltages.
Load Flow Analysis
Load flow analysis is undertaken for maximum and minimum demand scenarios to define the
performance of MEDC distribution system during these two-extreme loading scenarios. The analysis
determines the active and reactive power flows in the system, percentage loadings for transformers and
33kV circuits along with the voltage profile at the 11kV and 33kV busbars of the primary substations
under normal circuit operation. Simulations are carried out for the existing (2019) and future 3 years
(2020-2022) for system maximum and minimum loadings.
From the studies of these extreme conditions it is possible to identify where the system is strong and
has spare capacity and conversely, where additional mitigation and/or reinforcement, before new
connections, potentially needs be considered. The maximum demand case for instance; identifies
where there is a risk of overloading, of operation above firm capacity, or of system voltages falling below
the voltage limits whereas the minimum demand case will recognize voltage excursions above statutory
limits as defined in the Distribution Code.
The power factor values for maximum and minimum demand scenarios have been determined based
on the actual available information from MEDC SCADA. For maximum demand conditions; the actual
recorded power factor data is employed, where available, for 120 primary substations. For the remaining
59 substations; where power factor values are not available, a calculated system average of 0.93 is
considered in accordance to the company defined practice.
On similar principles for the minimum demand scenario where the power factor values aren’t available
a calculated system average of 0.89 is considered in accordance to the company defined practice.

MEDC Distribution System Capability Statement (2020-2022) – V1.0 41
The load flow study results are summarised in tabular form in Appendix D and available in a
downloadable excel file that supplements this Distribution System Capability Statement.
The simulation result demonstrates the following:
• Voltage drop under maximum demand scenario remains within the statutory limits of - 6% on all
33kV busbars/nodes.
• Voltage drop under maximum demand scenario remains within the statutory limits of - 6% on all
11kV busbars/nodes.
• Voltage rise under minimum demand scenario remains within the statutory limits of + 6% on all
33kV busbars/nodes.
• Voltage rise under minimum demand scenario remains within the statutory limits of + 6% on all
11kV busbars/nodes; in case of very minor excursions in 2019, the problem solves in forthcoming
years.
• 33kV circuit loadings assessed for the worst-case maximum demand scenario; across the system
are within the acceptable circuit ratings; except for Dhagmar1 Feeder 1 from Quriyat GSS where
by 2021-2022 it reaches 108.8% of the derated circuit capacity. These results are based on non-
coincident maximum demand to represent worst case scenario’s of the connected PSSs on this
feeder. MEDC believe in reality the diversity in the system will ensure that the feeder is not
overloaded and hence will continue to monitor the actual load on this feeder and will prepare
mitigation plan accordingly.
From the results it can be observed that especially under minimum demand case, the 11kV buses at
the primary substations are approaching the statutory limit of +/-6% in some of the primary substations.
This is explained by the fact that our primary transformers are rated at 11.5kV secondary voltage and
to represent the worst case scenario; the load flow calculations are performed with tapchangers
switched off, which on the ground will otherwise regulate the voltage performance better and remain
within statutory voltage limits.
Short Circuit Analysis
MEDC carries out short circuit studies to establish the capability of equipment to withstand three phase
maximum prospective fault current levels.
The principal source of fault currents is the generation system connected to the transmission system
with the fault current contribution onto the MEDC distribution system via the 132/33kV GSS
transformers. The fault current infeed from the OETC source have been updated in our power system
models according to the data provided by the OETC’s 2019 Capability Statement which covers up the
transmission system developments up to 2023.
The system configurations modelled for short circuit studies in each year, to represent the maximum
prospective fault current levels, while also reflecting the realistic operational arrangement are based on
the following principles:

MEDC Distribution System Capability Statement (2020-2022) – V1.0 42
• All existing and new 2x20 MVA PSSs are simulated for operation with the 11kV bus-section circuit
breaker in the “normally closed” position20.
• All existing and new 3x20 MVA PSSs are simulated for operation with one 11kV bus-section circuit
breaker as “normally closed” and one as “normally opened” (i.e. in N or N-1 scenario, it represents
a 4 out of 5 ‘normally closed’ circuit breakers scenario) with an auto-changeover scheme 21.
• All existing 2x20 MVA PSSs and 3x20 MVA PSSs are simulated for operation of 33kV bus-section
circuit breakers within the PSSs (where ever present)22 as “normally open”.
The design short circuit breaking ratings of the 11kV switchgear components at new and upgraded
primary substations have been revised to 25 kA to comply with system requirements23.
Currently, in the absence of accurate fault level contribution data on low voltage (LV) side, a worst-case
allowance is made for LV motor fault contribution majorly due to the nature of the air conditioning load
prevalent across the MEDC’s distribution system. A motoric to static load type ratio of 80/20 (in
percentage) is considered using the system maximum and minimum demand values. System modelling
for fault current calculations have been performed in accordance with the principles of the “IEC 60909-
Short Circuit in 3 phase AC systems” standard.
The maximum prospective fault current values are tabulated in the tables in Appendix D. The calculation
of maximum prospective fault current is compared against the rated breaking capability of the primary
equipment.
The maximum prospective (initial symmetrical) fault current is calculated to be still under but
approaching (i.e. >95% and <100% ) the rated breaking capacity of the primary 33kV equipment
(switchgear) at the following primary substations:
• Bousher Grid Primary - GP02 (24.7 kA in 2019 and then within 95% of 25kA rating)
• Mawalleh South Grid - GP05 (23.8 kA in 2019 and then within 95% of 25kA rating)
• Rusail Industrial 4 - P158 (24.2 kA in 2021 and then within the 95% of 25kA rating)
However, at the following primary substations, minor excursions beyond the rated breaking capacity of
the 33kV equipment (switchgear) are observed :
• MSQ Grid Primary – GP06 (25.7 kA in 2021 and staying >95% of 25kA across all years)
• Mabelah Grid Primary - GP04 (25.5 kA in 2021 and then within 95% of 25kA rating)
where it marginally exceeds by +2.8%, and +2% respectively above the switchgear rating; hence MEDC
shall monitor these PSS closely and create mitigation plans in form of operational restrictions if required
based on the monitoring results.
20 Except for few locations where the 33kV feeders for the individual transformers are connected from two differeng GSSs in which case, the 11kV
bus-section circuit breaker is kept “normally open” for the respective year(s).
21 If the fault levels are within limits for this worst case scenario’s then on bus-coupler open scenario’s of existing primaries the fault level’s will be
even lower.
22 For new PSS, the 33kV configuration excluded 33kV bus-section circuit breakers at the PSS.
23 For the older existing 11kV indoor type switchgear where applicable, the rated breaking short circuit current value is 18.4kA.

MEDC Distribution System Capability Statement (2020-2022) – V1.0 43
It is to be noted that all the above primary substations are in close electrical vicinity of the grids
substations where these results are based on non-coincident maximum demand fault contributions to
represent worst case scenario’s of the connected PSSs on this feeder.
The maximum prospective (initial symmetrical) fault current levels at 11kV busbars of all the primary
substations are within their rated breaking capacities.
Technical Losses Assessment
The technical losses in the MEDC distribution system are a factor of the configuration of the system,
type and specification of equipment, percentage utilisation of assets and customer energy consumption.
Technical losses are attributed to load and no-load losses in the 33kV feeders and 33/11.5kV primary
transformers, 11kV feeders and distribution transformers and the LV distribution system. In line with
standard international practice for utilities where the distribution system is not fully modelled, we
calculate the losses for specific network elements (transformers, overhead lines and cables) across the
different voltage levels (33kV, 11kV and LV) and then summate the total losses to obtain a percentage
technical loss for each primary substation.
The percentage technical losses are then apportioned according to the proportion of total system energy
supplied by each substation. A summation of all apportioned technical losses is then presented as the
system percentage technical losses. The summated technical losses based on the 2019 distribution
system operation is estimated to be 4.01%. The breakdown of technical losses by voltage is shown in
Table 17 below.
Table 17 Technical Losses
System Component Loss Value
33kV Circuits 0.19%
Primary Transformers 0.46%
11kV Circuits 0.48%
Distribution Transformers 1.69%
LV network 1.19%
Total 4.01%
4.8. Continuous Improvement Areas
MEDC have progressed on previously identified areas of continuous improvement as listed below and
is continuing its working on the same along with identifying new areas where required.
1) Bulk Load Details and Modelling
Currently, we are in process of collating the details of existing 33kV and 11kV bulk customers to
incorporate in MEDC power system models as appropriate. In comparison to last year; improved tools
and processes including a creation of a Bulk Load Database to record accurately point of connections,
customer power system impact including short circuit contribution to MEDC distribution system and
agreed capacities to consistently capture these for existing and new customers have been created to
effectively progress in this area. This has led to modelling of further 02 no. bulk loads at 11kV with their
more accurate fault current contributions added to our base master models.

MEDC Distribution System Capability Statement (2020-2022) – V1.0 44
2) 11kV System Modelling
In 2019, MEDC awarded a contract to Siemens PTI Network Consulting who are the owners of MEDC
power system software package PSS®SINCAL for establishing the correct methodology and achieving
MEDC requirements for developing power system models for 11kV system up to the main LV bus bar
for one typical GSS model, namely Bousher GSS. This contract will be finished by end of 2019 post
which, MEDC will take the newly developed methodology and the improved GIS to PSS®SINCAL
adapters developed by MEDC to intiate the development of 11kV models in a more efficient and
automatic manner for the rest of the 33 GSS and associated network. The exports from GIS will be
made based on up-to-date 11kV network information into PSS®SINCAL readable format. This will not
only enable us to improve our existing system studies like fault current level, load flow and technical
losses calculations using PSS®SINCAL but will be supportive in point of connection studies as well.
Point 3 below shows the initial progress for the 11kV system modelling as well to reflect the real
scenarios on ground.
3) Improved and Updated Motoric Short Circuit Contribution
We aim to assess the motor fault contribution onto MEDC’s system at LV due to the connection of
typical larger scale centralised commercial air-con units by obtaining typical details of such systems
from our larger commercial customers and preparing sample equivalent connection impact studies.
We are undertaking assessment studies for MV motor fault contribution from larger industrial customers
in relevant parts of the system to improve the fault current calculations.
To this effect and compared to last year, we have further enhanced our network models at additional
(in addition to Jibrooh-P041 and Mawalleh North Grid-GP01 what we completed last year) 02 x primary
substation sites, Al Khoudh Ph 06 – P049 and Mall of Oman - P171 to appropriately reflect the expected
fault current contribution at 11kV based on manufacturer’s data for the large MV motors from 02 x large
bulk customers namely; Ad-Dakhiliyah Water Pumping Station (representing a fault infeed of 2.84kA at
11kV) and Mall of Oman development (representing a fault infeed of 2.44kA at 11kV) respectively onto
our distribution systems.
MEDC recently in 2019 completed an innovative prospective fault level monitoring project; based on
the actual measured network conditions which has given us initial answers around fault level
contributions from upstream transmission grid as well as downstream motor loads onto LV and MV
networks. We aim to do further monitoring trails to firm up the initial answers going forward and improve
the mortoric short circuit contributions from different types of loads on the distribution system.
4) Technical Losses Calculation using Power System Models
As detailed in point 2 ; once the complete 11kV network models are established which has already been
initiated in 2019 we will merge our 33kV and 11kV models and furnish them with annual load profiles to
produce technical losses from the models using measured loadings from the load profiles.
5) Minimum Scenario Modelling
For the period 2019 to 2022, MEDC has performed the load flow analysis for minimum demand
conditions as well. The future plan is to perform minimum fault current calculations using these models.

MEDC Distribution System Capability Statement (2020-2022) – V1.0 45
6) Voltage Control and Regulation Methodology
As an additional improvement item, MEDC is in process of developing an improved voltage regulation
methodology at our primary substation 11kV busbars by assessing the SCADA data on present/typical
transformer tap positions and capacitor banks during summer and winter times. This is ongoing to
enable us to assess optimal target voltage requirements and capacitor bank operational philosophy on
11kV network starting at the 11kV busbars which will help in improvement of technical losses and better
voltage profile on the extremities of the system. This will also create potential for further economic
development of the system especially in the rural areas with additional extension possibilities provided
by these solutions.
4.9. Information on Distribution Network Assets
Appendix E presents the detailed data for distribution system 33kV circuits and 33/11.5 kV power
transformers used in power system models for the first year (2019) of the statement as shown in the
sample templates:
Node 1 Node 1 Element Name
Network
Level
[kV]
Type NameLength
[km]
Resistance
( R )
[Ohm/km]
Reactance
( X )
[Ohm/km]
Capacitance
( C )
[nF/km]
Continuous
Rating
[kAmps]
Al Falaj Grid HBB01 Mutrah Store-33A-P085 Mutrah Store-F1-P085 33 33kV UGC 300 3C Cu 1.8 0.062 0.103 260 0.385
Al Falaj Grid HBB02 Mutrah Store-33B-P085 Mutrah Store-F2-P085 33 33kV UGC 300 3C Cu 1.8 0.062 0.103 260 0.385
Al Falaj Grid HBB01 - 33 33kV UGC 300 3C Cu 3.1 0.062 0.103 260 0.385
- - 33 33kV OHL 200 Panther ACSR 2.4 0.137 0.333 10.9 0.385
- Seaport-33A-P086 33 33kV OHL 200 Panther ACSR 0.9 0.137 0.333 10.9 0.385
Falaj[G23] GSS [Zone 1]
Primary Substation 33kV Circuit Data
Seaport-F1-P086
Example Data
Example Data
Jibrooh-Tx1-P041 33 11.5 20 12.4 Dyn11 3 12 15 1.67
Jibrooh-Tx2-P041 33 11.5 20 12.4 Dyn11 3 12 15 1.67
Jibrooh-Tx3-P041 33 11.5 20 12.3 Dyn11 3 12 15 1.67
Maximum Tap
Position
Additional
Voltage per
Tap
[%]
Falaj[G23] GSS [Zone 1]
Primary Substation Transformer Data
Primary Substation
Transformer ID
Primary Side
[kV]
Secondary
Side
[kV]
Rated
Apparent
Power (ONAF)
[MVA]
Impedance
Voltage
[%]
Vector Group Minimum Tap
Position
Nominal Tap
Position

MEDC Distribution System Capability Statement (2020-2022) – V1.0 46
5 . C H A L L E N G E S A N D O P P O R T U N I T I E S W I T H I N T H E S Y S T E M
MEDC recognise that the nature of electricity generation and use is changing. We envisage that recent
policy initiatives will result in an increase in photovoltaic (PV) generation on our distribution system.
Unlike other utilities in different regions, Oman has not seen significant uptake in electric vehicle
charging thus, the associated demand characteristics for electric vehicles (EV) are not considered to
be a contributing factor to our system planning in the short term planning horizon. However; this will be
closely monitored to check the penetration rate of EV and PV in general.
With the introduction of Sahim-I initiative by the AER since May 2017 there has been an increasing
uptake of small grid connected PV systems for households and business as evident from the PV
connections list in Appendix C. Similarly with the recent 2019 launch of Sahim-II aimed at encouraging
the small grid connected PV systems (circa 3-5kWp) for residential rooftops; MEDC expect even greater
rate of uptake (AER forecasting circa 10-30% residential premises24). With this great rooftop PV
intiatives, MEDC does foresee challenges and opportunities in the way we will plan and operate our
system. Whilst PV may have the impact of reducing transmission and distribution congestion; we do
envisage that challenges in terms of power quality, reverse power flow and operating within voltage
limits will need to be addressed if PV uptake is significant.
MEDC are responsible for ensuring power quality according to the regulations under which we operate.
However; with the addition of intermittent, consumer-owned and non-dispatchable PV units, current
standard procedures for guaranteeing power quality might not be as effective as they are without PV.
Overvoltage is one of the main reasons for limiting the capacity (active power) of non-dispatchable PV;
that can be connected to a low voltage Distribution System. During high PV generation and low load
periods; there is a possibility of reverse power flow and consequently voltage rise in the HV & LV feeder.
We envisage that this will be most prominent during the winter period. For this reason; MEDC believe
that if uptake is significant it will impact investment decision making for reinforcement and asset
replacement. Consideration of tap range, optimum dispatch of capacitor banks and conductor sizing
may be necessary should PV penetration become high.
5.1. New Connection Applications
MEDC are responsible for the connection of customers for all levels of demand that our system supplies.
We are also the initial point of connection request for customers seeking a 33kV or 132kV connection
at an OETC grid supply point. In 2019, we have received 31 bulk connection requests with a combined
total demand of 431 MW. 11kV and lower voltages connection applications are identified in Table 18.
Table 18 Number of Connection Applications for Bulk Load Application, 11kV and LV Application
S.No. Category Bulk Load Application 11kV and LV Application
1 Residential 2 5297
2 Commercial 14 715
3 Industrial 0 77
4 Government 10 154
5 Tourism 5 15
6 Agriculture 0 41
Total 31 6299
24 Forecast numbers estimated by AER: https://www.aer.om/en/product-application-for-sahim2

MEDC Distribution System Capability Statement (2020-2022) – V1.0 47
Figure 14 No. of Connection Applications (Bulk Load Application, 11kV and LV) Received in 2019
Photovoltaic (PV) connections
In regard to distributed generation PV connections, MEDC received 14 new applications during 2019
with total requested generation capacity of 1.28 MW. In 2019 11 no. applications (including applications
from 2018 energised in 2019) were connected equating to 1.26MW, 12 no. applications are under
construction (including applications from 2018 which are still under construction) equating to 2.3MW
and 2 initial applications submitted equating to 0.162MW. Table 19 below shows these customer
classifications for the applications and connections. Appendix C, has the complete details of the 2019
applications.
Table 19 : PV Application and Connection Classification
S.No. Category No. of Applications Connected Generation (MW)
In 2019 YTD 2019 In 2019 YTD 2019
1 Commercial 8 16
1.28 2.26 2 Government 1 10
3 Residential 5 10
Total 14 36

MEDC Distribution System Capability Statement (2020-2022) – V1.0 48
5.2. System Constraints and Opportunities
Load related system constraints fall into one of two categories:
• Current constraints that can be considered DSSS obligations.
• Load related constraints based on current load growth forecasts.
MEDC will seek to address such constraints as part of its investment plan. Demand Not Secured (DNS)
non-compliances are identified and documented within Appendix B.
Table 20 provides a list of projected capacity constraints at the end of the planning horizon in 2022. If
the value is identified as negative, MEDC envisage there will be a deficit in spare capacity at that specific
substation, thus it is less advantageous for a customer to consider a new connection in that area.
Likewise, if there is spare capacity (positive), then this substation may be considered more
advantageous as a point for new customer connection.
Table 20 2022 Projected Capacity Constraints in MVA
Area Name Forecast Load (MVA) Firm Capacity (MVA) Spare Capacity Available [MVA]
Airport 77 100 23
Amerat 224 258 34
Ansab 84 80 -425
Azaibah 242 300 58
Bousher 72 80 8
GhubrahSouth 62 80 18
Hail 148 180 32
Khoud 153 160 7
Khuwair 230 240 10
Mabelah 391 440 49
QuriyatGroup 40 40 0
Mawaleh 151 180 29
Misfah 70 80 10
MSQ 61 80 19
Muscat 34 40 6
Mutrah 84 128 44
Qurum 68 76 8
Rusail 152 176 24
Ruwi 94 120 26
Sarooj 98 160 62
Seeb 160 180 20
WadiAdai 67 100 33
WadiKabir 75 112 37
25 The load will be closely monitored until that time.

MEDC Distribution System Capability Statement (2020-2022) – V1.0 49
6 . T H E I N V E S T M E N T P L A N
6.1. System Development Projects during the period 2020– 2022
Table 21 provides an overview of the status of primary substation projects by zone in the period 2020
to 2022.
Table 22 summarise the list of sponsored projects that are planned to be connected in the period 2020
to 2022.
Table 23, Table 24 and Table 25 summarise the projects planned for completion in the years 2020,2021
and 2022 respectively.
A summary description of each of the planned projects is provided by operating zone in Sections 6.1.1
to 6.1.3.
Table 21 Status of the Primary Substations at a Glance [2020-2022]
Project Stage Zone1 Zone2 Zone3
Completed - 126 -
Under Construction 4 2 3
Tendering - - -
Design - 1 4
Planning - 2 3
TOTAL 4 6 10
Table 22 Summary of Sponsored Projects
26 Completed means -the project is energized after the summer 2019; so these projects are considered for summer 2020
27 We have used the same number for ROP Hospital P172 ,because the existing 1x6 MVA will be dismantled after enegizing the new 3x20 MVA
PSS.
Zone Project Description Expected
Completion Date Status Details Purpose
1 New ROP Hospital [P172] 27
Primary Substation Q4’2019 Under Construction 3 x 20 MVA TX Government

MEDC Distribution System Capability Statement (2020-2022) – V1.0 50
Table 23 Summary of Planned Projects in MEDC Distribution System to meet Summer 2020 Maximum
Demand
Zone Project Description Expected
Compl.Date Status Details Purpose
1 Upgrading Post Office [P150] Primary Substation
Q4’2019 Under
Construction 3 x 20 MVA TX
To relieve the load of adjacent PSS & accommodate new loads
1 Upgrading Amerat Heights [P152] Primary Substation
Q4’2019 Under
Construction 3 x 20 MVA TX
To relieve the load of adjacent PSS & accommodate new loads
1 Upgrading Al Nahdah (P006) Primary Substation
Q1’2020 Under
Construction 3 x 20 MVA TX
To relieve the load of adjacent PSS & accommodate new loads
2 Upgrading Ghala 1[P015] Primary Substation
Energized after summer
2019 Completed 3 x 20 MVA TX
To relieve the load of adjacent PSS & accommodate new loads
2 Upgrading Al Awabi [P139] Primary Substation
Q1’2020 Under
Construction 3 x 20 MVA TX
To relieve the load of adjacent PSS & accommodate new loads
2 OETC Project: Adding third & fourth transformers 132/33kV at Airport Heights grid station
Q4’2019 Under
Construction 2 x 125 MVA TX
To meet Transmission Security Standard & To meet load growth in the area
3 New Seeb5[Boulevard] [P186] Primary Substation
Q4’2019 Under
Construction 3 x 20 MVA TX
To relieve the load of adjacent PSS & accommodate new loads
3 New Al Jifnain 2 (P196) Primary Substation
Q4’2019 Under
Construction 1 x 6 MVA TX
To relieve the load of adjacent PSS & accommodate new loads
Table 24 Summary of Planned Projects in MEDC Distribution System and OETC to meet Summer 2021
Maximum Demand
Table 25 Summary of Planned Projects in MEDC Distribution System and OETC to meet Summer 2022
Maximum Demand
Zone Project Description Expected
Compl.Date Status Details Purpose
2 New Sarooj-4(P181) Primary Substation
Q4’2021 Planning Stage 3 x 20 MVA TX To relieve the load of adjacent PSS & accommodate new loads
3 New Mabelah South PH 9[P185]PrimarySubstation
Q4’2021 Planning Stage 3 x 20 MVA TX To relieve the load of adjacent PSS & accommodate new loads.
3 New ROP Airport Height [P195] Primary Substation
Q4’2021 Planning Stage 3 x 20 MVA TX To accommodate new loads based on bulk application of ROP and Golden Tulip
3 OETC Project: Halban (Mabelah South] 132/33kV grid station
Q3’2021 Design Stage 4 x 125 MVA TX To cater for the new demand in the area & Load transfer from nearby grid station
Zone Project Description Expected
Compl.Date Status Details Purpose
1 New Amerat 4 [P180] Primary Substation
Q3’2020 Under Construction 3 x 20 MVA TX To relieve the load of adjacent PSS & accommodate new loads
2 New Ghala3 [P189] Primary Substation
Q1’2021 Design Stage 3 x 20 MVA TX To relieve the load of adjacent PSS & accommodate new loads
3 Upgrading Sur Al Hadid [P116]PrimarySubstation
Q3’2020 Under Construction 3 x 20 MVA TX To relieve the load of adjacent PSS & accommodate new loads
3 OETC Project: Khoudh 132/33kV grid station
Q2’2020 Under Construction 4 x 125 MVA TX To cater for the new demand in the area & Load transfer from nearby grid station
3 Upgrading Mabelah South [P061] Primary Substation
Q1’2021 Design Stage 3 x 20 MVA TX To relieve the load of adjacent PSS & accommodate new loads & to replace the assets
3 New Mabelah South PH 6[P185]PrimarySubstation
Q1’2021 Design Stage 3 x 20 MVA TX To relieve the load of adjacent PSS & accommodate new loads.
3 Upgrading Al Khod Shabiya [P046] Primary Substation
Q1’2021 Design Stage 3 x 20 MVA TX To relieve the load of adjacent PSS & accommodate new loads
3 New Al Khod Shabiya-B [P187] Primary Substation
Q1’2021 Design Stage 2 x 20 MVA TX To relieve the load of adjacent PSS & accommodate new loads
3 Upgrading Al Hail North 1(P027)PrimarySubstation
Q2’2021 Planning Stage 3 x 20 MVA TX To accommodate new bulk loads based on application
3 UpgradingMawalehNorth (P069)Primary Substation
Q2’2021 Planning Stage 3 x 20 MVA TX To accommodate new bulk loads based on application

MEDC Distribution System Capability Statement (2020-2022) – V1.0 51
Zone 1 – (The Eastern Zone)
The Zone 1 region includes the capital city of Muscat, Muttrah and an extensive rural network, which
covers the wilayats of Amerat and Quriyat. The number of customers served in the Zone 1 region is
126,956 which is approximately 32 % of the total customer population.
The following primary projects are projected in the period 2020 to 2022.
Project 1: Upgrading Post Office (P150) Primary Substation with 3 x 20 MVA Configuration
Upgrading Post Office primary substation in the Amerat Area to provide additional capacity to ensure
security of supply is maintained. The expected completion date of the project is Q4’2019 and the 33kV
connection point is from Amerat-A Grid.
Project 2: Upgrading Amerat Heights (P152) Primary Substation with 3 x 20 MVA Configuration
Upgrading of Amerat Heights primary substation in the Amerat Area to provide additional capacity to
ensure security of supply is maintained. The expected completion date of the project is Q4’2019 and
the 33kV connection point is from Amerat-A Grid.
Project 3: Upgrading Al Nahdah (P006) Primary Substation with 3 x 20 MVA Configuration
Upgrading of Al Nahdah primary substation in the Amerat Area to provide additional capacity to ensure
security of supply is maintained. The expected completion date of the project is Q1’2020 and the 33kV
connection point is from Amerat-B Grid.
Project 4: New Amerat-4 (P180) Primary Substation with 3 x 20 MVA Configuration
Amerat-4 primary substation is proposed in the Amerat Area to facilitate 11kV transfers and interlinks
with nearby primary (Al Nahdah and Amerat Heights) and to accommodate the new loads. The
expected completion date of the project is Q3’2021 and the 33kV connection point is from Amerat-B
Grid.

MEDC Distribution System Capability Statement (2020-2022) – V1.0 52
Zone 2 - (The Central Zone)
The Zone 2 region covers the commercial and residential areas of Bousher, Al Khuwair, Al Ansab,
Azaibah and Qurum. This is largely an established area, which has seen high load growth in previous
years. The Mall of Oman is the largest expected commercial projects in Zone 2 region.
The number of customers served in the Zone 2 region is 115,033 which is approximately 29 % of the
total customer population.
The following primary projects are projected in the period 2020 to 2022.
Project 1 : Upgrading Al Awabi (P139) Primary Substation with 3 x 20 MVA Configuration
Upgrading of Al Awabi primary substation is proposed in Awabi Area to facilitate the transfer of 11kV
loads from nearby loaded primary substations (Al Ansab 1) to ensure security of supply is maintained

MEDC Distribution System Capability Statement (2020-2022) – V1.0 53
whilst also addressing the voltage regulation issues in the area. The expected completion date of the
project is Q1’2020 and the 33kV connection point is from Misfah GSS.
Project 2: New Ghala 3(P189) Primary Substation with 3 x 20 MVA Configuration
The new Ghala 3 primary substation is proposed in the Azaibah area to facilitate 11kV transfers and
interlinks with nearby primary (Azaibah South 1-A and Azaibah South 1-B) and to accommodate the
new loads. The expected completion date of the project is Q1’2021 and the 33kV connection point is
from Ghala Heights GSS.
Project 3: New Sarooj-4 (P181) Primary Substation with 3 x 20 MVA Configuration
The new Sarooj-4 primary substation is proposed in the Sarooj Area to facilitate the connection of new
loads and the transfer of 11kV loads from nearby loaded primary substations to ensure security of
supply is maintained. The expected completion date of the project is Q4’2021 and the 33kV connection
point is from Qurum GSS.
Project 4: New ROP Airport Height (P195) Primary Substation with 3 x 20 MVA Configuration
The new ROP Airport Height primary substation is proposed in the Airport Area to facilitate the
connection of new bulk loads from ROP and Golden Tulip. The expected completion date of the project
is Q4’2021 and the 33kV connection point is from Airport Height GSS.
OETC Project: Adding third & fourth transformers 132/33kV at Airport Heights grid station
Adding third & fourth transformers 132/33kV at Airport Heights grid is required to meet Transmission
Security Standard and to meet load growth in the area. The expected completion date of the project is
Q4’2019.

MEDC Distribution System Capability Statement (2020-2022) – V1.0 54
Zone 3 - (The Western Zone)
The Zone 3 region includes the Muscat International Airport, Rusail Industrial Area, Seeb, Mawalleh, Al
Khoud and Mabelah areas. The number of customers served in the Zone 3 region is 156,375 which is
approximately 39 % of the total customer population.
The following primary projects are projected in the period 2020 to 2022.
Project 1: New Seeb05(Boulevard) (P186) Primary Substation with 3 x 20 MVA Configuration
The new Seeb05(Boulevard) primary substation in the Seeb area is proposed to accommodate new
loads and facilitate 11kV load transfers from nearby PSSs(Wadi Al Aresh,Wadi Al Lawami and Seeb
Grid) in that area whilst ensuring security of supply is maintained. The expected completion date of the
project is Q4’2019 and the 33kV connection point is from Seeb Main-B GSS.
Project 2: New Al Jifnain 2 (P196) Primary Substation with 1 x 6 MVA Configuration
The new Al Jifnain 2 primary substation in the Rusail area is proposed to accommodate new loads and
facilitate 11kV load transfers in that area whilst ensuring security of supply is maintained. The expected
completion date of the project is Q4’2019 and the 33kV connection point is from Rusail-A GSS
Project 3: Upgrading Sur Al Hadid (P116) Primary Substation with 3 x 20 MVA Configuration
Upgrading of Sur Al Hadid primary substation in the Seeb area is proposed to accommodate new loads
and facilitate 11kV load transfers in that area whilst ensuring security of supply is maintained. The
expected completion date of the project is Q3’2020 and the 33kV connection point is from Mabelah-A
GSS.
Project 4: Upgrading Mabelah South (P061) Primary Substation with 3 x 20 MVA Configuration
Upgrading of Mabelah South primary substation in the Mabelah area to upgrade the existing assets and
improve the security of supply in the area. The expected completion date of the project is Q1’2021 and
the 33kV connection point is from Mabelah-2(A’Salam) GSS.

MEDC Distribution System Capability Statement (2020-2022) – V1.0 55
Project 5: Upgrading Al Khoud Shabiya (P046) Primary Substation with 3 x 20 MVA Configuration
Upgrading of Al Khoud Shabiya primary substation in the Al Khoud area is proposed to accommodate
new loads and facilitate 11kV load transfers in that area whilst ensuring security of supply is maintained.
The expected completion date of the project is Q1’2021 and the 33kV connection point is from Seeb
Main-B GSS.
Project 6: New Al Khoud Shabiya-B (P187) Primary Substation with 2 x 20 MVA Configuration
The new Al Khoud Shabiya-B primary substation in the Al Khoud area is proposed to accommodate
new loads and facilitate 11kV load transfers from nearby PSSs(New Al Khoud and Al Khoud PH-7) in
that area whilst ensuring security of supply is maintained. The expected completion date of the project
is Q1’2021 and the 33kV connection point is from Khoudh GSS.
Project 7: New Mabelah South PH 6 (P185) Primary Substation with 3 x 20 MVA Configuration
The new Mabelah South PH 6 primary substation in the Mabelah area is proposed to accommodate
new loads and facilitate 11kV load transfers from nearby PSSs(Mabelah Grid and Mabelah South PH-
4) in that area whilst ensuring security of supply is maintained. The expected completion date of the
project is Q1’2021 and the 33kV connection point is from Mabelah-2(A’Salam) GSS.
Project 8: Upgrading Al Hail North 1(P027) Primary Substation with 3 x 20 MVA Configuration
Upgrading Al Hail North 1 primary substation in the Hail area is proposed to accommodate new bulk
load request from Al Mouj and Naseem A’Sabaa. The expected completion date of the project is
Q2’2021 and the 33kV connection point is from Mawaleh North GSS.
Project 9: Upgrading Mawaleh North (P069) Primary Substation with 3 x 20 MVA Configuration
Upgrading Mawaleh North primary substation in the Hail area is proposed to accommodate new bulk
load request from Al Mouj and Naseem A’Sabaa. The expected completion date of the project is
Q2’2021 and the 33kV connection point is from Mawaleh North GSS.
Project 10: New Mabelah South PH 9 (P184) Primary Substation with 3 x 20 MVA Configuration
The new Mabelah South PH 9 primary substation in the Mabelah area is proposed to accommodate
new loads and facilitate 11kV load transfers from nearby PSSs(Mabelah Grid,Mabelah South PH-7 and
Mabelah South PH-8) in that area whilst ensuring security of supply is maintained. The expected
completion date of the project is Q4’2021 and the 33kV connection point is from Halban(Mabelah South)
GSS.
OETC Project: Khoudh 132/33kV grid Station
Khoudh 132/33kV grid station is required to cater for the new demand in the area, to Load transfer from
nearby grid station and to meet Transmission Security Standard. The expected completion date of the
project is Q4’2020.
OETC Project: Halban(Mabelah South) 132/33kV grid Station
Halban(Mabelah South) 132/33kV grid station is required to cater for the new demand in the area, to
Load transfer from nearby grid station and to meet Transmission Security Standard. The expected
completion date of the project is Q3’2021.

MEDC Distribution System Capability Statement (2020-2022) – V1.0 56
A P P E N D I X A : D I S T R I B U T I O N L I C E N C E C O N D I T I O N 3 2 : D S C S
Distribution Licence Condition 32: Distribution System Capability Statement
1. The Licensee shall, within 12 months of the grant of this Licence, and thereafter, on an annual basis,
prepare a statement, in a form approved by the Authority, showing, in respect of each of the three
succeeding financial years, circuit capacity, forecast power flows and loading on each part of its
Distribution System and fault levels for each transmission node, together with:
a. Information on the status of distribution circuit capacity and the anticipated future requirements of
such capacity, including (i) applications for new connections and (ii) applications to Connect
Generation capacity to its Systems;
b. A commentary prepared by the Licensee indicating the Licensee's views as to those parts of its
Distribution System most suited to new Connections and Distribution of further quantities of
electricity, including the prospective for Connection of Systems operated by the Rural Areas
Electricity Company SAOC;
c. Information on what constraints are foreseen on the Licensee's Distribution System and where;
d. Information relating to progress of ongoing investment in its Distribution System;
e. Such further information as shall be reasonably necessary to enable any Person seeking to Connect
to or use the Licensee's Distribution System to identify and evaluate the opportunities for so doing;
f. An assessment of technical losses from the Licensee's Distribution System; and
g. Such other matters as shall be specified in directions issued by the Authority from time to time for
the purposes of this Condition, provided that the Authority may, upon application of the Licensee,
relieve the Licensee from the obligation to prepare any such statement in respect of any period and
any part or parts of its Distribution System specified in directions issued to the Licensee by the
Authority from time to time for the purposes of this Condition.
2. The Licensee shall include in every statement prepared in accordance with paragraph 1 above the
information required by that paragraph except that the Licensee may with the prior consent of the
Authority omit from any such statement any details as to the capacity, flows, loading or other
information, disclosure of which would, in the view of the Authority, seriously and prejudicially affect the
commercial interests of the Licensee or any third party.
3. The Licensee may periodically revise the information set out in and, with the approval of the Authority,
alter the form of the statement prepared in accordance with paragraph 1 and shall, at least once in
every year this Licence is in force, revise such statement in order that the information set out in the
statement shall continue to be accurate in all material respects.
4. The Licensee shall, when preparing the statement referred to in paragraph 1 of this Condition, ensure
that the statement takes due account of information required to be provided to it by Persons bound by
the Distribution Code.
5. The Licensee shall send a copy of the statement prepared in accordance with paragraph 1 and of each
revision of such statement in accordance with paragraph 3 to the Authority. Each such revision shall
require to be approved by the Authority and shall not become effective until approved by the Authority.
6. The Licensee shall, subject to paragraph 6, give or send a copy of the statement prepared in
accordance with paragraph 1 or (as the case may be) of the latest revision of such statement in
accordance with paragraph 3 approved by the Authority pursuant to such paragraph to any Person who
requests a copy of such statement.
7. The Licensee may make a charge for any statement given or sent pursuant to paragraph 4 of an amount
reflecting the Licensee's reasonable costs of providing such a statement, which shall not exceed the
maximum amount specified in directions issued by the Authority from time to time for the purposes of
this Condition

MEDC Distribution System Capability Statement (2020-2022) – V1.0 57
A P P E N D I X B : D S S S N O N - C O M P L I A N C E S
Zone Primary Substation P-No. TX Config Firm
(MVA)28 MW MVAr MVA DNS (MVA)
1 Post Office P150 2 x 20 20 26.5 10.5 28.5 6.5
1 Madinat Al Nahdah P065 2 x 20 20 23.1 6.7 24.1 2.1
1 Amerat Heights P152 2 x 20 20 21.8 8.6 23.4 1.4
1 Al Nahdah P006 2 x 20 20 22.3 9.5 24.3 2.3
2 Azaibah North 1 P011 2 x 20 20 20.5 8.9 22.3 0.3
2 Al Ansab 1 P007 2 x 20 20 21.0 8.5 22.7 0.7
2 Qurum 2 P094 2 x 20 20 21.1 6.8 22.2 0.2
2 Al Muna P084 2 x 20 20 22.5 10.3 24.8 2.8
2 MSQ Grid GP06 2 x 20 20 24.2 9.6 26.0 4.0
3 SultanSchool P029 2 x 20 20 21.4 9.2 23.3 1.3
3 Al Khoud Shabiya P046 2 x 20 20 21.5 6.1 22.3 0.3
3 Al Khoud PH-6 P049 2 x 20 20 25.1 3.6 25.3 3.3
3 Mabelah A P063 2 x 20 20 30.0 8.2 31.1 9.1
3 Old Mabelah P059 2 x 20 20 20.5 10.7 23.1 1.1
3 Mabelah Grid GP04 2 x 20 20 26.2 10.1 28.1 6.1
3 Mabelah C P064 2 x 20 20 25.1 9.9 27.0 5.0
3 Wadi Al Aresh P115 2 x 20 20 22.9 9.1 24.6 2.6
3 Mabelah South P061 2 x 20 20 24.1 10.9 26.5 4.5
3 Mawaleh South Grid GP05 2 x 20 20 21.8 10.8 24.3 2.3
3 Mabelah Shabiya P060 2 x 20 20 24.3 9.6 26.1 4.1
3 Al Jifnain P042 1 x 6 - 3.0 1.2 3.2 2.0
Total 62.0
28 For all >=20 MVA primary stations, AER has allowed an additional 10% to the Firm Capacity [ie: For 2x20 MVA TX -22MVA Firm and for 3x20
MVA TX -44MVA Firm] for the DNS calculation purposes only and not system planning or development.

MEDC Distribution System Capability Statement (2020-2022) – V1.0 58
A P P E N D I X C : L I S T O F 2 0 1 9 P V S O L A R A P P L I C A T I O N S
No Location
Connection Point Details Requested
kW Customer Category
Status
S/S Name 11kV FDR PSS Name
1 Wattayah New Telal Al Qurm Rabiat Al Qurm 6 Residential Connected
2 Bausher Bousher Hights
S/S 96 New Al Muna Al Muna 10 Residential Connected
3 Al Khuwair Ministry City S/S
No.22
M.O.AGR Fisheies
Diplomatic City
540 Government Connected
4 Ghala G.I.A S/S No 487
Qalahat L.N.G
Airport Height 3
160 Commercial
Initial application submitted
5 Al Seeb AL Hail Shamlya
s/s no. 36
Wadi Al Lawami Fdr 8
Wadi Al Lawami
40 Commercial Connected
6 Al Ansab New Al Marie Store
Al Ansab 2
10.2 Residential Connected
7 Misfah Misfah s/s no.
248 Bahwan Camp
fdr Al Misfah 210 Commercial Under Construction
8 Misfah Misfah s/s no.
248 Bahwan Camp
fdr Al Misfah 105 Commercial Under Construction
9 Misfah Misfah s/s no.
248 Bahwan Camp
fdr Al Misfah 105 Commercial Under Construction
10 Al Seeb Sur Al Hadid 14
Sur Al Hadid fdr 5
Sur Al Hadid
10 Residential Connected
11 Ghala GIA s/s no. 572 Al Kiyumi fdr Ghala 2 36 Commercial Under Construction
12 Al Ansab Al Ansab s/s no.
277 Al Naba fdr Al Ansab 2 36 Commercial Under Construction
13 Al Mabellah Mabelah South
s/s no. 78 Mabelah south
fdr 6 Mabelah South
Ph-07 8 Residential Under Construction
14 Al Khoudh New TBD TBD 2 Commercial Initial application
submitted

MEDC Distribution System Capability Statement (2020-2022) – V1.0 59
A P P E N D I X D : S Y S T E M S T U D Y R E S U L T S
Appendix D presents the following series of tables, for each grid substation power system model, which
show the expected performance of the distribution network under maximum and minimum demand
scenarios for each year from 2019 to 2022.
1. Primary Substations Maximum Demand and Percentage Loading
The maximum demand with real and reactive power loads at the PSS individual peak time in 2019
planning cycle and as accordingly forecasted for the period from 2020 to 2022. Percentage loading is
calculated based on the Firm Capacity of the PSS. This data was used in the load flow and fault level
studies for maximum demand scenario presented in this section of this DSCS.
2. Primary Substations Minimum Demand and Percentage Loading
The minimum demand with real and reactive power loads at the PSS individual minimum time in 2019
planning cycle and as accordingly forecasted for the period from 2020 to 2022. This data was used in
the load flow studies for minimum demand scenario presented in this section of this DSCS.
3. 33kV Feeder Loads
The resulting maximum demand in MVA on 33kV circuits/feeders, calculated for the individual non-
coincident maximum loads of the PSS(s) connected to these feeders for the period 2019 to 2022.
Percentage loading is calculated based on the de-rated capacity of the circuits.
4. Primary Substations Bus Voltages
The resulting voltage value (expressed in percentage of the nominal 33kV and 11kV) on the busbars of
the PSSs, corresponding to maximum and minimum demand scenarios.
5. Primary Substation 3-Phase Fault Current Levels (kA)
The resulting 3 phase maximum fault current level on the busbars of the PSSs, corresponding to
maximum demand scenarios. The rated breaking fault ratings of the switchgear are also specified.
Explanatory Notes:
a) 1TX in Firm Capacity means primary substation has single 33/11.5 kV transformer (i.e. zero N-
1 capacity and firm capacity equivalent to 11kV interconnection capacity);
b) Standby PSS means primary substation having 33kV and 11kV busbars energized with 11kV
outgoing feeders (i.e. loads) disconnected. The load on these PSSs is expected to be
connected occasionally, depending on requirement.
In the above mentioned tables, a “-“ (dash) appears in relevant years due to any of the following
reasons, as may be applicable:
− The primary substation is shifted (i.e. connected) to another grid substation;
− The primary substation, or any of its capacity enhancement project, is planned to be
energized/commissioned in the future;
− For Bus Voltages and 3 Phase Fault Current Levels tables, there is no 33kV second busbar or
node, hence 33kV Bus B results dashed out;
− There are no 11kV busbars (rather a different voltage level exists e.g. 6.9kV for a private
customer, operated and maintained by the customer);
− MEDC doesn’t have the information of the network below 33kV level.

MW MVAr MVA % MW MVAr MVA % MW MVAr MVA % MW MVAr MVA %
Falaj P178 16 9.7 6.0 11.4 71% 9.7 6.0 11.4 71% 9.7 6.0 11.4 71% 9.7 6.0 11.4 71%
Darsait P018 20 12.3 3.8 12.9 65% 12.3 3.6 12.8 64% 12.3 3.6 12.8 64% 12.3 3.6 12.8 64%
Mutrah Store P085 20 11.8 5.3 12.9 65% 11.8 5.7 13.1 66% 11.8 5.7 13.1 66% 11.8 5.7 13.1 66%
Jibrooh P041 40 24.2 11.7 26.8 67% 24.4 8.0 25.7 64% 24.4 8.0 25.7 64% 24.4 8.0 25.7 64%
Seaport P086 6 0.0 0.0 0.0 0% 4.0 1.6 4.3 72% 4.0 1.6 4.3 72% 4.0 1.6 4.3 72%
P.D.O P144 60 25.7 10.2 27.7 46% 25.7 10.2 27.7 46% 25.7 10.2 27.7 46% 25.7 10.2 27.7 46%
MW MVAr MVA % MW MVAr MVA % MW MVAr MVA % MW MVAr MVA %
Falaj P178 16 1.2 0.7 1.4 9% 1.2 0.7 1.4 9% 1.2 0.7 1.4 9% 1.2 0.7 1.4 9%
Darsait P018 20 2.8 0.0 2.8 14% 2.8 0.0 2.8 14% 2.8 0.0 2.8 14% 2.8 0.0 2.8 14%
Mutrah Store P085 20 1.9 1.6 2.5 13% 1.9 1.7 2.5 13% 1.9 1.7 2.5 13% 1.9 1.7 2.5 13%
Jibrooh P041 40 4.9 0.0 4.9 12% 4.7 0.0 4.7 12% 4.7 0.0 4.7 12% 4.7 0.0 4.7 12%
Seaport P086 6 0.0 0.0 0.0 0% 0.7 0.3 0.8 14% 1.9 0.8 2.0 34% 1.9 0.8 2.0 34%
P.D.O P144 60 4.8 2.2 5.3 9% 4.8 2.2 5.3 9% 4.8 2.2 5.3 9% 4.8 2.2 5.3 9%
22.0
22.0
22.0
22.0
22.0
22.0
22.0
22.0
22.0
22.0
22.0
22.0
22.0
Max Min Max Min Max Min Max Min Max Min Max Min Max Min Max Min
P018 100.7 101.4 103.8 106.0 100.5 101.2 103.6 105.7 100.5 101.1 103.6 105.7 100.5 101.1 103.6 105.7
P018 100.7 101.4 103.8 106.0 100.5 101.2 103.6 105.7 100.5 101.1 103.6 105.7 100.5 101.1 103.6 105.7
P178 100.7 101.4 103.0 105.8 100.5 101.2 102.8 105.5 100.5 101.1 102.8 105.5 100.5 101.1 102.8 105.5
P178 100.7 101.4 103.0 105.8 100.5 101.2 102.8 105.5 100.5 101.1 102.8 105.5 100.5 101.1 102.8 105.5
P041 100.4 101.4 102.3 106.0 100.2 101.1 102.1 105.3 100.2 101.1 102.1 105.2 100.2 101.1 102.1 105.2
P041 100.4 101.4 102.3 106.0 100.2 101.1 102.1 105.3 100.2 101.1 102.1 105.2 100.2 101.1 102.1 105.2
P041 99.5 101.4 100.7 106.0 98.9 100.7 100.3 104.4 98.9 100.6 100.3 104.3 98.9 100.6 100.3 104.3
P085 100.6 101.4 103.0 105.5 100.4 101.2 102.8 105.2 100.4 101.1 102.8 105.2 100.4 101.1 102.8 105.2
P085 100.6 101.4 103.0 105.5 100.4 101.2 102.8 105.2 100.4 101.1 102.8 105.2 100.4 101.1 102.8 105.2
P144 100.6 101.4 - - 100.4 101.2 - - 100.4 101.1 - - 100.4 101.1 - -
P144 100.6 101.4 - - 100.4 101.2 - - 100.4 101.1 - - 100.4 101.1 - -
P144 100.6 101.4 - - 100.4 101.2 - - 100.4 101.1 - - 100.4 101.1 - -
P144 100.6 101.4 - - 100.4 101.2 - - 100.4 101.1 - - 100.4 101.1 - -
P086 99.7 101.4 104.3 106.0 99.0 100.7 102.4 105.1 99.0 100.6 102.4 104.6 99.0 100.6 102.4 104.6
P086 99.7 101.4 104.3 106.0 99.0 100.7 102.4 105.1 99.0 100.6 102.4 104.6 99.0 100.6 102.4 104.6
P.No.Primary
Darsait-A
Darsait-B
Falaj-A
Falaj-B
PDO-D
Seaport-A
Seaport-B
11kV(%) 33kV (%) 11kV(%) 33kV (%)
2019 2020
Primary Substations Minimum Demand and Percentage Loading2019 2020 2021 2022
Firm Capacity(MVA)
Firm Capacity(MVA)
Primary Substations Bus Voltages
Primary Substation P.No.
Falaj[G23] GSS [Zone 1] - System Study ResultsPrimary Substations Maximum Demand and Percentage Loading
Primary Substation P.No.2019 2022
Darsait-F1-P018
Darsait-F2-P018
Falaj-F1-P178
Falaj-F2-P178
2021 2022
MVA %Loading MVA
5.8 26.4
MVA%Loading
5.8 26.4
5.8 26.4 5.8
6.6
29.8 6.6 29.8
6.4 29.3
16.8 76.4
6.7 30.4 6.7
6.5
Seaport-F1-P086
Mutrah Store-F1-P085
Mutrah Store-F2-P085
PDO-F1-P144
2020 2021
6.4 29.3 6.4 29.3
30.3 6.7 30.3 6.7 30.3
10.6 48.0 16.8 76.4 16.8 76.4
10.4
Primary
33kV Feeder Maximum Loads Rating(MVA)
2019 2020
Jibrooh-F1-P041
Jibrooh-F2-P041
26.4 5.8 26.4 5.8 26.4
5.8 26.4 5.8 26.4
6.9 31.3
38.0 10.4 47.4 10.4
6.9 31.3 6.9 31.3 6.9 31.3 6.9 31.3
6.9 31.3 6.9 31.3 6.9 31.3
6.6 30.1
6.9 31.3 6.9 31.3 6.9 31.3
47.4
8.4 47.4
8.4 38.0 10.4 47.4 10.4 47.4
29.7
10.4
6.6 29.8 6.6
%Loading MVA %Loading
6.4 29.3
30.2 6.6 30.1 6.6 30.1
6.9 31.36.9 31.3 6.9 31.3 6.9 31.3
PDO-C
11kV(%)
2021 2022
33kV (%) 11kV(%) 33kV (%)
PDO-B
PDO-A
PDO-F2-P144
PDO-F3-P144
PDO-F4-P144
47.4
6.9 31.3
Jibrooh-A
Jibrooh-B
Jibrooh-C
Mutrah Store-A
Mutrah Store-B
MEDC Distribution System Capability Statement [2020-2022]-V1.0 60

33kV 11kV 33kV 11kV 33kV 11kV 33kV 11kV
P018 20.8 13.9 21.5 14.0 21.5 14.0 21.1 14.0
P018 20.8 13.9 21.4 14.0 21.4 14.0 21.1 14.0
P178 21.5 13.3 22.2 13.4 22.2 13.4 21.9 13.4
P178 21.5 13.3 22.1 13.4 22.1 13.4 21.8 13.4
P041 15.8 13.8 16.2 14.4 16.2 14.4 16.0 14.3
P041 15.8 13.8 16.2 14.4 16.2 14.4 16.0 14.3
P041 8.9 7.0 9.2 7.4 9.2 7.4 9.1 7.4
P085 18.0 13.7 18.5 13.8 18.5 13.8 18.3 13.7
P085 18.0 13.7 18.5 13.8 18.5 13.8 18.3 13.7
P144 19.3 - 19.8 - 19.8 - 19.6 -
P144 19.3 - 19.8 - 19.8 - 19.6 -
P144 19.2 - 19.8 - 19.8 - 19.5 -
P144 19.2 - 19.8 - 19.8 - 19.5 -
P086 8.6 6.7 8.9 7.1 8.9 7.1 8.8 7.1
P086 8.6 6.7 8.9 7.1 8.9 7.1 8.8 7.1
Mutrah Store-B
PDO-A
25.0
25.0
25.0
25.0
25.0
25.0
25.0
18.4
18.4
20.0
20.0
20.025.0
25.0
33kV -Rated SC Capacity
11kV -Rated SC Capacity
18.4
2019 2020 2021 2022
-
Seaport-A
Darsait-A
Primary P.No.
Mutrah Store-A
PDO-B
PDO-C
PDO-D
Darsait-B
Falaj-A
Falaj-B
Jibrooh-A
18.4
18.4
Primary Substation 3-Phase Fault Current Levels (kA)
25.0
-
25.0
Jibrooh-B
Jibrooh-C
18.4
18.4
-
-
18.4
25.0
25.0
25.0
25.0
Seaport-B
MEDC Distribution System Capability Statement [2020-2022]-V1.0 61

MW MVAr MVA % MW MVAr MVA % MW MVAr MVA % MW MVAr MVA %
C.B.D P173 32 18.7 11.8 22.1 69% 18.7 12.6 22.5 70% 18.7 12.6 22.5 70% 18.7 12.6 22.5 70%
Ruwi Office P108 20 14.5 8.4 16.8 84% 14.6 4.8 15.4 77% 14.6 4.8 15.4 77% 14.6 4.8 15.4 77%
M.O.D P143 1TX 5.1 2.0 5.5 - 5.1 2.0 5.5 - 5.1 2.0 5.5 - 5.1 2.0 5.5 -
Bait Al Falaj P142 40 23.3 11.4 25.9 65% 23.3 7.7 24.5 61% 23.3 7.7 24.5 61% 23.3 7.7 24.5 61%
Riyam P099 20 15.8 4.3 16.4 82% 15.8 4.6 16.5 82% 15.8 4.6 16.5 82% 15.8 4.6 16.5 82%
MW MVAr MVA % MW MVAr MVA % MW MVAr MVA % MW MVAr MVA %
C.B.D P173 32 4.1 2.7 4.9 15% 4.2 2.7 5.0 16% 4.2 2.7 5.0 16% 4.2 2.7 5.0 16%
Ruwi Office P108 20 2.5 1.1 2.7 13% 2.3 1.0 2.5 12% 2.3 1.0 2.5 12% 2.3 1.0 2.5 12%
M.O.D P143 1TX 0.9 0.4 1.0 - 0.9 0.4 1.0 - 0.9 0.4 1.0 - 0.9 0.4 1.0 -
Bait Al Falaj P142 40 5.6 2.9 6.3 16% 5.3 2.7 6.0 15% 5.3 2.7 6.0 15% 5.3 2.7 6.0 15%
Riyam P099 20 2.1 1.2 2.4 12% 2.1 1.2 2.4 12% 2.1 1.2 2.4 12% 2.1 1.2 2.4 12%
22.0
22.0
22.0
22.0
22.0
22.0
22.0
15.4
15.4
22.0
22.0
37.6 8.3
Bait Al Falaj-F3-P142 8.9 40.5 8.3 37.7 8.3 37.7
2020 2021 2022
33kV Feeder Maximum Loads
Primary2019
C.B.D-F2-P173 8.9 40.4
Mutrah[G21] GSS [Zone 1] - System Study ResultsPrimary Substations Maximum Demand and Percentage Loading
Primary Substation P.No.Firm
Capacity(MVA)
2019
%Loading MVA %Loading
Primary Substations Minimum Demand and Percentage Loading
Primary Substation P.No.Firm
Capacity(MVA)
2019 2020 2021 2022
Bait Al Falaj-F1-P142 8.8 39.9 8.3 37.6 8.3
8.3
M.O.D-F1-P143 5.6 25.3 5.6
40.0 8.3 37.7 8.3 37.7 8.3
7.7
Ruwi Office-F1-P108 8.5 38.8 7.8 35.5 7.8
Rating(MVA)
2020 2021 2022
MVA %Loading MVA %Loading MVA
37.7
Bait Al Falaj-F2-P142 8.8 37.7
7.7 35.0 7.7 35.0 7.7 35.0
C.B.D-F1-P173 9.0 40.8 7.8 35.3 7.8 35.3 7.8 35.3
37.6
25.3 5.6 25.3 5.6 25.3
C.B.D-F3-P173 5.6 25.4 7.7 35.1 7.7 35.1 35.1
Riyam-F2-P099 8.5 55.0 8.4 54.8 8.4 54.8 8.4 54.8
Riyam-F1-P099 8.4 54.5 8.4 54.3 8.4 54.3 8.4 54.3
35.5 7.8 35.5
Ruwi Office-F2-P108 8.5 38.7 7.8 35.5 7.8 35.5 7.8 35.5
MEDC Distribution System Capability Statement [2020-2022]-V1.0 62

Max Min Max Min Max Min Max Min Max Min Max Min Max Min Max Min
P142 100.0 100.6 101.8 104.5 100.6 100.6 103.2 104.5 100.6 100.6 103.2 104.5 100.6 100.6 103.2 104.5
P142 100.0 100.6 101.8 104.5 100.6 100.6 103.2 104.5 100.6 100.6 103.2 104.5 100.6 100.6 103.2 104.5
P142 100.0 100.6 101.7 104.5 100.6 100.6 103.2 104.5 100.6 100.6 103.2 104.5 100.6 100.6 103.2 104.5
P173 100.2 100.6 101.4 104.5 100.7 100.6 102.4 104.6 100.7 100.6 102.4 104.6 100.7 100.6 102.4 104.6
P173 100.2 100.6 101.4 104.5 100.7 100.6 102.4 104.6 100.7 100.6 102.4 104.6 100.7 100.6 102.4 104.6
P173 100.2 100.6 102.6 104.7 100.7 100.6 102.4 104.6 100.7 100.6 102.4 104.6 100.7 100.6 102.4 104.6
P143 100.1 100.6 101.9 104.6 100.7 100.6 102.5 104.6 100.7 100.6 102.5 104.6 100.7 100.6 102.5 104.6
P099 98.6 100.4 101.1 104.5 99.1 100.4 101.7 104.6 99.1 100.4 101.7 104.6 99.1 100.4 101.7 104.6
P099 98.6 100.4 101.1 104.5 99.1 100.4 101.7 104.6 99.1 100.4 101.7 104.6 99.1 100.4 101.7 104.6
P108 100.1 100.6 101.5 104.7 100.6 100.6 103.3 104.8 100.6 100.6 103.3 104.8 100.6 100.6 103.3 104.8
P108 100.1 100.6 101.5 104.7 100.6 100.6 103.3 104.8 100.6 100.6 103.3 104.8 100.6 100.6 103.3 104.8
33kV 11kV 33kV 11kV 33kV 11kV 33kV 11kV
P142 18.7 14.3 18.9 14.3 18.9 14.3 18.6 14.2
P142 18.7 14.3 18.9 14.3 18.9 14.3 18.6 14.2
P142 18.6 8.0 18.8 8.0 18.8 8.0 18.5 7.9
P173 22.7 14.9 23.0 14.7 23.0 14.7 22.6 14.7
P173 22.7 14.9 23.0 14.7 23.0 14.7 22.6 14.7
P173 22.7 8.0 23.0 8.2 23.0 8.2 22.6 8.2
P143 20.3 4.9 20.5 4.9 20.5 4.9 20.2 4.9
P099 7.3 11.9 7.3 11.9 7.3 11.9 7.3 11.9
P099 7.3 11.9 7.3 11.9 7.3 11.9 7.3 11.9
P108 19.4 14.1 19.6 14.0 19.6 14.0 19.3 14.0
P108 19.4 14.1 19.6 14.0 19.6 14.0 19.3 14.0
Primary P.No.
2019 2020 2021 2022
33kV (%) 11kV(%) 33kV (%) 11kV(%) 33kV (%)
Primary Substations Bus Voltages
Ruwi Office-A
Ruwi Office-B
Primary Substation 3-Phase Fault Current Levels (kA)
Primary P.No. 33kV -Rated SC Capacity
11kV -Rated SC Capacity
2019 2020 2021 2022
Bait Al Falaj-A
Bait Al Falaj-B
Bait Al Falaj-C
C.B.D-A
C.B.D-B
C.B.D-C
M.O.D
Riyam-A
Riyam-B
Ruwi Office-A 25.0 18.4
Ruwi Office-B 25.0 18.4
M.O.D 25.0 18.4
Riyam-A 25.0 18.4
Riyam-B 25.0 18.4
C.B.D-A 25.0 18.4
C.B.D-B 25.0 18.4
C.B.D-C 25.0
11kV(%) 33kV (%) 11kV(%)
18.4
Bait Al Falaj-A 25.0 25.0
Bait Al Falaj-B 25.0 25.0
Bait Al Falaj-C 25.0 25.0
MEDC Distribution System Capability Statement [2020-2022]-V1.0 63

MW MVAr MVA % MW MVAr MVA % MW MVAr MVA % MW MVAr MVA %
Ali Shihani P125 20 10.8 5.8 12.3 62% 10.8 3.5 11.4 57% 10.8 3.5 11.4 57% 10.8 3.5 11.4 57%
M.B.D. South P075 20 14.6 7.6 16.5 83% 14.6 4.8 15.4 77% 14.6 4.8 15.4 77% 14.6 4.8 15.4 77%
Majlis Oman P066 20 4.6 1.2 4.8 24% 4.6 1.2 4.7 24% 4.6 1.2 4.7 24% 4.6 1.2 4.7 24%
Qasr Al Alam P090 20 16.4 8.0 18.2 91% 16.4 5.4 17.3 86% 16.4 5.4 17.3 86% 16.4 5.4 17.3 86%
Sidab P119 6 4.5 1.8 4.9 81% 4.5 1.8 4.9 81% 4.5 1.8 4.9 81% 4.5 1.8 4.9 81%
Wadi Al Kabir Housing P127 1TX Standby PSS
Wadi Al Kabir Workshop P126 6 2.3 0.9 2.5 42% 2.3 0.9 2.5 42% 2.3 0.9 2.5 42% 2.3 0.9 2.5 42%
Waljah P130 20 17.0 0.0 17.0 85% 17.1 0.0 17.1 86% 17.1 0.0 17.1 86% 17.1 0.0 17.1 86%
MWMVA
rMVA % MW
MVAr
MVA % MWMVA
rMVA % MW
MVAr
MVA %
Ali Shihani P125 20 2.1 1.6 2.6 13% 1.9 1.5 2.4 12% 1.9 1.5 2.4 12% 1.9 1.5 2.4 12%
M.B.D. South P075 20 2.2 1.6 2.7 14% 2.0 1.5 2.5 13% 2.0 1.5 2.5 13% 2.0 1.5 2.5 13%
Majlis Oman P066 20 1.0 0.0 1.0 5% 1.0 0.0 1.0 5% 1.0 0.0 1.0 5% 1.0 0.0 1.0 5%
Qasr Al Alam P090 20 4.4 2.6 5.1 26% 4.2 2.4 4.8 24% 4.2 2.4 4.8 24% 4.2 2.4 4.8 24%
Sidab P119 6 0.8 0.4 0.9 15% 0.8 0.4 0.9 15% 0.8 0.4 0.9 15% 0.8 0.4 0.9 15%
Wadi Al Kabir Housing P127 1TX Standby PSS
Wadi Al Kabir Workshop P126 6 0.4 0.2 0.5 8% 0.4 0.2 0.5 8% 0.4 0.2 0.5 8% 0.4 0.2 0.5 8%
Waljah P130 20 2.4 1.0 2.6 13% 2.4 1.0 2.6 13% 2.4 1.0 2.6 13% 2.4 1.0 2.6 13%
22.0
22.0
22.0
22.0
22.0
22.0
15.4
15.4
22.0
22.0
22.0
Max Min Max Min Max Min Max Min Max Min Max Min Max Min Max Min
P125 100.1 100.5 102.6 104.6 100.7 100.6 103.9 104.6 100.7 100.6 103.9 104.6 100.7 100.6 103.9 104.6
P125 100.2 100.5 102.6 104.6 100.7 100.6 103.9 104.6 100.7 100.6 103.9 104.6 100.7 100.6 103.9 104.6
P075 100.0 100.5 101.9 104.6 100.6 100.5 103.4 104.6 100.6 100.5 103.4 104.6 100.6 100.5 103.4 104.6
P075 100.0 100.5 101.9 104.6 100.6 100.5 103.4 104.6 100.6 100.5 103.4 104.6 100.6 100.5 103.4 104.6
P066 100.0 100.5 104.1 105.1 100.5 100.5 104.6 105.1 100.5 100.5 104.6 105.1 100.5 100.5 104.6 105.1
P066 100.0 100.5 104.1 105.1 100.5 100.5 104.6 105.1 100.5 100.5 104.6 105.1 100.5 100.5 104.6 105.1
P090 98.7 100.2 100.1 103.8 99.4 100.2 101.8 103.9 99.4 100.2 101.8 103.9 99.4 100.2 101.8 103.9
P090 98.7 100.2 100.1 103.8 99.5 100.2 101.8 103.9 99.5 100.2 101.8 103.9 99.5 100.2 101.8 103.9
P119 99.7 100.5 103.1 104.8 100.3 100.5 103.7 104.8 100.3 100.5 103.7 104.8 100.3 100.5 103.7 104.8
P119 99.7 100.5 103.1 104.8 100.3 100.5 103.7 104.8 100.3 100.5 103.7 104.8 100.3 100.5 103.7 104.8
P127 100.1 100.5 104.6 105.1 100.6 100.5 105.2 105.1 100.6 100.5 105.2 105.1 100.6 100.5 105.2 105.1
P126 100.0 100.5 103.9 105.0 100.6 100.5 104.5 105.0 100.6 100.5 104.5 105.0 100.6 100.5 104.5 105.0
P126 - - 103.9 105.0 - - 104.5 105.0 - - 104.5 105.0 - - 104.5 105.0
P130 100.1 100.5 104.2 104.7 100.6 100.5 104.8 104.7 100.6 100.5 104.8 104.7 100.6 100.5 104.8 104.7
P130 100.1 100.5 104.2 104.7 100.6 100.5 104.8 104.7 100.6 100.5 104.8 104.7 100.6 100.5 104.8 104.7
Qasr al Alam-F1-P090 9.5 61.8 8.9 57.8
Qasr al Alam-F2-P090 9.4 61.0 8.8 57.1
Qasr al Alam-A
Qasr al Alam-B
8.9 57.8
26.1
Ali Shihani-F1-P125 6.2 28.3 5.7 26.1 5.7 26.1 5.7 26.1
7.8
Wadi Al Kabir[G19] - A GSS [Zone 1] - System Study ResultsPrimary Substations Maximum Demand and Percentage Loading
Primary Substation P.No.Firm
Capacity(MVA)
2019 2020 2021 2022
Primary Substations Minimum Demand and Percentage Loading
Primary Substation P.No.Firm
Capacity(MVA)
2019 2020 2021 2022
M.B.D. South-F1-P075 8.4 38.0 7.8 35.4
33kV Feeder Maximum Loads
Primary Rating(MVA)
2019 2020 2021
Majlis Oman-F1-P066 2.3 10.6 2.4 10.7 2.4 10.7 2.4 10.7
Walja-F1-P130 8.6 39.0 8.7 39.4 8.7 39.4 8.7 39.4
Muscat 01 Fdr-WorkshopP126, SidabP119 & WK Housing
7.5 34.0 7.5 34.0 7.5 34.0 7.5 34.0
Walja-F2-P130 8.5 38.6 8.6 38.9 8.6 38.9
8.9 57.8
8.8 57.1 8.8 57.1
2022
MVA %Loading MVA %Loading MVA %Loading MVA %Loading
Ali Shihani-F2-P125 6.2 28.3 5.8 26.1 5.8 26.1 5.8
M.B.D. South-F2-P075 8.4 38.0 7.8 35.4 7.8 35.4 7.8 35.4
35.4 7.8 35.4
Majlis Oman-F2-P066 2.4
Wadi Al Kabir Workshop-A
33kV (%) 11kV(%) 33kV (%) 11kV(%)
Majlis Oman-B
Sidab-A
Sidab-B
Wadi Al Kabir Housing
Primary Substations Bus Voltages
Primary P.No.
2019 2020 2021
8.6 38.9
2022
33kV (%) 11kV(%) 33kV (%) 11kV(%)
10.7 2.4 10.8 2.4 10.8 2.4
Wadi Al Kabir Workshop-B
Walja-A
Walja-B
10.8
Ali Shihani-A
Ali Shihani-B
M.B.D. South-A
M.B.D. South-B
Majlis Oman-A
MEDC Distribution System Capability Statement [2020-2022]-V1.0 64

33kV 11kV 33kV 11kV 33kV 11kV 33kV 11kV
P125 20.5 13.9 20.7 13.8 20.7 13.8 20.4 13.8
P125 20.5 13.9 20.7 13.8 20.7 13.8 20.4 13.8
P075 18.5 14.3 18.7 14.3 18.7 14.3 18.5 14.2
P075 18.5 14.3 18.7 14.3 18.7 14.3 18.4 14.2
P066 7.9 11.1 8.0 11.1 8.0 11.1 7.9 11.1
P066 7.9 11.1 8.0 11.1 8.0 11.1 7.9 11.1
P090 8.6 12.7 8.6 12.6 8.6 12.6 8.6 12.6
P090 8.6 12.7 8.6 12.6 8.6 12.6 8.6 12.6
P119 9.8 7.5 9.9 7.5 9.9 7.5 9.8 7.5
P119 9.8 7.5 9.9 7.5 9.9 7.5 9.8 7.5
P127 15.3 4.4 15.4 4.4 15.4 4.4 15.2 4.4
P126 15.5 4.5 15.6 4.5 15.6 4.5 15.4 4.5
P126 - 4.3 - 4.3 - 4.3 - 4.3
P130 17.0 13.8 17.2 13.9 17.2 13.9 17.0 13.8
P130 16.5 13.8 16.7 13.9 16.7 13.9 16.4 13.8
M.B.D. South-B 25.0 20.0
Majlis Oman-A 25.0 20.0
Majlis Oman-B 25.0 20.0
20.0
M.B.D. South-A 25.0 20.0
Primary Substation 3-Phase Fault Current Levels (kA)
Primary P.No. 33kV -Rated SC Capacity
11kV -Rated SC Capacity
2019 2020 2021 2022
Wadi Al Kabir Workshop-A 25.0 18.4
Wadi Al Kabir Workshop-B - 18.4
Walja-A 25.0 20.0
Walja-B 25.0 20.0
25.0 18.4
Sidab-B 25.0 18.4
Wadi Al Kabir Housing 25.0 18.4
Ali Shihani-A 25.0 20.0
Ali Shihani-B 25.0
Qasr al Alam-A 25.0 18.4
Qasr al Alam-B 25.0 18.4
Sidab-A
MEDC Distribution System Capability Statement [2020-2022]-V1.0 65

MW MVAr MVA % MW MVAr MVA % MW MVAr MVA % MW MVAr MVA %
Old Airport P107 20 14.5 11.7 18.6 93% 14.6 11.7 18.8 94% 14.6 11.7 18.8 94% 14.6 11.7 18.8 94%
Ruwi Market P076 20 14.9 8.0 16.9 85% 15.0 8.1 17.1 85% 15.0 8.1 17.1 85% 15.0 8.1 17.1 85%
Ruwi Valley P174 20 19.3 9.3 21.4 107% 19.3 9.2 21.4 107% 19.3 9.2 21.4 107% 19.3 9.2 21.4 107%
Wadi Al Kabir Height P128 20 13.9 6.3 15.3 77% 13.9 4.6 14.6 73% 13.9 4.6 14.6 73% 13.9 4.6 14.6 73%
MW MVAr MVA % MW MVAr MVA % MW MVAr MVA % MW MVAr MVA %
Old Airport P107 20 2.7 2.1 3.4 17% 2.7 2.1 3.4 17% 2.7 2.1 3.4 17% 2.7 2.1 3.4 17%
Ruwi Market P076 20 2.5 2.0 3.2 16% 2.5 2.0 3.2 16% 2.5 2.0 3.2 16% 2.5 2.0 3.2 16%
Ruwi Valley P174 20 3.0 2.3 3.8 19% 3.0 2.3 3.8 19% 3.0 2.3 3.8 19% 3.0 2.3 3.8 19%
Wadi Al Kabir Height P128 20 2.9 1.8 3.4 17% 2.8 1.7 3.3 16% 2.8 1.7 3.3 16% 2.8 1.7 3.3 16%
22.0
22.0
22.0
22.0
22.0
22.0
22.0
22.0
Max Min Max Min Max Min Max Min Max Min Max Min Max Min Max Min
P107 100.4 100.4 100.9 104.3 100.5 100.4 101.0 104.3 100.5 100.4 101.0 104.3 100.5 100.4 101.0 104.3
P107 100.4 100.4 100.9 104.3 100.5 100.4 101.0 104.3 100.5 100.4 101.0 104.3 100.5 100.4 101.0 104.3
P076 100.5 100.5 102.2 104.3 100.6 100.5 102.3 104.3 100.6 100.5 102.3 104.3 100.6 100.5 102.3 104.3
P076 100.5 100.5 102.2 104.3 100.6 100.5 102.3 104.3 100.6 100.5 102.3 104.3 100.6 100.5 102.3 104.3
P174 100.6 100.5 101.8 104.3 100.8 100.5 101.9 104.3 100.8 100.5 101.9 104.3 100.8 100.5 101.9 104.3
P174 100.6 100.5 101.8 104.3 100.8 100.5 101.9 104.3 100.8 100.5 101.9 104.3 100.8 100.5 101.9 104.3
P128 100.3 100.4 102.5 104.4 100.5 100.4 103.3 104.4 100.5 100.4 103.3 104.4 100.5 100.4 103.3 104.4
P128 100.3 100.4 102.5 104.4 100.5 100.4 103.3 104.4 100.5 100.4 103.3 104.4 100.5 100.4 103.3 104.4
33kV 11kV 33kV 11kV 33kV 11kV 33kV 11kV
P107 17.4 14.4 17.6 14.5 17.6 14.5 17.3 14.4
P107 17.4 14.4 17.6 14.5 17.6 14.5 17.3 14.4
P076 18.8 14.3 19.0 14.4 19.0 14.4 18.8 14.3
P076 18.8 14.3 19.0 14.4 19.0 14.4 18.7 14.3
P174 21.9 15.1 22.2 15.2 22.2 15.2 21.8 15.1
P174 21.8 15.1 22.1 15.2 22.1 15.2 21.7 15.1
P128 14.9 13.6 15.0 13.6 15.0 13.6 14.8 13.5
P128 14.9 13.6 15.0 13.6 15.0 13.6 14.9 13.5
Wadi Al Kabir Height 1-A 25.0 20.0
Wadi Al Kabir Height 1-B 25.0 20.0
Old Airport-A 25.0 18.4
Old Airport-B 25.0 18.4
Ruwi Market-A 25.0 18.4
Ruwi Market-B 25.0 18.4
Ruwi Valley-A 25.0 18.4
Ruwi Valley-B 25.0 18.4
Old Airport-A
Old Airport-B
Ruwi Market-A
Ruwi Market-B
Ruwi Valley-A
Ruwi Valley-B
Wadi Al Kabir Height 1-A
Wadi Al Kabir Height 1-B
Primary Substation 3-Phase Fault Current Levels (kA)
Primary
2020 2021 2022
33kV (%) 11kV(%) 33kV (%) 11kV(%) 33kV (%) 11kV(%) 33kV (%)
34.8 7.3 33.4 7.3 33.4 7.3 33.4
39.5
Ruwi Market-F2-P076 8.7 39.5 8.8 39.8 8.8 39.8
Old Airport-F2-P107 9.7 44.1 9.8 44.3 9.8 44.3 9.8 44.3
Old Airport-F1-P107 9.5
2020 2021 2022
33kV Feeder Maximum Loads
Primary Rating(MVA)
2019 2020 2021 2022
MVA %Loading MVA %Loading MVA %Loading MVA %Loading
8.8 39.8
43.1 9.5 43.4 9.5 43.4 9.5 43.4
11kV(%)
Wadi Al Kabir Height 1-F1-P128 7.7 34.8 7.3 33.4 7.3 33.4 7.3 33.4
Wadi Al Kabir Height 1-F2-P128 7.7
Wadi Al Kabir[G19] - B GSS [Zone 1] - System Study ResultsPrimary Substations Maximum Demand and Percentage Loading
Primary Substation P.No.Firm
Capacity(MVA)
2019 2020
Ruwi Market-F1-P076 8.6 39.2 8.7 39.5 8.7 39.5 8.7
50.2 11.0 50.2
Ruwi Valley-F2-P174 11.2 50.7 11.1 50.6 11.1 50.6 11.1 50.6
P.No. 33kV -Rated SC Capacity
11kV -Rated SC Capacity
2019 2020 2021 2022
Primary Substations Bus Voltages
Primary P.No.
2019
Ruwi Valley-F1-P174 11.1 50.2 11.0 50.2 11.0
2021 2022
Primary Substations Minimum Demand and Percentage Loading
Primary Substation P.No.Firm
Capacity(MVA)
2019
MEDC Distribution System Capability Statement [2020-2022]-V1.0 66

MW MVAr MVA % MW MVAr MVA % MW MVAr MVA % MW MVAr MVA %
Al Bustan Palace P017 16 4.6 1.8 4.9 31% 4.6 1.8 4.9 31% 4.6 1.8 4.9 31% 4.6 1.8 4.9 31%
Al Hamryah P035 20 9.9 4.8 11.0 55% 9.9 3.3 10.4 52% 9.9 4.8 11.0 55% 9.9 4.8 11.0 55%
Al Mahaj P136 6 2.6 1.0 2.8 46% 2.8 1.1 3.1 51% 3.2 1.3 3.4 57% 3.5 1.4 3.8 63%
Amerat 1 P005 16 13.4 1.1 13.4 84% 14.9 0.0 14.9 93% 14.4 0.0 14.4 90% 16.0 0.0 16.0 100%
Khoula Hospital P132 40 19.4 6.5 20.5 51% 19.4 6.4 20.4 51% 19.4 6.4 20.4 51% 19.4 6.4 20.4 51%
Qantab P089 1TX Standby PSS
Wadi Adai P175 20 17.0 8.0 18.8 94% 17.0 8.0 18.8 94% 17.0 8.0 18.8 94% 17.0 8.0 18.8 94%
Wattaya P131 20 16.1 2.3 16.3 82% 16.1 2.3 16.3 82% 16.1 2.3 16.3 82% 16.1 2.3 16.3 82%
MW MVAr MVA % MW MVAr MVA % MW MVAr MVA % MW MVAr MVA %
Al Bustan Palace P017 16 0.9 0.4 0.9 6% 0.9 0.4 0.9 6% 0.9 0.4 0.9 6% 0.9 0.4 0.9 6%
Al Hamryah P035 20 1.4 1.1 1.8 9% 1.3 1.1 1.7 9% 1.4 1.1 1.8 9% 1.4 1.1 1.8 9%
Al Mahaj P136 6 0.5 0.2 0.5 9% 0.5 0.2 0.6 10% 0.6 0.3 0.6 11% 0.7 0.3 0.7 12%
Amerat 1 P005 16 3.7 1.8 4.1 26% 4.1 2.0 4.6 28% 4.0 1.9 4.4 28% 4.4 2.1 4.9 31%
Khoula Hospital P132 40 2.9 1.1 3.1 8% 2.9 1.1 3.1 8% 2.9 1.1 3.1 8% 2.9 1.1 3.1 8%
Qantab P089 1TX Standby PSS
Wadi Adai P175 20 3.3 2.4 4.1 21% 3.3 2.4 4.1 21% 3.3 2.4 4.1 21% 3.3 2.4 4.1 21%
Wattaya P131 20 3.0 1.6 3.4 17% 3.0 1.6 3.4 17% 3.0 1.6 3.4 17% 3.0 1.6 3.4 17%
22.0
22.0
15.4
15.4
22.0
15.4
15.4
22.0
22.0
22.0
22.0
22.0
22.0
22.0
Khoula Hospital-F1-P132 6.7 30.6 6.8 31.1 6.8 31.1 6.8 31.1
Wadi Adai-F2-P175 9.8 44.4 9.8 44.4 9.8 44.4 9.8 44.4
Khoula Hospital-F2-P132 6.7 30.4 6.8 31.0 6.8 31.0 6.8 31.0
Khoula Hospital-F3-P132 7.0 32.0 6.8 31.1
Wattaya-F1-P131 8.3 37.6 8.3 37.5 8.3 37.6 8.3 37.6
Wattaya-F2-P131 8.2 37.3 8.2 37.3 8.2 37.3 8.2 37.3
Amerat 1-F1-P005 6.8 44.1 7.5 49.0 7.3 47.2 8.1 52.7
Amerat 1-F2-P005 6.8 44.0 7.5 48.8 7.2 47.1 8.1 52.5
6.8 31.1 6.8 31.1
9.7 44.3 9.7 44.3 9.7 44.3 9.7 44.3Wadi Adai-F1-P175
Al Mahaj-F1-P136 0.9 3.9 1.0 4.4 1.1 4.9 1.2 5.4
Al Hamryah-F2-P035 5.6 36.4 5.3 34.3 5.6 36.4 5.6 36.4
Al Bustan Palace-F2-P017 2.4 11.0 2.4 11.0 2.4 11.0 2.4 11.0
Al Hamryah-F1-P035 5.6 36.4 5.3 34.3 5.6 36.3 5.6 36.3
33kV Feeder Maximum Loads
Primary Rating(MVA)
2019 2020 2021 2022
MVA %Loading MVA %Loading MVA %Loading MVA %Loading
Al Bustan Palace-F1-P017 2.4 11.0 2.4 11.0 2.4 11.0 2.4 11.0
Primary Substations Minimum Demand and Percentage Loading
Primary Substation P.No.Firm
Capacity(MVA)
2019 2020 2021 2022
Wadi Adai[G22] GSS [Zone 1] - System Study ResultsPrimary Substations Maximum Demand and Percentage Loading
Primary Substation P.No.Firm
Capacity(MVA)
2019 2020 2021 2022
MEDC Distribution System Capability Statement [2020-2022]-V1.0 67

Max Min Max Min Max Min Max Min Max Min Max Min Max Min Max Min
P017 99.8 100.7 103.6 105.1 99.8 100.7 103.7 105.1 99.7 100.6 103.5 105.1 99.7 100.6 103.5 105.1
P017 99.8 100.6 103.6 105.1 99.8 100.6 103.7 105.1 99.7 100.6 103.5 105.1 99.7 100.6 103.5 105.1
P035 100.1 100.6 102.8 104.8 100.2 100.6 103.5 104.8 100.0 100.6 102.8 104.8 100.0 100.6 102.7 104.8
P035 100.1 100.6 102.8 104.8 100.2 100.6 103.5 104.8 100.0 100.6 102.8 104.8 100.0 100.6 102.7 104.8
P136 99.6 100.6 103.5 105.0 99.6 100.6 103.4 105.0 99.3 100.6 103.0 105.0 99.2 100.5 102.7 104.9
P136 99.6 100.6 103.5 105.0 99.6 100.6 103.4 105.0 99.3 100.6 103.0 105.0 99.2 100.5 102.7 104.9
P005 99.7 100.3 104.0 104.1 99.8 100.3 103.9 104.1 99.7 100.3 103.8 104.2 99.5 100.3 103.6 104.0
P005 99.8 100.3 104.0 104.1 99.8 100.3 103.9 104.1 99.7 100.3 103.8 104.2 99.5 100.3 103.6 104.0
P132 100.1 100.6 103.0 104.9 100.2 100.6 103.1 104.9 100.1 100.6 102.9 104.9 100.0 100.6 102.9 104.9
P132 100.1 100.6 103.0 104.9 100.2 100.6 103.1 104.9 100.1 100.6 102.9 104.9 100.0 100.6 102.9 104.9
P132 100.1 100.6 103.0 104.9 100.2 100.6 103.1 104.9 100.1 100.6 103.0 104.9 100.0 100.6 102.9 104.9
P089 99.8 100.7 104.3 105.2 99.9 100.7 104.4 105.2 99.8 100.7 104.3 105.2 99.7 100.6 104.3 105.2
P175 100.3 100.7 101.7 104.4 100.4 100.7 101.8 104.4 100.3 100.6 101.6 104.4 100.2 100.6 101.6 104.3
P175 100.3 100.7 101.7 104.4 100.4 100.7 101.8 104.4 100.3 100.6 101.6 104.4 100.2 100.6 101.6 104.3
P131 100.2 100.6 103.6 104.6 100.3 100.6 103.7 104.6 100.2 100.6 103.6 104.6 100.1 100.6 103.5 104.6
P131 100.2 100.6 103.6 104.6 100.3 100.6 103.7 104.6 100.2 100.6 103.6 104.6 100.1 100.6 103.5 104.6
33kV 11kV 33kV 11kV 33kV 11kV 33kV 11kV
P017 5.2 9.3 5.2 9.3 5.2 9.3 5.2 9.3
P017 5.2 9.3 5.2 9.3 5.2 9.3 5.2 9.3
P035 13.4 13.1 13.6 13.1 13.6 13.1 13.5 13.1
P035 13.5 13.1 13.7 13.1 13.7 13.1 13.6 13.1
P136 3.9 5.2 3.9 5.2 3.9 5.3 3.9 5.3
P136 3.9 5.2 3.9 5.2 3.9 5.3 3.9 5.3
P005 7.4 11.2 7.5 11.3 7.5 11.3 7.5 11.4
P005 7.5 11.2 7.5 11.3 7.5 11.3 7.5 11.4
P132 16.0 13.5 16.2 13.6 16.2 13.6 16.0 13.6
P132 16.0 13.5 16.1 13.6 16.1 13.6 16.0 13.6
P132 16.6 7.6 16.8 7.6 16.8 7.6 16.6 7.6
P089 4.5 3.5 4.5 3.5 4.5 3.5 4.5 3.5
P175 22.5 14.4 22.9 14.4 22.9 14.4 22.6 14.4
P175 22.5 14.4 22.9 14.4 22.9 14.4 22.6 14.4
P131 18.5 14.0 18.8 14.0 18.8 14.0 18.6 14.0
P131 18.5 14.0 18.7 14.0 18.7 14.0 18.5 14.0
Khoula Hospital-A
Khoula Hospital-B
Khoula Hospital-C
Qantab
Primary Substations Bus Voltages
Primary P.No.
2019 2020 2021 2022
33kV (%) 11kV(%) 33kV (%) 11kV(%) 33kV (%) 11kV(%) 33kV (%) 11kV(%)
Al Bustan Palace-A
Al Bustan Palace-B
Al Bustan Palace-A 25.0 18.4
Al Bustan Palace-B 25.0 18.4
Al Hamryah-A
Khoula Hospital-B 25.0 25.0
Khoula Hospital-C 25.0 25.0
Qantab 25.0 16.0
Wadi Adai-A 25.0 18.4
Al Hamryah-B 25.0 18.4
Amerat 1-B 25.0 18.4
Khoula Hospital-A 25.0 25.0
25.0 16.0Al Mahaj-A
Al Mahaj-B 25.0 16.0
Amerat 1-A 25.0 18.4
P.No. 33kV -Rated SC Capacity
11kV -Rated SC Capacity
2019 2020 2021 2022
Wadi Adai-B 25.0 18.4
Wattaya-A 25.0 20.0
Wattaya-B 25.0 20.0
Al Hamryah-B
Al Mahaj-A
Al Mahaj-B
Amerat 1-A
Amerat 1-B
Wadi Adai-A
Wadi Adai-B
Wattaya-A
Wattaya-B
Primary Substation 3-Phase Fault Current Levels (kA)
Primary
Al Hamryah-A 25.0 18.4
MEDC Distribution System Capability Statement [2020-2022]-V1.0 68

MW MVAr MVA % MW MVAr MVA % MW MVAr MVA % MW MVAr MVA %
Al Atkiya P182 1TX 2.4 0.9 2.5 - 2.7 1.1 2.9 - 3.2 1.3 3.4 - 3.7 1.5 3.9 -
Al Hajir P031 20 8.9 4.3 9.9 50% 10.2 3.4 10.8 54% 12.1 4.0 12.7 64% 13.9 4.6 14.6 73%
Al Masarat P068 10 4.0 2.0 4.5 45% 4.0 1.3 4.2 42% 4.0 1.3 4.2 42% 4.0 1.3 4.2 42%
Arqi P121 1TX 1.3 0.5 1.4 - 1.4 0.5 1.5 - 1.5 0.6 1.6 - 1.6 0.6 1.7 -
Barr Al Jissah P044 20 6.6 2.3 7.0 35% 6.6 2.2 6.9 35% 6.6 2.2 6.9 35% 6.6 2.2 6.9 35%
Debah P114 1TX 0.1 0.0 0.1 - 0.1 0.0 0.1 - 0.1 0.0 0.1 - 0.1 0.0 0.1 -
Hussan Yiti P169 6 1.3 0.5 1.4 24% 1.3 0.5 1.4 24% 1.3 0.5 1.4 24% 1.3 0.5 1.4 24%
Jahloot P040 6 4.6 1.8 4.9 82% 4.8 1.9 5.2 87% 5.2 2.1 5.6 93% 5.6 2.2 6.0 100%
ROP Al Saleel P162 6 1.6 0.6 1.7 29% 1.6 0.6 1.7 29% 1.6 0.6 1.7 29% 1.6 0.6 1.7 29%
Sawaqim 1 P112 6 4.1 1.6 4.4 74% 4.2 1.7 4.5 75% 4.5 1.8 4.8 81% 4.7 1.8 5.0 83%
Sawaqim 2 P113 1TX 0.6 0.3 0.7 - 0.6 0.3 0.7 - 0.7 0.3 0.7 - 0.7 0.3 0.8 -
Siya P120 6 3.4 1.4 3.7 62% 3.6 1.4 3.9 65% 3.9 1.5 4.2 70% 4.2 1.7 4.5 75%
Tunis Heium P137 1TX 4.7 1.8 5.0 - 5.4 2.1 5.8 - 6.3 2.5 6.8 - 7.3 2.9 7.8 -
Wadi Al Mayh P129 1TX 0.5 0.2 0.5 - 0.5 0.2 0.6 - 0.6 0.3 0.7 - 0.7 0.3 0.8 -
Water Pumping P193 6 1.8 0.7 1.9 32% 1.8 0.7 1.9 32% 1.8 0.7 1.9 32% 1.8 0.7 1.9 32%
MW MVAr MVA % MW MVAr MVA % MW MVAr MVA % MW MVAr MVA %
Al Atkiya P182 1TX 0.4 0.2 0.5 - 0.5 0.2 0.6 - 0.6 0.3 0.7 - 0.7 0.3 0.7 -
Al Hajir P031 20 1.1 0.5 1.2 6% 1.2 0.5 1.3 7% 1.4 0.6 1.5 8% 1.6 0.7 1.8 9%
Al Masarat P068 10 0.8 0.4 0.9 9% 0.7 0.4 0.8 8% 0.7 0.4 0.8 8% 0.7 0.4 0.8 8%
Arqi P121 1TX 0.2 0.1 0.3 - 0.3 0.1 0.3 - 0.3 0.1 0.3 - 0.3 0.1 0.3 -
Barr Al Jissah P044 20 1.8 1.1 2.1 11% 1.8 1.1 2.1 10% 1.8 1.1 2.1 10% 1.8 1.1 2.1 10%
Debah P114 1TX 0.0 0.0 0.0 - 0.0 0.0 0.0 - 0.0 0.0 0.0 - 0.0 0.0 0.0 -
Hussan Yiti P169 6 0.3 0.1 0.3 5% 0.3 0.1 0.3 5% 0.3 0.1 0.3 5% 0.3 0.1 0.3 5%
Jahloot P040 6 0.8 0.4 0.9 16% 0.9 0.4 1.0 16% 1.0 0.4 1.1 18% 1.0 0.5 1.1 19%
ROP Al Saleel P162 6 0.3 0.1 0.3 6% 0.3 0.1 0.3 6% 0.3 0.1 0.3 6% 0.3 0.1 0.3 6%
Sawaqim 1 P112 6 0.8 0.3 0.8 14% 0.8 0.4 0.9 14% 0.8 0.4 0.9 15% 0.9 0.4 1.0 16%
Sawaqim 2 P113 1TX 0.1 0.1 0.1 - 0.1 0.1 0.1 - 0.1 0.1 0.1 - 0.1 0.1 0.1 -
Siya P120 6 0.6 0.3 0.7 12% 0.7 0.3 0.7 12% 0.7 0.3 0.8 13% 0.8 0.4 0.9 14%
Tunis Heium P137 1TX 0.9 0.4 1.0 - 1.0 0.5 1.1 - 1.2 0.5 1.3 - 1.4 0.6 1.5 -
Wadi Al Mayh P129 1TX 0.1 0.0 0.1 - 0.1 0.0 0.1 - 0.1 0.1 0.1 - 0.1 0.1 0.2 -
Water Pumping P193 6 0.3 0.2 0.4 6% 0.3 0.2 0.4 6% 0.3 0.2 0.4 6% 0.3 0.2 0.4 6%
22.0
22.0
22.0
22.0
22.0
22.0
22.0
22.0
22.0
22.0
22.0
22.0
Sawaqim 2-F1-P112-OD (Quriyat F2) 0.7 3.0 0.7 3.1 0.7 3.3 0.7 3.3
Shehabari Feeder (Feeding ROP Saleel Tx 2+Waterpump)
3.0 13.8 3.0 13.8 3.1 14.0 3.1 14.0
Wadi Mayh-F-P129-OD(Al Nahdha Fdr 1)
0.5 2.2 0.6 2.6 0.7 3.0 0.8 3.5
Debha-F1-P114-OD(Shehbari fdr) 0.1 0.6 0.1 0.6 0.1 0.6 0.1 0.6
Bar Al Jissah 1-F2-P044 4.3 19.6 4.3 19.5 4.3 19.4 4.3 19.4
Mazra Fdr - Jahloot1+Siya+Al Arqi 10.2 46.2 10.9 49.4 11.8 53.4 12.6 57.3
Al Masarat-F2-P068 2.2 9.8 2.0 9.3 2.0 9.3 2.0 9.3
Bar Al Jissah 1-F1-P044 4.3 19.6 4.3 19.5 4.3 19.4 4.3 19.5
Al Hajir-F2-P031(P031+P182) 8.2 37.1 9.1 41.3 10.9 49.3 12.6 57.3
Al Masarat-F1-P068 2.3 10.5 2.2 9.8 2.2 9.8 2.2 9.8
Al Atkiya (Seih Dhabi Fdr) 2.6 11.7 2.9 13.4 3.5 15.9 4.0 18.3
Al Hajir-F1-P031(P031+P137) 10.0 45.6 11.3 51.2 13.5 61.2 15.6 71.1
33kV Feeder Maximum Loads
Primary Rating(MVA)
2019 2020 2021 2022
MVA %Loading MVA %Loading MVA %Loading MVA %Loading
Jahloot[G03] GSS [Zone 1] - System Study ResultsPrimary Substations Maximum Demand and Percentage Loading
Primary Substation P.No.Firm
Capacity(MVA)
2019 2020 2021
Primary Substations Minimum Demand and Percentage Loading
Primary Substation P.No.Firm
Capacity(MVA)
2019 2020 2021 2022
2022
MEDC Distribution System Capability Statement [2020-2022]-V1.0 69

Max Min Max Min Max Min Max Min Max Min Max Min Max Min Max Min
P182 97.0 100.6 100.1 104.9 96.9 100.5 99.8 104.8 97.1 100.4 99.8 104.6 96.2 100.3 98.5 104.5
P031 96.8 100.6 99.8 105.0 96.7 100.5 100.0 104.9 96.9 100.4 100.0 104.8 95.9 100.2 98.7 104.6
P031 97.1 100.6 99.8 105.0 97.1 100.6 100.0 104.9 97.4 100.5 100.0 104.8 96.5 100.3 98.7 104.6
P068 100.2 101.0 103.8 105.4 100.2 101.0 104.2 105.4 101.2 100.9 105.2 105.3 101.0 100.9 104.9 105.3
P068 100.2 101.0 103.8 105.4 100.2 101.0 104.2 105.4 101.2 100.9 105.2 105.3 101.0 100.9 104.9 105.3
P121 97.6 100.6 100.6 104.8 97.5 100.5 100.3 104.8 98.2 100.4 101.0 104.7 97.8 100.4 100.4 104.6
P044 97.1 100.1 100.6 104.3 97.3 100.1 100.9 104.3 98.3 100.1 101.9 104.3 98.1 100.1 101.7 104.2
P044 97.1 100.1 100.6 104.3 97.3 100.1 100.9 104.3 98.3 100.1 101.9 104.3 98.1 100.1 101.7 104.2
P114 100.3 101.0 100.2 101.0 100.3 101.0 100.3 101.0 101.2 101.0 101.2 101.0 101.0 101.0 101.0 101.0
P169 97.7 100.3 101.7 104.8 97.8 100.3 101.9 104.8 98.8 100.3 102.9 104.8 98.6 100.2 102.7 104.7
P169 97.7 100.3 101.7 104.8 97.8 100.3 101.9 104.8 98.8 100.3 102.9 104.8 98.6 100.2 102.7 104.7
P040 99.1 100.8 102.2 105.1 99.0 100.7 102.3 105.1 99.9 100.7 103.1 105.0 99.5 100.7 102.6 104.9
P040 99.1 100.8 102.5 105.2 99.0 100.7 102.2 105.1 99.9 100.7 103.0 105.0 99.5 100.7 102.6 104.9
P162 99.3 100.8 103.6 105.4 99.3 100.8 103.6 105.4 100.2 100.8 104.6 105.3 100.0 100.8 104.3 105.3
P162 99.7 100.9 103.6 105.4 99.7 100.9 103.6 105.4 100.7 100.9 104.6 105.3 100.4 100.9 104.3 105.3
P112 97.6 100.5 98.6 102.5 97.6 100.5 98.6 102.5 98.4 100.4 99.3 102.4 98.0 100.4 98.9 102.3
P112 97.6 100.5 98.6 102.5 97.6 100.5 98.6 102.5 98.3 100.4 99.3 102.4 98.0 100.4 98.9 102.3
P113 100.1 101.2 104.3 105.7 100.1 101.2 104.3 105.7 101.1 101.1 105.3 105.6 100.8 101.1 105.0 105.6
P120 97.6 100.6 101.2 104.9 97.5 100.5 101.0 104.9 98.2 100.4 101.7 104.8 97.8 100.4 101.1 104.7
P120 97.6 100.6 101.2 104.9 97.5 100.5 101.0 104.9 98.2 100.4 101.7 104.8 97.8 100.4 101.1 104.7
P137 97.3 100.6 99.0 104.7 97.1 100.5 98.4 104.5 97.5 100.4 98.2 104.3 96.6 100.3 96.5 104.1
P129 100.0 101.0 104.1 105.5 100.0 101.0 104.0 105.4 100.9 100.9 104.9 105.4 100.6 100.9 104.5 105.3
P193 98.4 100.7 - - 98.4 100.7 - - 99.4 100.7 - - 99.1 100.7 - -
P193 98.4 100.7 - - 98.4 100.7 - - 99.4 100.7 - - 99.1 100.7 - -
33kV 11kV 33kV 11kV 33kV 11kV 33kV 11kV
P182 3.5 3.4 3.5 3.4 3.6 3.5 3.6 3.5
P031 4.1 8.8 4.1 8.9 4.2 9.1 4.2 9.3
P031 4.2 8.8 4.2 8.9 4.3 9.1 4.3 9.3
P068 17.4 10.8 17.6 10.8 17.7 10.8 18.1 10.8
P068 17.5 10.8 17.7 10.8 17.8 10.8 18.2 10.8
P121 3.1 2.0 3.2 2.0 3.2 2.1 3.2 2.1
P044 2.8 6.0 2.8 6.0 2.8 6.1 2.9 6.1
P044 2.8 6.0 2.8 6.0 2.8 6.1 2.9 6.1
P114 1.5 2.6 1.5 2.6 1.5 2.6 1.5 2.6
P169 3.8 5.0 3.8 5.0 3.8 5.0 3.8 5.0
P169 3.8 5.0 3.8 5.0 3.8 5.0 3.8 5.0
P040 7.8 4.2 7.8 4.2 7.9 4.3 8.0 4.3
P040 7.8 4.1 7.8 4.2 7.9 4.2 8.0 4.2
P162 5.7 7.1 5.7 7.1 5.7 7.1 5.8 7.1
P162 5.6 7.1 5.7 7.1 5.7 7.1 5.7 7.1
P112 2.4 4.2 2.4 4.2 2.4 4.3 2.4 4.3
P112 2.4 4.2 2.4 4.2 2.4 4.3 2.4 4.3
P113 2.0 2.7 2.0 2.7 2.0 2.7 2.0 2.7
P120 3.1 4.8 3.2 4.8 3.2 4.8 3.2 4.9
P120 3.1 4.8 3.2 4.8 3.2 4.8 3.2 4.9
P137 4.9 3.9 4.9 4.0 5.0 4.1 5.0 4.2
P129 2.3 1.9 2.3 1.9 2.3 1.9 2.3 2.0
P193 1.5 - 1.5 - 1.5 - 1.5 -
P193 1.5 - 1.5 - 1.5 - 1.5 -Water Pumping-B 25.0 -
Sawaqim 2 25.0 12.5
Siya 1-A 25.0 16.0
Bar Al Jissah 1-B
Debha
Hussan Yitti-A
Hussan Yitti-B
Al Atkiya
Al Hajir-A
Al Hajir-B
18.4
Bar Al Jissah 1-B 25.0 18.4
Siya 1-B 25.0 16.0
Tunis 25.0 16.0
Primary Substation 3-Phase Fault Current Levels (kA)
Primary P.No. 33kV -Rated SC Capacity
11kV -Rated SC Capacity
2019 2020 2021 2022
Al Atkiya 25.0 16.0
Al Hajir-A 25.0
Wadi Meih 1 25.0 16.0
Water Pumping-A 25.0 -
Jahloot 1-A 25.0 16.0
Jahloot 1-B 25.0 16.0
ROP Al Saleel-A 26.3 26.3
ROP Al Saleel-B 26.3 26.3
Sawaqim 1-A 25.0 12.5
Sawaqim 1-B 25.0 12.5
25.0
Hussan Yitti-B 25.0 16.0
Al Hajir-B 25.0 25.0
Al Masarat-A 25.0 18.4
Al Masarat-B 25.0 18.4
Arqi 25.0 16.0
Bar Al Jissah 1-A 25.0
Debha 25.0 16.0
Hussan Yitti-A 25.0 16.0
ROP Al Saleel-A
ROP Al Saleel-B
Sawaqim 1-A
Sawaqim 1-B
Sawaqim 2
Siya 1-A
Siya 1-B
Tunis
Wadi Meih 1
Water Pumping-A
Water Pumping-B
Jahloot 1-A
Jahloot 1-B
Primary Substations Bus Voltages
Primary P.No.
2019 2020 2021 2022
33kV (%) 11kV(%) 33kV (%) 11kV(%) 33kV (%) 11kV(%) 33kV (%) 11kV(%)
Al Masarat-A
Al Masarat-B
Arqi
Bar Al Jissah 1-A
MEDC Distribution System Capability Statement [2020-2022]-V1.0 70
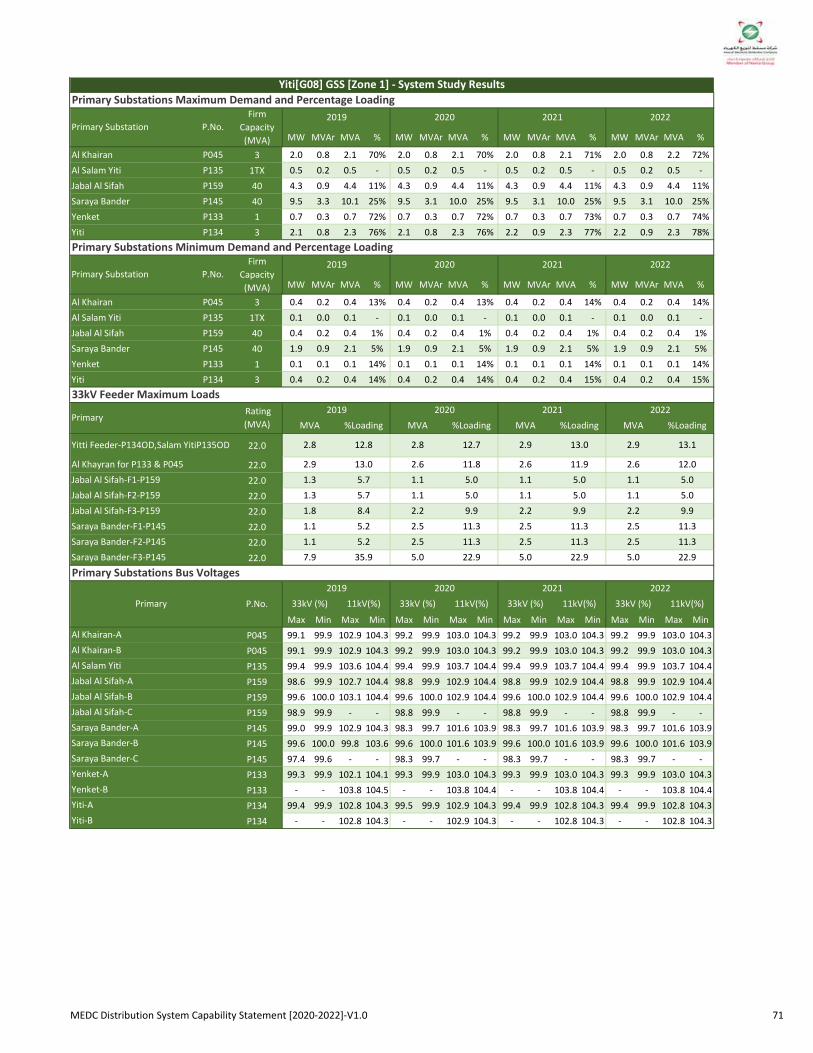
MW MVAr MVA % MW MVAr MVA % MW MVAr MVA % MW MVAr MVA %
Al Khairan P045 3 2.0 0.8 2.1 70% 2.0 0.8 2.1 70% 2.0 0.8 2.1 71% 2.0 0.8 2.2 72%
Al Salam Yiti P135 1TX 0.5 0.2 0.5 - 0.5 0.2 0.5 - 0.5 0.2 0.5 - 0.5 0.2 0.5 -
Jabal Al Sifah P159 40 4.3 0.9 4.4 11% 4.3 0.9 4.4 11% 4.3 0.9 4.4 11% 4.3 0.9 4.4 11%
Saraya Bander P145 40 9.5 3.3 10.1 25% 9.5 3.1 10.0 25% 9.5 3.1 10.0 25% 9.5 3.1 10.0 25%
Yenket P133 1 0.7 0.3 0.7 72% 0.7 0.3 0.7 72% 0.7 0.3 0.7 73% 0.7 0.3 0.7 74%
Yiti P134 3 2.1 0.8 2.3 76% 2.1 0.8 2.3 76% 2.2 0.9 2.3 77% 2.2 0.9 2.3 78%
MW MVAr MVA % MW MVAr MVA % MW MVAr MVA % MW MVAr MVA %
Al Khairan P045 3 0.4 0.2 0.4 13% 0.4 0.2 0.4 13% 0.4 0.2 0.4 14% 0.4 0.2 0.4 14%
Al Salam Yiti P135 1TX 0.1 0.0 0.1 - 0.1 0.0 0.1 - 0.1 0.0 0.1 - 0.1 0.0 0.1 -
Jabal Al Sifah P159 40 0.4 0.2 0.4 1% 0.4 0.2 0.4 1% 0.4 0.2 0.4 1% 0.4 0.2 0.4 1%
Saraya Bander P145 40 1.9 0.9 2.1 5% 1.9 0.9 2.1 5% 1.9 0.9 2.1 5% 1.9 0.9 2.1 5%
Yenket P133 1 0.1 0.1 0.1 14% 0.1 0.1 0.1 14% 0.1 0.1 0.1 14% 0.1 0.1 0.1 14%
Yiti P134 3 0.4 0.2 0.4 14% 0.4 0.2 0.4 14% 0.4 0.2 0.4 15% 0.4 0.2 0.4 15%
22.0
22.0
22.0
22.0
22.0
22.0
22.0
22.0
Max Min Max Min Max Min Max Min Max Min Max Min Max Min Max Min
P045 99.1 99.9 102.9 104.3 99.2 99.9 103.0 104.3 99.2 99.9 103.0 104.3 99.2 99.9 103.0 104.3
P045 99.1 99.9 102.9 104.3 99.2 99.9 103.0 104.3 99.2 99.9 103.0 104.3 99.2 99.9 103.0 104.3
P135 99.4 99.9 103.6 104.4 99.4 99.9 103.7 104.4 99.4 99.9 103.7 104.4 99.4 99.9 103.7 104.4
P159 98.6 99.9 102.7 104.4 98.8 99.9 102.9 104.4 98.8 99.9 102.9 104.4 98.8 99.9 102.9 104.4
P159 99.6 100.0 103.1 104.4 99.6 100.0 102.9 104.4 99.6 100.0 102.9 104.4 99.6 100.0 102.9 104.4
P159 98.9 99.9 - - 98.8 99.9 - - 98.8 99.9 - - 98.8 99.9 - -
P145 99.0 99.9 102.9 104.3 98.3 99.7 101.6 103.9 98.3 99.7 101.6 103.9 98.3 99.7 101.6 103.9
P145 99.6 100.0 99.8 103.6 99.6 100.0 101.6 103.9 99.6 100.0 101.6 103.9 99.6 100.0 101.6 103.9
P145 97.4 99.6 - - 98.3 99.7 - - 98.3 99.7 - - 98.3 99.7 - -
P133 99.3 99.9 102.1 104.1 99.3 99.9 103.0 104.3 99.3 99.9 103.0 104.3 99.3 99.9 103.0 104.3
P133 - - 103.8 104.5 - - 103.8 104.4 - - 103.8 104.4 - - 103.8 104.4
P134 99.4 99.9 102.8 104.3 99.5 99.9 102.9 104.3 99.4 99.9 102.8 104.3 99.4 99.9 102.8 104.3
P134 - - 102.8 104.3 - - 102.9 104.3 - - 102.8 104.3 - - 102.8 104.3
Saraya Bander-C
Yenket-A
Yenket-B
Yiti-A
Yiti-B
Primary Substations Bus Voltages
Primary P.No.
2019 2020 2021 2022
33kV (%) 11kV(%) 33kV (%) 11kV(%) 33kV (%) 11kV(%) 33kV (%) 11kV(%)
Al Khairan-A
Al Khairan-B
Al Salam Yiti
Jabal Al Sifah-A
Jabal Al Sifah-B
Jabal Al Sifah-C
Saraya Bander-A
Saraya Bander-B
Saraya Bander-F2-P145 1.1 5.2 2.5 11.3 2.5 11.3 2.5 11.3
Saraya Bander-F3-P145 7.9 35.9 5.0 22.9 5.0 22.9 5.0 22.9
Jabal Al Sifah-F3-P159 1.8 8.4 2.2 9.9 2.2 9.9 2.2 9.9
Saraya Bander-F1-P145 1.1 5.2 2.5 11.3 2.5 11.3 2.5 11.3
1.3 5.7 1.1 5.0 1.1 5.0 1.1 5.0Jabal Al Sifah-F1-P159
Jabal Al Sifah-F2-P159 1.3 5.7 1.1 5.0 1.1 5.0 1.1 5.0
Yitti Feeder-P134OD,Salam YitiP135OD 2.8 12.8 2.8 12.7 2.9 13.0 2.9 13.1
Al Khayran for P133 & P045 2.9 13.0 2.6 11.8 2.6 11.9 2.6 12.0
Primary Substations Minimum Demand and Percentage Loading
Primary Substation P.No.Firm
Capacity(MVA)
2019 2020 2021 2022
33kV Feeder Maximum Loads
Primary Rating(MVA)
2019 2020 2021 2022
MVA %Loading MVA %Loading MVA %Loading MVA %Loading
Yiti[G08] GSS [Zone 1] - System Study ResultsPrimary Substations Maximum Demand and Percentage Loading
Primary Substation P.No.Firm
Capacity(MVA)
2019 2020 2021 2022
MEDC Distribution System Capability Statement [2020-2022]-V1.0 71

33kV 11kV 33kV 11kV 33kV 11kV 33kV 11kV
P045 5.6 5.2 5.6 5.2 5.6 5.2 5.7 5.3
P045 5.6 5.2 5.6 5.2 5.6 5.2 5.7 5.3
P135 6.8 4.0 6.9 4.0 6.9 4.0 6.9 4.0
P159 3.2 7.2 3.2 7.2 3.2 7.2 3.2 7.2
P159 3.2 3.9 3.2 4.0 3.2 4.0 3.2 4.0
P159 2.5 - 2.5 - 2.5 - 2.5 -
P145 4.7 8.9 4.8 9.1 4.8 9.1 4.8 9.1
P145 4.7 5.4 4.8 5.2 4.8 5.2 4.8 5.2
P145 4.2 - 4.2 - 4.2 - 4.2 -
P133 8.5 1.1 8.5 1.1 8.5 1.1 8.6 1.1
P133 - 2.4 - 2.4 - 2.4 - 2.4
P134 11.5 4.5 11.6 4.5 11.6 4.5 11.8 4.5
P134 - 4.5 - 4.5 - 4.5 - 4.5
Jabal Al Sifah-B 25.0 25.0
Jabal Al Sifah-C 25.0 -
Yiti-B - 12.5
Saraya Bander-A 25.0 25.0
Saraya Bander-B 25.0 25.0
Saraya Bander-C 25.0 -
Yenket-A 25.0 12.5
Yenket-B - 12.5
Yiti-A 25.0 12.5
Al Khairan-A 25.0 12.5
Al Khairan-B 25.0 12.5
Al Salam Yiti 25.0 12.5
Jabal Al Sifah-A 25.0 25.0
Primary Substation 3-Phase Fault Current Levels (kA)
Primary P.No. 33kV -Rated SC Capacity
11kV -Rated SC Capacity
2019 2020 2021 2022
MEDC Distribution System Capability Statement [2020-2022]-V1.0 72

MW MVAr MVA % MW MVAr MVA % MW MVAr MVA % MW MVAr MVA %
Al Mazara P074 6 2.9 1.2 3.1 52% 2.9 1.2 3.2 53% 3.0 1.2 3.3 54% 3.0 1.2 3.3 54%
Al Shahbari P092 20 15.9 0.0 15.9 79% 16.6 0.0 16.6 83% 17.2 0.0 17.2 86% 17.2 0.0 17.2 86%
Dhabab P019 6 4.0 1.6 4.3 71% 4.0 1.6 4.3 72% 4.1 1.6 4.4 74% 4.1 1.6 4.4 74%
Dhagmar 1 P021 18 4.3 1.7 4.7 26% 4.4 1.7 4.7 26% 4.5 1.8 4.8 27% 4.5 1.8 4.8 27%
Hail Al Ghaf P036 6 4.6 1.8 5.0 83% 4.7 1.8 5.0 84% 4.8 1.9 5.2 86% 4.8 1.9 5.2 86%
Quriyat P091 20 20.5 4.2 20.9 105% 21.4 4.4 21.9 109% 22.2 4.5 22.6 113% 22.2 4.5 22.7 113%
RoyalCamp P170 1TX Standby PSS
Street Light P020 1TX 2.5 1.0 2.7 - 2.5 1.0 2.7 - 2.5 1.0 2.7 - 2.5 1.0 2.7 -
Wadi Al Arbyeen P124 1TX 1.1 0.4 1.2 - 1.1 0.4 1.2 - 1.1 0.5 1.2 - 1.1 0.5 1.2 -
MW MVAr MVA % MW MVAr MVA % MW MVAr MVA % MW MVAr MVA %
Al Mazara P074 6 0.5 0.2 0.6 10% 0.5 0.2 0.6 10% 0.6 0.3 0.6 10% 0.6 0.3 0.6 10%
Al Shahbari P092 20 2.3 0.0 2.3 12% 2.4 0.0 2.4 12% 2.5 0.0 2.5 12% 2.5 0.0 2.5 12%
Dhabab P019 6 0.7 0.3 0.8 14% 0.7 0.3 0.8 14% 0.8 0.3 0.8 14% 0.8 0.3 0.8 14%
Dhagmar 1 P021 18 0.8 0.4 0.9 5% 0.8 0.4 0.9 5% 0.8 0.4 0.9 5% 0.8 0.4 0.9 5%
Hail Al Ghaf P036 6 0.9 0.4 0.9 16% 0.9 0.4 1.0 16% 0.9 0.4 1.0 16% 0.9 0.4 1.0 16%
Quriyat P091 20 3.3 0.0 3.3 17% 3.4 0.0 3.4 17% 3.6 0.0 3.6 18% 3.6 0.0 3.6 18%
RoyalCamp P170 1TX Standby PSS
Street Light P020 1TX 0.5 0.2 0.5 - 0.5 0.2 0.5 - 0.5 0.2 0.5 - 0.5 0.2 0.5 -
Wadi Al Arbyeen P124 1TX 0.2 0.1 0.2 - 0.2 0.1 0.2 - 0.2 0.1 0.2 - 0.2 0.1 0.2 -
22.0
22.0
22.0
22.0
22.0
Max Min Max Min Max Min Max Min Max Min Max Min Max Min Max Min
P074 98.7 99.7 100.8 104.1 98.7 99.7 102.0 104.1 98.6 99.7 101.9 104.0 98.6 99.7 101.9 104.0
P074 98.7 99.7 100.8 104.1 98.7 99.7 102.0 104.1 98.6 99.7 101.9 104.0 98.6 99.7 101.9 104.0
P092 99.2 100.0 103.6 104.6 100.3 100.0 104.8 104.6 100.3 100.0 104.7 104.6 100.3 100.0 104.7 104.6
P092 99.6 100.1 103.6 104.6 100.8 100.1 104.8 104.6 100.7 100.1 104.7 104.6 100.7 100.1 104.7 104.6
P019 98.2 99.7 100.0 104.0 98.2 99.7 101.1 104.0 98.0 99.7 100.9 103.9 98.0 99.7 100.9 103.9
P019 98.2 99.7 100.0 104.0 98.2 99.7 101.1 104.0 98.0 99.7 100.9 103.9 98.0 99.7 100.9 103.9
P021 98.8 100.0 102.7 104.4 99.9 100.0 103.9 104.4 99.8 100.0 103.8 104.4 99.8 100.0 103.8 104.4
P021 100.4 100.1 102.8 104.4 100.3 100.1 103.9 104.4 100.2 100.1 103.8 104.4 100.2 100.1 103.8 104.4
P021 100.4 100.1 102.7 104.4 100.3 100.1 103.9 104.4 100.2 100.1 103.8 104.4 100.2 100.1 103.8 104.4
P021 100.4 100.1 101.1 104.6 100.3 100.1 100.9 104.6 100.2 100.1 100.6 104.6 100.2 100.1 100.6 104.6
P036 99.8 99.9 102.1 104.3 99.8 99.9 103.4 104.3 99.7 99.9 103.3 104.3 99.7 99.9 103.3 104.3
P036 99.8 99.9 101.1 104.1 99.8 99.9 102.7 104.2 99.7 99.9 102.5 104.1 99.7 99.9 102.5 104.1
P091 99.7 100.1 103.1 104.6 100.8 100.1 104.1 104.6 100.7 100.1 104.0 104.6 100.7 100.1 104.0 104.6
P091 99.7 100.1 103.1 104.6 100.8 100.1 104.1 104.6 100.7 100.1 104.0 104.6 100.7 100.1 104.0 104.6
P170 98.5 100.0 102.9 104.5 99.6 100.0 104.1 104.5 99.5 100.0 104.0 104.5 99.5 100.0 104.0 104.5
P020 99.3 100.1 101.5 104.2 100.4 100.1 102.7 104.2 100.3 100.1 102.6 104.2 100.3 100.1 102.6 104.2
P124 98.6 100.0 102.5 104.5 99.8 100.0 103.7 104.5 99.7 100.0 103.6 104.4 99.7 100.0 103.6 104.4
Al Mazara 1-A
Al Mazara 1-B
Al Shahbari-A
Al Shahbari-B
Dhabab-A
Dhabab-B
Dhagmar 1-A
Dhagmar 1-B
Dhagmar 1-C
Dhagmar 1-D
Hayl Ghaf 1-A
Hayl Ghaf 1-B
Quriyat-A
Quriyat-B
RoyalCamp
Street Light
Wadi Al Arbyeen
6.1 28.0 6.7 30.3 6.9 31.4 6.9 31.4
Quriyat-F1-P091
Quriyat-F2-P091
Primary Substations Bus Voltages
Primary P.No.
2019 2020 2021 2022
33kV (%) 11kV(%) 33kV (%) 11kV(%) 33kV (%) 11kV(%) 33kV (%) 11kV(%)
Al Shahbari-F2-P092 8.2 37.3 8.5 38.8 8.8 40.2 8.8 40.2
6.1 27.9 6.7 30.3 6.9 31.4 6.9 31.4
Dhagmar 1-F1-P021 22.6 102.9 23.2 105.5 23.9 108.8 23.9 108.8
33kV Feeder Maximum Loads
Primary Rating(MVA)
2019 2020 2021 2022
MVA %Loading MVA %Loading MVA %Loading MVA %Loading
Al Shahbari-F1-P092 14.9 68.0 14.9 67.6 15.4 69.8 15.4 69.8
Quriyat[G05] GSS [Zone 1] - System Study ResultsPrimary Substations Maximum Demand and Percentage Loading
Primary Substation P.No.Firm
Capacity(MVA)
2019 2020 2021 2022
Primary Substations Minimum Demand and Percentage Loading
Primary Substation P.No.Firm
Capacity(MVA)
2019 2020 2021 2022
MEDC Distribution System Capability Statement [2020-2022]-V1.0 73

33kV 11kV 33kV 11kV 33kV 11kV 33kV 11kV
P074 2.3 4.0 2.3 4.0 2.3 4.0 2.3 4.0
P074 - 4.0 - 4.0 - 4.0 - 4.0
P092 9.8 12.1 9.8 12.2 9.9 12.2 10.0 12.3
P092 9.6 12.1 9.7 12.2 9.7 12.2 9.8 12.3
P019 2.0 3.7 2.0 3.7 2.0 3.7 2.0 3.7
P019 - 3.7 - 3.7 - 3.7 - 3.7
P021 8.8 4.1 8.8 4.1 8.9 4.1 8.9 4.1
P021 8.8 4.2 8.8 4.2 8.9 4.2 8.9 4.2
P021 8.8 4.0 8.8 4.0 8.9 4.1 8.9 4.1
P021 8.5 4.9 8.6 5.0 8.6 5.0 8.7 5.0
P036 5.3 3.7 5.3 3.7 5.3 3.8 5.3 3.8
P036 5.3 3.8 5.3 3.7 5.3 3.7 5.3 3.7
P091 9.6 11.9 9.7 12.0 9.7 12.0 9.8 12.1
P091 9.6 11.9 9.6 12.0 9.6 12.0 9.7 12.1
P170 4.6 2.2 4.6 2.2 4.6 2.2 4.7 2.2
P020 9.9 4.8 10.0 4.9 10.0 4.9 10.1 4.9
P124 4.8 3.6 4.8 3.6 4.8 3.6 4.8 3.612.5
Dhagmar 1-B 25.0 12.5
Dhagmar 1-C 25.0 12.5
Dhagmar 1-D 25.0 12.5
Hayl Ghaf 1-A 25.0 12.5
Hayl Ghaf 1-B 25.0 16.0
Quriyat-A 25.0 20.0
Quriyat-B 25.0 20.0
Al Mazara 1-B - 16.0
Al Shahbari-A 25.0 20.0
Al Shahbari-B 25.0 20.0
Dhabab-A 25.0 16.0
Dhabab-B - 16.0
Dhagmar 1-A 25.0 12.5
RoyalCamp 25.0 16.0
Street Light 25.0 16.0
Wadi Al Arbyeen 25.0
Primary Substation 3-Phase Fault Current Levels (kA)
Primary P.No. 33kV -Rated SC Capacity
11kV -Rated SC Capacity
2019 2020 2021 2022
Al Mazara 1-A 25.0 12.5
MEDC Distribution System Capability Statement [2020-2022]-V1.0 74

MW MVAr MVA % MW MVAr MVA % MW MVAr MVA % MW MVAr MVA %
Al Nahdah P006 20 22.4 3.2 22.7 113% Shifted to Amerat -B GSS
Amerat 2 P177 1TX Standby PSS
Amerat 3 P179 40 39.4 10.5 40.8 102% 43.8 11.0 45.2 113% 37.7 9.4 38.9 97% 42.0 10.5 43.3 108%
Amerat Heights P152 20 21.8 8.6 23.4 117% - - - - - - - - - - - -
Amerat Heights[Upgrading] P152 40 - - - - 24.2 8.0 25.5 64% 27.2 8.9 28.6 72% 30.3 10.0 31.9 80%
Post Office P150 20 26.5 10.5 28.5 143% - - - - - - - - - - - -
Post Office [Upgrading] P150 40 - - - - 29.5 9.7 31.1 78% 32.9 10.8 34.6 87% 36.6 12.0 38.6 96%
MW MVAr MVA % MW MVAr MVA % MW MVAr MVA % MW MVAr MVA %
Al Nahdah P006 20 3.4 2.1 4.0 20% Shifted to Amerat -B GSS
Amerat 2 P177 1TX Standby PSS
Amerat 3 P179 40 4.4 0.0 4.4 11% 4.9 0.0 4.9 12% 4.2 0.0 4.2 10% 4.7 0.0 4.7 12%
Amerat Heights P152 20 3.2 0.0 3.2 16% - - - - - - - - - - - -
Amerat Heights[Upgrading] P152 40 - - - - 3.5 0.0 3.5 9% 3.9 0.0 3.9 10% 4.4 0.0 4.4 11%
Post Office P150 20 3.5 0.8 3.6 18% - - - - - - - - - - - -
Post Office [Upgrading] P150 40 - - - - 3.8 0.9 3.9 10% 4.2 1.0 4.4 11% 4.7 1.1 4.9 12%
22.0
22.0
22.0
22.0
22.0
22.0
22.0
22.0
22.0
22.0
22.0
22.0
Max Min Max Min Max Min Max Min Max Min Max Min Max Min Max Min
P006 99.1 99.8 102.2 103.7 - - - - - - - - - - - -
P006 99.1 99.8 102.2 103.7 - - - - - - - - - - - -
P177 100.0 100.0 104.5 104.5 100.0 100.0 104.5 104.5 100.0 100.0 104.5 104.5 100.0 100.0 104.5 104.5
P179 99.5 100.0 101.5 104.5 99.4 100.0 100.6 104.5 99.5 100.0 101.2 104.5 99.4 100.0 100.8 104.5
P179 99.5 100.0 101.5 104.5 99.3 100.0 100.6 104.5 99.4 100.0 101.2 104.5 99.4 100.0 100.8 104.5
P179 99.3 100.0 100.1 104.4 99.3 100.0 100.6 104.5 99.5 100.0 101.2 104.5 99.4 100.0 100.8 104.5
P152 99.3 100.0 100.5 104.5 99.6 100.0 102.0 104.5 99.5 100.0 101.7 104.5 99.4 100.0 101.3 104.5
P152 99.3 100.0 100.5 104.5 99.6 100.0 102.0 104.5 99.5 100.0 101.7 104.5 99.4 100.0 101.3 104.5
P152 - - - - 99.5 100.0 101.5 104.5 99.5 100.0 101.1 104.5 99.4 100.0 100.7 104.5
P150 99.6 100.0 99.9 104.2 99.7 100.0 101.7 104.3 99.7 100.0 101.3 104.2 99.7 100.0 100.9 104.2
P150 99.6 100.0 99.9 104.2 99.7 100.0 101.7 104.3 99.7 100.0 101.3 104.2 99.7 100.0 100.9 104.2
P150 - - - - 99.7 100.0 101.6 104.3 99.7 100.0 101.2 104.2 99.7 100.0 100.8 104.2
Al Nahdah-A
Al Nahdah-B
Amerat 2
Amerat 3-A
Amerat 3-B
Amerat 3-C
Amerat Heights-A
Amerat Heights-B
Amerat Heights-C
Post Office-A
Post Office-B
Post Office-C
Post Office-F1-P150 14.8 67.3 10.5 47.9 11.8 53.6 13.2 60.0
Amerat Heights-F1-P152 11.9 54.2 8.5 38.6 9.6 43.7 10.8 48.9
Amerat Heights-F2-P152 12.0 54.5 8.5 38.8 9.6 43.8 10.8 49.1
Primary Substations Bus Voltages
Primary P.No.
2019 2020 2021 2022
33kV (%) 11kV(%) 33kV (%) 11kV(%) 33kV (%) 11kV(%) 33kV (%) 11kV(%)
Post Office-F2-P150 14.9 67.6 10.6 48.1 11.8 53.8 13.3 60.2
Post Office-F3-P150 - - 10.6 48.0 11.8 53.7 13.2 60.2
Amerat 3-F3-P179 17.2 78.4 15.5 70.5 13.2 60.2 14.8 67.4
Amerat 3-F1-P179 12.2 55.3 15.4 70.2 13.2 59.9 14.8 67.1
Amerat 3-F2-P179 12.3 55.8 15.6 70.8 13.3 60.4 14.9 67.6
Amerat Heights-F3-P152 - - 8.7 39.6 9.9 44.8 11.1 50.3
- - -
Al Nahdah-F2-P006 11.5 52.4 - - - - - -
Amerat[G10] - A GSS [Zone 1] - System Study ResultsPrimary Substations Maximum Demand and Percentage Loading
Primary Substation P.No.Firm
Capacity(MVA)
2019 2020 2021 2022
Firm Capacity(MVA)
2019 2020 2021 2022
MVA %Loading
2022
MVA %Loading MVA %Loading MVA %Loading
2019 2020 2021
Primary Substations Minimum Demand and Percentage Loading
Primary Substation P.No.
33kV Feeder Maximum Loads
Primary Rating(MVA)
Al Nahdah-F1-P006 11.6 52.6 - - -
Amerat 2-F1-P177 0.0 0.1 0.0 0.1 0.0 0.1 0.0 0.1
MEDC Distribution System Capability Statement [2020-2022]-V1.0 75

33kV 11kV 33kV 11kV 33kV 11kV 33kV 11kV
P006 9.6 14.0 - - - - - -
P006 9.5 14.0 - - - - - -
P177 8.6 3.9 8.7 3.9 8.7 3.9 8.8 3.9
P179 14.2 14.3 14.5 14.9 14.6 14.6 14.8 14.9
P179 14.2 14.3 14.5 14.9 14.6 14.6 14.8 14.9
P179 14.1 8.3 14.4 8.2 14.5 8.0 14.7 8.1
P152 13.2 14.1 13.4 13.7 13.5 13.9 13.7 14.1
P152 13.2 14.1 13.4 13.7 13.5 13.9 13.7 14.1
P152 - - 13.2 7.4 13.3 7.5 13.5 7.6
P150 16.9 14.8 17.2 14.3 17.4 14.5 17.7 14.8
P150 16.9 14.8 17.2 14.3 17.4 14.5 17.7 14.8
P150 - - 17.1 7.9 17.3 8.0 17.6 8.1
Post Office-A 25.0 25.0
Post Office-B 25.0 25.0
Post Office-C 25.0 25.0
Amerat 3-C 25.0 25.0
Amerat Heights-A 25.0 25.0
Amerat Heights-B 25.0 25.0
Amerat Heights-C 25.0 25.0
Al Nahdah-A 25.0 18.4
Al Nahdah-B 25.0 18.4
25.0 25.0
Amerat 2 25.0 16.0
Amerat 3-A 25.0 25.0
Amerat 3-B
Primary Substation 3-Phase Fault Current Levels (kA)
Primary P.No. 33kV -Rated SC Capacity
11kV -Rated SC Capacity
2019 2020 2021 2022
MEDC Distribution System Capability Statement [2020-2022]-V1.0 76

MW MVAr MVA % MW MVAr MVA % MW MVAr MVA % MW MVAr MVA %
Al Jufaina P194 1TX 0.8 0.3 0.9 - 0.9 0.4 1.0 - 1.0 0.4 1.1 - 1.1 0.4 1.2 -
Al Nahdah[Upgrading] P006 40 - - - - 24.9 3.6 25.2 63% 34.5 4.9 34.8 87% 38.4 5.5 38.8 97%
Amerat 4 P180 40 - - - - - - - - 12.0 4.0 12.7 32% 13.4 4.4 14.1 35%
Madinat Al Nahdah P065 20 19.1 7.5 20.5 103% 21.2 7.0 22.3 112% 18.1 5.9 19.0 95% 20.1 6.6 21.2 106%
Seih Dhabi P118 16 10.1 4.6 11.1 69% 11.2 3.7 11.8 74% 12.5 4.1 13.2 82% 13.9 4.6 14.7 92%
MW MVAr MVA % MW MVAr MVA % MW MVAr MVA % MW MVAr MVA %
Al Jufaina P194 1TX 0.1 0.1 0.2 - 0.2 0.1 0.2 - 0.2 0.1 0.2 - 0.2 0.1 0.2 -Al Nahdah[Upgrading] P006 40 - - - - 3.8 2.3 4.4 11% 5.2 3.2 6.2 15% 5.8 3.6 6.9 17%Amerat 4 P180 40 - - - - - - - - 2.2 1.0 2.4 6% 2.4 1.1 2.7 7%Madinat Al Nahdah P065 20 3.3 0.0 3.3 17% 3.6 0.0 3.6 18% 3.1 0.0 3.1 15% 3.4 0.0 3.4 17%Seih Dhabi P118 16 1.1 0.5 1.2 8% 1.2 0.5 1.3 8% 1.3 0.6 1.4 9% 1.5 0.6 1.6 10%
22.0
22.0
22.0
22.0
22.0
22.0
22.0
22.0
22.0
22.0
Max Min Max Min Max Min Max Min Max Min Max Min Max Min Max Min
P194 98.7 99.9 102.8 104.3 98.5 99.9 102.5 104.3 98.7 99.9 102.7 104.3 98.6 99.9 102.4 104.3
P006 - - - - 99.3 99.8 102.9 103.9 99.1 99.8 102.1 103.6 98.9 99.7 101.8 103.5
P006 - - - - 99.3 99.8 102.9 103.9 99.1 99.8 102.1 103.6 98.9 99.7 101.8 103.5
P006 - - - - 99.4 99.8 102.9 103.9 99.1 99.8 102.1 103.7 98.9 99.8 101.8 103.5
P180 - - - - - - - - 99.8 100.0 103.3 104.3 99.8 100.0 103.2 104.2
P179 - - - - - - - - 99.8 100.0 103.3 104.3 99.8 100.0 103.2 104.2
P179 - - - - - - - - 99.8 100.0 103.3 104.3 99.8 100.0 103.2 104.2
P065 98.3 99.9 99.9 104.4 98.0 99.8 99.3 104.3 98.3 99.9 100.1 104.4 98.1 99.8 99.6 104.3
P180 95.6 100.8 97.0 105.3 98.1 99.9 99.3 104.3 98.4 99.9 100.1 104.4 98.2 99.9 99.6 104.3
P189 100.0 100.0 102.7 104.4 100.0 100.0 103.0 104.3 100.0 100.0 102.8 104.3 100.0 100.0 102.6 104.3
P189 100.0 100.0 102.7 104.4 100.0 100.0 103.0 104.3 100.0 100.0 102.8 104.3 100.0 100.0 102.6 104.3
Al Nahdah-C
Amerat 4-A
Amerat 4-B
Amerat 4-C
Madinat Al Nahdah-A
Madinat Al Nahdah-B
Seih Dhabi-A
Seih Dhabi-B
Primary Substations Bus Voltages
Primary P.No.
2019 2020 2021 2022
33kV (%) 11kV(%) 33kV (%) 11kV(%) 33kV (%) 11kV(%) 33kV (%) 11kV(%)
Al Nahdah-A
Al Nahdah-B
Seih Dhabi-F1-P118 5.6 25.7 6.0 27.2 6.7 30.5 7.5 34.0
Seih Dhabi-F2-P118 5.6 25.6 6.0 27.2 6.7 30.4 7.5 33.9
Madinat Al Nahdah-F1-P065 9.8 44.5 10.7 48.7 9.8 44.6 10.4 47.2
Madinat Al Nahdah-F2-P065 9.9 45.0 10.8 49.2 9.9 45.0 10.5 47.7
Amerat 4-F2-P180 - - - - 4.1 18.8 4.6 21.0
Amerat 4-F3-P180 - - - - 4.1 18.8 4.6 21.0
- - - - 4.1 18.8 4.6 21.0Amerat 4-F1-P180
Al Nahdah-F2-P006 - - 8.5 38.5 11.8 53.7 13.2 60.0
Al Nahdah-F3-P006 - - 8.5 38.6 11.8 53.9 13.2 60.2
33kV Feeder Maximum Loads
Primary Rating(MVA)
2019 2020 2021 2022
MVA %Loading MVA %Loading MVA %Loading MVA %Loading
Al Nahdah-F1-P006 - - 8.5 38.7 11.9 54.0 13.3 60.3
Amerat[G10] - B GSS [Zone 1] - System Study ResultsPrimary Substations Maximum Demand and Percentage Loading
Primary Substation P.No.Firm
Capacity(MVA)
2019 2020 2021 2022
Primary Substations Minimum Demand and Percentage Loading
Primary Substation P.No.Firm
Capacity(MVA)
2019 2020 2021 2022
Al Jufaina
MEDC Distribution System Capability Statement [2020-2022]-V1.0 77

33kV 11kV 33kV 11kV 33kV 11kV 33kV 11kV
P194 7.6 4.0 8.1 4.1 8.2 4.1 8.2 4.1
P006 - - 9.6 13.6 9.7 14.1 9.8 14.4
P006 - - 9.6 13.6 9.7 14.1 9.8 14.4
P006 - - 9.1 7.5 9.2 7.8 9.3 7.9
P180 - - - - 12.3 12.4 12.4 12.5
P179 - - - - 12.3 12.4 12.4 12.5
P179 - - - - 12.2 7.0 12.3 7.0
P065 6.4 6.2 7.0 11.7 7.0 11.5 7.0 11.7
P180 2.6 4.3 7.0 11.7 7.0 11.5 7.0 11.7
P189 20.7 13.1 21.3 13.3 21.6 13.4 22.0 13.6
P189 20.7 13.1 21.3 13.3 21.6 13.4 22.1 13.6
25.0 18.4
Al Nahdah-C 25.0 25.0
Amerat 4-A 25.0 25.0
Amerat 4-B 25.0 25.0
Amerat 4-C 25.0 25.0
Madinat Al Nahdah-A 25.0 18.4
Primary Substation 3-Phase Fault Current Levels (kA)
Primary P.No. 33kV -Rated SC Capacity
11kV -Rated SC Capacity
2019 2020 2021 2022
Al Nahdah-A 25.0 18.4
Madinat Al Nahdah-B 25.0 18.4
Seih Dhabi-A 25.0 18.4
Seih Dhabi-B 25.0 18.4
Al Nahdah-B
Al Jufaina 25.0 16.0
MEDC Distribution System Capability Statement [2020-2022]-V1.0 78

MW MVAr MVA % MW MVAr MVA % MW MVAr MVA % MW MVAr MVA %
Azaibah North 2 P012 20 14.9 4.4 15.5 78% 15.5 4.4 16.1 81% 16.3 4.7 17.0 85% 16.7 4.8 17.4 87%
Azaibah South 1-A P014 20 15.9 8.4 18.0 90% Shifted to Ghala Heights GSS
Diplomatic City P022 40 21.7 13.7 25.7 64% 21.7 7.1 22.8 57% 21.7 7.1 22.8 57% 21.7 7.1 22.8 57%
Ghubrah GPS P166 16 5.9 2.3 6.4 40% 5.9 2.3 6.4 40% 5.9 2.3 6.4 40% 5.9 2.3 6.4 40%
Ghubrah North 1 P023 40 31.3 13.6 34.1 85% 32.5 10.7 34.3 86% 34.2 11.3 36.0 90% 35.1 11.5 36.9 92%
Ghubrah North 2 P149 40 30.1 12.4 32.6 82% 31.3 10.3 32.9 82% 32.9 10.8 34.6 87% 33.7 11.1 35.5 89%
MW MVAr MVA % MW MVAr MVA % MW MVAr MVA % MW MVAr MVA %
Azaibah North 2 P012 20 3.0 1.1 3.2 16% 3.1 1.2 3.3 17% 3.3 1.2 3.5 17% 3.4 1.2 3.6 18%
Azaibah South 1-A P014 20 1.2 0.9 1.5 8% Shifted to Ghala Heights GSS
Diplomatic City P022 40 3.5 2.1 4.1 10% 3.1 1.9 3.6 9% 3.1 1.9 3.6 9% 3.1 1.9 3.6 9%
Ghubrah GPS P166 16 1.1 0.5 1.2 8% 1.1 0.5 1.2 8% 1.1 0.5 1.2 8% 1.1 0.5 1.2 8%
Ghubrah North 1 P023 40 3.7 2.2 4.3 11% 3.7 2.2 4.3 11% 3.9 2.3 4.5 11% 4.0 2.4 4.7 12%
Ghubrah North 2 P149 40 5.8 3.7 6.9 17% 5.9 3.8 7.0 17% 6.2 4.0 7.3 18% 6.3 4.1 7.5 19%
22.0
22.0
20.0
20.0
22.0
22.0
22.0
22.0
22.0
22.0
22.0
22.0
22.0
22.0
22.0
Max Min Max Min Max Min Max Min Max Min Max Min Max Min Max Min
P012 99.4 100.6 101.8 104.7 100.0 100.6 102.7 104.7 101.0 100.5 103.7 104.7 101.0 100.5 103.6 104.6
P012 99.4 100.6 101.8 104.7 100.0 100.6 102.7 104.7 101.1 100.5 103.7 104.7 101.0 100.5 103.6 104.6
P014 98.5 100.6 99.8 104.8 - - - - - - - - - - - -
P014 98.4 100.6 99.8 104.8 - - - - - - - - - - - -
P022 99.4 100.6 100.3 104.7 100.1 100.6 102.7 104.7 101.2 100.6 103.9 104.7 101.1 100.5 103.8 104.7
P022 99.4 100.6 100.3 104.7 100.1 100.6 102.7 104.7 101.2 100.6 103.9 104.7 101.1 100.5 103.8 104.7
P022 99.5 100.6 99.8 104.6 100.1 100.6 102.9 104.7 101.2 100.6 104.0 104.7 101.2 100.6 104.0 104.7
P023 99.5 100.6 100.2 104.6 100.1 100.6 101.8 104.7 101.2 100.6 102.8 104.6 101.1 100.6 102.6 104.6
P023 99.5 100.6 100.2 104.6 100.1 100.6 101.8 104.7 101.2 100.6 102.8 104.6 101.1 100.6 102.6 104.6
P023 99.5 100.6 100.4 104.7 100.1 100.6 101.8 104.7 101.2 100.6 102.8 104.6 101.1 100.6 102.6 104.6
P166 99.6 100.6 103.1 105.0 100.2 100.6 103.7 105.0 101.3 100.6 104.9 104.9 101.2 100.6 104.8 104.9
P166 99.6 100.6 103.1 105.0 100.2 100.6 103.7 105.0 101.3 100.6 104.9 104.9 101.2 100.6 104.8 104.9
P149 99.3 100.5 100.9 104.3 99.9 100.5 101.8 104.3 101.0 100.5 102.8 104.2 100.9 100.5 102.6 104.1
P149 99.3 100.5 100.9 104.3 99.9 100.5 101.8 104.3 101.0 100.5 102.8 104.2 100.9 100.5 102.6 104.1
P149 99.2 100.5 100.2 104.2 99.9 100.5 101.8 104.3 101.0 100.5 102.8 104.2 100.9 100.5 102.6 104.2
Azaiba North 2-A
Azaiba North 2-B
Azaiba South 1A-A
Azaiba South 1A-B
Diplomatic City 1-A
Diplomatic City 1-B
Diplomatic City 1-C
Ghubra North 1-A
Ghubra North 1-B
Ghubra North 1-C
Ghubrah GPS-A
Ghubrah GPS-B
Ghubrah North 02-A
Ghubrah North 02-B
Ghubrah North 02-C
Primary Substations Bus Voltages
Primary P.No.
2019 2020 2021 2022
33kV (%) 11kV(%) 33kV (%) 11kV(%) 33kV (%) 11kV(%) 33kV (%) 11kV(%)
Ghubrah North 02-F3-P149 12.5 56.7 11.2 50.9 11.8 53.6 12.1 54.9
Ghubrah North 02-F1-P149 10.4 47.0 11.2 50.9 11.8 53.6 12.1 55.0
Ghubrah North 02-F2-P149 10.4 46.9 11.2 50.8 11.8 53.5 12.1 54.9
Ghubrah GPS-F1-P166 3.2 14.5 3.2 14.6 3.2 14.6 3.2 14.6
Ghubrah GPS-F2-P166 3.2 14.3 3.2 14.4 3.2 14.4 3.2 14.4
Ghubra North 1-F2-P023 12.1 54.8 11.7 53.2 12.3 56.0 12.6 57.4
Ghubra North 1-F3-P023 11.5 52.1 11.7 53.3 12.3 56.1 12.6 57.5
Diplomatic City 1-F3-P022 10.3 46.8 7.7 34.9 7.7 34.9 7.7 34.9
Ghubra North 1-F1-P023 12.1 54.9 11.7 53.3 12.4 56.1 12.7 57.5
Diplomatic City 1-F1-P022 8.4 38.0 7.6 34.7 7.6 34.7 7.6 34.7
Diplomatic City 1-F2-P022 8.5 38.5 7.7 35.2 7.7 35.2 7.7 35.2
Azaiba South 1A-F1-P014 9.2 45.9 - - - - - -
Azaiba South 1A-F2-P014 9.0 45.2 - - - - - -
Azaiba North 2-F1-P012 8.1 36.7 8.3 37.6 8.7 39.5 8.9 40.5
Azaiba North 2-F2-P012 7.9 35.6 8.0 36.4 8.4 38.3 8.6 39.3
Primary Substations Minimum Demand and Percentage Loading
Primary Substation P.No.Firm
Capacity(MVA)
2019 2020 2021 2022
33kV Feeder Maximum Loads
Primary Rating(MVA)
2019 2020 2021 2022
MVA %Loading MVA %Loading MVA %Loading MVA %Loading
Ghubrah 2[G09] GSS [Zone 2] - System Study ResultsPrimary Substations Maximum Demand and Percentage Loading
2020 2021 2022Primary Substation P.No.
Firm Capacity(MVA)
2019
MEDC Distribution System Capability Statement [2020-2022]-V1.0 79

33kV 11kV 33kV 11kV 33kV 11kV 33kV 11kV
P012 16.0 13.9 15.9 13.9 16.0 14.0 15.7 13.9
P012 16.0 13.9 15.9 13.9 16.0 14.0 15.7 13.9
P014 9.2 12.6 - - - - - -
P014 8.8 12.6 - - - - - -
P022 18.8 14.0 18.7 13.9 18.8 13.9 18.4 13.8
P022 18.8 14.0 18.7 13.9 18.8 13.9 18.4 13.8
P022 20.2 8.2 20.1 8.0 20.2 8.0 19.7 8.0
P023 21.1 15.0 21.0 14.9 21.1 15.0 20.5 15.0
P023 21.1 15.0 21.0 14.9 21.1 15.0 20.5 15.0
P023 21.0 8.2 20.9 8.3 21.0 8.3 20.5 8.3
P166 21.6 11.8 21.5 11.8 21.5 11.8 21.0 11.8
P166 21.6 11.8 21.5 11.8 21.5 11.8 21.0 11.8
P149 16.8 14.8 16.7 14.9 16.8 15.0 16.4 15.0
P149 16.7 14.8 16.7 14.9 16.7 15.0 16.4 15.0
P149 16.6 8.4 16.6 8.3 16.6 8.3 16.3 8.3
Ghubrah North 02-A 25.0 25.0
Ghubrah North 02-B 25.0 25.0
Ghubrah North 02-C 25.0 25.0
Diplomatic City 1-C 25.0 25.0
Ghubra North 1-A 25.0 20.0
Ghubra North 1-B 25.0 20.0
Ghubra North 1-C 25.0 20.0
Ghubrah GPS-A 25.0 25.0
Ghubrah GPS-B 25.0 25.0
Azaiba North 2-A 25.0 18.4
Azaiba North 2-B 25.0 18.4
Azaiba South 1A-A 25.0 18.4
Azaiba South 1A-B 25.0 18.4
Diplomatic City 1-A 25.0 25.0
Diplomatic City 1-B 25.0 25.0
Primary Substation 3-Phase Fault Current Levels (kA)
Primary P.No. 33kV -Rated SC Capacity
11kV -Rated SC Capacity
2019 2020 2021 2022
MEDC Distribution System Capability Statement [2020-2022]-V1.0 80

MW MVAr MVA % MW MVAr MVA % MW MVAr MVA % MW MVAr MVA %
Al Khuwair North P054 40 23.7 10.8 26.0 65% 25.2 8.3 26.5 66% 31.2 10.2 32.8 82% 33.2 10.9 35.0 87%
Information City 2 P038 1TX Standby PSS
Intercontinental P109 20 12.4 5.6 13.6 68% 17.4 5.7 18.3 92% 22.4 7.4 23.6 118% 17.4 5.7 18.3 92%
MSQ Grid GP06 20 19.2 7.6 20.6 103% 19.7 7.8 21.2 106% 20.2 8.0 21.8 109% 20.5 8.1 22.1 110%
Royal Office P097 20 6.5 2.3 6.9 35% 6.5 2.1 6.8 34% 6.5 2.1 6.8 34% 6.5 2.1 6.8 34%
Sarooj -Shati Al Qurum P110 20 18.5 8.0 20.2 101% 18.5 8.1 20.2 101% 18.5 8.1 20.2 101% 13.5 5.9 14.7 74%
MW MVAr MVA % MW MVAr MVA % MW MVAr MVA % MW MVAr MVA %
Al Khuwair North P054 40 2.3 1.0 2.5 6% 2.3 1.0 2.5 6% 2.9 1.2 3.1 8% 3.1 1.3 3.4 8%
Information City 2 P038 1TX Standby PSS
Intercontinental P109 20 2.9 1.8 3.4 17% 3.9 2.4 4.6 23% 5.0 3.1 5.9 29% 3.9 2.4 4.6 23%
MSQ Grid GP06 20 3.4 1.7 3.8 19% 3.5 1.7 3.9 20% 3.6 1.8 4.0 20% 3.6 1.8 4.1 20%
Royal Office P097 20 2.6 0.7 2.7 14% 2.6 0.7 2.7 13% 2.6 0.7 2.7 13% 2.6 0.7 2.7 13%
Sarooj -Shati Al Qurum P110 20 3.3 1.4 3.6 18% 3.3 1.4 3.6 18% 3.3 1.4 3.6 18% 2.4 1.0 2.6 13%
22.0
22.0
22.0
22.0
22.0
22.0
22.0
22.0
22.0
22.0
22.0
Max Min Max Min Max Min Max Min Max Min Max Min Max Min Max Min
P054 101.0 101.1 103.3 105.5 101.4 101.0 104.0 105.4 100.4 100.9 102.5 105.2 100.7 100.9 102.6 105.3
P054 101.0 101.1 103.3 105.5 101.4 101.0 104.0 105.4 100.4 100.9 102.5 105.2 100.7 100.9 102.6 105.3
P054 101.0 101.1 102.9 105.5 101.4 101.0 104.0 105.4 100.4 100.9 102.5 105.2 100.7 100.9 102.6 105.2
P038 100.9 101.1 105.5 105.7 101.2 101.0 105.8 105.6 100.2 100.8 104.8 105.4 100.6 100.9 105.1 105.5
P109 100.8 101.0 103.7 105.1 101.1 100.9 103.8 104.8 100.0 100.8 102.1 104.4 100.4 100.8 103.2 104.7
P109 100.9 101.0 103.7 105.1 101.1 101.0 103.8 104.8 100.1 100.8 102.1 104.4 100.5 100.9 103.2 104.7
P083 101.2 101.1 102.9 105.1 101.5 101.1 103.1 105.0 100.6 100.9 102.1 104.8 100.9 101.0 102.3 104.9
P083 101.2 101.1 102.9 105.1 101.5 101.1 103.1 105.0 100.6 100.9 102.1 104.8 100.9 101.0 102.3 104.9
P097 101.0 101.1 104.7 105.4 101.4 101.0 105.2 105.3 100.5 100.9 104.2 105.2 100.7 100.9 104.5 105.2
P097 101.0 101.1 104.7 105.4 101.4 101.0 105.2 105.3 100.5 100.9 104.2 105.2 100.7 100.9 104.5 105.2
P110 100.8 101.1 102.9 105.2 101.1 101.0 103.2 105.2 100.2 100.8 102.3 105.0 100.6 100.9 103.4 105.2
P110 100.8 101.1 102.9 105.2 101.1 101.0 103.2 105.2 100.2 100.8 102.3 105.0 100.6 100.9 103.4 105.2
Al Khuwair North-A
Al Khuwair North-B
Al Khuwair North-C
Information City 2
Intercontinental-A
Intercontinental-B
MSQ Grid-A
MSQ Grid-B
Royal Office-A
Royal Office-B
Sarooj -Shati Al Qurum-A
Sarooj -Shati Al Qurum-B
10.3 46.9 7.5 34.0
Primary Substations Bus Voltages
Primary P.No.
2019 2020 2021 2022
33kV (%) 11kV(%) 33kV (%) 11kV(%) 33kV (%) 11kV(%) 33kV (%) 11kV(%)
Royal Office-F1-P097 3.5 16.1 3.5 15.9 3.5 15.9 3.5 15.9
Sarooj -Shati Al Qurum-F2-P110 10.3 46.8 10.3 46.9 10.3 46.9 7.5 34.0
Royal Office-F2-P097 3.5 15.8 3.4 15.6 3.4 15.6 3.4 15.6
Sarooj -Shati Al Qurum-F1-P110 10.3 46.7 10.3 46.9
MSQ Grid-F1-GP06 10.5 47.9 10.9 49.4 11.2 50.7 11.3 51.4
MSQ Grid-F2-GP06 10.7 48.5 11.0 50.0 11.3 51.3 11.5 52.1
6.8 31.1 9.2 42.0 12.0 54.4 9.2 42.0Intercontinental-F1-P109
Intercontinental-F2-P109 6.9 31.5 9.4 42.5 12.1 55.0 9.3 42.5
Al Khuwair North-F2-P054 8.5 38.7 9.1 41.3 11.3 51.3 12.0 54.7
Al Khuwair North-F3-P054 9.8 44.6 9.0 41.0 11.2 51.0 12.0 54.3
33kV Feeder Maximum Loads
Primary Rating(MVA)
2019 2020 2021 2022
MVA %Loading MVA %Loading MVA %Loading MVA %Loading
Al Khuwair North-F1-P054 8.4 38.1 9.0 40.7 11.1 50.6 11.9 53.9
MSQ[GP06] - A GSS [Zone 2] - System Study ResultsPrimary Substations Maximum Demand and Percentage Loading
Primary Substation P.No.Firm
Capacity(MVA)
2019 2020 2021 2022
Primary Substations Minimum Demand and Percentage Loading
Primary Substation P.No.Firm
Capacity(MVA)
2019 2020 2021 2022
MEDC Distribution System Capability Statement [2020-2022]-V1.0 81

33kV 11kV 33kV 11kV 33kV 11kV 33kV 11kV
P054 20.2 15.5 20.6 15.6 20.9 16.0 20.3 16.0
P054 20.2 15.5 20.6 15.6 20.9 16.0 20.3 16.0
P054 20.2 8.7 20.5 8.7 20.9 8.8 20.3 8.9
P038 16.7 3.3 17.0 3.3 17.2 3.3 16.8 3.3
P109 14.5 15.5 14.8 15.9 15.0 16.4 14.6 15.9
P109 15.4 15.5 15.6 15.9 15.9 16.4 15.5 15.9
P083 24.6 15.1 25.1 15.2 25.7 15.3 24.8 15.2
P083 24.6 15.1 25.1 15.2 25.7 15.3 24.8 15.2
P097 14.7 13.0 14.9 13.0 15.1 13.1 14.8 13.0
P097 14.7 13.0 14.9 13.0 15.1 13.1 14.8 13.0
P110 16.2 16.2 16.4 16.3 16.7 16.3 16.2 15.8
P110 16.1 16.2 16.4 16.3 16.6 16.3 16.2 15.8
25.0 18.4
Intercontinental-A 25.0 18.4
Intercontinental-B 25.0 18.4
MSQ Grid-A 25.0 18.4
MSQ Grid-B 25.0 18.4
Royal Office-A 25.0 18.4
Royal Office-B 25.0 18.4
Sarooj -Shati Al Qurum-A 25.0 18.4
Primary Substation 3-Phase Fault Current Levels (kA)
Primary P.No. 33kV -Rated SC Capacity
11kV -Rated SC Capacity
2019 2020 2021 2022
Al Khuwair North-A 25.0 25.0
Al Khuwair North-B 25.0 25.0
Al Khuwair North-C 25.0 25.0
Information City 2
Sarooj -Shati Al Qurum-B 25.0 18.4
MEDC Distribution System Capability Statement [2020-2022]-V1.0 82

MW MVAr MVA % MW MVAr MVA % MW MVAr MVA % MW MVAr MVA %
Al Khuwair 25 P053 20 20.8 5.3 21.5 108% 22.1 5.8 22.9 114% 19.3 5.1 20.0 100% 20.6 5.4 21.3 107%
Al Khuwair School P146 40 23.2 10.7 25.5 64% 24.7 8.1 26.0 65% 32.7 10.8 34.5 86% 34.9 11.5 36.7 92%
Digital TV Studio P039 20 3.2 1.6 3.6 18% 3.2 1.1 3.4 17% 3.2 1.1 3.4 17% 3.2 1.1 3.4 17%
MSQ 1 P083 20 16.9 5.8 17.9 90% 17.4 5.7 18.3 92% 17.9 5.9 18.8 94% 18.1 6.0 19.1 95%
ROP -Shati Al Qurum P111 20 13.2 5.2 14.2 71% 13.2 5.2 14.2 71% 13.2 5.2 14.2 71% 13.2 5.2 14.2 71%
MW MVAr MVA % MW MVAr MVA % MW MVAr MVA % MW MVAr MVA %
Al Khuwair 25 P053 20 2.9 1.1 3.1 16% 3.1 1.2 3.3 16% 2.7 1.0 2.9 14% 2.9 1.1 3.1 15%
Al Khuwair School P146 40 4.1 2.7 4.9 12% 4.2 2.7 5.0 12% 5.5 3.6 6.6 17% 5.9 3.9 7.1 18%
Digital TV Studio P039 20 0.8 0.4 0.9 5% 0.7 0.4 0.8 4% 0.7 0.4 0.8 4% 0.7 0.4 0.8 4%
MSQ 1 P083 20 4.3 2.3 4.9 25% 4.4 2.4 5.0 25% 4.5 2.5 5.1 26% 4.6 2.5 5.2 26%
ROP -Shati Al Qurum P111 20 1.6 0.6 1.7 9% 1.6 0.6 1.7 9% 1.6 0.6 1.7 9% 1.6 0.6 1.7 9%
22.0
22.0
22.0
22.0
22.0
22.0
22.0
22.0
22.0
22.0
22.0
Max Min Max Min Max Min Max Min Max Min Max Min Max Min Max Min
P053 100.5 101.0 103.0 105.2 100.5 101.0 102.7 105.2 100.6 101.0 103.2 105.3 100.5 101.0 103.0 105.2
P053 100.5 101.0 103.0 105.2 100.5 101.0 102.7 105.2 100.6 101.0 103.2 105.3 100.6 101.0 103.0 105.2
P146 101.0 101.1 103.6 105.2 101.3 101.0 103.8 105.0 100.3 100.8 102.0 104.6 100.5 100.9 102.0 104.6
P146 101.0 101.1 103.6 105.2 101.3 101.0 103.8 105.0 100.3 100.8 102.0 104.6 100.5 100.9 102.0 104.6
P146 100.8 101.0 101.2 104.7 101.3 101.0 103.8 105.0 100.3 100.8 101.9 104.6 100.5 100.9 102.0 104.6
P039 101.1 101.1 105.1 105.6 101.5 101.0 105.7 105.5 100.6 100.9 104.7 105.3 100.8 101.0 105.0 105.4
P039 101.1 101.1 105.1 105.6 101.5 101.0 105.7 105.5 100.6 100.9 104.7 105.3 100.8 101.0 105.0 105.4
P083 101.0 101.1 103.2 104.8 101.4 101.0 103.7 104.7 100.5 100.9 102.6 104.6 100.7 100.9 102.8 104.6
P083 101.0 101.1 103.2 104.8 101.4 101.0 103.7 104.7 100.5 100.9 102.6 104.6 100.7 100.9 102.8 104.6
P111 100.7 101.0 103.7 105.5 100.7 101.0 103.6 105.5 100.8 101.0 103.7 105.5 100.7 101.0 103.7 105.5
P111 100.7 101.0 103.7 105.5 100.7 101.0 103.6 105.5 100.8 101.0 103.7 105.5 100.7 101.0 103.7 105.5
Al Khuwair 25-A
Al Khuwair 25-B
Al Khuwair School-A
Al Khuwair School-B
Al Khuwair School-C
Digital TV Studio-A
Digital TV Studio-B
MSQ 1-A
MSQ 1-B
ROP -Shati Al Qurum-A
ROP -Shati Al Qurum-B
Primary Substations Bus Voltages
Primary P.No.
2019 2020 2021 2022
33kV (%) 11kV(%) 33kV (%) 11kV(%) 33kV (%) 11kV(%) 33kV (%) 11kV(%)
ROP -Shati Al Qurum-F2-P111 7.2 32.7 7.2 32.7 7.2 32.7 7.2 32.7
MSQ 1-F2-P083 10.6 48.4 9.3 42.3 10.2 46.5 10.4 47.2
ROP -Shati Al Qurum-F1-P111 7.3 33.0 7.3 33.0 7.3 33.0 7.3 33.0
Digital TV Studio-F2-P039 1.8 8.2 1.7 7.7 1.7 7.7 1.7 7.7
MSQ 1-F1-P083 8.4 38.0 9.5 43.0 9.2 41.8 9.3 42.4
Al Khuwair School-F3-P146 13.4 61.0 8.8 40.2 11.8 53.7 12.6 57.3
Digital TV Studio-F1-P039 1.8 8.2 1.7 7.7 1.7 7.7 1.7 7.7
Al Khuwair School-F1-P146 6.5 29.4 8.8 40.1 11.8 53.5 12.6 57.1
Al Khuwair School-F2-P146 6.5 29.5 8.9 40.3 11.8 53.8 12.6 57.4
Al Khuwair 25-F1-P053 10.9 49.6 11.7 53.0 10.1 46.1 10.8 49.3
Al Khuwair 25-F2-P053 10.9 49.6 11.6 52.9 10.1 46.1 10.8 49.2
Primary Substations Minimum Demand and Percentage Loading
Primary Substation P.No.Firm
Capacity(MVA)
2019 2020 2021 2022
33kV Feeder Maximum Loads
Primary Rating(MVA)
2019 2020 2021 2022
MVA %Loading MVA %Loading MVA %Loading MVA %Loading
MSQ[GP06] - B GSS [Zone 2] - System Study ResultsPrimary Substations Maximum Demand and Percentage Loading
Primary Substation P.No.Firm
Capacity(MVA)
2019 2020 2021 2022
MEDC Distribution System Capability Statement [2020-2022]-V1.0 83

33kV 11kV 33kV 11kV 33kV 11kV 33kV 11kV
P053 14.4 14.2 14.6 14.4 14.6 14.2 13.0 13.8
P053 14.5 14.2 14.7 14.4 14.7 14.2 13.1 13.8
P146 18.1 14.0 18.5 14.4 18.8 14.9 18.3 14.9
P146 18.1 14.0 18.5 14.4 18.8 14.9 18.3 14.9
P146 18.1 8.2 18.4 7.9 18.7 8.1 18.2 8.2
P039 16.9 13.0 17.2 13.0 17.4 13.1 17.0 13.0
P039 16.9 13.0 17.2 13.0 17.4 13.1 17.0 13.0
P083 20.5 14.2 20.9 14.3 21.3 14.4 20.7 14.3
P083 20.6 14.2 21.0 14.3 21.3 14.4 20.7 14.3
P111 16.2 15.5 16.4 15.6 16.4 15.6 14.4 14.9
P111 16.2 15.5 16.4 15.6 16.4 15.6 14.4 14.9
Digital TV Studio-B 25.0 18.4
MSQ 1-A 25.0 20.0
MSQ 1-B 25.0 20.0
ROP -Shati Al Qurum-A 25.0 18.4
ROP -Shati Al Qurum-B 25.0 18.4
Al Khuwair 25-A 25.0 20.0
Al Khuwair 25-B 25.0 20.0
Al Khuwair School-A 25.0 25.0
Al Khuwair School-B 25.0 25.0
Al Khuwair School-C 25.0 25.0
Digital TV Studio-A 25.0 18.4
Primary Substation 3-Phase Fault Current Levels (kA)
Primary P.No. 33kV -Rated SC Capacity
11kV -Rated SC Capacity
2019 2020 2021 2022
MEDC Distribution System Capability Statement [2020-2022]-V1.0 84

MW MVAr MVA % MW MVAr MVA % MW MVAr MVA % MW MVAr MVA %
Information City 1 P037 20 16.4 8.3 18.4 92% 16.4 5.4 17.3 86% 16.4 5.4 17.3 86% 16.4 5.4 17.3 86%
Lulai P095 20 12.5 3.8 13.1 66% 12.8 3.8 13.4 67% 13.2 4.0 13.8 69% 13.4 4.0 14.0 70%
MSQ 2 P155 40 17.5 6.7 18.7 47% 18.0 5.9 19.0 47% 18.5 6.1 19.5 49% 18.8 6.2 19.8 49%
Qurum 1 P093 16 14.8 5.0 15.6 98% 15.1 5.0 15.9 99% 15.6 5.1 16.4 102% 15.8 5.2 16.6 104%
Qurum 2 P094 20 21.1 6.8 22.2 111% 21.5 7.1 22.7 113% 22.2 7.3 23.3 117% 22.5 7.4 23.7 118%
Rabiat Al Qurum P096 20 12.3 4.9 13.2 66% 12.5 4.1 13.2 66% 12.9 4.2 13.6 68% 13.1 4.3 13.8 69%
Sarooj04 P181 40 - - - - - - - - - - - - 10.0 3.3 10.5 26%
MW MVAr MVA % MW MVAr MVA % MW MVAr MVA % MW MVAr MVA %
Information City 1 P037 20 3.3 2.3 4.0 20% 3.1 2.1 3.8 19% 3.1 2.1 3.8 19% 3.1 2.1 3.8 19%
Lulai P095 20 2.1 0.7 2.2 11% 2.1 0.7 2.2 11% 2.2 0.7 2.3 12% 2.2 0.7 2.3 12%
MSQ 2 P155 40 2.8 0.0 2.8 7% 2.8 0.0 2.8 7% 2.9 0.0 2.9 7% 3.0 0.0 3.0 7%
Qurum 1 P093 16 3.6 2.2 4.2 26% 3.7 2.2 4.3 27% 3.8 2.3 4.4 28% 3.8 2.3 4.5 28%
Qurum 2 P094 20 4.1 0.0 4.1 21% 4.2 0.0 4.2 21% 4.3 0.0 4.3 22% 4.4 0.0 4.4 22%
Rabiat Al Qurum P096 20 2.5 0.0 2.5 13% 2.5 0.0 2.5 12% 2.6 0.0 2.6 13% 2.6 0.0 2.6 13%
Sarooj04 P181 40 - - - - - - - - - - - - 1.8 0.8 2.0 5%
22.0
22.0
22.0
22.0
22.0
22.0
22.0
22.0
22.0
22.0
22.0
22.0
22.0
22.0
22.0
22.0Sarooj 4-F3-P181 - - - - - - 3.5 16.1
Sarooj 4-F1-P181 - - - - - - 3.5 16.1
Sarooj 4-F2-P181 - - - - - - 3.5 16.1
Rabiat Al Qurum-F1-P096 6.7 30.6 6.7 30.6 6.9 31.6 7.0 32.0
Rabiat Al Qurum-F2-P096 6.7 30.3 6.7 30.3 6.9 31.3 7.0 31.7
Qurum 2-F1-P094 11.2 51.0 11.5 52.1 11.8 53.8 12.0 54.6
Qurum 2-F2-P094 11.6 52.6 11.8 53.7 12.2 55.4 12.4 56.3
Qurum 1-F1-P093 7.7 35.0 7.9 35.7 8.1 36.9 8.2 37.4
Qurum 1-F2-P093 8.1 36.7 8.2 37.4 8.5 38.6 8.6 39.1
MSQ 02-F2-P155 4.1 18.7 6.4 29.2 6.6 30.0 6.7 30.4
MSQ 02-F3-P155 10.8 49.1 6.4 29.2 6.6 30.0 6.7 30.4
Lulai-F2-P095 6.5 29.7 6.7 30.3 6.9 31.3 7.0 31.7
MSQ 02-F1-P155 4.1 18.7 6.4 29.2 6.6 29.9 6.7 30.4
Information City 1-F2-P037 9.4 42.6 8.9 40.3 8.9 40.3 8.9 40.3
Lulai-F1-P095 6.7 30.5 6.8 31.1 7.1 32.1 7.2 32.5
33kV Feeder Maximum Loads
Primary Rating(MVA)
2019 2020 2021 2022
MVA %Loading MVA %Loading MVA %Loading MVA %Loading
Information City 1-F1-P037 9.2 41.9 8.7 39.6 8.7 39.6 8.7 39.6
Qurum[G06] GSS [Zone 2] - System Study ResultsPrimary Substations Maximum Demand and Percentage Loading
Primary Substation P.No.Firm
Capacity(MVA)
2019 2020 2021 2022
Primary Substations Minimum Demand and Percentage Loading
Primary Substation P.No.Firm
Capacity(MVA)
2019 2020 2021 2022
MEDC Distribution System Capability Statement [2020-2022]-V1.0 85

Max Min Max Min Max Min Max Min Max Min Max Min Max Min Max Min
P037 100.3 100.9 102.1 104.7 100.6 100.9 103.2 104.8 100.5 100.9 103.1 104.8 100.2 100.9 102.7 104.8
P037 100.5 100.9 102.1 104.7 100.7 100.9 103.2 104.8 100.6 100.9 103.1 104.8 100.3 100.9 102.7 104.8
P095 100.7 101.0 103.8 105.3 100.9 101.0 104.0 105.3 100.8 100.9 103.8 105.3 100.5 101.0 103.4 105.3
P095 100.6 101.0 103.8 105.3 100.8 101.0 104.0 105.3 100.7 100.9 103.8 105.3 100.4 100.9 103.4 105.3
P155 100.6 101.0 104.2 105.5 100.8 101.0 103.9 105.5 100.7 101.0 103.7 105.5 100.4 101.0 103.4 105.5
P155 100.6 101.0 104.2 105.5 100.8 101.0 103.9 105.5 100.7 101.0 103.7 105.5 100.3 101.0 103.4 105.5
P155 100.4 100.9 102.2 105.5 100.8 101.0 103.9 105.5 100.7 101.0 103.7 105.5 100.4 101.0 103.4 105.5
P093 100.3 100.8 102.9 104.7 100.5 100.8 103.1 104.6 100.4 100.8 102.9 104.6 100.1 100.8 102.5 104.6
P093 100.4 100.9 102.9 104.7 100.6 100.9 103.1 104.6 100.5 100.8 102.9 104.6 100.1 100.9 102.5 104.6
P094 100.3 100.9 101.8 105.4 100.5 100.9 102.0 105.4 100.4 100.9 101.8 105.4 100.0 100.9 101.4 105.4
P094 100.4 100.9 101.8 105.4 100.6 100.9 102.0 105.4 100.5 100.9 101.8 105.4 100.1 100.9 101.4 105.4
P096 100.7 101.0 103.5 105.5 100.9 101.0 103.9 105.5 100.8 101.0 103.7 105.5 100.5 101.0 103.4 105.5
P096 100.7 101.0 103.5 105.5 100.9 101.0 103.9 105.5 100.8 101.0 103.7 105.5 100.5 101.0 103.4 105.5
P181 - - - - - - - - - - - - 100.5 101.0 104.2 105.3
P181 - - - - - - - - - - - - 100.5 101.0 104.2 105.3
P181 - - - - - - - - - - - - 100.5 101.0 104.2 105.3
33kV 11kV 33kV 11kV 33kV 11kV 33kV 11kV
P037 14.1 14.2 14.2 14.2 14.2 14.2 13.8 14.0
P037 16.7 14.2 16.8 14.2 16.9 14.2 16.3 14.0
P095 19.1 13.7 19.4 13.8 19.4 13.8 18.7 13.7
P095 17.5 13.7 17.7 13.8 17.7 13.8 17.1 13.7
P155 15.7 13.5 15.9 13.9 15.9 13.9 15.4 13.8
P155 15.7 13.5 15.9 13.9 15.9 13.9 15.4 13.8
P155 15.8 8.0 15.9 7.7 15.9 7.7 15.4 7.7
P093 12.4 13.1 12.5 13.1 12.6 13.2 12.3 13.1
P093 13.6 13.1 13.7 13.1 13.7 13.2 13.4 13.1
P094 14.4 14.1 14.6 14.2 14.6 14.3 14.2 14.0
P094 15.9 14.1 16.0 14.2 16.1 14.3 15.6 14.0
P096 20.6 14.0 20.9 14.0 20.9 14.0 20.1 13.9
P096 20.5 14.0 20.8 14.0 20.9 14.0 20.1 13.9
P181 - - - - - - 16.1 13.0
P181 - - - - - - 16.1 13.0
P181 - - - - - - 16.0 7.3
Sarooj 4-A 25.0 25.0
Sarooj 4-B 25.0 25.0
Sarooj 4-C 25.0 25.0
Qurum 1-A 25.0 20.0
Qurum 1-B 25.0 20.0
Qurum 2-A 25.0 20.0
Qurum 2-B 25.0 20.0
Rabiat Al Qurum-A 25.0 18.4
Rabiat Al Qurum-B 25.0 18.4
Information City 1-B 25.0 20.0
Lulai-A 25.0 18.4
Lulai-B 25.0 18.4
MSQ 02-A 25.0 25.0
MSQ 02-B 25.0 25.0
MSQ 02-C 25.0 25.0
Primary Substation 3-Phase Fault Current Levels (kA)
Primary P.No. 33kV -Rated SC Capacity
11kV -Rated SC Capacity
2019 2020 2021 2022
Information City 1-A 25.0 20.0
Lulai-A
Lulai-B
MSQ 02-A
MSQ 02-B
MSQ 02-C
Qurum 1-A
Qurum 1-B
Qurum 2-A
Qurum 2-B
Rabiat Al Qurum-A
Rabiat Al Qurum-B
Sarooj 4-A
Sarooj 4-B
Sarooj 4-C
Primary Substations Bus Voltages
Primary P.No.
2019 2020 2021 2022
33kV (%) 11kV(%) 33kV (%) 11kV(%) 33kV (%) 11kV(%) 33kV (%) 11kV(%)
Information City 1-A
Information City 1-B
MEDC Distribution System Capability Statement [2020-2022]-V1.0 86

MW MVAr MVA % MW MVAr MVA % MW MVAr MVA % MW MVAr MVA %
Al Khuwair 17/1 P050 20 15.8 6.0 16.9 85% 16.8 5.5 17.7 88% 17.9 5.9 18.9 94% 19.1 6.3 20.1 101%
Al Khuwair South P052 40 37.6 12.4 39.6 99% 40.0 13.1 42.1 105% 36.3 11.9 38.2 95% 38.7 12.7 40.7 102%
Azaibah South 1-B P147 40 37.2 13.5 39.6 99% Shifted to Ghala Heights GSS
Bousher Grid GP02 20 17.2 5.0 17.9 90% 18.3 5.3 19.1 95% 20.0 5.8 20.8 104% 21.2 6.1 22.1 111%
Royal Hospital P024 40 21.8 3.2 22.0 55% Shifted to Ghala Heights GSS
MW MVAr MVA % MW MVAr MVA % MW MVAr MVA % MW MVAr MVA %
Al Khuwair 17/1 P050 20 3.2 0.0 3.2 16% 3.4 0.0 3.4 17% 3.6 0.0 3.6 18% 3.8 0.0 3.8 19%
Al Khuwair South P052 40 7.1 3.7 8.0 20% 7.6 3.9 8.5 21% 6.8 3.6 7.7 19% 7.3 3.8 8.2 21%
Azaibah South 1-B P147 40 4.8 2.5 5.4 14% Shifted to Ghala Heights GSS
Bousher Grid GP02 20 4.7 2.0 5.1 26% 5.0 2.1 5.4 27% 5.5 2.3 5.9 30% 5.8 2.4 6.3 31%
Royal Hospital P024 40 5.8 0.0 5.8 15% Shifted to Ghala Heights GSS
22.0
22.0
22.0
22.0
22.0
22.0
22.0
22.0
22.0
22.0
22.0
22.0
22.0
Max Min Max Min Max Min Max Min Max Min Max Min Max Min Max Min
P050 100.3 100.7 102.5 105.2 100.8 100.7 103.2 105.2 100.7 100.7 103.1 105.2 100.5 100.7 102.7 105.2
P050 100.3 100.7 102.5 105.2 100.7 100.7 103.2 105.2 100.7 100.7 103.1 105.2 100.5 100.7 102.7 105.2
P052 100.3 100.7 102.4 104.6 100.8 100.7 102.4 104.5 100.8 100.7 102.8 104.6 100.6 100.7 102.3 104.5
P052 100.3 100.7 102.4 104.6 100.8 100.7 102.4 104.5 100.8 100.7 102.8 104.6 100.6 100.7 102.3 104.5
P052 100.3 100.7 101.6 104.4 100.8 100.7 102.5 104.5 100.8 100.7 102.8 104.6 100.6 100.7 102.4 104.5
P147 99.6 100.6 100.0 104.5 - - - - - - - - - - - -
P147 99.6 100.6 100.0 104.5 - - - - - - - - - - - -
P147 99.9 100.6 101.8 104.8 - - - - - - - - - - - -
GP02 100.5 100.7 103.1 104.6 101.0 100.7 103.5 104.5 101.0 100.7 103.1 104.5 100.8 100.7 102.7 104.4
GP02 100.5 100.7 103.1 104.6 101.0 100.7 103.5 104.5 101.0 100.7 103.1 104.5 100.8 100.7 102.7 104.4
P024 100.3 100.7 103.9 105.2 - - - - - - - - - - - -
P024 100.3 100.7 103.9 105.2 - - - - - - - - - - - -
P024 100.3 100.7 - - - - - - - - - - - - - -
Primary Substations Minimum Demand and Percentage Loading
Primary Substation P.No.Firm
Capacity(MVA)
2019 2020 2021 2022
%Loading
33kV Feeder Maximum Loads
Bousher[GP02] - A GSS [Zone 2] - System Study ResultsPrimary Substations Maximum Demand and Percentage Loading
Primary Substation P.No.Firm
Capacity(MVA)
2019 2020 2021 2022
59.3 13.9 63.3
Al Khuwair South-F2-P052 12.4 56.5 14.4 65.4 13.0 59.2 13.9 63.2
Al Khuwair 17/1-F1-P050 8.6 38.9 8.9 40.5 9.5 43.3 10.2 46.3
Primary Rating(MVA)
2019 2020 2021 2022
MVA %Loading MVA %Loading MVA %Loading MVA
Azaiba South 1B-F2-P147 15.3 69.5 - - - - - -
Azaiba South 1B-F1-P147 15.2 69.0 - - - - - -
Al Khuwair South-F1-P052 12.5 56.8 14.5 65.7 13.1 59.5 14.0 63.5
Al Khuwair 17/1-F2-P050 8.7 39.4 9.0 41.0 9.6 43.8 10.3 46.8
Al Khuwair South-F3-P052 15.9 72.2 14.4 65.6 13.0
Bousher G-F1-GP02 9.2 41.7 9.8 44.4 10.8 49.1 11.5 52.2
Azaiba South 1B-F3-P147 10.3 46.8 - - - - - -
Royal Hospital-F1-P024 7.3 33.2 - - - - - -
Bousher G-F2-GP02 9.1 41.4 9.7 44.2 10.7 48.8 11.4 51.9
Royal Hospital-F3-P024 7.4 33.8 - - - - - -
Royal Hospital-F2-P024 7.4 33.7 - - - - - -
Al Khuwair 17/1-A
Al Khuwair 17/1-B
Al Khuwair South-A
Al Khuwair South-B
Al Khuwair South-C
Azaiba South 1B-A
Azaiba South 1B-B
Azaiba South 1B-C
Bousher G-A
Primary Substations Bus Voltages
Primary P.No.
2019 2020 2021 2022
33kV (%) 11kV(%) 33kV (%) 11kV(%) 33kV (%) 11kV(%) 33kV (%) 11kV(%)
Bousher G-B
Royal Hospital-A
Royal Hospital-B
Royal Hospital-C
MEDC Distribution System Capability Statement [2020-2022]-V1.0 87

33kV 11kV 33kV 11kV 33kV 11kV 33kV 11kV
P050 18.1 14.6 17.4 14.5 17.4 14.6 17.1 14.6
P050 18.1 14.6 17.4 14.5 17.4 14.6 17.1 14.6
P052 21.1 17.1 20.2 17.2 20.2 17.0 19.8 17.0
P052 21.1 17.1 20.2 17.2 20.2 17.0 19.8 17.0
P052 21.2 9.9 20.3 9.7 20.3 9.6 19.8 9.7
P147 14.2 14.8 - - - - - -
P147 14.2 14.8 - - - - - -
P147 13.9 7.8 - - - - - -
GP02 24.7 15.2 23.4 15.2 23.4 15.3 22.9 15.3
GP02 24.7 15.2 23.4 15.2 23.4 15.3 22.9 15.3
P024 16.6 13.7 - - - - - -
P024 16.6 8.0 - - - - - -
P024 16.7 - - - - - - -
Al Khuwair 17/1-A 25.0 18.4
Al Khuwair 17/1-B 25.0 18.4
Al Khuwair South-A 25.0 25.0
Primary Substation 3-Phase Fault Current Levels (kA)
Primary P.No. 33kV -Rated SC Capacity
11kV -Rated SC Capacity
2019 2020 2021 2022
Azaiba South 1B-B 25.0 25.0
Azaiba South 1B-C 25.0 25.0
Bousher G-A 25.0 20.0
Al Khuwair South-B 25.0 25.0
Al Khuwair South-C 25.0 25.0
Azaiba South 1B-A 25.0 25.0
Royal Hospital-C 25.0 -
Bousher G-B 25.0 20.0
Royal Hospital-A 25.0 20.0
Royal Hospital-B 25.0 20.0
MEDC Distribution System Capability Statement [2020-2022]-V1.0 88

MW MVAr MVA % MW MVAr MVA % MW MVAr MVA % MW MVAr MVA %
Al Ansab 1 P007 20 21.0 8.5 22.7 114% Shifted to Ghala Heights GSS
Al Muna P084 20 17.4 6.3 18.5 93% 18.5 6.1 19.5 97% 20.2 6.6 21.3 106% 21.5 7.1 22.6 113%
Azaibah North 1 P011 20 20.5 8.9 22.3 112% 18.2 6.0 19.2 96% 19.1 6.3 20.1 101% 19.6 6.4 20.6 103%
Bousher 2 P163 40 21.0 5.9 21.8 55% 22.4 6.2 23.2 58% 24.4 6.8 25.3 63% 25.9 7.2 26.9 67%
Ghubrah South 1 P026 40 31.2 13.4 34.0 85% Shifted to Ghala Heights GSS
Holiday Inn P051 40 30.3 9.4 31.7 79% 32.2 9.9 33.7 84% 34.4 10.6 36.0 90% 36.7 11.3 38.4 96%
Tilal Al Khuwair P055 40 29.6 12.7 32.2 81% 31.5 10.4 33.2 83% 33.6 11.0 35.4 88% 35.8 11.8 37.7 94%
MW MVAr MVA % MW MVAr MVA % MW MVAr MVA % MW MVAr MVA %
Al Ansab 1 P007 20 2.4 1.0 2.6 13% Shifted to Ghala Heights GSS
Al Muna P084 20 6.6 2.3 7.0 35% 7.0 2.5 7.4 37% 7.6 2.7 8.1 40% 8.1 2.9 8.6 43%
Azaibah North 1 P011 20 3.7 2.0 4.2 21% 3.2 1.7 3.6 18% 3.3 1.8 3.8 19% 3.4 1.8 3.9 19%
Bousher 2 P163 40 2.6 0.8 2.7 7% 2.6 0.8 2.7 7% 2.6 0.8 2.7 7% 2.6 0.8 2.7 7%
Ghubrah South 1 P026 40 5.8 3.4 6.7 17% Shifted to Ghala Heights GSS
Holiday Inn P051 40 6.8 2.4 7.2 18% 7.2 2.5 7.7 19% 7.7 2.7 8.2 20% 8.2 2.9 8.7 22%
Tilal Al Khuwair P055 40 8.6 3.3 9.2 23% 8.9 3.4 9.5 24% 9.4 3.6 10.1 25% 10.1 3.8 10.8 27%
22.0
22.0
22.0
22.0
22.0
22.0
22.0
22.0
22.0
22.0
22.0
22.0
22.0
22.0
22.0
22.0
22.0
22.0
Bousher[GP02] - B GSS [Zone 2] - System Study ResultsPrimary Substations Maximum Demand and Percentage Loading
Primary Substation P.No.Firm
Capacity(MVA)
2019 2020 2021 2022
Primary Rating(MVA)
2019 2020 2021 2022
MVA %Loading MVA %Loading MVA %Loading MVA %Loading
Primary Substations Minimum Demand and Percentage Loading
Primary Substation P.No.Firm
Capacity(MVA)
2019 2020 2021 2022
33kV Feeder Maximum Loads
Al Ansab 1-F2-P007 11.5 52.3 - - - - - -
Al Ansab 1-F1-P007 11.4 51.6 - - - - - -
Al Muna 1-F2-P084 9.3 42.1 9.8 44.5 10.7 48.8 11.4 52.0
Al Muna 1-F1-P084 9.5 43.0 10.0 45.4 10.9 49.7 11.6 52.9
Azaiba North 1-F2-P011 11.4 51.8 9.7 44.0 10.2 46.3 10.5 47.6
Azaiba North 1-F1-P011 11.4 51.8 9.7 44.0 10.2 46.3 10.5 47.5
Bousher 02-F2-P163 7.4 33.6 7.9 35.9 8.6 39.2 9.2 41.7
Bousher 02-F1-P163 7.4 33.6 7.9 35.9 8.6 39.2 9.2 41.7
Ghubrah South 1-F1-P026 10.7 48.6 - - - - - -
Bousher 02-F3-P163 7.4 33.6 7.9 35.9 8.6 39.2 9.2 41.7
Ghubrah South 1-F3-P026 13.3 60.4 - - - - - -
Ghubrah South 1-F2-P026 10.6 48.2 - - - - - -
56.6 13.3 60.5
Holiday Inn-F2-P051 9.7 44.1 11.4 51.7 12.3 55.8 13.1 59.7
Holiday Inn-F1-P051 9.8 44.7 11.5 52.4 12.4
13.8 62.7 11.3 51.5 12.1 55.0 12.9 58.8
56.2 13.2 60.1
Tilal Al Khuwair-F1-P055 9.8 44.8 11.5 52.4 12.3 56.0 13.1 59.8
Holiday Inn-F3-P051 12.8 58.4 11.5 52.1 12.4
Tilal Al Khuwair-F2-P055 9.5 43.2 11.1 50.6 11.9 54.0 12.7 57.7
Tilal Al Khuwair-F3-P055
MEDC Distribution System Capability Statement [2020-2022]-V1.0 89

Max Min Max Min Max Min Max Min Max Min Max Min Max Min Max Min
P007 100.5 100.1 101.9 104.3 - - - - - - - - - - - -
P007 100.5 100.1 101.9 104.3 - - - - - - - - - - - -
P084 100.9 100.1 103.1 103.7 99.7 100.2 101.8 103.8 100.5 100.1 102.4 103.7 100.1 100.1 101.7 103.5
P084 100.9 100.1 103.1 103.7 99.8 100.2 101.8 103.8 100.5 100.1 102.4 103.7 100.1 100.1 101.7 103.5
P011 100.7 100.1 102.1 104.0 99.7 100.3 101.9 104.3 100.4 100.2 102.6 104.2 100.0 100.1 102.1 104.1
P011 100.7 100.1 102.1 104.0 99.7 100.3 101.9 104.3 100.4 100.2 102.6 104.2 100.0 100.1 102.1 104.1
P163 101.3 100.2 104.3 104.5 100.1 100.4 102.9 104.7 100.8 100.3 103.6 104.6 100.5 100.2 103.0 104.6
P163 101.3 100.2 104.3 104.5 100.1 100.4 102.9 104.7 100.8 100.3 103.6 104.6 100.5 100.2 103.0 104.6
P163 101.3 100.2 104.3 104.5 100.1 100.4 102.9 104.7 100.8 100.3 103.6 104.6 100.5 100.2 103.0 104.6
P026 101.0 100.1 103.0 104.1 - - - - - - - - - - - -
P026 101.0 100.1 103.0 104.1 - - - - - - - - - - - -
P026 100.9 100.1 102.2 103.9 - - - - - - - - - - - -
P051 101.2 100.2 103.6 104.2 100.0 100.3 101.9 104.2 100.7 100.3 102.3 104.1 100.3 100.2 101.7 104.0
P051 101.2 100.2 103.6 104.2 100.0 100.3 101.9 104.2 100.7 100.3 102.3 104.1 100.3 100.2 101.7 104.0
P051 101.1 100.2 102.8 104.0 100.0 100.3 101.9 104.2 100.7 100.3 102.3 104.1 100.3 100.2 101.6 104.0
P055 101.2 100.2 103.1 104.0 100.0 100.3 101.8 104.1 100.8 100.3 102.5 103.9 100.4 100.2 101.8 103.8
P055 101.2 100.2 103.1 104.0 100.0 100.3 101.8 104.1 100.8 100.3 102.5 103.9 100.4 100.2 101.8 103.8
P055 101.1 100.1 101.7 103.7 100.0 100.3 101.8 104.0 100.8 100.3 102.4 103.9 100.4 100.2 101.7 103.8
33kV 11kV 33kV 11kV 33kV 11kV 33kV 11kV
P007 12.4 14.2 - - - - - -
P007 12.4 14.2 - - - - - -
P084 15.8 14.2 15.4 14.1 15.5 14.3 15.3 14.3
P084 15.8 14.2 15.4 14.1 15.5 14.3 15.3 14.3
P011 14.9 14.7 14.5 14.3 14.6 14.4 14.4 14.4
P011 14.9 14.7 14.5 14.3 14.6 14.4 14.4 14.4
P163 22.5 14.8 21.5 14.7 21.7 14.9 21.3 14.9
P163 22.4 14.8 21.5 14.7 21.7 14.9 21.3 14.9
P163 22.4 8.2 21.4 8.2 21.6 8.3 21.3 8.3
P026 17.7 16.5 - - - - - -
P026 17.8 16.5 - - - - - -
P026 17.6 9.4 - - - - - -
P051 20.8 14.7 20.0 14.8 20.2 15.0 19.9 15.0
P051 20.6 14.7 19.8 14.8 20.0 15.0 19.7 15.0
P051 20.8 8.3 20.0 8.1 20.1 8.2 19.8 8.2
P055 21.6 15.0 20.7 15.1 20.9 15.2 20.6 15.3
P055 21.6 15.0 20.7 15.1 20.9 15.2 20.5 15.3
P055 21.6 8.5 20.7 8.2 20.9 8.3 20.5 8.3
Primary Substations Bus Voltages
Primary P.No.
2019 2020 2021 2022
33kV (%) 11kV(%) 33kV (%) 11kV(%) 33kV (%) 11kV(%) 33kV (%) 11kV(%)
Bousher 02-B
Bousher 02-C
Ghubrah South 1-A
25.0 20.0
Al Ansab 1-A
Holiday Inn-A 25.0 20.0
Tilal Al Khuwair-A 25.0 25.0
Tilal Al Khuwair-B 25.0 25.0
Ghubrah South 1-A 25.0 18.4
Ghubrah South 1-B 25.0 18.4
Al Muna 1-A 25.0 20.0
Ghubrah South 1-C 25.0 18.4
Al Ansab 1-A
Al Ansab 1-B
Al Muna 1-A
Al Muna 1-B
Azaiba North 1-A
Azaiba North 1-B
Bousher 02-A
Ghubrah South 1-C
Holiday Inn-A
Ghubrah South 1-B
25.0 20.0
Al Ansab 1-B 25.0 20.0
Holiday Inn-C
Tilal Al Khuwair-C
Primary Substation 3-Phase Fault Current Levels (kA)
Primary P.No. 33kV -Rated SC Capacity
11kV -Rated SC Capacity
2019 2020 2021 2022
Tilal Al Khuwair-A
Tilal Al Khuwair-B
Holiday Inn-B
Holiday Inn-B 25.0 20.0
Holiday Inn-C 25.0 20.0
Tilal Al Khuwair-C 25.0 25.0
Bousher 02-A 25.0 25.0
Bousher 02-B 25.0 25.0
Bousher 02-C 25.0 25.0
Al Muna 1-B 25.0 20.0
Azaiba North 1-A 25.0 20.0
Azaiba North 1-B
MEDC Distribution System Capability Statement [2020-2022]-V1.0 90

MW MVAr MVA % MW MVAr MVA % MW MVAr MVA % MW MVAr MVA %
Al Ansab 1 P007 20 - - - - 17.3 5.7 18.3 91% 18.4 6.0 19.3 97% 19.2 6.3 20.2 101%
Azaibah South 1-A P014 20 - - - - 16.5 5.4 17.4 87% 12.9 4.2 13.5 68% 13.2 4.3 13.9 69%
Azaibah South 1-B P147 40 - - - - 38.7 12.7 40.7 102% 28.3 9.3 29.8 74% 29.0 9.5 30.5 76%
Ghala 3 P189 40 - - - - - - - - 16.9 5.6 17.8 45% 17.3 5.7 18.3 46%
Ghubrah South 1 P026 40 - - - - 32.5 10.7 34.3 86% 33.7 11.1 35.5 89% 34.8 11.4 36.7 92%
Mall Of Oman P171 40 0.0 0.0 0.0 0.0 0.0 0.0 0.0 0.0 10.0 3.3 10.5 26% 10.0 3.3 10.5 26%
Royal Hospital P024 40 - - - - 22.7 7.5 23.9 0.0 23.5 7.7 24.8 62% 24.3 8.0 25.6 64%
MW MVAr MVA % MW MVAr MVA % MW MVAr MVA % MW MVAr MVA %
Al Ansab 1 P007 20 - - - - 1.9 0.8 2.1 0.0 2.0 0.9 2.2 11% 2.1 0.9 2.3 12%
Azaibah South 1-A P014 20 - - - - 1.2 0.9 1.5 0.0 0.9 0.7 1.1 6% 0.9 0.7 1.2 6%
Azaibah South 1-B P147 40 - - - - 4.9 2.5 5.6 0.0 3.6 1.9 4.1 10% 3.7 1.9 4.2 10%
Ghala 3 P189 40 - - - - - - - - 3.1 1.4 3.4 8% 3.2 1.4 3.5 9%
Ghubrah South 1 P026 40 - - - - 5.8 3.4 6.7 0.0 6.0 3.5 7.0 17% 6.3 3.6 7.2 18%
Mall Of Oman P171 40 - - - - 0.0 0.0 0.0 0.0 1.8 0.8 2.0 5% 1.8 0.8 2.0 5%
Royal Hospital P024 40 - - - - 6.3 0.0 6.3 0.0 6.5 0.0 6.5 16% 6.8 0.0 6.8 17%
22.0
22.0
22.0
22.0
22.0
22.0
22.0
22.0
22.0
22.0
22.0
22.0
22.0
22.0
22.0
22.0
22.0
22.0
22.0
Royal Hospital-F2-P024 - - 5.7 26.1 5.9 27.0 6.1 27.9
Royal Hospital-F3-P024 - - 5.8 26.1 6.0 27.1 6.2 28.0
Royal Hospital-F1-P024 - - 11.6 52.9 12.1 54.9 12.5 56.7
Mall of Oman-F1-P171 0.4 1.6 0.3 1.6 3.6 16.2 3.6 16.2
Mall of Oman-F2-P171 0.4 1.6 0.3 1.6 3.6 16.2 3.6 16.2
Ghubrah South 1-F5-P026 - - 11.6 52.8 12.0 54.7 12.5 56.6
Ghala 3-F3-P189 - - - - 6.0 27.2 6.1 27.9
Ghubrah South 1-F3-P026 - - 11.7 53.0 12.1 55.0 12.5 56.9
Mall of Oman-F3-P171 0.3 1.5 0.3 1.6 3.6 16.4 3.6 16.4
Ghala 3-F2-P189 - - - - 6.0 27.2 6.1 27.9
Azaiba South 1B-F2-P147 - - 14.0 63.8 10.1 46.0 10.4 47.1
Azaiba South 1B-F3-P147 - - 14.0 63.6 10.1 45.8 10.3 47.0
Ghubrah South 1-F4-P026 - - 11.6 52.5 12.0 54.5 12.4 56.4
- - 13.9 63.4 10.0 45.7 10.3 46.8
Al Ansab 1-F2-P007 - - 9.3 42.2 9.9 44.8 10.3 46.8
Azaiba South 1A-F1-P014 - - 8.8 40.1 6.8 31.0 7.0 31.7
Ghala 3-F1-P189 - - - - 6.0 27.2 6.1 27.9
10.2 46.2
Ghala Heights[G24] GSS [Zone 2] - System Study ResultsPrimary Substations Maximum Demand and Percentage Loading
Primary Substation P.No.Firm
Capacity(MVA)
2019 2020 2021 2022
Primary Substations Minimum Demand and Percentage Loading
Primary Substation P.No.Firm
Capacity(MVA)
2019 2020 2021 2022
Azaiba South 1A-F2-P014 - - 8.8 40.0 6.8 31.0 7.0 31.7
Azaiba South 1B-F1-P147
33kV Feeder Maximum Loads
Primary Rating(MVA)
2019 2020 2021 2022
MVA %Loading MVA %Loading MVA %Loading MVA %Loading
Al Ansab 1-F1-P007 - - 9.2 41.6 9.7 44.3
MEDC Distribution System Capability Statement [2020-2022]-V1.0 91

Max Min Max Min Max Min Max Min Max Min Max Min Max Min Max Min
P007 - - - - 99.6 100.0 101.9 104.2 99.6 100.0 101.7 104.2 99.6 100.0 101.6 104.2
P007 - - - - 99.6 100.0 101.9 104.2 99.6 100.0 101.7 104.2 99.6 100.0 101.6 104.2
P014 - - - - 99.7 100.0 102.1 104.2 99.8 100.0 102.7 104.3 99.8 100.0 102.6 104.3
P014 - - - - 99.7 100.0 102.1 104.2 99.8 100.0 102.7 104.3 99.8 100.0 102.6 104.3
P147 - - - - 99.6 99.9 100.6 103.9 99.7 100.0 101.7 104.1 99.7 100.0 101.7 104.1
P147 - - - - 99.6 99.9 100.6 103.9 99.7 100.0 101.7 104.1 99.7 100.0 101.7 104.1
P147 - - - - 99.6 99.9 100.6 103.9 99.7 100.0 101.8 104.1 99.7 100.0 101.7 104.1
P189 - - - - - - - - 99.9 100.0 103.0 104.2 99.9 100.0 103.0 104.2
P189 - - - - - - - - 99.9 100.0 103.0 104.2 99.9 100.0 103.0 104.2
P189 - - - - - - - - 99.9 100.0 103.0 104.2 99.9 100.0 103.0 104.2
P026 - - - - 99.6 99.9 101.7 103.8 99.6 99.9 101.6 103.8 99.6 99.9 101.5 103.8
P026 - - - - 99.6 99.9 101.7 103.8 99.6 99.9 101.6 103.8 99.6 99.9 101.5 103.8
P026 - - - - 99.6 99.9 101.7 103.8 99.6 99.9 101.6 103.8 99.6 99.9 101.5 103.8
P171 100.0 - 104.6 - 100.0 100.0 104.6 104.6 99.9 100.0 103.3 104.3 99.9 100.0 103.3 104.3
P171 100.0 - 104.6 - 100.0 100.0 104.6 104.6 99.9 100.0 103.3 104.3 99.9 100.0 103.3 104.3
P171 100.0 - 104.6 - 100.0 100.0 104.5 104.5 99.9 100.0 103.3 104.3 99.9 100.0 103.3 104.3
P024 - - - - 99.6 99.9 102.4 104.4 99.6 99.9 102.3 104.3 99.5 99.9 102.3 104.3
P024 - - - - 99.8 100.0 103.6 104.5 99.8 100.0 103.6 104.5 99.8 100.0 103.5 104.5
P024 - - - - 99.8 100.0 - - 99.8 100.0 - - 99.8 100.0 - -
33kV 11kV 33kV 11kV 33kV 11kV 33kV 11kV
P007 - - 14.9 14.2 15.0 14.3 14.8 14.3
P007 - - 15.0 14.2 15.0 14.3 14.8 14.3
P014 - - 16.8 14.1 16.9 13.9 16.6 13.8
P014 - - 16.8 14.1 16.9 13.9 16.6 13.8
P147 - - 16.9 15.0 16.9 14.4 16.7 14.4
P147 - - 16.9 15.0 16.9 14.4 16.7 14.4
P147 - - 16.8 8.3 16.8 8.0 16.6 8.0
P189 - - - - 20.4 13.9 20.0 13.9
P189 - - - - 20.4 13.9 20.0 13.9
P189 - - - - 20.4 7.7 20.0 7.7
P026 - - 16.2 16.3 16.3 16.4 16.1 16.4
P026 - - 16.2 16.3 16.3 16.4 16.1 16.4
P026 - - 16.1 9.1 16.2 9.2 15.9 9.2
P171 14.2 12.4 14.3 12.5 15.1 19.4 14.7 19.3
P171 14.2 12.4 14.4 12.5 15.0 19.4 14.7 19.3
P171 14.1 7.0 14.4 7.0 15.0 19.1 14.7 19.0
P024 - - 14.9 7.8 15.0 7.9 14.8 7.9
P024 - - 15.0 13.5 15.1 13.5 14.9 13.5
P024 - - 15.0 - 15.1 - 14.9 -
Ghala 3-C
Mall of Oman-B 25.0 25.0
Azaiba South 1A-B 25.0 18.4
Azaiba South 1B-A 25.0 25.0
Azaiba South 1B-B 25.0 25.0
Azaiba South 1B-C 25.0 25.0
Ghala 3-A 25.0 25.0
Ghala 3-B 25.0 25.0
Mall of Oman-C 25.0 25.0
Royal Hospital-A 25.0 20.0
Royal Hospital-B 25.0 20.0
Royal Hospital-C 25.0 -
Azaiba South 1A-A 25.0 18.4
Azaiba South 1A-A
Azaiba South 1A-B
Azaiba South 1B-A
Azaiba South 1B-B
Azaiba South 1B-C
Ghala 3-A
Ghala 3-B
Ghala 3-C
Ghubrah South 1-A
Ghubrah South 1-B
Ghubrah South 1-C
Mall of Oman-A
Mall of Oman-B
Mall of Oman-C
Royal Hospital-A
Royal Hospital-B
Royal Hospital-C
25.0 25.0
Ghubrah South 1-A 25.0 18.4
Ghubrah South 1-B 25.0 18.4
Ghubrah South 1-C 25.0 18.4
Mall of Oman-A 25.0 25.0
Al Ansab 1-A
Al Ansab 1-B
Primary Substation 3-Phase Fault Current Levels (kA)
Primary P.No. 33kV -Rated SC Capacity
11kV -Rated SC Capacity
2019 2020 2021 2022
Al Ansab 1-A 25.0 20.0
Al Ansab 1-B 25.0 20.0
Primary Substations Bus Voltages
Primary P.No.
2019 2020 2021 2022
33kV (%) 11kV(%) 33kV (%) 11kV(%) 33kV (%) 11kV(%) 33kV (%) 11kV(%)
MEDC Distribution System Capability Statement [2020-2022]-V1.0 92

MW MVAr MVA % MW MVAr MVA % MW MVAr MVA % MW MVAr MVA %
Al Ansab 2 P008 20 18.6 2.4 18.8 94% Shifted to Ghala-B GSS
Al Ansab STP P009 20 8.3 3.3 8.9 45% 8.3 3.3 8.9 45% 8.3 3.3 8.9 45% 8.3 3.3 8.9 45%
Ghala 1 P015 20 15.0 5.9 16.1 81% - - - - - - - - - - - -
Ghala 1(Upgrade) P015 40 - - - - 26.6 8.7 28.0 70% 28.0 9.2 29.4 74% 28.6 9.4 30.2 75%
Ghala 2 P156 40 32.6 15.0 35.9 90% Shifted to Ghala-B GSS
MOD Al Ansab P167 10 9.2 3.7 9.9 99% 9.2 3.7 9.9 99% 9.2 3.7 9.9 99% 9.2 3.7 9.9 99%
Oman Exhibition P165 40 12.4 2.7 12.7 32% 19.4 4.3 19.9 50% 19.4 4.3 19.9 50% 19.4 4.3 19.9 50%
ROP Hospital P172 40 - - - - 10.0 3.3 10.5 26% 30.0 9.9 31.6 79% 30.0 9.9 31.6 79%
MW MVAr MVA % MW MVAr MVA % MW MVAr MVA % MW MVAr MVA %
Al Ansab 2 P008 20 3.3 0.0 3.3 17% Shifted to Ghala-B GSS
Al Ansab STP P009 20 1.5 0.7 1.7 9% 1.5 0.7 1.7 9% 1.5 0.7 1.7 9% 1.5 0.7 1.7 9%
Ghala 1 P015 20 2.7 1.3 3.0 15% - - - - - - - - - - - -
Ghala 1(Upgrade) P015 40 - - - - 4.7 2.3 5.2 13% 4.9 2.4 5.5 14% 5.0 2.4 5.6 14%
Ghala 2 P156 40 5.1 3.3 6.1 15% Shifted to Ghala-B GSS
MOD Al Ansab P167 10 1.7 0.8 1.9 19% 1.7 0.8 1.9 19% 1.7 0.8 1.9 19% 1.7 0.8 1.9 19%
Oman Exhibition P165 40 1.7 0.8 1.9 5% 2.6 1.2 2.9 7% 2.6 1.2 2.9 7% 2.6 1.2 2.9 7%
ROP Hospital P172 40 - - - - 1.8 0.8 2.0 5% 5.5 2.5 6.0 15% 5.5 2.5 6.0 15%
22.0
22.0
22.0
22.0
22.0
22.0
22.0
22.0
22.0
22.0
22.0
22.0
22.0
22.0
22.0
22.0
22.0
22.0
Ghala[G11] - A GSS [Zone 2] - System Study ResultsPrimary Substations Maximum Demand and Percentage Loading
Primary Substation P.No.Firm
Capacity(MVA)
2019 2020 2021 2022
Ansab 2-F2-P008 9.5 43.0 - - - - - -
Ansab STP-F1-P009 4.5 20.3 4.5 20.3 4.5 20.3 4.5 20.3
Ansab STP-F2-P009 4.5 20.3 4.5 20.2 4.5 20.3 4.5 20.3
Ghala 1-F1-P015 7.8 35.5 9.3 42.3 9.8 44.7 10.1 45.9
Primary Substations Minimum Demand and Percentage Loading
Primary Substation P.No.Firm
Capacity(MVA)
2019 2020 2021 2022
33kV Feeder Maximum Loads
Primary Rating(MVA)
2019 2020 2021 2022
MVA %Loading MVA %Loading MVA %Loading MVA %Loading
Ansab 2-F1-P008 9.4 42.8 - - - - -
Ghala 1-F2-P015 7.8 35.5 9.3 42.4 9.9 44.8 10.1 46.0
Ghala 1-F3-P015 - - 9.3 42.4 9.8 44.8 10.1 45.9
-
Ghala 2-F1-P156 11.9 54.2 - - - - - -
Ghala 2-F2-P156 11.9 54.3 - - - - - -
Ghala 2-F3-P156 11.0 50.0 - - - - - -
MOD Lansab-F1-P167 4.9 22.0 4.8 22.0 4.8 22.0 4.8 22.0
MOD Lansab-F2-P167 4.9 22.3 4.9 22.3 4.9 22.3 4.9 22.3
Oman Exhibition-F1-P165 6.0 27.5 6.7 30.3 6.7 30.3 6.7 30.3
Oman Exhibition-F2-P165 0.0 0.0 6.7 30.3 6.7 30.3 6.7 30.3
Oman Exhibition-F3-P165 6.8 30.7 6.7 30.3 6.7 30.3 6.7 30.3
ROP Hospital-F3-P172 - - 3.4 15.7 10.7 48.7 10.7 48.7
ROP Hospital-F1-P172 - - 3.4 15.7 10.7 48.7 10.7 48.7
ROP Hospital-F2-P172 - - 3.4 15.7 10.7 48.7 10.7 48.7
MEDC Distribution System Capability Statement [2020-2022]-V1.0 93

Max Min Max Min Max Min Max Min Max Min Max Min Max Min Max Min
P008 100.1 101.0 103.4 105.6 - - - - - - - - - - - -
P008 100.1 101.0 103.4 105.6 - - - - - - - - - - - -
P009 100.5 101.0 103.9 105.4 101.1 101.0 104.6 105.4 100.3 100.9 103.7 105.2 100.3 100.9 103.7 105.2
P009 100.5 101.0 103.9 105.4 101.1 101.0 104.6 105.4 100.3 100.9 103.7 105.2 100.3 100.9 103.7 105.2
P015 99.9 101.0 102.2 105.1 100.4 100.9 102.7 105.0 99.6 100.8 101.6 104.8 99.5 100.8 101.5 104.8
P015 99.9 101.0 102.2 105.1 100.4 100.9 102.7 105.0 99.6 100.8 101.6 104.8 99.5 100.8 101.5 104.8
P015 - - - - 100.4 100.9 102.7 105.0 99.6 100.8 101.6 104.8 99.5 100.8 101.5 104.8
P156 99.8 100.9 101.4 104.8 - - - - - - - - - - - -
P156 99.8 100.9 101.4 104.8 - - - - - - - - - - - -
P156 99.9 100.9 101.7 104.8 - - - - - - - - - - - -
P167 100.3 101.0 103.1 105.3 101.0 101.0 103.8 105.3 100.1 100.9 102.9 105.1 100.1 100.9 102.9 105.1
P167 100.3 101.0 103.1 105.3 101.0 101.0 103.8 105.3 100.1 100.9 102.9 105.1 100.1 100.9 102.9 105.1
P165 0.0 101.1 104.1 105.5 101.2 101.1 104.7 105.4 100.4 100.9 103.9 105.2 100.4 100.9 103.8 105.2
P165 100.6 101.1 104.1 105.5 101.2 101.1 104.7 105.4 100.4 100.9 103.9 105.2 100.4 100.9 103.8 105.2
P165 100.6 101.1 104.0 105.4 101.2 101.1 104.7 105.4 100.4 100.9 103.9 105.2 100.4 100.9 103.8 105.2
P172 - - - - 101.1 101.0 104.9 105.4 100.0 100.8 101.9 104.8 100.0 100.8 101.9 104.8
P172 - - - - 101.1 101.0 104.9 105.4 100.0 100.8 101.9 104.8 100.0 100.8 101.9 104.8
P172 - - - - 101.1 101.0 104.9 105.4 100.0 100.8 101.9 104.8 100.0 100.8 101.9 104.8
33kV 11kV 33kV 11kV 33kV 11kV 33kV 11kV
P008 12.5 13.4 - - - - - -
P008 12.5 13.4 - - - - - -
P009 16.9 13.6 17.0 13.6 17.3 13.7 18.4 13.9
P009 16.9 13.6 17.0 13.6 17.3 13.7 18.4 13.9
P015 10.5 12.7 10.5 12.9 10.7 13.1 11.1 13.3
P015 10.5 12.7 10.5 12.9 10.7 13.1 11.1 13.3
P015 - - 10.2 7.1 10.3 7.2 10.7 7.3
P156 11.9 13.9 - - - - - -
P156 11.9 13.9 - - - - - -
P156 11.6 7.6 - - - - - -
P167 12.6 11.0 12.6 11.0 12.8 11.0 13.4 11.2
P167 12.9 11.0 12.9 11.0 13.1 11.0 13.7 11.2
P165 0.0 7.9 20.6 14.2 21.2 14.2 22.9 14.5
P165 20.6 7.9 20.6 14.2 21.2 14.2 22.9 14.5
P165 20.6 8.0 20.6 8.0 21.2 8.0 22.9 8.1
P172 - - 14.9 12.8 15.3 14.0 16.1 14.2
P172 - - 14.9 12.8 15.3 14.0 16.1 14.2
P172 - - 14.8 7.2 15.2 7.8 16.0 7.8
Primary Substations Bus Voltages
Primary P.No.
2019 2020 2021 2022
33kV (%) 11kV(%) 33kV (%) 11kV(%) 33kV (%) 11kV(%) 33kV (%) 11kV(%)
Ansab 2-A
Ansab 2-B
Primary Substation 3-Phase Fault Current Levels (kA)
Primary P.No. 33kV -Rated SC Capacity
11kV -Rated SC Capacity
2019 2020 2021 2022
Ansab 2-A 25.0 20.0
Ansab STP-A
Ansab STP-B
Ghala 1-A
Ghala 1-B
Ghala 1-C
Ghala 2-A
Ghala 2-B
Ghala 2-C
MOD Lansab-A
MOD Lansab-B
Oman Exhibition-A
Oman Exhibition-B
Oman Exhibition-C
ROP Hospital-A
ROP Hospital-B
ROP Hospital-C
25.0
Ansab 2-B 25.0 20.0
Ansab STP-A 25.0 18.4
Ansab STP-B 25.0 18.4
Ghala 1-A 25.0 20.0
Ghala 1-B 25.0 20.0
Ghala 1-C 25.0 25.0
Oman Exhibition-B 25.0 25.0
Oman Exhibition-C 25.0 25.0
ROP Hospital-A 25.0 25.0
ROP Hospital-B 25.0 25.0
ROP Hospital-C 25.0 25.0
Ghala 2-A 25.0 25.0
Ghala 2-B 25.0 25.0
Ghala 2-C 25.0 25.0
MOD Lansab-A 25.0 25.0
MOD Lansab-B 25.0 25.0
Oman Exhibition-A 25.0
MEDC Distribution System Capability Statement [2020-2022]-V1.0 94

MW MVAr MVA % MW MVAr MVA % MW MVAr MVA % MW MVAr MVA %
Al Ansab 2 P008 20 - - - - 19.9 6.5 21.0 105% 21.1 6.9 22.2 111% 22.0 7.2 23.1 116%
Ghala 2 P156 40 - - - - 34.9 11.5 36.8 92% 37.0 12.1 38.9 97% 38.5 12.7 40.6 101%
MW MVAr MVA % MW MVAr MVA % MW MVAr MVA % MW MVAr MVA %
Al Ansab 2 P008 20 - - - - 3.7 0.0 3.7 18% 3.9 0.0 3.9 19% 4.1 0.0 4.1 20%
Ghala 2 P156 40 - - - - 5.2 3.4 6.2 16% 5.5 3.6 6.6 17% 5.8 3.8 6.9 17%
22.0
22.0
22.0
22.0
22.0
Max Min Max Min Max Min Max Min Max Min Max Min Max Min Max Min
P008 - - - - 100.5 101.0 103.7 105.6 100.4 101.0 103.4 105.5 100.3 101.0 103.2 105.5
P008 - - - - 100.5 101.0 103.7 105.6 100.4 101.0 103.4 105.5 100.3 101.0 103.2 105.5
P156 - - - - 100.2 101.0 101.7 104.8 100.0 100.9 101.3 104.7 99.9 100.9 101.0 104.7
P156 - - - - 100.2 101.0 101.7 104.8 100.0 100.9 101.3 104.7 99.9 100.9 101.0 104.7
P156 - - - - 100.2 101.0 101.7 104.8 100.0 100.9 101.3 104.7 99.9 100.9 101.0 104.7
33kV 11kV 33kV 11kV 33kV 11kV 33kV 11kV
P008 - - 12.4 13.4 12.4 13.5 13.0 13.8
P008 - - 12.4 13.4 12.4 13.5 13.1 13.8
P156 - - 11.8 13.9 11.9 14.1 12.4 14.4
P156 - - 11.8 13.9 11.9 14.1 12.4 14.4
P156 - - 11.6 7.7 11.6 7.8 12.2 7.9
Ghala[G11] - B GSS [Zone 2] - System Study ResultsPrimary Substations Maximum Demand and Percentage Loading
Primary Substation P.No.Firm
Capacity(MVA)
2019 2020 2021 2022
Primary Substations Minimum Demand and Percentage Loading
Primary Substation P.No.Firm
Capacity(MVA)
2019 2020 2021 2022
33kV Feeder Maximum Loads
Primary Rating(MVA)
2019 2020 2021 2022
MVA %Loading MVA %Loading MVA %Loading MVA %Loading
Ansab 2-F1-P008 - - 10.1 46.0 10.7 48.8 11.2 51.0
Ansab 2-F2-P008 - - 10.2 46.3 10.8 49.1 11.3 51.3
Ghala 2-F1-P156 - - 12.5 56.7 13.2 60.2 13.9 63.0
Ghala 2-F2-P156 - - 12.5 56.8 13.3 60.2 13.9 63.0
Ghala 2-F3-P156 - - 12.5 56.7 13.2 60.2 13.9 63.0
25.0 25.0
Ansab 2-A
Ansab 2-B
Ghala 2-A
Ghala 2-B
Ghala 2-C
Primary Substations Bus Voltages
Primary P.No.
2019 2020 2021 2022
33kV (%) 11kV(%) 33kV (%) 11kV(%) 33kV (%) 11kV(%) 33kV (%) 11kV(%)
Ghala 2-B 25.0 25.0
Ghala 2-C 25.0 25.0
Primary Substation 3-Phase Fault Current Levels (kA)
Primary P.No. 33kV -Rated SC Capacity
11kV -Rated SC Capacity
2019 2020 2021 2022
Ansab 2-A 25.0 20.0
Ansab 2-B 25.0 20.0
Ghala 2-A
MEDC Distribution System Capability Statement [2020-2022]-V1.0 95

MW MVAr MVA % MW MVAr MVA % MW MVAr MVA % MW MVAr MVA %
Airport Height 1 P001 20 16.6 8.1 18.5 93% 17.2 5.6 18.1 90% 17.9 5.9 18.8 94% 18.7 6.2 19.7 99%
Airport Height 2 P002 20 13.6 4.6 14.4 72% 14.1 4.6 14.8 74% 14.6 4.8 15.4 77% 15.4 5.0 16.2 81%
Airport Height 3 P003 20 12.7 4.6 13.5 68% 13.1 4.3 13.8 69% 13.7 4.5 14.4 72% 14.3 4.7 15.1 75%
Airport Height 4 P004 20 6.6 2.2 7.0 35% 6.8 2.2 7.2 36% 7.1 2.3 7.5 37% 7.5 2.5 7.8 39%
Airport Height 5 P151 20 12.0 4.6 12.9 65% 15.4 5.1 16.2 81% 16.0 5.3 16.9 84% 16.8 5.5 17.7 89%
Azaibah North 3 P013 40 30.0 10.6 31.8 80% Shifted to Airport Heights-A GSS
MOD Technical College P081 20 8.2 2.8 8.7 44% 8.2 2.7 8.6 43% 8.2 2.7 8.6 43% 8.2 2.7 8.6 43%
ROP Hospital P172 1TX 2.2 0.9 2.4 - The temporary supply will be dismantled
MW MVAr MVA % MW MVAr MVA % MW MVAr MVA % MW MVAr MVA %
Airport Height 1 P001 20 2.3 1.9 3.0 15% 2.2 1.9 2.9 15% 2.3 2.0 3.0 15% 2.5 2.1 3.2 16%
Airport Height 2 P002 20 2.9 0.8 3.0 15% 3.0 0.8 3.1 15% 3.1 0.8 3.2 16% 3.3 0.9 3.4 17%
Airport Height 3 P003 20 2.7 0.0 2.7 14% 2.8 0.0 2.8 14% 2.9 0.0 2.9 14% 3.0 0.0 3.0 15%
Airport Height 4 P004 20 1.2 0.5 1.3 7% 1.2 0.5 1.3 7% 1.3 0.5 1.4 7% 1.3 0.6 1.5 7%
Airport Height 5 P151 20 2.0 0.0 2.0 10% 2.5 0.0 2.5 13% 2.6 0.0 2.6 13% 2.7 0.0 2.7 14%
Azaibah North 3 P013 40 6.7 0.0 6.7 17% Shifted to Airport Heights-A GSS
MOD Technical College P081 20 2.0 0.6 2.1 11% 2.0 0.6 2.1 10% 2.0 0.6 2.1 10% 2.0 0.6 2.1 10%
ROP Hospital P172 1TX 0.4 0.2 0.5 - The temporary supply will be dismantled
22.0
22.0
22.0
22.0
22.0
22.0
22.0
22.0
22.0
22.0
22.0
22.0
22.0
22.0
22.0
22.0
Airport Heights [G01] - A GSS [Zone 3] - System Study ResultsPrimary Substations Maximum Demand and Percentage Loading
Primary Substation P.No.Firm
Capacity(MVA)
2019 2020 2021 2022
Primary Substations Minimum Demand and Percentage Loading
Primary Substation P.No.Firm
Capacity(MVA)
2019 2020 2021 2022
33kV Feeder Maximum Loads
Primary Rating(MVA)
2019 2020 2021 2022
MVA %Loading MVA %Loading MVA %Loading MVA %Loading
Airport Height 1-F1-P001 9.4 42.5 9.1 41.6 9.5 43.3 10.0 45.6
Airport Height 1-F2-P001 9.4 42.6 9.1 41.6 9.5 43.4 10.0 45.6
Airport Height 2-F1-P002 7.3 33.3 7.5 34.2 7.8 35.6 8.2 37.5
Airport Height 2-F2-P002 7.2 32.7 7.4 33.6 7.7 35.0 8.1 36.8
Airport Height 3-F1-P003 6.8 31.0 7.0 31.8 7.3 33.1 7.7 34.8
Airport Height 3-F2-P003 6.7 30.3 6.8 31.1 7.1 32.4 7.5 34.1
Airport Height 4-F1-P004 3.5 16.0 3.6 16.5 3.8 17.2 4.0 18.1
Airport Height 4-F2-P004 3.4 15.5 3.5 15.9 3.7 16.6 3.8 17.5
Airport Height 5-F1-P151 6.4 29.1 8.2 37.1 8.5 38.7 9.0 40.7
Airport Height 5-F2-P151 6.4 29.0 8.1 37.0 8.5 38.5 8.9 40.5
Azaiba North 3-F1-P013 13.0 59.2 - - - - - -
Azaiba North 3-F2-P013 13.4 60.9 - - - - - -
-
Azaiba North 3-F3-P013 6.0 27.3 - - - - - -
MOD Technical College-F1-P081 4.4 19.8 4.3 19.7 4.3 19.7 4.3 19.7
MOD Technical College-F2-P081 4.4 19.9 4.3 19.8 4.3 19.8 4.3 19.8
ROP Hospital-F1-P172 2.4 10.8 - - - - -
MEDC Distribution System Capability Statement [2020-2022]-V1.0 96

Max Min Max Min Max Min Max Min Max Min Max Min Max Min Max Min
P001 100.0 100.0 101.5 103.9 100.2 99.9 102.5 103.8 100.0 99.9 102.2 103.8 99.9 99.9 101.9 103.7
P001 100.0 100.0 101.5 103.9 100.2 99.9 102.5 103.8 100.0 99.9 102.2 103.8 99.9 99.9 101.9 103.7
P002 100.1 100.1 102.7 104.3 100.3 99.9 103.0 104.2 100.1 99.9 102.8 104.1 100.0 99.9 102.5 104.1
P002 100.1 100.1 102.7 104.3 100.3 99.9 103.0 104.2 100.1 99.9 102.8 104.1 100.0 99.9 102.5 104.1
P003 100.1 100.1 102.9 104.6 100.2 99.9 103.2 104.4 100.1 99.9 103.0 104.4 99.9 99.9 102.7 104.4
P003 100.1 100.1 102.9 104.6 100.2 99.9 103.2 104.4 100.1 99.9 103.0 104.4 99.9 99.9 102.7 104.4
P004 100.3 100.1 104.0 104.5 100.4 99.9 104.1 104.3 100.3 99.9 104.0 104.3 100.2 99.9 103.8 104.2
P004 100.3 100.1 104.0 104.5 100.4 99.9 104.1 104.3 100.3 99.9 104.0 104.3 100.2 99.9 103.8 104.2
P151 100.0 100.1 102.7 104.6 100.1 99.9 102.6 104.4 100.0 99.9 102.4 104.4 99.8 99.9 102.1 104.4
P151 100.0 100.1 102.7 104.6 100.1 99.9 102.6 104.4 100.0 99.9 102.4 104.4 99.8 99.9 102.1 104.4
P013 99.3 100.0 100.2 104.4 - - - - - - - - - - - -
P013 99.3 100.0 100.2 104.4 - - - - - - - - - - - -
P013 99.9 100.1 102.9 104.6 - - - - - - - - - - - -
P081 100.3 100.1 103.8 104.4 100.4 99.9 104.0 104.2 100.3 99.9 103.9 104.2 100.2 99.9 103.7 104.2
P081 100.3 100.1 103.8 104.4 100.4 99.9 104.0 104.2 100.3 99.9 103.9 104.2 100.2 99.9 103.7 104.2
P172 100.3 100.1 103.7 104.4 - - - - - - - - - - - -
33kV 11kV 33kV 11kV 33kV 11kV 33kV 11kV
P001 15.0 13.8 14.9 13.8 14.9 13.8 15.8 14.1
P001 15.1 13.8 14.9 13.8 15.0 13.8 15.9 14.1
P002 15.6 13.3 15.5 13.3 15.5 13.4 16.5 13.7
P002 15.6 13.3 15.4 13.3 15.5 13.4 16.4 13.7
P003 14.4 13.7 14.2 13.7 14.3 13.7 15.1 14.0
P003 14.3 13.7 14.2 13.7 14.2 13.7 15.0 14.0
P004 17.0 13.2 16.8 13.2 16.8 13.2 18.0 13.5
P004 16.8 13.2 16.7 13.2 16.7 13.2 17.9 13.5
P151 13.5 12.9 13.4 13.1 13.4 13.2 14.1 13.4
P151 13.4 12.9 13.3 13.1 13.4 13.2 14.1 13.4
P013 11.0 13.8 - - - - - -
P013 11.0 13.8 - - - - - -
P013 10.6 7.1 - - - - - -
P081 18.7 13.4 18.5 13.4 18.6 13.4 20.0 13.7
P081 18.8 13.4 18.6 13.4 18.7 13.4 20.1 13.7
P172 17.5 4.6 - - - - - -
Primary Substations Bus Voltages
Primary P.No.
2019 2020 2021 2022
33kV (%) 11kV(%) 33kV (%) 11kV(%) 33kV (%) 11kV(%) 33kV (%) 11kV(%)
Primary Substation 3-Phase Fault Current Levels (kA)
Primary P.No. 33kV -Rated SC Capacity
11kV -Rated SC Capacity
2019 2020 2021 2022
Airport Height 1-A
Airport Height 1-B
Airport Height 2-A
Airport Height 2-B
Airport Height 3-A
Airport Height 3-B
Airport Height 4-A
Airport Height 4-B
Airport Height 5-A
Airport Height 5-B
Azaiba North 3-A
Azaiba North 3-B
Azaiba North 3-C
MOD Technical College-A
MOD Technical College-B
ROP Hospital
Airport Height 1-A 25.0 20.0
Airport Height 1-B 25.0 20.0
Airport Height 2-A 25.0 18.4
Airport Height 2-B 25.0 18.4
Airport Height 3-A 25.0 20.0
Airport Height 3-B 25.0 20.0
Azaiba North 3-C 25.0 20.0
MOD Technical College-A 25.0 18.4
MOD Technical College-B 25.0 18.4
ROP Hospital 25.0 12.5
Airport Height 4-A 25.0 20.0
Airport Height 4-B 25.0 20.0
Airport Height 5-A 25.0 25.0
Airport Height 5-B 25.0 25.0
Azaiba North 3-A 25.0 20.0
Azaiba North 3-B 25.0 20.0
MEDC Distribution System Capability Statement [2020-2022]-V1.0 97

MW MVAr MVA % MW MVAr MVA % MW MVAr MVA % MW MVAr MVA %
Azaibah North 3 P013 40 - - - - 34.3 11.3 36.1 90% 36.1 11.9 38.0 95% 37.0 12.1 38.9 97%
ROP Airport Height P195 40 - - - - - - - - - - - - 7.0 2.3 7.4 18%
MW MVAr MVA % MW MVAr MVA % MW MVAr MVA % MW MVAr MVA %
Azaibah North 3 P013 40 - - - - 7.6 0.0 7.6 19% 8.0 0.0 8.0 20% 8.2 0.0 8.2 20%
ROP Airport Height P195 40 - - - - - - - - - - - - 1.3 0.6 1.4 4%
22.0
22.0
22.0
22.0
22.0
22.0
Max Min Max Min Max Min Max Min Max Min Max Min Max Min Max Min
P013 - - - - 99.9 100.0 101.4 104.5 99.8 100.0 101.1 104.5 99.5 100.0 100.7 104.4
P013 - - - - 99.9 100.0 101.4 104.5 99.7 100.0 101.1 104.5 99.5 100.0 100.7 104.4
P013 - - - - 99.9 100.0 101.4 104.5 99.8 100.0 101.1 104.5 99.5 100.0 100.7 104.4
P195 - - - - - - - - - - - - 100.3 100.1 104.3 104.5
P195 - - - - - - - - - - - - 100.3 100.1 104.3 104.5
P195 - - - - - - - - - - - - 100.3 100.1 104.3 104.5
33kV 11kV 33kV 11kV 33kV 11kV 33kV 11kV
P013 - - 10.6 13.4 10.6 13.5 11.1 13.8
P013 - - 10.6 13.4 10.6 13.5 11.1 13.8
P013 - - 10.3 7.5 10.4 7.6 10.8 7.7
P195 - - - - - - 8.8 11.4
P195 - - - - - - 8.8 11.4
P195 - - - - - - 8.3 6.3
Airport Heights [G01] - B GSS [Zone 3] - System Study ResultsPrimary Substations Maximum Demand and Percentage Loading
Primary Substation P.No.Firm
Capacity(MVA)
2019 2020 2021 2022
Primary Substations Minimum Demand and Percentage Loading
Primary Substation P.No.Firm
Capacity(MVA)
2019 2020 2021 2022
33kV Feeder Maximum Loads
Primary Rating(MVA)
2019 2020 2021 2022
MVA %Loading MVA %Loading MVA %Loading MVA %Loading
11kV(%) 33kV (%) 11kV(%) 33kV (%) 11kV(%) 33kV (%)
Azaiba North 3-F1-P013 - - 12.1 54.9 12.7 57.8 13.1 59.4
Azaiba North 3-F2-P013 - - 12.4 56.4 13.1 59.4 13.4 61.0
Azaiba North 3-F3-P013 - - 12.2 55.6 12.9 58.6 13.2 60.2
11kV(%)
ROP Airport Height-F3-P195 - - -
ROP Airport Height-C 25.0 25.0
Primary P.No. 33kV -Rated SC Capacity
11kV -Rated SC Capacity
2019 2020 2021 2022
Azaiba North 3-A 25.0 20.0
Azaiba North 3-B 25.0 20.0
Azaiba North 3-C 25.0 20.0
- - - 2.5 11.3
ROP Airport Height-F1-P195 - - - - - - 2.5 11.3
ROP Airport Height-F2-P195 - - - - - - 2.5 11.3
ROP Airport Height-A 25.0 25.0
ROP Airport Height-B 25.0 25.0
Azaiba North 3-A
Azaiba North 3-B
Azaiba North 3-C
ROP Airport Height-A
ROP Airport Height-B
ROP Airport Height-C
Primary Substation 3-Phase Fault Current Levels (kA)
Primary Substations Bus Voltages
Primary P.No.
2019 2020 2021 2022
33kV (%)
MEDC Distribution System Capability Statement [2020-2022]-V1.0 98

MW MVAr MVA % MW MVAr MVA % MW MVAr MVA % MW MVAr MVA %
Al Jifnain P042 1TX 3.0 1.2 3.2 - 1.0 0.4 1.1 - 1.0 0.4 1.1 - 1.0 0.4 1.1 -
Al Jifnain 2 P196 1TX - - - - 2.0 0.8 2.2 - 2.0 0.8 2.2 - 2.0 0.8 2.2 -
Cement Housing P088 5 1.0 0.4 1.1 21% 1.0 0.4 1.1 21% 1.0 0.4 1.1 21% 1.0 0.4 1.1 21%
Rusail Industrial 1 P103 16 15.3 3.2 15.6 98% 16.1 3.2 16.4 103% 17.3 3.4 17.7 110% 18.7 3.7 19.1 119%
Rusail Industrial 2 P104 20 18.0 5.7 18.9 95% 19.0 6.1 19.9 100% 20.4 6.5 21.4 107% 22.0 7.0 23.1 116%
SQU 1 P122 32 22.7 13.6 26.5 83% 22.7 13.7 26.5 83% 22.7 13.7 26.5 83% 22.7 13.7 26.5 83%
SQU 2 P123 16 12.5 9.1 15.5 97% 12.5 9.2 15.5 97% 12.5 9.2 15.5 97% 12.5 9.2 15.5 97%
MW MVAr MVA % MW MVAr MVA % MW MVAr MVA % MW MVAr MVA %
Al Jifnain P042 1TX 0.6 0.3 0.6 - 0.2 0.1 0.2 - 0.2 0.1 0.2 - 0.2 0.1 0.2 -
Al Jifnain 2 P196 1TX - - - - 0.4 0.2 0.4 - 0.4 0.2 0.4 - 0.4 0.2 0.4 -
Cement Housing P088 5 0.2 0.1 0.2 4% 0.2 0.1 0.2 4% 0.2 0.1 0.2 4% 0.2 0.1 0.2 4%
Rusail Industrial 1 P103 16 1.8 1.3 2.2 14% 1.9 1.3 2.3 14% 2.0 1.4 2.5 16% 2.2 1.5 2.7 17%
Rusail Industrial 2 P104 20 1.6 0.0 1.6 8% 1.7 0.0 1.7 8% 1.8 0.0 1.8 9% 2.0 0.0 2.0 10%
SQU 1 P122 32 5.5 3.5 6.5 20% 5.5 3.5 6.5 20% 5.5 3.5 6.5 20% 5.5 3.5 6.5 20%
SQU 2 P123 16 2.8 2.6 3.8 24% 2.8 2.6 3.8 24% 2.8 2.6 3.8 24% 2.8 2.6 3.8 24%
22.0
22.0
22.0
22.0
22.0
22.0
22.0
22.0
22.0
22.0
22.0
Max Min Max Min Max Min Max Min Max Min Max Min Max Min Max Min
P042 99.0 99.9 101.1 104.1 99.1 100.0 102.2 104.4 99.0 100.0 102.1 104.4 99.0 100.0 102.0 104.4
P196 - - - - 99.0 100.0 101.5 104.5 98.9 100.0 101.5 104.5 98.9 100.0 101.5 104.5
P088 98.9 100.0 97.0 99.9 98.9 100.0 97.1 99.9 98.9 100.0 97.1 99.9 98.9 100.0 97.1 99.9
P088 98.9 100.0 97.0 99.9 98.9 100.0 97.1 99.9 98.9 100.0 97.1 99.9 98.9 100.0 97.1 99.9
P103 100.0 100.0 98.6 99.6 100.0 100.0 98.5 99.6 100.0 100.0 98.3 99.5 100.0 100.0 98.2 99.5
P103 100.0 100.0 98.6 99.5 100.0 100.0 98.5 99.5 100.0 100.0 98.3 99.5 100.0 100.0 98.2 99.5
P104 99.9 100.0 102.5 104.5 99.8 100.0 102.1 104.5 99.8 100.0 101.9 104.5 99.8 100.0 101.6 104.5
P104 99.8 100.0 102.2 104.5 99.9 100.0 102.4 104.5 99.8 100.0 102.2 104.5 99.8 100.0 102.0 104.5
P122 99.7 99.9 101.3 103.6 99.6 99.9 101.3 103.6 99.6 99.9 101.3 103.6 99.6 99.9 101.3 103.6
P122 99.7 99.9 101.3 103.6 99.6 99.9 101.3 103.6 99.6 99.9 101.3 103.6 99.6 99.9 101.3 103.6
P122 99.6 99.9 101.2 103.6 99.7 99.9 101.3 103.6 99.7 99.9 101.3 103.6 99.7 99.9 101.3 103.6
P123 99.4 99.9 100.4 103.5 99.4 99.9 100.4 103.5 99.4 99.9 100.4 103.5 99.4 99.9 100.4 103.5
P123 99.4 99.9 100.4 103.5 99.4 99.9 100.4 103.5 99.4 99.9 100.4 103.5 99.4 99.9 100.4 103.5
32.8 7.3 33.3 7.3 33.3 7.3 33.3
7.2 32.8 7.3 33.3 7.3 33.3
6.4 29.3 6.2 28.1 6.3 28.8 6.5 29.6
4.5 20.4 4.4 20.1 4.4 20.1 4.4 20.1
8.2 37.3 8.7 39.4 9.3 42.4 10.1 45.9
Primary Substations Minimum Demand and Percentage Loading
Primary Substation P.No.Firm
Capacity(MVA)
2019 2020 2021 2022
8.0 36.5 9.8 44.5 10.6 48.0 11.4 52.0
9.0 41.1 8.2 37.3 8.8 40.2 9.6
33.37.3
7.5 34.1 7.3 33.0 7.3 33.0 7.3 33.0
7.7 35.2 7.8 35.4
11kV(%) 33kV (%) 11kV(%) 33kV (%) 11kV(%)
7.8 35.4
7.9 36.1 8.4 38.1 9.0 41.0 9.8 44.3
7.8 35.4 7.8 35.4
43.5
7.2
2020 2021 2022
Al Jifnain
Al Jifnain 2
Cement Housing-A
Cement Housing-B
Rusail Industrial 1-A
Rusail Industrial 1-B
Rusail Industrial 2-A
Rusail Industrial 2-B
SQU 1-A
SQU 1-B
SQU 1-C
SQU 2-A
SQU 2-B
MVA %Loading
7.7 35.2 7.8 35.4 7.8 35.4
Primary Substations Bus Voltages
Primary P.No.
2019 2020 2021 2022
33kV (%) 11kV(%) 33kV (%)
SQU 2-F1-P123
SQU 2-F2-P123
SQU 1-F2-P122
SQU 1-F3-P122
Rusail Industrial 2-F2-P104
SQU 1-F1-P122
Rusail Industrial 1-F2-P103
Rusail Industrial 2-F1-P104
Cement Housing-F2-P088
Rusail Industrial 1-F1-P103
Cement Housing-F1-P088
33kV Feeder Maximum Loads
Primary Rating(MVA)
2019 2020 2021 2022
MVA %Loading MVA %Loading MVA %Loading
Rusail Industry[G13]-A GSS [Zone 3] - System Study ResultsPrimary Substations Maximum Demand and Percentage Loading
Primary Substation P.No.Firm
Capacity(MVA)
2019
MEDC Distribution System Capability Statement [2020-2022]-V1.0 99

33kV 11kV 33kV 11kV 33kV 11kV 33kV 11kV
P042 6.9 4.1 6.9 3.9 6.9 3.9 6.8 3.9
P196 - - 6.2 4.0 6.2 4.0 6.1 4.0
P088 5.0 5.1 5.0 5.1 5.0 5.1 5.0 5.1
P088 5.0 5.1 5.0 5.1 5.0 5.1 5.0 5.1
P103 22.3 15.6 22.2 15.7 22.3 15.8 21.1 15.7
P103 22.3 15.6 22.2 15.7 22.3 15.8 21.1 15.7
P104 19.2 7.9 19.1 8.0 19.2 8.1 18.3 8.1
P104 19.9 8.1 19.8 8.1 20.0 8.1 19.2 8.2
P122 15.1 13.3 15.0 13.2 15.1 13.2 14.5 13.1
P122 15.1 13.3 15.0 13.2 15.1 13.2 14.5 13.1
P122 14.9 7.2 14.9 7.3 14.9 7.3 14.4 7.2
P123 13.1 12.8 13.0 12.8 13.1 12.8 12.6 12.7
P123 13.1 12.8 13.0 12.8 13.1 12.8 12.6 12.7
Rusail Industrial 2-A 25.0 20.0
Rusail Industrial 2-B 25.0 20.0
SQU 1-A 25.0 18.4
SQU 1-B 25.0 18.4
SQU 1-C 25.0 18.4
SQU 2-A 25.0 18.4
SQU 2-B 25.0 18.4
Al Jifnain 2 25.0 12.5
Cement Housing-A 25.0 12.5
Cement Housing-B 25.0 12.5
Rusail Industrial 1-A 25.0 20.0
Rusail Industrial 1-B 25.0 20.0
Primary Substation 3-Phase Fault Current Levels (kA)
Primary P.No. 33kV -Rated SC Capacity
11kV -Rated SC Capacity
2019 2020 2021 2022
Al Jifnain 25.0 12.5
MEDC Distribution System Capability Statement [2020-2022]-V1.0 100

MW MVAr MVA % MW MVAr MVA % MW MVAr MVA % MW MVAr MVA %
ROP Al Khoud P161 20 6.1 2.4 6.6 33% 6.1 2.0 6.4 32% 6.1 2.0 6.4 32% 6.1 2.0 6.4 32%
Rusail Housing P056 20 13.9 4.8 14.7 74% 14.6 4.8 15.4 77% 15.7 5.2 16.6 83% 17.0 5.6 17.9 89%
Rusail Industrial 3 P105 20 16.1 4.0 16.6 83% 17.0 4.3 17.5 88% 18.3 4.6 18.8 94% 19.7 4.9 20.4 102%
Rusail Industrial 4 P158 40 28.1 12.3 30.7 77% 29.6 9.7 31.2 78% 31.8 10.5 33.5 84% 34.4 11.3 36.2 90%
Rusail Private Factory P106 20 19.6 4.5 20.1 100% 20.6 4.7 21.2 106% 16.8 3.8 17.2 86% 18.2 4.1 18.6 93%
Rusail08(KOM) P164 40 8.3 3.4 9.0 22% 8.7 2.9 9.2 23% 14.7 4.8 15.5 39% 15.9 5.2 16.8 42%
SQU 3 P160 40 1.2 0.3 1.2 3% 1.2 0.0 1.2 3% 1.2 0.0 1.2 3% 1.2 0.0 1.2 3%
MW MVAr MVA % MW MVAr MVA % MW MVAr MVA % MW MVAr MVA %
ROP Al Khoud P161 20 1.1 0.5 1.2 6% 1.1 0.5 1.2 6% 1.1 0.5 1.2 6% 1.1 0.5 1.2 6%
Rusail Housing P056 20 2.8 0.8 2.9 15% 2.9 0.8 3.0 15% 3.2 0.9 3.3 16% 3.4 0.9 3.5 18%
Rusail Industrial 3 P105 20 1.6 0.0 1.6 8% 1.7 0.0 1.7 8% 1.8 0.0 1.8 9% 2.0 0.0 2.0 10%
Rusail Industrial 4 P158 40 5.5 2.1 5.9 15% 5.6 2.2 6.0 15% 6.0 2.3 6.4 16% 6.5 2.5 7.0 17%
Rusail Private Factory P106 20 3.9 2.2 4.5 23% 4.1 2.4 4.7 24% 3.3 1.9 3.9 19% 3.6 2.1 4.2 21%
Rusail08(KOM) P164 40 1.6 0.0 1.6 4% 1.6 0.0 1.6 4% 2.5 0.0 2.5 6% 2.5 0.0 2.5 6%
SQU 3 P160 40 0.1 0.0 0.1 0% 0.1 0.0 0.1 0% 0.1 0.0 0.1 0% 0.1 0.0 0.1 0%
22.0
22.0
22.0
22.0
22.0
22.0
22.0
22.0
22.0
22.0
22.0
22.0
22.0
22.0
22.0
22.0
22.0
46.3 10.8 48.9 8.7 39.6 9.4 42.9
10.7 48.7 8.7 39.5 9.4 42.7
Rusail Private Factory-F2-P106 10.2
SQU 03-F1-P160 0.8 3.7 0.7 3.2 0.7 3.2 0.7 3.2
SQU 03-F2-P160 0.8 3.8 0.7 3.3 0.7 3.3 0.7 3.3
Rusail05(Housing)-F1-P056 7.3 33.2 7.7 35.0 8.3 37.7 9.0 40.8
Rusail05(Housing)-F2-P056 7.4 33.7 7.8 35.6 8.4 38.3 9.1 41.5
5.5 25.2
Rusail Ind 4-F1-P158 10.5 47.9 10.7 48.6 11.5 52.4 12.5 56.8
SQU 03-F3-P160 0.6 2.7 0.7 3.3 0.7 3.3 0.7 3.3
Rusail Industrial 3-F1-P105 8.5 38.8 9.0 40.9 9.7 44.1 10.5 47.7
Rusail Industrial 3-F2-P105 8.3 37.7 8.7 39.8 9.4 42.8 10.2 46.4
Rusail Private Factory-F1-P106 10.2 46.2
Rusail 08-F1-P164 2.2 9.8 3.0 13.5 5.1 23.2 5.5 25.1
Rusail 08-F2-P164 2.2 9.8 3.0 13.5 5.1 23.3 5.5 25.2
Rusail Ind 4-F2-P158 10.4 47.4 10.6 48.1 11.4 51.8 12.4 56.2
Rusail Ind 4-F3-P158 10.5 47.8 10.6 48.3 11.5 52.1 12.4 56.5
Rusail 08-F3-P164 4.3 19.6 3.0 13.5 5.1 23.3
ROP Al Khoudh-F1-P161 3.1 14.3 3.1 14.1 3.1 14.1 3.1 14.1
ROP Al Khoudh-F2-P161 3.1 14.3 3.1 14.1 3.1 14.1 3.1 14.1
Primary Substations Minimum Demand and Percentage Loading
Primary Substation P.No.Firm
Capacity(MVA)
2019 2020 2021 2022
33kV Feeder Maximum Loads
Primary Rating(MVA)
2019 2020 2021 2022
MVA %Loading MVA %Loading MVA %Loading MVA %Loading
Rusail Industry[G13]-B GSS [Zone 3] - System Study ResultsPrimary Substations Maximum Demand and Percentage Loading
Primary Substation P.No.Firm
Capacity(MVA)
2019 2020 2021 2022
MEDC Distribution System Capability Statement [2020-2022]-V1.0 101

Max Min Max Min Max Min Max Min Max Min Max Min Max Min Max Min
P161 99.8 100.0 103.4 104.3 99.8 100.0 103.6 104.3 99.8 100.0 103.6 104.3 99.8 100.0 103.6 104.3
P161 99.8 100.0 103.4 104.3 99.8 100.0 103.6 104.3 99.8 100.0 103.6 104.3 99.8 100.0 103.6 104.3
P164 99.9 100.0 103.9 104.5 99.9 100.0 103.7 104.5 99.8 100.0 103.1 104.5 99.8 100.0 103.0 104.5
P164 99.9 100.0 103.9 104.5 99.9 100.0 103.7 104.5 99.8 100.0 103.1 104.5 99.8 100.0 103.0 104.5
P164 99.8 100.0 103.2 104.5 99.9 100.0 103.7 104.5 99.8 100.0 103.1 104.5 99.8 100.0 103.0 104.5
P158 100.0 100.0 101.5 104.0 100.0 100.0 102.0 104.0 100.0 100.0 101.7 104.0 100.0 100.0 101.5 103.9
P158 100.0 100.0 101.5 104.0 100.0 100.0 102.0 104.0 100.0 100.0 101.7 104.0 100.0 100.0 101.5 103.9
P158 100.0 100.0 101.5 104.0 100.0 100.0 102.0 104.0 100.0 100.0 101.8 104.0 100.0 100.0 101.5 103.9
P105 99.8 100.0 102.7 104.5 99.8 100.0 102.6 104.5 99.8 100.0 102.4 104.5 99.8 100.0 102.2 104.5
P105 99.8 100.0 102.7 104.5 99.8 100.0 102.6 104.5 99.8 100.0 102.4 104.5 99.8 100.0 102.2 104.5
P106 99.9 100.0 102.7 103.7 99.9 100.0 102.6 103.7 99.9 100.0 103.0 103.9 99.9 100.0 102.8 103.8
P106 99.9 100.0 102.7 103.7 99.9 100.0 102.6 103.7 99.9 100.0 103.0 103.9 99.9 100.0 102.8 103.8
P056 99.8 100.0 102.5 104.2 99.7 100.0 102.4 104.2 99.7 100.0 102.3 104.2 99.7 100.0 102.0 104.2
P056 99.7 100.0 102.5 104.2 99.7 100.0 102.4 104.2 99.7 100.0 102.3 104.2 99.7 100.0 102.0 104.2
P160 100.0 100.0 104.5 104.6 100.0 100.0 104.5 104.6 100.0 100.0 104.5 104.6 100.0 100.0 104.5 104.6
P160 100.0 100.0 104.5 104.6 100.0 100.0 104.5 104.6 100.0 100.0 104.5 104.6 100.0 100.0 104.5 104.6
P160 100.0 100.0 104.6 104.6 100.0 100.0 104.5 104.6 100.0 100.0 104.5 104.6 100.0 100.0 104.5 104.6
33kV 11kV 33kV 11kV 33kV 11kV 33kV 11kV
P161 13.2 12.7 13.2 12.7 13.2 12.7 12.9 12.6
P161 13.2 12.7 13.2 12.7 13.2 12.7 12.9 12.6
P164 15.1 13.1 15.1 13.3 15.2 13.6 14.8 13.5
P164 15.1 13.1 15.1 13.3 15.2 13.6 14.8 13.5
P164 14.9 7.4 14.9 7.3 15.0 7.5 14.6 7.5
P158 24.4 15.1 24.3 15.2 24.5 15.3 23.4 15.3
P158 24.4 15.1 24.3 15.2 24.5 15.3 23.4 15.3
P158 24.4 8.5 24.3 8.5 24.6 8.6 23.4 8.6
P105 18.4 14.4 18.3 14.5 18.5 14.6 17.8 14.6
P105 18.4 14.4 18.3 14.5 18.5 14.6 17.8 14.6
P106 22.7 14.7 22.6 14.8 22.7 14.5 21.8 14.5
P106 22.7 14.7 22.6 14.8 22.7 14.5 21.8 14.5
P056 16.6 14.2 16.5 14.2 16.7 14.3 16.1 14.3
P056 16.6 14.2 16.6 14.2 16.7 14.3 16.1 14.3
P160 13.4 12.8 13.4 12.7 13.4 12.8 13.1 12.6
P160 13.4 12.8 13.4 12.7 13.4 12.8 13.1 12.6
P160 13.1 7.2 13.1 7.2 13.1 7.2 12.8 7.2
Rusail Ind 4-A
Rusail Ind 4-B
Rusail Ind 4-C
Rusail Industrial 3-A
Rusail Ind 4-A 25.0 25.0
Rusail Ind 4-B 25.0 25.0
ROP Al Khoudh-A 25.0 25.0
ROP Al Khoudh-B 25.0 18.4
Rusail 08-A 25.0 25.0
Rusail 08-B 25.0 25.0
Rusail 08-C 25.0 25.0
SQU 03-C 25.0 25.0
Rusail05(Housing)-A 25.0 18.4
Rusail05(Housing)-B 25.0 18.4
SQU 03-A 25.0 25.0
SQU 03-B 25.0
11kV(%) 33kV (%) 11kV(%)
Rusail Private Factory-A 25.0 18.4
Rusail Private Factory-B 25.0 18.4
25.0
Rusail Industrial 3-B 25.0 18.4
Rusail Ind 4-C 25.0 25.0
Rusail Industrial 3-A 25.0 18.4
ROP Al Khoudh-A
ROP Al Khoudh-B
Rusail 08-A
Rusail 08-B
Rusail 08-C
Rusail Industrial 3-B
Rusail Private Factory-A
Rusail Private Factory-B
Rusail05(Housing)-A
Rusail05(Housing)-B
SQU 03-A
SQU 03-B
SQU 03-C
Primary Substation 3-Phase Fault Current Levels (kA)
Primary P.No. 33kV -Rated SC Capacity
11kV -Rated SC Capacity
2019 2020 2021 2022
Primary Substations Bus Voltages
Primary P.No.
2019 2020 2021 2022
33kV (%) 11kV(%) 33kV (%) 11kV(%) 33kV (%)
MEDC Distribution System Capability Statement [2020-2022]-V1.0 102

MW MVAr MVA % MW MVAr MVA % MW MVAr MVA % MW MVAr MVA %
Al Awabi P139 12 10.4 4.1 11.1 93% - - - - - - - - - - - -
Al Awabi(upgrade) P139 40 - - - - 20.9 6.9 22.0 55% 23.1 7.6 24.4 61% 25.1 8.2 26.4 66%
Al Misfah P080 40 35.8 10.9 37.4 94% 34.7 10.6 36.3 91% 38.4 11.7 40.1 100% 41.6 12.7 43.5 109%
Cement Factory 1 P079 91.5 56.1 22.2 60.3 66% 56.1 22.2 60.3 66% 56.1 22.2 60.3 66% 56.1 22.2 60.3 66%
Orpic P192 6 0.7 0.3 0.8 13% 0.7 0.3 0.8 13% 0.7 0.3 0.8 13% 0.7 0.3 0.8 13%
MW MVAr MVA % MW MVAr MVA % MW MVAr MVA % MW MVAr MVA %
Al Awabi P139 12 1.9 0.9 2.1 18% - - - - - - - - - - - -
Al Awabi(upgrade) P139 40 - - - - 3.8 1.7 4.2 10% 4.2 1.9 4.6 12% 4.6 2.1 5.0 13%
Al Misfah P080 40 6.8 2.0 7.1 18% 6.6 2.0 6.9 17% 7.3 2.2 7.6 19% 7.9 2.4 8.3 21%
Cement Factory 1 P079 91.5 10.4 4.8 11.5 13% 10.4 4.8 11.5 13% 10.4 4.8 11.5 13% 10.4 4.8 11.5 13%
Orpic P192 6 0.1 0.1 0.1 2% 0.1 0.1 0.1 2% 0.1 0.1 0.1 2% 0.1 0.1 0.1 2%
22.0
22.0
22.0
22.0
22.0
22.0
22.0
22.0
22.0
22.0
22.0
22.0
Max Min Max Min Max Min Max Min Max Min Max Min Max Min Max Min
P139 99.3 99.9 102.1 104.1 99.2 99.9 101.9 104.0 99.1 99.8 101.6 103.9 99.0 99.8 101.3 103.9
P139 - - 102.1 104.1 99.2 99.9 101.9 104.0 99.1 99.8 101.6 103.9 99.0 99.8 101.3 103.9
P139 - - 102.1 104.1 99.2 99.9 101.9 104.0 99.1 99.8 101.6 103.9 99.0 99.8 101.3 103.9
P080 99.6 99.9 101.0 103.9 99.6 99.9 101.3 104.0 99.6 99.9 100.9 103.9 99.5 99.9 100.5 103.4
P080 99.6 99.9 101.0 103.9 99.6 99.9 101.3 104.0 99.6 99.9 100.9 103.9 99.5 99.9 100.5 103.4
P080 99.7 99.9 101.5 104.0 99.6 99.9 101.3 104.0 99.6 99.9 100.9 103.9 99.5 99.9 100.5 103.4
P079 98.9 99.8 96.4 99.3 98.9 99.8 96.4 99.3 98.9 99.8 96.4 99.3 98.9 99.8 96.4 98.9
P079 98.9 99.8 96.4 99.3 98.9 99.8 96.4 99.3 98.9 99.8 96.4 99.3 98.9 99.8 96.4 98.9
P079 98.9 99.8 99.8 103.7 98.9 99.8 99.8 103.7 98.9 99.8 99.8 103.7 98.9 99.8 99.8 103.1
P079 98.9 99.8 99.8 103.7 98.9 99.8 99.8 103.7 98.9 99.8 99.8 103.7 98.9 99.8 99.8 103.1
P079 98.9 99.8 99.8 103.7 98.9 99.8 99.8 103.7 98.9 99.8 99.8 103.7 98.9 99.8 99.8 103.1
P192 100.0 100.0 - - 100.0 100.0 - - 100.0 100.0 - - 100.0 100.0 - -
Al Awabi-C
Al Misfah-A
Al Misfah-B
Al Misfah-C
Cement Factory 1-A
Cement Factory 1-B
Cement Factory 1-C
Cement Factory 1-D
Cement Factory 1-E
Orpic
Primary Substations Bus Voltages
Primary P.No.
2019 2020 2021 2022
33kV (%) 11kV(%) 33kV (%) 11kV(%) 33kV (%) 11kV(%) 33kV (%) 11kV(%)
Al Awabi-A
Al Awabi-B
Orpic-6.9kV-F1-P192 0.8 3.7 0.8 3.7 0.8 3.7 0.8 3.7
Cement Factory 1-DP079 12.6 81.8 12.6 81.8 12.6 81.8 12.6 81.8
Cement Factory 1-EP079 12.6 81.8 12.6 81.8 12.6 81.8 12.6 81.8
Cement Factory 1-F2-P079 12.5 81.0 12.5 81.0 12.5 81.0 12.5 81.0
Cement Factory 1-F3-P079 12.6 81.8 12.6 81.8 12.6 81.8 12.6 81.8
Al Misfah-F3-P080 11.5 52.4 12.3 56.1 13.7 62.3 14.9 67.8
Cement Factory 1-F1-P079 12.5 81.0 12.5 81.0 12.5 81.0 12.5 81.0
Al Misfah-F1-P080 13.4 60.9 12.4 56.2 13.7 62.5 14.9 67.9
Al Misfah-F2-P080 13.3 60.6 12.3 55.9 13.7 62.2 14.9 67.6
Al Awabi-F2-P139 - - 4.7 21.3 5.2 23.6 5.7 25.7
Al Awabi-F3-P139 - - 4.7 21.3 5.2 23.6 5.7 25.7
33kV Feeder Maximum Loads
Primary Rating(MVA)
2019 2020 2021 2022
MVA %Loading MVA %Loading MVA %Loading MVA %Loading
Al Awabi-F1-P139 11.2 50.9 13.1 59.6 14.5 66.0 15.8 71.8
Misfah[G04] GSS [Zone 2] - System Study ResultsPrimary Substations Maximum Demand and Percentage Loading
Primary Substation P.No.Firm
Capacity(MVA)
2019 2020 2021 2022
Primary Substations Minimum Demand and Percentage Loading
Primary Substation P.No.Firm
Capacity(MVA)
2019 2020 2021 2022
MEDC Distribution System Capability Statement [2020-2022]-V1.0 103

33kV 11kV 33kV 11kV 33kV 11kV 33kV 11kV
P139 13.6 9.2 17.7 13.5 17.8 13.6 18.9 13.9
P139 - 9.2 17.7 13.5 17.8 13.6 18.9 13.9
P139 - 5.2 17.7 7.7 17.8 7.8 18.9 7.9
P080 19.3 15.2 19.4 15.0 19.4 15.2 20.7 15.6
P080 19.3 15.2 19.3 15.0 19.4 15.2 20.7 15.6
P080 19.1 8.1 19.2 8.2 19.3 8.3 20.5 8.4
P079 13.0 10.3 13.0 10.3 13.0 10.3 13.5 10.4
P079 13.0 10.3 13.0 10.3 13.0 10.3 13.5 10.4
P079 13.0 7.8 13.0 7.8 13.0 7.8 13.5 7.8
P079 13.0 7.8 13.0 7.8 13.0 7.8 13.5 7.8
P079 13.0 7.8 13.0 7.8 13.0 7.8 13.5 7.8
P192 16.7 - 16.7 - 16.7 - 17.7 -
Cement Factory 1-B 25.0 25.0
Cement Factory 1-C 25.0 25.0
Cement Factory 1-D 25.0 25.0
Cement Factory 1-E 25.0 25.0
Orpic 25.0 -
Al Awabi-B 25.0 25.0
Al Awabi-C 25.0 25.0
Al Misfah-A 25.0 25.0
Al Misfah-B 25.0 25.0
Al Misfah-C 25.0 25.0
Cement Factory 1-A 25.0 25.0
Primary Substation 3-Phase Fault Current Levels (kA)
Primary P.No. 33kV -Rated SC Capacity
11kV -Rated SC Capacity
2019 2020 2021 2022
Al Awabi-A 25.0 25.0
MEDC Distribution System Capability Statement [2020-2022]-V1.0 104

MW MVAr MVA % MW MVAr MVA % MW MVAr MVA % MW MVAr MVA %
Mabelah South P061 20 24.1 10.9 26.5 133% 26.9 8.8 28.3 142% Shifted to Mabella 2-B GSS
Manomah P067 20 14.7 5.7 15.8 79% 14.7 4.8 15.5 77% 14.7 4.8 15.5 77% Shifted to Halban GSS
Palace Communication P033 1TX 1.8 0.7 1.9 - 1.8 0.7 1.9 - 1.8 0.7 1.9 - Shifted to Halban GSS
RGO Halban Camp P034 1TX - - - - - - - - - - - - - - - -
MW MVAr MVA % MW MVAr MVA % MW MVAr MVA % MW MVAr MVA %
Mabelah South P061 20 3.9 2.4 4.6 23% 4.2 2.6 4.9 25% Shifted to Mabella 2-B GSS
Manomah P067 20 4.9 1.4 5.1 26% 4.8 1.4 5.0 25% 4.8 1.4 5.0 25% Shifted to Halban GSS
Palace Communication P033 1TX 0.3 0.2 0.4 - 0.3 0.2 0.4 - 0.3 0.2 0.4 - Shifted to Halban GSS
RGO Halban Camp P034 1TX - - - - - - - - - - - - - - - -
22.0
22.0
22.0
22.0
20.0
Max Min Max Min Max Min Max Min Max Min Max Min Max Min Max Min
P061 96.9 99.9 96.9 103.6 96.7 99.9 97.3 103.6 - - - - - - - -
P061 96.9 99.9 96.9 103.6 96.7 100.0 97.3 103.6 - - - - - - - -
P067 100.6 100.4 103.1 104.5 100.4 100.5 103.2 104.6 99.6 100.7 102.3 104.7 - - - -
P067 100.5 100.4 103.1 104.5 100.3 100.5 103.2 104.6 99.6 100.6 102.3 104.7 - - - -
P033 101.3 100.6 105.0 105.0 101.0 100.7 104.7 105.1 100.2 100.9 103.9 105.3 - - - -
P034 101.3 100.6 105.9 105.2 101.0 100.7 105.6 105.3 100.3 100.9 104.8 105.4 - - - -
33kV 11kV 33kV 11kV 33kV 11kV 33kV 11kV
P061 5.0 10.9 5.0 11.0 - - - -
P061 5.0 10.9 5.0 11.0 - - - -
P067 8.6 12.6 8.6 12.6 8.5 12.5 - -
P067 8.2 12.6 8.2 12.6 8.1 12.5 - -
P033 7.5 4.2 7.5 4.2 7.4 4.2 - -
P034 8.1 3.0 8.2 3.0 8.1 3.0 - -RGO Halban Camp 25.0 18.4
Mabelah South-A 25.0 18.4
Mabelah South-B 25.0 18.4
Manoma 1-A 25.0 18.4
Manoma 1-B 25.0 18.4
Palace Communication 25.0 18.4
Primary Substation 3-Phase Fault Current Levels (kA)
Primary P.No. 33kV -Rated SC Capacity
11kV -Rated SC Capacity
2019 2020 2021 2022
Mabelah South-A
Mabelah South-B
Manoma 1-A
Manoma 1-B
Palace Communication
RGO Halban Camp
Primary Substations Bus Voltages
Primary P.No.
2019 2020 2021 2022
33kV (%) 11kV(%) 33kV (%) 11kV(%) 33kV (%) 11kV(%) 33kV (%) 11kV(%)
Old Mabelah-F1-P059 17.1 85.4 1.9 9.6 1.9 9.6 - -
Manoma 1-F1-P067 8.1 36.7 7.9 35.8 7.9 35.8 - -
Manoma 1-F2-P067 8.1 36.6 7.8 35.7 7.8 35.7 - -
Mabelah South-F1-P061 14.5 65.9 15.5 70.2 - - - -
Mabelah South-F2-P061 14.3 65.2 15.3 69.5 - - - -
Primary Substations Minimum Demand and Percentage Loading
Primary Substation P.No.Firm
Capacity(MVA)
2019 2020 2021 2022
33kV Feeder Maximum Loads
Primary Rating(MVA)
2019 2020 2021 2022
MVA %Loading MVA %Loading MVA %Loading MVA %Loading
Barka[G02] GSS [Zone 3] - System Study ResultsPrimary Substations Maximum Demand and Percentage Loading
Primary Substation P.No.Firm
Capacity(MVA)
2019 2020 2021 2022
MEDC Distribution System Capability Statement [2020-2022]-V1.0 105

MW MVAr MVA % MW MVAr MVA % MW MVAr MVA % MW MVAr MVA %
Botanic Garden P016 20 8.0 2.5 8.4 42% 8.0 2.6 8.4 42% 18.0 5.9 18.9 95% 18.0 5.9 18.9 95%
Mabelah A P063 40 30.0 8.2 31.1 78% 33.5 9.1 34.7 87% 37.6 10.2 38.9 97% Shifted to Halban GSS
Mabelah Grid GP04 20 26.2 10.1 28.1 141% 29.3 9.6 30.8 154% 23.8 7.8 25.1 125% 19.5 6.4 20.6 103%
Mabelah Industrial P191 0 Standby PSS
Mabelah PH-5 P190 0 Standby PSS
Mabelah South PH-7 P141 40 26.1 11.2 28.4 71% 29.2 9.6 30.7 77% 32.7 10.7 34.4 86% Shifted to Halban GSS
Mabelah STP P140 10 4.8 1.9 5.2 52% 4.8 1.9 5.2 52% 4.8 1.9 5.2 52% 4.8 1.9 5.2 52%
Old Mabelah P059 20 20.5 10.7 23.1 116% Shifted to Mabella 2-B GSS
ROP Dog Kennel P183 6 - - - - 3.5 1.4 3.8 63% 3.5 1.4 3.8 63% 3.5 1.4 3.8 63%
Sur Al Hadid P116 20 18.6 6.1 19.6 98% 19.9 6.5 20.9 105% - - - - - - - -
Sur Al Hadid(Upgrade) P116 40 - - - - - - - - 31.2 10.2 32.8 82% 32.3 10.6 34.0 85%
MW MVAr MVA % MW MVAr MVA % MW MVAr MVA % MW MVAr MVA %
Botanic Garden P016 20 1.1 0.7 1.3 7% 1.1 0.7 1.3 7% 2.5 1.6 2.9 15% 2.5 1.6 2.9 15%
Mabelah A P063 40 2.2 0.0 2.2 6% 2.5 0.0 2.5 6% 2.8 0.0 2.8 7% Shifted to Halban GSS
Mabelah Grid GP04 20 3.6 1.7 4.0 20% 3.9 1.9 4.4 22% 3.2 1.6 3.6 18% 2.6 1.3 2.9 15%
Mabelah Industrial P191 0 Standby PSS
Mabelah PH-5 P190 0 Standby PSS
Mabelah South PH-7 P141 40 5.2 3.4 6.2 16% 5.6 3.6 6.7 17% 6.3 4.1 7.5 19% Shifted to Halban GSS
Mabelah STP P140 10 0.9 0.4 1.0 10% 0.9 0.4 1.0 10% 0.9 0.4 1.0 10% 0.9 0.4 1.0 10%
Old Mabelah P059 20 4.6 2.8 5.4 27% Shifted to Mabella 2-B GSS
ROP Dog Kennel P183 6 - - - - 0.7 0.3 0.7 12% 0.7 0.3 0.7 12% 0.7 0.3 0.7 12%
Sur Al Hadid P116 20 4.1 3.0 5.1 26% 4.4 3.2 5.5 27% - - - - - - - -
Sur Al Hadid(Upgrade) P116 40 - - - - - - - - 6.9 5.1 8.6 21% 7.1 5.3 8.9 22%
22.0
22.0
22.0
22.0
22.0
22.0
22.0
22.0
22.0
22.0
22.0
22.0
22.0
22.0
15.4
22.0
22.0
22.0
22.0
22.0
Sur Al Hadid -F2-P116 9.8 44.3 10.5 47.8 11.0 50.0 11.4 51.9
Sur Al Hadid -F3-P116 - - - - 11.0 50.0 11.4 51.9
ROP Dog Kennel-F2-P183 - - 1.9 8.6 1.9 8.6 1.9 8.6
Sur Al Hadid -F1-P116 9.7 44.3 10.5 47.7 11.0 50.0 11.4 51.8
Old Mabelah-F2-P059 9.9 64.5 - - - - - -
ROP Dog Kennel-F1-P183 - - 1.9 8.4 1.9 8.4 1.9 8.4
Mabelah STP-F2-P140 2.4 10.9 2.4 10.9 2.4 10.9 2.4 10.9
Mabelah South PH-7-F3-P141 9.7 44.1 10.3 46.9 11.6 52.9 - -
Mabelah STP-F1-P140 2.4 11.1 2.4 11.0 2.4 11.0 2.4 11.0
Mabelah South PH-7-F1-P141 9.7 44.2 10.3 47.0 11.7 53.0 - -
Mabelah South PH-7-F2-P141 9.7 44.0 10.3 46.8 11.6 52.8 - -
Mabelah Industrial-F1-P191 0.3 1.3 0.3 1.3 0.3 1.3 0.3 1.3
Mabelah PH-5-F1-P190 0.4 1.6 0.4 1.6 0.4 1.6 0.4 1.6
Mabelah Grid-F1-GP04 14.6 66.2 15.9 72.5 12.9 58.5 10.5 47.7
Mabelah Grid-F2-GP04 14.8 67.1 16.1 73.4 13.0 59.2 10.6 48.3
Mabelah A-F2-P063 12.5 56.8 11.7 53.0 13.1 59.7 - -
Mabelah A-F3-P063 6.3 28.8 11.7 53.3 13.2 60.0 - -
Botanic Garden-F2-P016 4.1 18.6 4.1 18.6 9.5 43.4 9.5 43.4
Mabelah A-F1-P063 12.6 57.4 11.8 53.6 13.3 60.3 - -
33kV Feeder Maximum Loads
Primary Rating(MVA)
2019 2020 2021 2022
MVA %Loading MVA %Loading MVA %Loading MVA %Loading
Botanic Garden-F1-P016 4.1 18.6 4.1 18.6 9.5 43.3 9.5 43.3
Mabelah[GP04] GSS [Zone 3] - System Study ResultsPrimary Substations Maximum Demand and Percentage Loading
Primary Substation P.No.Firm
Capacity(MVA)
2019 2020 2021 2022
Primary Substations Minimum Demand and Percentage Loading
Primary Substation P.No.Firm
Capacity(MVA)
2019 2020 2021 2022
MEDC Distribution System Capability Statement [2020-2022]-V1.0 106

Max Min Max Min Max Min Max Min Max Min Max Min Max Min Max Min
P016 101.0 100.9 104.6 105.3 100.1 101.0 103.6 105.3 100.0 100.8 102.2 104.8 100.1 100.9 102.3 104.9
P016 101.0 100.9 104.6 105.3 100.1 101.0 103.6 105.3 100.0 100.8 102.2 104.8 100.1 100.9 102.3 104.9
P063 100.9 100.9 102.9 105.5 100.0 101.0 102.1 105.6 100.3 100.8 102.1 105.4 - - - -
P063 100.9 100.9 102.9 105.5 100.0 101.0 102.1 105.6 100.3 100.8 102.1 105.4 - - - -
P063 101.1 100.9 104.5 105.5 100.0 101.0 102.1 105.6 100.3 100.8 102.1 105.4 - - - -
GP04 101.3 100.9 101.7 104.9 100.4 101.0 100.8 104.9 100.7 100.9 102.1 104.9 100.9 101.0 102.9 105.1
GP04 101.3 100.9 101.7 104.9 100.4 101.0 100.8 104.9 100.7 100.9 102.1 104.9 100.9 101.0 102.9 105.1
P191 101.3 101.0 105.9 105.5 100.4 101.0 104.9 105.6 100.7 100.9 105.3 105.5 100.9 101.0 105.5 105.6
P190 101.3 101.0 105.9 105.5 100.4 101.0 104.9 105.6 100.7 100.9 105.3 105.5 100.9 101.0 105.5 105.6
P141 100.3 100.7 100.6 104.2 99.7 100.9 101.8 104.6 100.0 100.7 101.7 104.4 - - - -
P141 100.3 100.7 100.6 104.2 99.7 100.9 101.8 104.6 100.0 100.7 101.7 104.4 - - - -
P141 99.5 100.7 101.3 104.2 99.7 100.9 101.8 104.6 100.0 100.7 101.7 104.4 - - - -
P140 101.1 101.0 104.8 105.4 100.2 101.0 103.8 105.4 100.5 100.9 104.1 105.3 100.7 101.0 104.3 105.4
P140 101.1 101.0 104.8 105.4 100.2 101.0 103.8 105.4 100.5 100.9 104.1 105.3 100.7 101.0 104.3 105.4
P059 94.0 98.9 100.7 102.2 - - - - - - - - - - - -
P059 97.9 100.2 99.1 104.0 - - - - - - - - - - - -
P183 - - - - 100.4 101.0 104.0 105.4 100.7 100.9 104.3 105.3 100.8 101.0 104.5 105.4
P183 - - - - 100.4 101.0 104.0 105.4 100.7 100.9 104.3 105.3 100.8 101.0 104.5 105.4
P116 100.2 100.7 102.3 104.2 99.2 100.7 101.0 104.1 99.5 100.5 101.1 103.9 99.6 100.7 101.1 104.0
P116 100.2 100.7 102.3 104.2 99.2 100.7 101.0 104.1 99.5 100.5 101.1 103.9 99.6 100.7 101.1 104.0
P116 - - - - - - - - 99.5 100.5 101.2 103.9 99.6 100.7 101.2 104.0
33kV 11kV 33kV 11kV 33kV 11kV 33kV 11kV
P016 11.4 12.7 11.4 12.7 11.7 13.6 11.2 13.4
P016 11.4 12.7 11.5 12.7 11.7 13.6 11.3 13.4
P063 16.5 14.6 16.7 14.5 17.0 14.8 - -
P063 16.6 14.6 16.7 14.5 17.0 14.8 - -
P063 16.4 7.5 16.6 7.9 16.9 8.1 - -
GP04 24.4 15.5 24.9 15.8 25.5 15.4 23.2 14.8
GP04 24.4 15.5 24.9 15.8 25.5 15.4 23.2 14.8
P191 12.0 4.3 12.1 4.3 12.2 4.3 11.7 4.2
P190 5.5 3.7 5.5 3.7 5.5 3.7 5.4 3.7
P141 13.1 14.9 13.1 14.3 13.3 14.6 - -
P141 13.1 14.9 13.1 14.3 13.3 14.6 - -
P141 12.7 7.8 12.8 7.9 13.0 8.0 - -
P140 10.1 10.1 10.1 10.1 10.2 10.2 9.9 10.0
P140 10.1 10.1 10.1 10.1 10.2 10.2 9.9 10.0
P059 3.5 5.4 - - - - - -
P059 4.7 6.0 - - - - - -
P183 - - 22.3 8.7 22.8 8.7 21.0 8.6
P183 - - 22.2 8.7 22.7 8.7 20.9 8.6
P116 9.6 12.9 9.7 13.0 9.8 13.1 9.4 13.0
P116 9.6 12.9 9.6 13.0 9.7 13.1 9.4 13.0
P116 - - - - 9.2 7.1 9.0 7.1
Sur Al Hadid -B 25.0 20.0
Sur Al Hadid -C 25.0 25.0
Mabelah STP-B 25.0 20.0
Old Mabelah-A 25.0 20.0
Old Mabelah-B 25.0 20.0
ROP Dog Kennel-A 26.3 26.3
ROP Dog Kennel-B 26.3 26.3
Sur Al Hadid -A 25.0 20.0
Mabelah Industrial 25.0 18.4
Mabelah PH-5 25.0 18.4
Mabelah South PH-7-A 25.0 25.0
Mabelah South PH-7-B 25.0 25.0
Mabelah South PH-7-C 25.0 25.0
Mabelah STP-A 25.0 20.0
Botanic Garden-B 25.0 18.4
Mabelah A-A 25.0 18.4
Mabelah A-B 25.0 18.4
Mabelah A-C 25.0 25.0
Mabelah Grid-A 25.0 18.4
Mabelah Grid-B 25.0 18.4
Sur Al Hadid -B
Sur Al Hadid -C
Primary Substation 3-Phase Fault Current Levels (kA)
Primary P.No. 33kV -Rated SC Capacity
11kV -Rated SC Capacity
2019 2020 2021 2022
Botanic Garden-A 25.0 18.4
Mabelah A-A
Mabelah A-B
Mabelah A-C
Mabelah Grid-A
Mabelah Grid-B
Mabelah Industrial
Mabelah PH-5
Mabelah South PH-7-A
Mabelah South PH-7-B
Mabelah South PH-7-C
Mabelah STP-A
Mabelah STP-B
Old Mabelah-A
Old Mabelah-B
ROP Dog Kennel-A
ROP Dog Kennel-B
Sur Al Hadid -A
Primary Substations Bus Voltages
Primary P.No.
2019 2020 2021 2022
33kV (%) 11kV(%) 33kV (%) 11kV(%) 33kV (%) 11kV(%) 33kV (%) 11kV(%)
Botanic Garden-A
Botanic Garden-B
MEDC Distribution System Capability Statement [2020-2022]-V1.0 107

MW MVAr MVA % MW MVAr MVA % MW MVAr MVA % MW MVAr MVA %
Mabelah C P064 40 25.1 9.9 27.0 68% 28.1 9.2 29.6 74% 31.5 10.3 33.1 83% 35.5 11.7 37.4 93%
Mabelah Shabiya P060 40 29.3 11.6 31.5 79% Shifted to Mabella 2-B GSS
Mabelah South PH-4 P062 40 38.0 7.6 38.8 97% 42.5 8.8 43.3 108% 34.1 7.0 34.8 87% 38.5 7.9 39.3 98%
Mabelah South PH-8 P157 40 35.1 13.4 37.6 94% 39.2 12.9 41.3 103% 43.9 14.4 46.2 116% Shifted to Halban GSS
PalmMall P168 40 19.8 4.0 20.2 50% 22.1 4.5 22.6 56% 24.8 5.0 25.3 63% 27.9 5.7 28.5 71%
MW MVAr MVA % MW MVAr MVA % MW MVAr MVA % MW MVAr MVA %
Mabelah C P064 40 2.4 1.0 2.6 7% 2.6 1.1 2.8 7% 2.9 1.2 3.2 8% 3.3 1.4 3.6 9%
Mabelah Shabiya P060 40 5.4 2.5 6.0 15% Shifted to Mabella 2-B GSS
Mabelah South PH-4 P062 40 4.1 2.1 4.6 12% 4.6 2.3 5.1 13% 3.7 1.9 4.1 10% 4.2 2.1 4.7 12%
Mabelah South PH-8 P157 40 3.9 1.8 4.3 11% 4.3 2.0 4.7 12% 4.8 2.2 5.3 13% Shifted to Halban GSS
PalmMall P168 40 1.6 0.0 1.6 4% 1.8 0.0 1.8 4% 2.0 0.0 2.0 5% 2.3 0.0 2.3 6%
22.0
22.0
22.0
22.0
22.0
22.0
22.0
22.0
22.0
22.0
22.0
22.0
22.0
22.0
22.0
Max Min Max Min Max Min Max Min Max Min Max Min Max Min Max Min
P064 99.9 100.0 100.4 104.2 99.9 100.0 102.0 104.3 99.9 100.0 101.7 104.2 99.9 100.0 101.3 104.2
P064 99.9 100.0 100.4 104.2 99.9 100.0 102.0 104.3 99.9 100.0 101.7 104.2 99.9 100.0 101.3 104.2
P064 99.9 100.0 101.9 104.2 99.9 100.0 102.0 104.3 99.9 100.0 101.6 104.2 99.9 100.0 101.2 104.2
P060 99.5 99.9 100.3 103.7 - - - - - - - - - - - -
P060 99.5 99.9 100.3 103.7 - - - - - - - - - - - -
P060 99.7 99.9 101.8 103.7 - - - - - - - - - - - -
P062 99.6 100.0 101.6 104.0 99.6 99.9 101.3 103.9 99.7 100.0 102.0 104.0 99.6 100.0 101.7 104.0
P062 99.6 100.0 101.6 104.0 99.6 99.9 101.3 103.9 99.7 100.0 102.0 104.0 99.6 100.0 101.7 104.0
P062 99.6 100.0 101.8 104.0 99.6 99.9 101.4 103.9 99.7 100.0 102.1 104.1 99.6 100.0 101.7 104.0
P157 99.1 99.9 100.1 104.1 99.0 99.9 100.0 104.0 98.9 99.9 99.4 103.9 - - - -
P157 99.1 99.9 100.1 104.1 99.0 99.9 100.0 104.0 98.9 99.9 99.4 103.9 - - - -
P157 99.0 99.9 99.7 104.0 99.0 99.9 100.0 104.0 98.9 99.9 99.4 103.9 - - - -
P168 100.0 100.0 103.5 104.5 100.0 100.0 103.2 104.5 99.9 100.0 103.1 104.5 99.9 100.0 102.8 104.5
P168 100.0 100.0 103.5 104.5 99.9 100.0 103.2 104.5 99.9 100.0 103.1 104.5 99.9 100.0 102.8 104.5
P168 99.9 100.0 103.2 104.5 100.0 100.0 103.2 104.5 99.9 100.0 103.1 104.5 99.9 100.0 102.8 104.5
Mabelah C-C
Mabelah Shabiya-A
Mabelah Shabiya-B
Mabelah Shabiya-C
Mabelah South PH-4-A
Mabelah South PH-4-B
Mabelah South PH-4-C
Mabelah South PH-8-A
Mabelah South PH-8-B
Mabelah South PH-8-C
Palm Mall-A
Palm Mall-B
Palm Mall-C
Primary Substations Bus Voltages
Primary P.No.
2019 2020 2021 2022
33kV (%) 11kV(%) 33kV (%) 11kV(%) 33kV (%) 11kV(%) 33kV (%) 11kV(%)
Mabelah C-A
Mabelah C-B
Palm Mall-F2-P168 6.3 28.7 7.6 34.5 8.5 38.8 9.6 43.8
Palm Mall-F3-P168 7.8 35.4 7.6 34.6 8.5 38.8 9.6 43.8
Mabelah South PH-8-F3-P157 13.7 62.1 14.1 64.2 15.9 72.5 - -
Palm Mall-F1-P168 6.3 28.7 7.6 34.6 8.5 38.8 9.6 43.8
Mabelah South PH-8-F1-P157 12.5 56.8 14.1 64.2 16.0 72.5 - -
Mabelah South PH-8-F2-P157 12.5 56.8 14.1 64.2 16.0 72.5 - -
Mabelah South PH-4-F2-P062 13.6 61.8 14.9 67.9 11.9 54.1 13.5 61.3
Mabelah South PH-4-F3-P062 13.0 59.0 14.8 67.3 11.8 53.7 13.4 60.8
Mabelah Shabiya-F3-P060 10.7 48.8 - - - - - -
Mabelah South PH-4-F1-P062 13.4 60.8 14.7 66.8 11.7 53.2 13.3 60.3
Mabelah Shabiya-F1-P060 10.7 48.8 - - - - - -
Mabelah Shabiya-F2-P060 10.7 48.8 - - - - - -
Mabelah C-F2-P064 9.3 42.0 10.1 45.8 11.3 51.6 12.8 58.4
Mabelah C-F3-P064 9.2 42.0 10.1 45.8 11.3 51.5 12.8 58.3
33kV Feeder Maximum Loads
Primary Rating(MVA)
2019 2020 2021 2022
MVA %Loading MVA %Loading MVA %Loading MVA %Loading
Mabelah C-F1-P064 9.2 41.9 10.1 45.7 11.3 51.4 12.8 58.2
Mabelah 2[G12] - A GSS [Zone 3] - System Study ResultsPrimary Substations Maximum Demand and Percentage Loading
Primary Substation P.No.Firm
Capacity(MVA)
2019 2020 2021 2022
Primary Substations Minimum Demand and Percentage Loading
Primary Substation P.No.Firm
Capacity(MVA)
2019 2020 2021 2022
MEDC Distribution System Capability Statement [2020-2022]-V1.0 108

33kV 11kV 33kV 11kV 33kV 11kV 33kV 11kV
P064 22.7 15.5 22.4 14.9 22.7 15.2 21.8 15.2
P064 22.7 15.5 22.4 14.9 22.7 15.2 21.8 15.2
P064 22.7 8.1 22.4 8.1 22.7 8.2 21.8 8.3
P060 17.9 17.8 - - - - - -
P060 17.9 17.8 - - - - - -
P060 17.7 9.5 - - - - - -
P062 17.5 14.7 16.5 14.7 17.0 14.4 17.0 14.6
P062 17.5 14.7 16.5 14.7 17.0 14.4 17.1 14.6
P062 17.5 8.1 16.5 8.2 17.0 8.0 17.1 8.1
P157 12.8 14.4 12.8 14.6 12.9 14.9 - -
P157 12.8 14.4 12.7 14.6 12.9 14.9 - -
P157 12.5 8.0 12.4 8.0 12.6 8.2 - -
P168 23.0 14.5 22.6 14.7 23.0 14.9 22.0 14.9
P168 22.9 14.5 22.6 14.7 22.9 14.9 21.9 14.9
P168 22.9 8.2 22.6 8.1 22.9 8.2 22.0 8.3
Palm Mall-B 31.5 25.0
Palm Mall-C 31.5 25.0
Mabelah South PH-4-B 25.0 20.0
Mabelah South PH-4-C 25.0 20.0
Mabelah South PH-8-A 31.5 25.0
Mabelah South PH-8-B 31.5 25.0
Mabelah South PH-8-C 31.5 25.0
Palm Mall-A 31.5 25.0
Mabelah C-B 25.0 18.4
Mabelah C-C 25.0 25.0
Mabelah Shabiya-A 25.0 18.4
Mabelah Shabiya-B 25.0 18.4
Mabelah Shabiya-C 25.0 25.0
Mabelah South PH-4-A 25.0 20.0
Primary Substation 3-Phase Fault Current Levels (kA)
Primary P.No. 33kV -Rated SC Capacity
11kV -Rated SC Capacity
2019 2020 2021 2022
Mabelah C-A 25.0 18.4
MEDC Distribution System Capability Statement [2020-2022]-V1.0 109

MW MVAr MVA % MW MVAr MVA % MW MVAr MVA % MW MVAr MVA %
Mabelah Shabiya P060 40 - - - - 32.7 10.8 34.4 86% 36.7 12.0 38.6 96% 41.3 13.6 43.5 109%
Mabelah South PH 6 P185 40 - - - - - - - - 22.4 7.4 23.6 59% 25.3 8.3 26.6 67%
Mabelah South(Upgrade) P061 40 - - - - - - - - 30.2 9.9 31.8 79% 34.0 11.2 35.8 90%
Old Mabelah P059 20 - - - - 22.9 7.5 24.1 121% 14.5 4.8 15.2 76% 16.3 5.4 17.2 86%
MW MVAr MVA % MW MVAr MVA % MW MVAr MVA % MW MVAr MVA %
Mabelah Shabiya P060 40 - - - - 6.0 2.7 6.5 16% 6.7 3.0 7.3 18% 7.5 3.4 8.3 21%
Mabelah South PH 6 P185 40 - - - - - - - - 4.1 1.9 4.5 11% 4.6 2.1 5.1 13%
Mabelah South(Upgrade) P061 40 - - - - - - - - 4.7 2.9 5.5 14% 5.3 3.3 6.2 16%
Old Mabelah P059 20 - - - - 4.8 3.0 5.6 28% 3.0 1.9 3.6 18% 3.4 2.1 4.0 20%
22.0
22.0
22.0
22.0
22.0
22.0
22.0
22.0
22.0
22.0
22.0
Max Min Max Min Max Min Max Min Max Min Max Min Max Min Max Min
P060 - - - - 99.7 99.9 101.9 104.0 99.6 99.9 101.5 103.9 99.6 99.9 101.1 103.8
P060 - - - - 99.7 99.9 101.9 104.0 99.6 99.9 101.5 103.9 99.6 99.9 101.1 103.8
P060 - - - - 99.7 99.9 101.9 104.0 99.6 99.9 101.5 103.9 99.6 99.9 101.1 103.8
P185 - - - - - - - - 99.7 99.9 102.2 104.0 99.6 99.9 101.9 104.0
P185 - - - - - - - - 99.7 99.9 102.2 104.0 99.6 99.9 101.9 104.0
P185 - - - - - - - - 99.7 99.9 102.2 104.0 99.6 99.9 101.9 104.0
P061 - - - - - - - - 99.6 99.9 101.5 103.8 99.6 99.9 101.1 103.7
P061 - - - - - - - - 99.6 99.9 101.5 103.8 99.6 99.9 101.1 103.7
P061 - - - - - - - - 99.6 99.9 101.5 103.8 99.6 99.9 101.1 103.7
P059 - - - - 98.6 99.7 100.1 103.2 99.2 99.8 101.9 103.7 99.1 99.8 101.5 103.6
P059 - - - - 98.6 99.7 100.1 103.2 99.2 99.8 101.9 103.7 99.1 99.8 101.5 103.6
Mabelah Shabiya-C
Mabelah South PH 6-A
Mabelah South PH 6-B
Mabelah South PH 6-C
Mabelah South-A
Mabelah South-B
Mabelah South-C
Old Mabelah-A
Old Mabelah-B
Primary Substations Bus Voltages
Primary P.No.
2019 2020 2021 2022
33kV (%) 11kV(%) 33kV (%) 11kV(%) 33kV (%) 11kV(%) 33kV (%) 11kV(%)
Mabelah Shabiya-A
Mabelah Shabiya-B
Old Mabelah-F1-P059 - - 12.4 56.4 7.7 35.1 8.7 39.7
Old Mabelah-F2-P059 - - 12.4 56.2 7.7 35.0 8.7 39.6
Mabelah South-F2-P061 - - - - 10.8 49.0 12.2 55.5
Mabelah South-F3-P061 - - - - 10.8 49.0 12.2 55.5
Mabelah South PH 6-F3-P185 - - - - 7.9 35.9 8.9 40.7
Mabelah South-F1-P061 - - - - 10.8 49.0 12.2 55.5
Mabelah South PH 6-F1-P185 - - - - 7.9 35.9 8.9 40.7
Mabelah South PH 6-F2-P185 - - - - 7.9 35.9 8.9 40.7
Mabelah Shabiya-F2-P060 - - 11.7 53.1 13.1 59.7 14.9 67.7
Mabelah Shabiya-F3-P060 - - 11.7 53.1 13.1 59.7 14.9 67.6
33kV Feeder Maximum Loads
Primary Rating(MVA)
2019 2020 2021 2022
MVA %Loading MVA %Loading MVA %Loading MVA %Loading
Mabelah Shabiya-F1-P060 - - 11.7 53.1 13.1 59.7 14.9 67.6
Mabelah 2[G12] - B GSS [Zone 3] - System Study ResultsPrimary Substations Maximum Demand and Percentage Loading
Primary Substation P.No.Firm
Capacity(MVA)
2019 2020 2021 2022
Primary Substations Minimum Demand and Percentage Loading
Primary Substation P.No.Firm
Capacity(MVA)
2019 2020 2021 2022
MEDC Distribution System Capability Statement [2020-2022]-V1.0 110

33kV 11kV 33kV 11kV 33kV 11kV 33kV 11kV
P060 - - 17.6 17.1 17.8 17.4 17.3 17.5
P060 - - 17.7 17.1 17.9 17.4 17.4 17.5
P060 - - 17.5 9.6 17.7 9.7 17.2 9.8
P185 - - - - 15.1 13.7 15.2 13.9
P185 - - - - 15.1 13.7 15.2 13.9
P185 - - - - 14.9 7.5 15.0 7.6
P061 - - - - 16.4 14.5 16.4 14.7
P061 - - - - 16.4 14.5 16.4 14.7
P061 - - - - 16.3 8.0 16.3 8.1
P059 - - 9.1 13.3 9.1 12.7 9.2 12.9
P059 - - 9.1 13.3 9.1 12.7 9.2 12.9
Mabelah South PH 6-B 25.0 25.0
Mabelah South PH 6-C 25.0 25.0
Mabelah South-A 25.0 18.4
Mabelah South-B 25.0 18.4
Mabelah South-C 25.0 25.0
Old Mabelah-A 25.0 18.4
Old Mabelah-B 25.0 18.4
Primary Substation 3-Phase Fault Current Levels (kA)
Primary P.No. 33kV -Rated SC Capacity
11kV -Rated SC Capacity
2019 2020 2021 2022
Mabelah Shabiya-A 25.0 18.4
Mabelah Shabiya-B 25.0 18.4
Mabelah Shabiya-C 25.0 25.0
Mabelah South PH 6-A 25.0 25.0
MEDC Distribution System Capability Statement [2020-2022]-V1.0 111

MW MVAr MVA % MW MVAr MVA % MW MVAr MVA % MW MVAr MVA %
Mabelah A P063 40 - - - - - - - - - - - - 42.4 11.5 43.9 110%
Mabelah South 9 P184 40 - - - - - - - - - - - - 21.9 7.2 23.0 58%
Mabelah South PH-7 P141 40 - - - - - - - - - - - - 33.2 10.9 35.0 87%
Mabelah South PH-8 P157 40 - - - - - - - - - - - - 38.6 12.7 40.6 102%
Manomah P067 20 - - - - - - - - - - - - 14.7 4.8 15.5 77%
Palace Communication P033 1TX - - - - - - - - - - - - 1.8 0.7 1.9 -
MW MVAr MVA % MW MVAr MVA % MW MVAr MVA % MW MVAr MVA %
Mabelah A P063 40 - - - - - - - - - - - - 3.1 0.0 3.1 8%
Mabelah South 9 P184 40 - - - - - - - - - - - - 4.0 1.8 4.4 11%
Mabelah South PH-7 P141 40 - - - - - - - - - - - - 6.4 4.2 7.6 19%
Mabelah South PH-8 P157 40 - - - - - - - - - - - - 4.2 2.0 4.6 12%
Manomah P067 20 - - - - - - - - - - - - 4.8 1.4 5.0 25%
Palace Communication P033 1TX - - - - - - - - - - - - 0.3 0.2 0.4 -
22.0
22.0
22.0
22.0
22.0
22.0
22.0
22.0
22.0
22.0
22.0
22.0
22.0
22.0
22.0
Max Min Max Min Max Min Max Min Max Min Max Min Max Min Max Min
P063 - - - - - - - - - - - - 100.5 100.5 101.1 104.8
P063 - - - - - - - - - - - - 100.5 100.5 101.1 104.8
P063 - - - - - - - - - - - - 100.5 100.5 101.1 104.8
P184 - - - - - - - - - - - - 100.8 100.6 103.5 104.7
P184 - - - - - - - - - - - - 100.8 100.6 103.5 104.7
P184 - - - - - - - - - - - - 100.8 100.6 103.5 104.7
P141 - - - - - - - - - - - - 100.2 100.4 101.9 104.3
P141 - - - - - - - - - - - - 100.2 100.4 101.9 104.3
P141 - - - - - - - - - - - - 100.2 100.4 101.9 104.3
P157 - - - - - - - - - - - - 100.6 100.5 101.8 104.5
P157 - - - - - - - - - - - - 100.6 100.5 101.8 104.5
P157 - - - - - - - - - - - - 100.6 100.5 101.8 104.5
P067 - - - - - - - - - - - - 99.4 100.2 102.0 104.2
P067 - - - - - - - - - - - - 99.4 100.2 102.0 104.2
P033 - - - - - - - - - - - - 100.7 100.5 104.5 105.0
Mabelah A-A
Mabelah A-B
Mabelah A-C
Mabelah South 9-A
Mabelah South 9-B
Mabelah South 9-C
Mabelah South PH-7-A
Mabelah South PH-7-B
Mabelah South PH-7-C
Mabelah South PH-8-A
Mabelah South PH-8-B
Mabelah South PH-8-C
Manoma 1-A
Manoma 1-B
Palace Communication
Primary Substations Bus Voltages
Primary P.No.
2019 2020 2021 2022
33kV (%) 11kV(%) 33kV (%) 11kV(%) 33kV (%) 11kV(%) 33kV (%) 11kV(%)
Palace Communication-F1-P033 - - - - - - 1.9 8.6
Manoma 1-F1-P067 - - - - - - 7.7 34.8
Manoma 1-F2-P067 - - - - - - 7.7 35.1
Mabelah South PH-8-F2-P157 - - - - - - 14.0 63.5
Mabelah South PH-8-F3-P157 - - - - - - 14.0 63.5
Mabelah South PH-7-F3-P141 - - - - - - 11.8 53.8
Mabelah South PH-8-F1-P157 - - - - - - 14.0 63.5
Mabelah South PH-7-F1-P141 - - - - - - 11.9 53.9
Mabelah South PH-7-F2-P141 - - - - - - 11.8 53.7
Mabelah South 9-F2-P184 - - - - - - 7.8 35.5
Mabelah South 9-F3-P184 - - - - - - 7.8 35.5
Mabelah A-F3-P063 - - - - - - 15.4 70.0
Mabelah South 9-F1-P184 - - - - - - 7.8 35.5
Mabelah A-F1-P063 - - - - - - 15.5 70.4
Mabelah A-F2-P063 - - - - - - 15.3 69.6
Primary Substations Minimum Demand and Percentage Loading
Primary Substation P.No.Firm
Capacity(MVA)
2019 2020 2021 2022
33kV Feeder Maximum Loads
Primary Rating(MVA)
2019 2020 2021 2022
MVA %Loading MVA %Loading MVA %Loading MVA %Loading
Primary Substations Maximum Demand and Percentage Loading
Primary Substation P.No.Firm
Capacity(MVA)
2019 2020 2021 2022
Halban GSS [Zone 3] - System Study Results
MEDC Distribution System Capability Statement [2020-2022]-V1.0 112

33kV 11kV 33kV 11kV 33kV 11kV 33kV 11kV
P063 - - - - - - 18.9 15.3
P063 - - - - - - 18.9 15.3
P063 - - - - - - 18.8 8.3
P184 - - - - - - 24.1 14.5
P184 - - - - - - 24.1 14.5
P184 - - - - - - 24.1 8.0
P141 - - - - - - 13.7 14.7
P141 - - - - - - 13.7 14.7
P141 - - - - - - 13.4 8.0
P157 - - - - - - 20.8 15.6
P157 - - - - - - 20.8 15.6
P157 - - - - - - 20.8 8.6
P067 - - - - - - 6.5 11.7
P067 - - - - - - 6.5 11.7
P033 - - - - - - 9.5 4.4
Manoma 1-A 25.0 18.4
Manoma 1-B 25.0 18.4
Palace Communication 25.0 18.4
Mabelah South PH-7-A 25.0 18.4
Mabelah South PH-7-B 25.0 18.4
Mabelah South PH-7-C 25.0 18.4
Mabelah South PH-8-A 31.5 25.0
Mabelah South PH-8-B 31.5 25.0
Mabelah South PH-8-C 31.5 25.0
Mabelah A-A 25.0 18.4
Mabelah A-B 25.0 18.4
Mabelah A-C 25.0 18.4
Mabelah South 9-A 25.0 18.4
Mabelah South 9-B 25.0 18.4
Mabelah South 9-C 25.0 18.4
Primary Substation 3-Phase Fault Current Levels (kA)
Primary P.No. 33kV -Rated SC Capacity
11kV -Rated SC Capacity
2019 2020 2021 2022
MEDC Distribution System Capability Statement [2020-2022]-V1.0 113

MW MVAr MVA % MW MVAr MVA % MW MVAr MVA % MW MVAr MVA %
Al Khoud PH-7 P154 40 34.7 12.2 36.8 92% 37.8 12.4 39.8 100% Shifted to Al Khoudh GSS
Al Khoud Shabiya P046 20 21.5 6.1 22.3 112% 23.4 6.5 24.3 122% - - - - - - - -
Al Khoud Shabiya(Upgrade) P046 40 - - - - - - - - 36.2 10.0 37.6 94% 39.4 10.8 40.8 102%
New Al Khoud P047 20 16.7 8.0 18.5 93% Shifted to Seeb-B GSS
Wadi Al Aresh P115 20 22.9 9.1 24.6 123% 17.6 5.8 18.5 92% 18.3 6.0 19.3 96% 19.0 6.2 20.0 100%
Wadi Al Lawami P117 40 37.1 10.8 38.6 97% 35.4 10.3 36.9 92% 36.9 10.8 38.4 96% 38.3 11.2 39.8 100%
Wadi Bahayis (RGO) P098 20 15.9 3.2 16.2 81% 17.0 3.5 17.4 87% 17.7 3.6 18.1 91% 18.4 3.7 18.8 94%
MW MVAr MVA % MW MVAr MVA % MW MVAr MVA % MW MVAr MVA %
Al Khoud PH-7 P154 40 3.8 2.0 4.3 11% 4.1 2.2 4.7 12% Shifted to Al Khoudh GSS
Al Khoud Shabiya P046 20 3.5 1.2 3.7 19% 3.8 1.3 4.0 20% - - - - - - - -
Al Khoud Shabiya(Upgrade) P046 40 - - - - - - - - 5.9 2.0 6.2 16% 6.4 2.2 6.8 17%
New Al Khoud P047 20 3.1 0.0 3.1 16% Shifted to Seeb-B GSS
Wadi Al Aresh P115 20 3.7 2.4 4.4 22% 2.8 1.8 3.3 17% 2.9 1.9 3.4 17% 3.0 1.9 3.6 18%
Wadi Al Lawami P117 40 4.5 2.4 5.1 13% 4.3 2.3 4.9 12% 4.5 2.4 5.1 13% 4.6 2.5 5.3 13%
Wadi Bahayis (RGO) P098 20 3.5 2.3 4.2 21% 3.8 2.5 4.5 23% 3.9 2.6 4.7 23% 4.1 2.7 4.9 24%
22.0
22.0
22.0
22.0
22.0
22.0
22.0
22.0
22.0
22.0
22.0
22.0
22.0
22.0
22.0
Wadi Bahayis (RGO)-F1-P098 8.3 37.7 8.8 40.0 9.2 41.7 9.6 43.3
Wadi Bahayis (RGO)-F2-P098 8.3 37.4 8.8 39.7 9.2 41.4 9.5 43.0
Wadi Al Lawami-F2-P117 12.5 56.6 12.6 57.1 13.2 59.7 13.7 61.9
Wadi Al Lawami-F3-P117 14.8 66.8 12.6 57.1 13.2 59.7 13.7 61.9
Wadi Al Aresh-F2-P115 12.7 57.7 9.4 42.5 9.8 44.4 10.2 46.1
Wadi Al Lawami-F1-P117 12.5 56.6 12.6 57.2 13.2 59.7 13.7 61.9
New Al Khoud-F2-P047 13.6 61.4 - - - - - -
Wadi Al Aresh-F1-P115 12.6 57.1 9.3 42.2 9.7 44.0 10.1 45.7
Al Khoud Shabiya-F3-P046 - - - - 12.9 58.5 14.1 63.8
New Al Khoud-F1-P047 5.8 26.3 - - - - - -
Al Khoud Shabiya-F1-P046 11.5 52.0 12.6 56.8 13.0 58.6 14.1 64.0
Al Khoud Shabiya-F2-P046 11.7 52.9 12.8 57.7 13.2 59.5 14.4 65.0
Al Khoud PH-7-F2-P154 15.5 69.9 13.7 62.0 - - - -
Al Khoud PH-7-F3-P154 7.3 33.2 13.6 61.7 - - - -
33kV Feeder Maximum Loads
Primary Rating(MVA)
2019 2020 2021 2022
MVA %Loading MVA %Loading MVA %Loading MVA %Loading
Al Khoud PH-7-F1-P154 15.3 69.2 13.6 61.3 - - - -
Seeb[GP08] - A GSS [Zone 3] - System Study ResultsPrimary Substations Maximum Demand and Percentage Loading
Primary Substation P.No.Firm
Capacity(MVA)
2019 2020 2021 2022
Primary Substations Minimum Demand and Percentage Loading
Primary Substation P.No.Firm
Capacity(MVA)
2019 2020 2021 2022
MEDC Distribution System Capability Statement [2020-2022]-V1.0 114

Max Min Max Min Max Min Max Min Max Min Max Min Max Min Max Min
P154 99.1 99.9 99.4 103.9 99.2 99.9 100.3 103.9 - - - - - - - -
P154 99.1 99.9 99.4 103.9 99.2 99.9 100.3 103.9 - - - - - - - -
P154 99.6 100.0 102.2 104.2 99.2 99.9 100.3 103.9 - - - - - - - -
P046 98.8 99.8 100.7 103.9 98.7 99.9 100.3 104.1 98.7 99.8 100.1 103.9 98.5 99.8 99.7 103.8
P046 98.8 99.8 100.7 103.9 98.7 99.9 100.3 104.1 98.7 99.8 100.1 103.9 98.5 99.8 99.7 103.8
P046 - - - - - - - - 98.7 99.8 100.1 103.9 98.5 99.8 99.6 103.8
P047 99.7 100.0 102.3 104.4 - - - - - - - - - - - -
P047 99.2 100.0 99.2 104.4 - - - - - - - - - - - -
P115 99.0 99.8 99.9 103.5 99.3 99.9 101.6 103.8 99.3 99.9 101.4 103.8 99.2 99.9 101.3 103.7
P115 99.0 99.8 99.9 103.5 99.3 99.9 101.6 103.8 99.3 99.9 101.4 103.8 99.3 99.9 101.3 103.7
P117 99.9 100.0 101.5 104.0 99.9 100.0 101.5 104.0 99.9 100.0 101.3 104.0 99.9 100.0 101.2 103.9
P117 99.9 100.0 101.5 104.0 99.9 100.0 101.5 104.0 99.9 100.0 101.3 104.0 99.9 100.0 101.2 103.9
P117 99.9 100.0 100.9 103.9 99.9 100.0 101.5 104.0 99.9 100.0 101.3 104.0 99.9 100.0 101.2 103.9
P098 99.9 100.0 103.0 103.7 99.9 100.0 102.9 103.6 99.9 100.0 102.8 103.6 99.9 100.0 102.8 103.5
P098 99.9 100.0 103.0 103.7 99.9 100.0 102.9 103.6 99.9 100.0 102.8 103.6 99.9 100.0 102.8 103.5
33kV 11kV 33kV 11kV 33kV 11kV 33kV 11kV
P154 14.2 14.8 14.1 14.6 - - - -
P154 14.2 14.8 14.1 14.6 - - - -
P154 13.8 7.5 13.8 8.0 - - - -
P046 9.6 13.2 9.5 13.3 9.5 13.3 9.5 13.5
P046 9.6 13.2 9.6 13.3 9.5 13.3 9.5 13.5
P046 - - - - 9.0 7.2 9.0 7.3
P047 12.8 7.2 - - - - - -
P047 12.9 7.8 - - - - - -
P115 11.9 14.2 11.8 13.7 11.6 13.7 11.6 13.7
P115 12.3 14.2 12.2 13.7 12.0 13.7 12.0 13.7
P117 22.2 15.0 22.1 15.0 21.6 15.0 21.5 15.1
P117 22.3 15.0 22.1 15.0 21.6 15.0 21.5 15.1
P117 22.3 8.4 22.1 8.3 21.6 8.3 21.5 8.3
P098 21.7 14.3 21.5 14.3 21.0 14.3 21.0 14.4
P098 21.6 14.3 21.5 14.3 21.0 14.3 20.9 14.4
Wadi Bahayis (RGO)-A 25.0 20.0
Wadi Bahayis (RGO)-B 25.0 20.0
New Al Khoud-B 25.0 20.0
Wadi Al Aresh-A 25.0 18.4
Wadi Al Aresh-B 25.0 18.4
Wadi Al Lawami-A 25.0 20.0
Wadi Al Lawami-B 25.0 20.0
Wadi Al Lawami-C 25.0 25.0
Al Khoud PH-7-B 25.0 25.0
Al Khoud PH-7-C 25.0 25.0
Al Khoud Shabiya-A 25.0 18.4
Al Khoud Shabiya-B 25.0 18.4
Al Khoud Shabiya-C 25.0 25.0
New Al Khoud-A 25.0 20.0
Primary Substation 3-Phase Fault Current Levels (kA)
Primary P.No. 33kV -Rated SC Capacity
11kV -Rated SC Capacity
2019 2020 2021 2022
Al Khoud PH-7-A 25.0 25.0
Al Khoud PH-7-C
Al Khoud Shabiya-A
Al Khoud Shabiya-B
Al Khoud Shabiya-C
New Al Khoud-A
New Al Khoud-B
Wadi Al Aresh-A
Wadi Al Aresh-B
Wadi Al Lawami-A
Wadi Al Lawami-B
Wadi Al Lawami-C
Wadi Bahayis (RGO)-A
Wadi Bahayis (RGO)-B
Primary Substations Bus Voltages
Primary P.No.
2019 2020 2021 2022
33kV (%) 11kV(%) 33kV (%) 11kV(%) 33kV (%) 11kV(%) 33kV (%) 11kV(%)
Al Khoud PH-7-A
Al Khoud PH-7-B
MEDC Distribution System Capability Statement [2020-2022]-V1.0 115

MW MVAr MVA % MW MVAr MVA % MW MVAr MVA % MW MVAr MVA %
Al Hail South 2 P153 40 23.5 6.4 24.4 61% 26.0 7.6 27.1 68% 26.8 7.8 28.0 70% 27.4 8.0 28.5 71%
New Al Khoud P047 20 - - - - 18.2 6.0 19.2 96% 16.3 5.3 17.1 86% 17.7 5.8 18.6 93%
Seeb Grid GP08 20 18.9 7.5 20.3 102% 16.0 5.2 16.8 84% 16.7 5.5 17.5 88% 17.3 5.7 18.2 91%
Seeb05(Boulevard) P186 40 - - - - 20.5 6.7 21.6 54% 24.4 8.0 25.7 64% 27.3 9.0 28.7 72%
Sultan School P029 20 21.4 9.2 23.3 117% 19.8 6.5 20.8 104% 20.4 6.7 21.5 107% 20.8 6.8 21.9 110%
MW MVAr MVA % MW MVAr MVA % MW MVAr MVA % MW MVAr MVA %
Al Hail South 2 P153 40 3.8 2.4 4.5 11% 4.2 2.7 5.0 13% 4.4 2.8 5.2 13% 4.4 2.8 5.3 13%
New Al Khoud P047 20 - - - - 3.2 0.0 3.2 16% 2.9 0.0 2.9 14% 3.1 0.0 3.1 16%
Seeb Grid GP08 20 11.5 1.5 11.6 58% 9.5 1.3 9.6 48% 9.9 1.3 10.0 50% 10.3 1.4 10.4 52%
Seeb05(Boulevard) P186 40 - - - - 3.5 1.6 3.9 10% 4.1 1.9 4.5 11% 4.5 2.0 4.9 12%
Sultan School P029 20 3.5 2.1 4.1 21% 3.1 1.9 3.7 18% 3.2 2.0 3.8 19% 3.3 2.0 3.9 19%
22.0
22.0
22.0
22.0
22.0
22.0
22.0
22.0
22.0
22.0
22.0
22.0
Max Min Max Min Max Min Max Min Max Min Max Min Max Min Max Min
P153 99.7 99.9 102.8 104.0 99.6 99.9 102.0 103.8 99.5 99.9 101.9 103.8 99.5 99.9 101.9 103.8
P153 99.7 99.9 102.8 104.0 99.6 99.9 102.0 103.8 99.5 99.9 101.9 103.8 99.5 99.9 101.9 103.8
P153 99.4 99.9 101.1 103.6 99.6 99.9 102.0 103.8 99.5 99.9 101.9 103.8 99.5 99.9 101.9 103.8
P047 - - - - 99.5 100.0 101.6 104.4 99.5 100.0 101.9 104.5 99.5 100.0 101.7 104.4
P047 - - - - 99.5 100.0 101.6 104.4 99.5 100.0 101.9 104.5 99.5 100.0 101.7 104.4
GP08 100.0 100.0 101.8 103.8 100.0 100.0 102.6 104.0 100.0 100.0 102.5 103.9 100.0 100.0 102.4 103.9
GP08 100.0 100.0 101.8 103.8 100.0 100.0 102.6 104.0 100.0 100.0 102.5 103.9 100.0 100.0 102.4 103.9
P186 - - - - 99.9 100.0 102.7 104.1 99.9 100.0 102.3 104.1 99.9 100.0 102.0 104.0
P186 - - - - 99.9 100.0 102.7 104.1 99.9 100.0 102.3 104.1 99.9 100.0 102.0 104.0
P186 - - - - 99.9 100.0 102.7 104.1 99.9 100.0 102.3 104.1 99.9 100.0 102.0 104.0
P029 99.7 99.9 100.5 103.7 99.7 99.9 101.6 103.8 99.7 99.9 101.5 103.8 99.7 99.9 101.4 103.8
P029 99.7 99.9 100.5 103.7 99.7 99.9 101.6 103.8 99.7 99.9 101.5 103.8 99.7 99.9 101.4 103.8
Al Hail South 2-C
New Al Khoud-A
New Al Khoud-B
Seeb Grid-A
Seeb Grid-B
Seeb05 (Boulevard)-A
Seeb05 (Boulevard)-B
Seeb05 (Boulevard)-C
Sultan School-A
Sultan School-B
Primary Substations Bus Voltages
Primary P.No.
2019 2020 2021 2022
33kV (%) 11kV(%) 33kV (%) 11kV(%) 33kV (%) 11kV(%) 33kV (%) 11kV(%)
Al Hail South 2-A
Al Hail South 2-B
Sultan School-F2-P029 11.9 53.6 10.5 47.6 10.9 49.1 11.1 50.1
Seeb05 (Boulevard)-F3-P186 - - 7.3 33.0 8.7 39.4 9.8 44.2
Sultan School-F1-P029 12.1 54.9 10.8 48.7 11.1 50.3 11.3 51.3
Seeb05 (Boulevard)-F1-P186 - - 7.3 33.0 8.7 39.4 9.8 44.2
Seeb05 (Boulevard)-F2-P186 - - 7.3 33.0 8.7 39.4 9.8 44.2
Seeb Grid-F1-GP08 10.4 47.2 8.6 38.8 8.9 40.5 9.3 41.9
Seeb Grid-F2-GP08 10.5 47.4 8.6 38.9 9.0 40.6 9.3 42.1
New Al Khoud-F1-P047 - - 9.9 44.6 8.8 39.7 9.6 43.3
New Al Khoud-F2-P047 - - 9.9 44.6 8.8 39.7 9.6 43.3
Al Hail South 2-F2-P153 6.4 29.1 9.1 41.1 9.4 42.5 9.6 43.4
Al Hail South 2-F3-P153 12.0 54.1 9.1 41.2 9.4 42.5 9.6 43.4
33kV Feeder Maximum Loads
Primary Rating(MVA)
2019 2020 2021 2022
MVA %Loading MVA %Loading MVA %Loading MVA %Loading
Al Hail South 2-F1-P153 6.4 29.1 9.1 41.2 9.4 42.6 9.6 43.4
Seeb[GP08] - B GSS [Zone 3] - System Study ResultsPrimary Substations Maximum Demand and Percentage Loading
Primary Substation P.No.Firm
Capacity(MVA)
2019 2020 2021 2022
Primary Substations Minimum Demand and Percentage Loading
Primary Substation P.No.Firm
Capacity(MVA)
2019 2020 2021 2022
MEDC Distribution System Capability Statement [2020-2022]-V1.0 116

33kV 11kV 33kV 11kV 33kV 11kV 33kV 11kV
P153 12.7 13.0 13.3 13.6 13.3 13.6 14.0 13.9
P153 12.7 13.0 13.3 13.6 13.4 13.6 14.1 13.9
P153 12.6 7.7 13.1 7.5 13.2 7.5 13.8 7.6
P047 - - 11.9 7.4 11.9 7.3 12.5 7.4
P047 - - 11.9 7.4 11.9 7.3 12.5 7.4
GP08 20.1 14.9 21.6 14.8 21.7 14.9 23.6 15.2
GP08 20.1 14.9 21.6 14.8 21.7 14.9 23.6 15.2
P186 - - 18.6 13.8 18.7 14.0 20.2 14.4
P186 - - 18.6 13.8 18.7 14.0 20.2 14.4
P186 - - 18.6 7.7 18.7 7.8 20.1 8.0
P029 15.5 14.0 16.3 14.1 16.4 14.1 17.4 14.4
P029 15.5 14.0 16.3 14.1 16.4 14.1 17.4 14.4
Seeb Grid-B 25.0 20.0
Seeb05 (Boulevard)-A 25.0 25.0
Seeb05 (Boulevard)-B 25.0 25.0
Seeb05 (Boulevard)-C 25.0 25.0
Sultan School-A 25.0 20.0
Sultan School-B 25.0 20.0
Al Hail South 2-A 25.0 25.0
Al Hail South 2-B 25.0 25.0
Al Hail South 2-C 25.0 25.0
New Al Khoud-A 25.0 20.0
New Al Khoud-B 25.0 20.0
Seeb Grid-A 25.0 20.0
Primary Substation 3-Phase Fault Current Levels (kA)
Primary P.No. 33kV -Rated SC Capacity
11kV -Rated SC Capacity
2019 2020 2021 2022
MEDC Distribution System Capability Statement [2020-2022]-V1.0 117

MW MVAr MVA % MW MVAr MVA % MW MVAr MVA % MW MVAr MVA %
Al Hail North 2 P028 20 19.1 5.4 19.8 99% 19.5 5.3 20.2 101% 20.1 5.5 20.8 104% 20.5 5.6 21.2 106%
Al Khoud PH-3 P048 20 19.2 2.4 19.3 97% 20.9 2.1 21.0 105% 17.3 1.8 17.3 87% 18.8 1.9 18.9 94%
Mawaleh C P072 20 15.5 2.5 15.7 79% 16.0 2.6 16.3 81% 16.6 2.7 16.9 84% 17.1 2.8 17.3 87%
Mawaleh South Grid GP05 20 21.8 10.8 24.3 122% 17.4 5.7 18.3 92% 18.0 5.9 19.0 95% 18.5 6.1 19.5 97%
Royal Flight P100 20 9.5 3.7 10.2 51% 9.5 3.1 10.0 50% 9.5 3.1 10.0 50% 9.5 3.1 10.0 50%
Rusail B P101 10 Standby PSS
MW MVAr MVA % MW MVAr MVA % MW MVAr MVA % MW MVAr MVA %
Al Hail North 2 P028 20 3.2 2.2 3.9 20% 3.3 2.3 4.0 20% 3.4 2.3 4.1 21% 3.4 2.4 4.2 21%
Al Khoud PH-3 P048 20 3.0 0.0 3.0 15% 3.3 0.0 3.3 16% 2.7 0.0 2.7 13% 2.9 0.0 2.9 15%
Mawaleh C P072 20 3.0 0.0 3.0 15% 3.1 0.0 3.1 16% 3.2 0.0 3.2 16% 3.3 0.0 3.3 17%
Mawaleh South Grid GP05 20 5.3 3.8 6.5 33% 4.0 2.8 4.9 24% 4.1 2.9 5.1 25% 4.3 3.0 5.2 26%
Royal Flight P100 20 1.4 0.5 1.5 8% 1.4 0.5 1.5 7% 1.4 0.5 1.5 7% 1.4 0.5 1.5 7%
Rusail B P101 10 Standby PSS
22.0
22.0
22.0
22.0
22.0
22.0
22.0
22.0
22.0
22.0
Max Min Max Min Max Min Max Min Max Min Max Min Max Min Max Min
P028 99.4 99.9 101.6 103.6 99.4 99.9 101.5 103.6 99.3 99.9 101.4 103.6 99.3 99.9 101.4 103.6
P028 99.4 99.9 101.6 103.6 99.4 99.9 101.5 103.6 99.3 99.9 101.4 103.6 99.3 99.9 101.4 103.6
P048 99.8 100.0 103.0 104.5 99.8 100.0 102.8 104.5 99.8 100.0 103.2 104.5 99.8 100.0 103.0 104.5
P048 99.8 100.0 103.0 104.5 99.8 100.0 102.8 104.5 99.8 100.0 103.2 104.5 99.8 100.0 103.0 104.5
P072 99.8 100.0 103.3 104.5 99.8 100.0 103.3 104.5 99.8 100.0 103.2 104.5 99.8 100.0 103.2 104.5
P072 99.8 100.0 103.3 104.5 99.8 100.0 103.3 104.5 99.8 100.0 103.2 104.5 99.8 100.0 103.2 104.5
GP05 100.0 100.0 100.8 103.4 100.0 100.0 102.5 103.7 100.0 100.0 102.4 103.6 100.0 100.0 102.3 103.6
GP05 100.0 100.0 100.8 103.4 100.0 100.0 102.5 103.7 100.0 100.0 102.4 103.6 100.0 100.0 102.3 103.6
P100 99.7 100.0 102.9 104.3 99.8 100.0 103.1 104.3 99.8 100.0 103.1 104.3 99.8 100.0 103.1 104.3
P100 99.7 100.0 102.9 104.3 99.8 100.0 103.1 104.3 99.8 100.0 103.1 104.3 99.8 100.0 103.1 104.3
Al Hail North 2-A
Al Hail North 2-B
Al Khoud PH-3-A
Al Khoud PH-3-B
Mawaleh C-A
Mawaleh C-B
Mawaleh South Grid-A
Mawaleh South Grid-B
Royal Flight-A
Royal Flight-B
Primary Substations Bus Voltages
Primary P.No.
2019 2020 2021 2022
33kV (%) 11kV(%) 33kV (%) 11kV(%) 33kV (%) 11kV(%) 33kV (%) 11kV(%)
Royal Flight-F1-P100 5.0 22.7 4.9 22.3 4.9 22.3 4.9 22.3
Royal Flight-F2-P100 5.0 22.7 4.9 22.3 4.9 22.3 4.9 22.3
Mawaleh South Grid-F1-GP05 12.6 57.1 9.3 42.4 9.7 44.0 9.9 45.2
Mawaleh South Grid-F2-GP05 12.6 57.4 9.4 42.6 9.7 44.2 10.0 45.4
Mawaleh C-F1-P072 7.9 35.8 8.1 37.0 8.5 38.4 8.7 39.5
Mawaleh C-F2-P072 7.9 36.0 8.2 37.3 8.5 38.7 8.7 39.7
Al Khoud PH-3-F1-P048 9.9 44.9 10.7 48.9 8.8 40.2 9.6 43.7
Al Khoud PH-3-F2-P048 9.8 44.5 10.7 48.5 8.8 39.8 9.5 43.4
Al Hail North 2-F1-P028 10.0 45.6 10.2 46.5 10.5 48.0 10.8 49.0
Al Hail North 2-F2-P028 10.1 46.0 10.3 46.9 10.6 48.4 10.9 49.4
Primary Substations Minimum Demand and Percentage Loading
Primary Substation P.No.Firm
Capacity(MVA)
2019 2020 2021 2022
33kV Feeder Maximum Loads
Primary Rating(MVA)
2019 2020 2021 2022
MVA %Loading MVA %Loading MVA %Loading MVA %Loading
Mawaleh South[GP05] - A GSS [Zone 3] - System Study ResultsPrimary Substations Maximum Demand and Percentage Loading
Primary Substation P.No.Firm
Capacity(MVA)
2019 2020 2021 2022
MEDC Distribution System Capability Statement [2020-2022]-V1.0 118

33kV 11kV 33kV 11kV 33kV 11kV 33kV 11kV
P028 12.8 13.8 12.7 13.8 12.7 13.8 12.3 13.7
P028 12.7 13.8 12.7 13.8 12.7 13.8 12.3 13.7
P048 17.6 14.4 17.6 14.5 17.5 14.2 16.8 14.2
P048 17.7 14.4 17.6 14.5 17.5 14.2 16.8 14.2
P072 18.0 13.9 18.0 13.9 17.9 14.0 17.2 13.8
P072 18.0 13.9 18.0 13.9 17.9 14.0 17.2 13.8
GP05 23.8 16.2 23.7 15.8 23.5 15.8 22.2 15.6
GP05 23.8 16.2 23.7 15.8 23.5 15.8 22.2 15.6
P100 13.7 13.3 13.7 13.3 13.6 13.3 13.2 13.1
P100 13.7 13.3 13.7 13.3 13.6 13.3 13.2 13.1
Mawaleh South Grid-A 25.0 18.4
Mawaleh South Grid-B 25.0 18.4
Royal Flight-A 25.0 18.4
Royal Flight-B 25.0 18.4
Al Hail North 2-A 25.0 18.4
Al Hail North 2-B 25.0 18.4
Al Khoud PH-3-A 25.0 20.0
Al Khoud PH-3-B 25.0 20.0
Mawaleh C-A 25.0 20.0
Mawaleh C-B 25.0 20.0
Primary Substation 3-Phase Fault Current Levels (kA)
Primary P.No. 33kV -Rated SC Capacity
11kV -Rated SC Capacity
2019 2020 2021 2022
MEDC Distribution System Capability Statement [2020-2022]-V1.0 119

MW MVAr MVA % MW MVAr MVA % MW MVAr MVA % MW MVAr MVA %
Al Hail South 1 P030 20 20.5 5.6 21.3 107% 20.9 5.9 21.7 109% 21.6 6.1 22.4 112% 22.0 6.2 22.9 114%
Al Khoud PH-6 P049 20 25.1 3.6 25.3 127% 27.3 3.9 27.6 138% - - - - - - - -
Mawaleh A P070 40 27.6 10.5 29.5 74% 28.6 9.4 30.1 75% - - - - - - - -
Mawaleh B P071 40 32.5 11.5 34.5 86% 33.7 11.1 35.4 89% 34.9 11.5 36.7 92% 35.8 11.8 37.7 94%
Mawaleh South05 P148 40 18.8 0.0 18.8 47% 24.7 0.0 24.7 62% 25.6 0.0 25.6 64% 26.3 0.0 26.3 66%
MW MVAr MVA % MW MVAr MVA % MW MVAr MVA % MW MVAr MVA %
Al Hail South 1 P030 20 3.5 1.7 3.9 20% 3.6 1.8 4.0 20% 3.7 1.8 4.1 21% 3.8 1.8 4.2 21%
Al Khoud PH-6 P049 20 4.7 2.0 5.1 26% 5.1 2.2 5.6 28% - - - - - - - -
Mawaleh A P070 40 4.2 0.9 4.3 11% 4.3 0.9 4.4 11% - - - - - - - -
Mawaleh B P071 40 4.8 1.0 4.9 12% 4.9 1.0 5.0 13% 5.1 1.0 5.2 13% 5.2 1.1 5.4 13%
Mawaleh South05 P148 40 1.0 0.5 1.1 3% 1.3 0.6 1.4 4% 1.4 0.6 1.5 4% 1.4 0.6 1.5 4%
22.0
22.0
22.0
22.0
22.0
22.0
22.0
22.0
22.0
22.0
22.0
22.0
22.0
Max Min Max Min Max Min Max Min Max Min Max Min Max Min Max Min
P030 99.6 99.9 101.6 103.9 99.6 99.9 101.5 103.8 99.6 99.9 101.4 103.8 99.6 99.9 101.3 103.8
P030 99.6 99.9 101.6 103.9 99.6 99.9 101.5 103.8 99.6 99.9 101.4 103.8 99.6 99.9 101.3 103.8
P049 99.1 99.8 101.8 103.6 99.0 99.8 101.1 103.5 - - - - - - - -
P049 99.1 99.8 101.8 103.6 99.0 99.8 101.1 103.5 - - - - - - - -
P070 99.6 100.0 100.2 104.2 99.8 100.0 102.1 104.3 - - - - - - - -
P070 99.9 100.0 102.5 104.4 99.9 100.0 102.2 104.3 - - - - - - - -
P070 100.0 100.0 102.8 104.4 99.9 100.0 102.3 104.3 - - - - - - - -
P071 99.8 100.0 100.7 104.2 99.8 100.0 101.4 104.3 99.8 100.0 101.3 104.3 99.8 100.0 101.2 104.2
P071 99.8 100.0 102.0 104.3 99.8 100.0 101.6 104.3 99.8 100.0 101.5 104.3 99.8 100.0 101.4 104.3
P071 99.8 100.0 101.6 104.3 99.8 100.0 101.7 104.3 99.8 100.0 101.6 104.3 99.8 100.0 101.5 104.3
P148 99.9 100.0 104.3 104.5 99.9 100.0 104.1 104.4 99.9 100.0 104.0 104.4 99.9 100.0 104.0 104.4
P148 99.9 100.0 104.4 104.5 99.9 100.0 104.1 104.4 99.9 100.0 104.0 104.4 99.9 100.0 104.0 104.4
P148 99.8 100.0 103.8 104.3 99.9 100.0 104.1 104.4 99.9 100.0 104.0 104.4 99.9 100.0 104.0 104.4
Al Khoud PH-6-A
Al Khoud PH-6-B
Mawaleh A-A
Mawaleh A-B
Mawaleh A-C
Mawaleh B-A
Mawaleh B-B
Mawaleh B-C
Mawaleh South 5-A
Mawaleh South 5-B
Mawaleh South 5-C
Primary Substations Bus Voltages
Primary P.No.
2019 2020 2021 2022
33kV (%) 11kV(%) 33kV (%) 11kV(%) 33kV (%) 11kV(%) 33kV (%) 11kV(%)
AL Hail South 1-A
AL Hail South 1-B
Mawaleh South 5-F2-P148 3.8 17.5 8.2 37.4 8.5 38.8 8.8 39.8
Mawaleh South 5-F3-P148 11.2 50.8 8.3 37.6 8.6 39.0 8.8 40.0
Mawaleh B-F3-P071 11.8 53.7 12.1 54.9 12.5 57.0 12.9 58.5
Mawaleh South 5-F1-P148 4.0 18.0 8.3 37.7 8.6 39.1 8.8 40.1
Mawaleh B-F1-P071 13.9 63.2 12.1 55.1 12.6 57.2 12.9 58.8
Mawaleh B-F2-P071 9.8 44.8 12.1 55.0 12.6 57.1 12.9 58.6
Mawaleh A-F2-P070 7.8 35.5 10.2 46.5 - - - -
Mawaleh A-F3-P070 7.4 33.5 10.2 46.5 - - - -
Al Khoud PH-6-F2-P049 13.0 59.0 14.3 65.0 - - - -
Mawaleh A-F1-P070 15.4 70.2 10.2 46.5 - - - -
AL Hail South 1-F2-P030 10.8 49.3 11.1 50.5 11.5 52.1 11.7 53.2
Al Khoud PH-6-F1-P049 12.7 57.9 14.0 63.8 - - - -
33kV Feeder Maximum Loads
Primary Rating(MVA)
2019 2020 2021 2022
MVA %Loading MVA %Loading MVA %Loading MVA %Loading
AL Hail South 1-F1-P030 10.8 49.3 11.1 50.5 11.5 52.1 11.7 53.2
Mawaleh South[GP05] - B GSS [Zone 3] - System Study ResultsPrimary Substations Maximum Demand and Percentage Loading
Primary Substation P.No.Firm
Capacity(MVA)
2019 2020 2021 2022
Primary Substations Minimum Demand and Percentage Loading
Primary Substation P.No.Firm
Capacity(MVA)
2019 2020 2021 2022
MEDC Distribution System Capability Statement [2020-2022]-V1.0 120

33kV 11kV 33kV 11kV 33kV 11kV 33kV 11kV
P030 16.1 14.2 16.3 14.3 15.7 14.2 15.4 14.1
P030 16.1 14.2 16.3 14.3 15.7 14.2 15.4 14.1
P049 11.9 14.0 12.2 16.2 - - - -
P049 11.9 14.0 12.2 16.2 - - - -
P070 18.6 9.1 18.8 8.7 - - - -
P070 21.6 8.6 21.5 8.8 - - - -
P070 23.3 9.0 23.8 9.3 - - - -
P071 20.2 8.6 20.5 8.5 19.5 8.4 19.0 8.4
P071 19.4 8.6 19.3 8.8 19.2 8.8 19.0 8.8
P071 20.1 9.2 20.4 9.2 19.4 9.2 19.0 9.2
P148 18.9 7.7 19.3 14.5 18.4 14.4 18.0 14.4
P148 18.9 7.6 19.3 14.5 18.4 14.4 18.0 14.4
P148 19.0 8.3 19.3 8.1 18.4 8.0 18.0 8.0
Mawaleh B-A 25.0 18.4
Mawaleh B-B 25.0 18.4
Mawaleh B-C 25.0 25.0
Mawaleh South 5-A 25.0 25.0
Mawaleh South 5-B 25.0 25.0
Mawaleh South 5-C 25.0 25.0
AL Hail South 1-B 25.0 25.0
Al Khoud PH-6-A 25.0 20.0
Al Khoud PH-6-B 25.0 20.0
Mawaleh A-A 25.0 18.4
Mawaleh A-B 25.0 18.4
Mawaleh A-C 25.0 25.0
Primary Substation 3-Phase Fault Current Levels (kA)
Primary P.No. 33kV -Rated SC Capacity
11kV -Rated SC Capacity
2019 2020 2021 2022
AL Hail South 1-A 25.0 25.0
MEDC Distribution System Capability Statement [2020-2022]-V1.0 121

MW MVAr MVA % MW MVAr MVA % MW MVAr MVA % MW MVAr MVA %
Al Khoud PH-6 P049 20 - - - - - - - - 13.3 4.4 14.0 70% 14.5 4.8 15.3 76%
Al Khoud PH-7 P154 40 - - - - - - - - 41.0 13.5 43.1 108% 44.5 14.6 46.9 117%
Al Khoud Shabiya(B) P187 20 - - - - - - - - 10.5 3.5 11.1 55% 11.4 3.8 12.0 60%
Mawaleh A P070 40 - - - - - - - - 29.6 9.7 31.2 78% 30.4 10.0 32.0 80%
MW MVAr MVA % MW MVAr MVA % MW MVAr MVA % MW MVAr MVA %
Al Khoud PH-6 P049 20 - - - - - - - - 2.6 1.1 2.8 14% 2.8 1.2 3.1 15%
Al Khoud PH-7 P154 40 - - - - - - - - 4.5 2.4 5.0 13% 4.8 2.6 5.5 14%
Al Khoud Shabiya(B) P187 20 - - - - - - - - 1.9 0.9 2.1 11% 2.1 0.9 2.3 11%
Mawaleh A P070 40 - - - - - - - - 4.4 1.0 4.5 11% 4.6 1.0 4.7 12%
22.0
22.0
22.0
22.0
22.0
22.0
22.0
22.0
22.0
22.0
Max Min Max Min Max Min Max Min Max Min Max Min Max Min Max Min
P049 - - - - - - - - 100.5 100.8 104.2 105.0 100.2 100.8 103.8 104.9
P049 - - - - - - - - 100.5 100.8 104.2 105.0 100.2 100.8 103.8 104.9
P154 - - - - - - - - 100.3 100.8 101.1 104.8 100.0 100.8 100.4 104.8
P154 - - - - - - - - 100.3 100.8 101.1 104.8 100.0 100.8 100.4 104.8
P154 - - - - - - - - 100.3 100.8 101.1 104.8 100.0 100.8 100.4 104.8
P187 - - - - - - - - 100.5 100.8 103.7 105.1 100.2 100.8 103.3 105.0
P187 - - - - - - - - 100.5 100.8 103.7 105.1 100.2 100.8 103.3 105.0
P070 - - - - - - - - 100.6 100.9 102.8 105.2 100.3 100.8 102.5 105.2
P070 - - - - - - - - 100.6 100.9 102.8 105.2 100.3 100.8 102.5 105.2
P070 - - - - - - - - 100.6 100.9 102.9 105.2 100.3 100.8 102.6 105.2
33kV 11kV 33kV 11kV 33kV 11kV 33kV 11kV
P049 - - - - 13.2 13.4 12.8 13.3
P049 - - - - 13.2 13.4 12.8 13.3
P154 - - - - 16.6 15.1 16.0 15.1
P154 - - - - 16.6 15.1 16.0 15.1
P154 - - - - 16.5 8.3 15.9 8.3
P187 - - - - 13.2 13.1 12.8 13.0
P187 - - - - 13.2 13.1 12.8 13.0
P070 - - - - 18.9 15.7 18.1 15.5
P070 - - - - 18.9 15.7 18.1 15.5
P070 - - - - 18.8 9.0 18.0 9.0
Al Khoud Shabiya(B)-B 25.0 25.0
Mawaleh A-A 25.0 18.4
Mawaleh A-B 25.0 18.4
Mawaleh A-C 25.0 25.0
Al Khoud PH-6-A 25.0 20.0
Al Khoud PH-6-B 25.0 20.0
Al Khoud PH-7-A 25.0 25.0
Al Khoud PH-7-B 25.0 25.0
Al Khoud PH-7-C 25.0 25.0
Al Khoud Shabiya(B)-A 25.0 25.0
Al Khoud PH-7-A
Al Khoud PH-7-B
Al Khoud PH-7-C
Al Khoud Shabiya(B)-A
Al Khoud Shabiya(B)-B
Mawaleh A-A
Mawaleh A-B
Mawaleh A-C
Primary Substation 3-Phase Fault Current Levels (kA)
Primary P.No. 33kV -Rated SC Capacity
11kV -Rated SC Capacity
2019 2020 2021 2022
Primary Substations Bus Voltages
Primary P.No.
2019 2020 2021 2022
33kV (%) 11kV(%) 33kV (%) 11kV(%) 33kV (%) 11kV(%) 33kV (%) 11kV(%)
Al Khoud PH-6-A
Al Khoud PH-6-B
Mawaleh A-F3-P070 - - - - 10.6 48.1 10.9 49.4
Mawaleh A-F1-P070 - - - - 10.7 48.4 10.9 49.8
Mawaleh A-F2-P070 - - - - 10.5 47.8 10.8 49.1
Al Khoud Shabiya(B)-F1-P187 - - - - 5.4 24.8 5.9 27.0
Al Khoud Shabiya(B)-F2-P187 - - - - 5.4 24.7 5.9 27.0
Al Khoud PH-7-F2-P154 - - - - 14.9 67.8 16.3 74.2
Al Khoud PH-7-F3-P154 - - - - 14.8 67.5 16.2 73.8
Al Khoud PH-6-F2-P049 - - - - 6.8 30.9 7.4 33.7
Al Khoud PH-7-F1-P154 - - - - 14.8 67.1 16.1 73.4
33kV Feeder Maximum Loads
Primary Rating(MVA)
2019 2020 2021 2022
MVA %Loading MVA %Loading MVA %Loading MVA %Loading
Al Khoud PH-6-F1-P049 - - - - 6.7 30.4 7.3 33.0
Primary Substations Minimum Demand and Percentage Loading
Primary Substation P.No.Firm
Capacity(MVA)
2019 2020 2021 2022
Al Khoudh GSS [Zone 3] - System Study ResultsPrimary Substations Maximum Demand and Percentage Loading
Primary Substation P.No.Firm
Capacity(MVA)
2019 2020 2021 2022
MEDC Distribution System Capability Statement [2020-2022]-V1.0 122

MW MVAr MVA % MW MVAr MVA % MW MVAr MVA % MW MVAr MVA %
Al Hail North 1 P027 20 17.8 6.1 18.8 94% 18.2 6.2 19.2 96% - - - - - - - -
Al Hail North 1(Upgrade) P027 40 - - - - - - - - 18.7 6.2 19.7 49% 19.1 6.3 20.1 50%
City Centre P073 20 16.0 7.5 17.7 89% 16.6 5.4 17.4 87% 17.2 5.6 18.1 90% 17.6 5.8 18.6 93%
Mawaleh North P069 20 10.2 3.2 10.7 54% 10.4 3.3 10.9 55% - - - - - - - -
Mawaleh North Grid GP01 40 30.9 12.0 33.1 83% 35.9 11.8 37.8 94% 28.9 9.5 30.4 76% 33.9 11.1 35.7 89%
Mawaleh North(Upgrade) P069 40 - - - - - - - - 21.0 6.9 22.2 55% 31.5 10.3 33.1 83%
MW MVAr MVA % MW MVAr MVA % MW MVAr MVA % MW MVAr MVA %
Al Hail North 1 P027 20 2.9 0.8 3.0 15% 3.0 0.8 3.1 15% - - - - - - - -
Al Hail North 1(Upgrade) P027 40 - - - - - - - - 3.0 0.8 3.1 8% 3.1 0.8 3.2 8%
City Centre P073 20 3.0 1.4 3.3 17% 3.0 1.4 3.3 16% 3.1 1.4 3.4 17% 3.1 1.4 3.5 17%
Mawaleh North P069 20 1.7 0.8 1.9 10% 1.7 0.9 1.9 10% - - - - - - - -
Mawaleh North Grid GP01 40 8.5 2.6 8.9 22% 9.7 3.0 10.2 25% 7.8 2.4 8.2 20% 9.2 2.8 9.6 24%
Mawaleh North(Upgrade) P069 40 - - - - - - - - 3.5 1.8 3.9 10% 5.3 2.6 5.9 15%
22.0
22.0
22.0
22.0
22.0
22.0
22.0
22.0
22.0
22.0
22.0
Max Min Max Min Max Min Max Min Max Min Max Min Max Min Max Min
P027 99.8 100.0 102.2 104.3 99.8 100.0 102.2 104.4 99.9 100.0 103.0 104.4 99.9 100.0 103.0 104.3
P027 99.8 100.0 102.2 104.3 99.8 100.0 102.2 104.4 99.9 100.0 103.0 104.4 99.9 100.0 103.0 104.3
P027 - - - - - - - - 99.9 100.0 103.0 104.4 99.9 100.0 102.9 104.3
P073 99.8 100.0 101.5 104.0 99.8 100.0 102.2 104.0 99.8 100.0 102.1 104.0 99.8 100.0 102.0 104.0
P073 99.8 100.0 101.5 104.0 99.8 100.0 102.2 104.0 99.8 100.0 102.1 104.0 99.8 100.0 102.0 104.0
P069 100.0 100.0 103.2 104.2 100.0 100.0 103.2 104.3 99.9 100.0 102.7 104.1 99.9 100.0 101.6 103.9
P069 100.0 100.0 103.2 104.2 100.0 100.0 103.2 104.3 99.9 100.0 102.7 104.1 99.9 100.0 101.6 103.9
P069 - - - - - - - - 99.9 100.0 102.7 104.1 99.9 100.0 101.7 103.9
GP01 100.0 100.0 101.3 103.9 100.0 100.0 100.6 103.8 100.0 100.0 101.3 104.0 100.0 100.0 100.8 103.9
GP01 100.0 100.0 101.3 103.9 100.0 100.0 100.6 103.8 100.0 100.0 101.3 104.0 100.0 100.0 100.8 103.9
GP01 100.0 100.0 101.4 103.9 100.0 100.0 100.6 103.8 100.0 100.0 101.3 104.0 100.0 100.0 100.8 103.9
Al Hail North 1-C
City Centre-A
Primary Substations Bus Voltages
Primary P.No.
2019 2020 2021 2022
33kV (%) 11kV(%) 33kV (%) 11kV(%) 33kV (%) 11kV(%) 33kV (%) 11kV(%)
Al Hail North 1-A
Al Hail North 1-B
Mawaleh North Grid-F2-GP01 11.4 51.9 15.3 69.4 12.6 57.3 14.5 65.9
Mawaleh North Grid-F3-GP01 11.3 51.2 15.2
City Centre-B
Mawaleh North-A
Mawaleh North-B
Mawaleh North-C
Mawaleh North Grid-A
Mawaleh North Grid-B
Mawaleh North Grid-C
69.1 12.6 57.1 14.4 65.7
Mawaleh North-F3-P069 - - - - 7.5 34.1 11.3 51.5
Mawaleh North Grid-F1-GP01 11.3 51.5 15.2 68.9 12.5 56.9 14.4 65.5
Mawaleh North-F1-P069 5.4 24.6 5.5 25.0 7.5 34.0 11.3 51.3
Mawaleh North-F2-P069 5.4 24.7 5.5 25.2 7.5 34.2 11.4 51.6
City Centre-F1-P073 8.9 40.7 8.9 40.3 9.2 41.8 9.4 42.9
City Centre-F2-P073 9.0 40.7 8.9 40.3 9.2 41.8 9.4 42.9
Al Hail North 1-F2-P027 9.5 43.2 9.6 43.8 6.6 29.8 6.7 30.4
Al Hail North 1-F3-P027 - - - - 6.6 30.1 6.8 30.7
33kV Feeder Maximum Loads
Primary Rating(MVA)
2019 2020 2021 2022
MVA %Loading MVA %Loading MVA %Loading MVA %Loading
Al Hail North 1-F1-P027 9.7 44.1 9.8 44.7 6.7 30.4 6.8 31.0
Mawaleh North [GP01] GSS [Zone 3] - System Study ResultsPrimary Substations Maximum Demand and Percentage Loading
Primary Substation P.No.Firm
Capacity(MVA)
2019 2020 2021 2022
Primary Substations Minimum Demand and Percentage Loading
Primary Substation P.No.Firm
Capacity(MVA)
2019 2020 2021 2022
MEDC Distribution System Capability Statement [2020-2022]-V1.0 123

33kV 11kV 33kV 11kV 33kV 11kV 33kV 11kV
P027 17.4 15.0 17.9 15.2 18.0 14.8 19.5 15.1
P027 17.4 15.0 17.9 15.2 18.0 14.8 19.5 15.1
P027 - - - - 17.9 8.3 19.4 8.4
P073 16.6 13.9 17.0 14.0 17.2 14.0 18.5 14.3
P073 16.6 13.9 17.0 14.0 17.2 14.0 18.5 14.3
P069 18.9 13.6 19.5 13.8 19.7 14.1 21.5 14.9
P069 18.9 13.6 19.5 13.8 19.7 14.1 21.5 14.9
P069 - - - - 19.7 7.9 21.5 8.3
GP01 20.8 15.2 21.5 15.8 21.7 15.5 23.9 16.1
GP01 20.8 15.2 21.5 15.8 21.7 15.5 23.9 16.1
GP01 20.8 8.5 21.5 8.8 21.7 8.6 23.9 8.8
Mawaleh North Grid-A 25.0 25.0
Mawaleh North Grid-B 25.0 25.0
Mawaleh North Grid-C 25.0 25.0
Al Hail North 1-B 25.0 20.0
Al Hail North 1-C 25.0 25.0
City Centre-A 25.0 20.0
City Centre-B 25.0 20.0
Mawaleh North-A 25.0 18.4
Mawaleh North-B 25.0 18.4
Mawaleh North-C 25.0 25.0
Primary Substation 3-Phase Fault Current Levels (kA)
Primary P.No. 33kV -Rated SC Capacity
11kV -Rated SC Capacity
2019 2020 2021 2022
Al Hail North 1-A 25.0 20.0
MEDC Distribution System Capability Statement [2020-2022]-V1.0 124

MEDC Distribution System Capability Statement (2020-2022) – V1.0 125
A P P E N D I X E : I N F O R M A T I O N O N D I S T R I B U T I O N N E T W O R K A S S E T
Appendix E presents the following series of tables, for each grid substation power system model in form
of complete technical asset data.
Appendix E1 – 33kV Circuits/Feeders Data
Appendix E1 presents the circuit length from gird substation up to the 33kV busbar in the primary
substation. It specifies the key parameters for the circuits including resistance, reactance, capacitance
and the continuous derated thermal rating for the underground cable and overhead line conductor types
used. The resistance is specified at 20C AC values.
Explanatory Notes:
a) 33kV UGC 300 3C Cu means 33kV underground cable of 300 sq.mm. cross-sectional area,
three core type and formed of copper conductor;
b) In general, the cables employed are XLPE insulated and armored;
c) 33kV OHL 200 Panther ACSR means 33kV overhead line of 200 sq.mm. cross-sectional area
(i.e. Panther conductor) of Aluminium Conductor Steel Reinforced type;
d) 33kV OHL 100 Dog ACSR means 33kV overhead line of 100 sq.mm. cross-sectional area (i.e.
Dog conductor) of Aluminium Conductor Steel Reinforced type;
e) Where a single 33kV feeder feeds multiple primary substations [for e.g. circuits in rural areas],
the circuit length between the grid substation and each of the connected primary substation on
that feeder is calculated and captured individually. This means that there will be few duplicated
segments of circuit length. This is explained with the following example:
Hence, the 33kV circuit lengths as documented for;
− PSS 1 = F1-L1
− PSS 4 = F1-L1 + F1-L2 + F1-L3 + F1-L4
− PSS 5 = F1-L1 + F1-L2 + F1-L3 + F1-L5
f) MEDC is currently in process of developing the typical values for zero sequence resistance and
zero sequence reactance for future improvements.

Node 1 Node 2 33kV Feeder IDNetwork
Level[kV]
Type NameLength [km]
Resistance( R )
[Ohm/km]
Reactance( X )
[Ohm/km]
Capacitance( C )
[nF/km]
Continuous Rating
[kAmps]Al Falaj Grid HBB01 Falaj-33A-P178 Falaj-F1-P178 33 33kV UGC 300 3C Cu 0.017 0.062 0.103 260.000 0.385Al Falaj Grid HBB02 Falaj-33B-P178 Falaj-F2-P178 33 33kV UGC 300 3C Cu 0.036 0.062 0.103 260.000 0.385Al Falaj Grid HBB01 Mutrah Store-33A-P085 Mutrah Store-F1-P085 33 33kV UGC 300 3C Cu 1.803 0.062 0.103 260.000 0.385Al Falaj Grid HBB02 Mutrah Store-33B-P085 Mutrah Store-F2-P085 33 33kV UGC 300 3C Cu 1.803 0.062 0.103 260.000 0.385Al Falaj Grid HBB01 Darsait-N33A-P018 Darsait-F1-P018 33 33kV UGC 300 3C Cu 0.330 0.062 0.103 260.000 0.385Al Falaj Grid HBB02 Darsait-N33B-P018 Darsait-F2-P018 33 33kV UGC 300 3C Cu 0.342 0.062 0.103 260.000 0.385Al Falaj Grid HBB01 - 33 33kV UGC 300 3C Cu 3.109 0.062 0.103 260.000 0.385
- - 33 33kV OHL 200 Panther ACSR 2.386 0.137 0.333 10.900 0.385- Seaport-33A-P086 33 33kV OHL 200 Panther ACSR 0.892 0.137 0.333 10.900 0.385
Al Falaj Grid HBB01 Jibrooh-33A-P041 Jibrooh-F1-P041 33 33kV UGC 300 3C Cu 3.365 0.062 0.103 260.000 0.385Al Falaj Grid HBB02 Jibrooh-33B-P041 Jibrooh-F2-P041 33 33kV UGC 300 3C Cu 3.393 0.062 0.103 260.000 0.385Al Falaj Grid HBB01 - 33 33kV UGC 300 3C Cu 3.109 0.062 0.103 260.000 0.385
- - 33 33kV OHL 200 Panther ACSR 2.386 0.137 0.333 10.900 0.385- Jibrooh-33C-P041 33 33kV OHL 200 Panther ACSR 0.727 0.137 0.333 10.900 0.385
Al Falaj Grid HBB02 PDO-33A-P144 PDO-F1-P144 33 33kV UGC 300 3C Cu 1.077 0.062 0.103 260.000 0.385Al Falaj Grid HBB02 PDO-33B-P144 PDO-F2-P144 33 33kV UGC 300 3C Cu 1.079 0.062 0.103 260.000 0.385Al Falaj Grid HBB01 PDO-33C-P144 PDO-F3-P144 33 33kV UGC 300 3C Cu 1.109 0.062 0.103 260.000 0.385Al Falaj Grid HBB01 PDO-33D-P144 PDO-F4-P144 33 33kV UGC 300 3C Cu 1.108 0.062 0.103 260.000 0.385
Node 1 Node 2 33kV Feeder IDNetwork
Level[kV]
Type NameLength [km]
Resistance( R )
[Ohm/km]
Reactance( X )
[Ohm/km]
Capacitance( C )
[nF/km]
Continuous Rating
[kAmps]Muttrah Grid HBB01 Bait Al Falaj-33A-P142 Bait Al Falaj-F1-P142 33 33kV UGC 300 3C Cu 1.960 0.062 0.103 260.000 0.385Muttrah Grid HBB02 Bait Al Falaj-33B-P142 Bait Al Falaj-F2-P142 33 33kV UGC 300 3C Cu 1.969 0.062 0.103 260.000 0.385Muttrah Grid HBB02 Bait Al Falaj-33C-P142 Bait Al Falaj-F3-P142 33 33kV UGC 300 3C Cu 1.973 0.062 0.103 260.000 0.385Muttrah Grid HBB01 C.B.D-33A-P173 C.B.D-F1-P173 33 33kV UGC 300 3C Cu 0.062 0.062 0.103 260.000 0.385Muttrah Grid HBB02 C.B.D-33B-P173 C.B.D-F2-P173 33 33kV UGC 300 3C Cu 0.052 0.062 0.103 260.000 0.385Muttrah Grid HBB01 C.B.D-33C-P173 C.B.D-F3-P173 33 33kV UGC 300 3C Cu 0.071 0.062 0.103 260.000 0.385Muttrah Grid HBB01 M.O.D-33-P143-OD M.O.D-F1-P143-OD 33 33kV UGC 300 3C Cu 1.100 0.062 0.103 260.000 0.385Muttrah Grid HBB01 - 33 33kV OHL 100 Dog ACSR 4.531 0.320 0.350 16.700 0.269
- Riyam-33A-P099 33 33kV UGC 300 3C Cu 2.463 0.062 0.103 260.000 0.385Muttrah Grid HBB01 - 33 33kV OHL 100 Dog ACSR 4.531 0.320 0.350 16.700 0.269
- Riyam-33B-P099 33 33kV UGC 300 3C Cu 2.410 0.062 0.103 260.000 0.385Muttrah Grid HBB01 Ruwi Office-33A-P108 Ruwi Office-F1-P108 33 33kV UGC 300 3C Cu 1.554 0.062 0.103 260.000 0.385Muttrah Grid HBB02 Ruwi Office-33B-P108 Ruwi Office-F2-P108 33 33kV UGC 300 3C Cu 1.567 0.062 0.103 260.000 0.385
Node 1 Node 2 33kV Feeder IDNetwork
Level[kV]
Type NameLength [km]
Resistance( R )
[Ohm/km]
Reactance( X )
[Ohm/km]
Capacitance( C )
[nF/km]
Continuous Rating
[kAmps]Wadi Kabir A Grid H-BB01 - 33 33kV OHL 100 Dog ACSR 3.570 0.320 0.350 16.700 0.269
- Qasr al Alam-33A-P090 33 33kV UGC 300 3C Cu 1.337 0.062 0.103 260.000 0.385Wadi Kabir A Grid H-BB02 - 33 33kV OHL 100 Dog ACSR 3.571 0.320 0.350 16.700 0.269
- Qasr al Alam-33B-P090 33 33kV UGC 300 3C Cu 1.304 0.062 0.103 260.000 0.385Wadi Kabir A Grid H-BB01 - 33 33kV OHL 200 Panther ACSR 0.848 0.137 0.333 10.900 0.385
- - 33 33kV OHL 200 Panther ACSR 0.350 0.137 0.333 10.900 0.385
- Wadi Al Kabir Housing-33-P127 33 33kV UGC 300 3C Cu 0.323 0.062 0.103 260.000 0.385
Wadi Kabir A Grid H-BB01 - 33 33kV OHL 200 Panther ACSR 0.848 0.137 0.333 10.900 0.385
- Wadi Al Kabir Workshop-33-P126 33 33kV OHL 200 Panther ACSR 0.410 0.137 0.333 10.900 0.385
Wadi Kabir A Grid H-BB01 - 33 33kV OHL 200 Panther ACSR 0.848 0.137 0.333 10.900 0.385- - 33 33kV OHL 200 Panther ACSR 0.410 0.137 0.333 10.900 0.385- - 33 33kV OHL 200 Panther ACSR 2.254 0.137 0.333 10.900 0.385- Sidab-33A-P119 33 33kV OHL 200 Panther ACSR 0.001 0.137 0.333 10.900 0.385
Wadi Kabir A Grid H-BB01 M.B.D. South-33A-P075 M.B.D. South-F1-P075 33 33kV UGC 300 3C Cu 1.933 0.062 0.103 260.000 0.385Wadi Kabir A Grid H-BB02 M.B.D. South-33B-P075 M.B.D. South-F2-P075 33 33kV UGC 300 3C Cu 1.945 0.062 0.103 260.000 0.385Wadi Kabir A Grid H-BB01 - 33 33kV UGC 300 3C Cu 1.490 0.062 0.103 260.000 0.385- Walja-33A-P130 33 33kV OHL 200 Panther ACSR 0.446 0.137 0.333 10.900 0.385Wadi Kabir A Grid H-BB02 - 33 33kV UGC 300 3C Cu 1.430 0.062 0.103 260.000 0.385- Walja-33B-P130 33 33kV OHL 200 Panther ACSR 0.583 0.137 0.333 10.900 0.385Wadi Kabir A Grid H-BB01 - 33 33kV OHL 200 Panther ACSR 5.004 0.137 0.333 10.900 0.385
- Majlis Oman-33A-P066 33 33kV UGC 300 3C Cu 1.574 0.062 0.103 260.000 0.385Wadi Kabir A Grid H-BB02 - 33 33kV OHL 200 Panther ACSR 5.004 0.137 0.333 10.900 0.385
- Majlis Oman-33B-P066 33 33kV UGC 300 3C Cu 1.543 0.062 0.103 260.000 0.385Wadi Kabir A Grid H-BB01 Ali Shihani-33A-P125 Ali Shihani-F1-P125 33 33kV UGC 300 3C Cu 0.909 0.062 0.103 260.000 0.385Wadi Kabir A Grid H-BB02 Ali Shihani-33B-P125 Ali Shihani-F2-P125 33 33kV UGC 300 3C Cu 0.895 0.062 0.103 260.000 0.385
Node 1 Node 2 33kV Feeder IDNetwork
Level[kV]
Type NameLength [km]
Resistance( R )
[Ohm/km]
Reactance( X )
[Ohm/km]
Capacitance( C )
[nF/km]
Continuous Rating
[kAmps]Wadi Kabir B Grid H-BB03 Old Airport-33A-P107 Old Airport-F1-P107 33 33kV UGC 300 3C Cu 2.473 0.062 0.103 260.000 0.385Wadi Kabir B Grid H-BB04 Old Airport-33B-P107 Old Airport-F2-P107 33 33kV UGC 300 3C Cu 2.481 0.062 0.103 260.000 0.385
Wadi Kabir B Grid H-BB03 Wadi Al Kabir Height 1-33A-P128 Wadi Al Kabir Height 1-F1-P128 33 33kV UGC 300 3C Cu 4.412 0.062 0.103 260.000 0.385
Wadi Kabir B Grid H-BB04 Wadi Al Kabir Height 1-33B-P128 Wadi Al Kabir Height 1-F2-P128 33 33kV UGC 300 3C Cu 4.369 0.062 0.103 260.000 0.385
Wadi Kabir B Grid H-BB03 Ruwi Valley-33A-P174 Ruwi Valley-F1-P174 33 33kV UGC 300 3C Cu 0.122 0.062 0.103 260.000 0.385Wadi Kabir B Grid H-BB04 Ruwi Valley-33B-P174 Ruwi Valley-F2-P174 33 33kV UGC 300 3C Cu 0.158 0.062 0.103 260.000 0.385Wadi Kabir B Grid H-BB03 Ruwi Market-33A-P076 Ruwi Market-F1-P076 33 33kV UGC 300 3C Cu 1.609 0.062 0.103 260.000 0.385Wadi Kabir B Grid H-BB04 Ruwi Market-33B-P076 Ruwi Market-F2-P076 33 33kV UGC 300 3C Cu 1.617 0.062 0.103 260.000 0.385
- Muscat 01 Fdr – This feeder feeds Wadi Kabir Workshop-P126, Sidab-P119 & Wadi Kabir Housing-P127 primary substations
Wadi Al Kabir[G19] -B GSS [Zone 1]
Qasr al Alam-F2-P090
Muscat 01 Fdr-WK Workshop-P126, Sidab-P119 & WK Housing-P127
Muscat 01 Fdr-WK Workshop-P126, Sidab-P119 & WK Housing-P127
Walja-F1-P130
Muscat 01 Fdr-WK Workshop-P126, Sidab-P119 & WK Housing-P127
Walja-F2-P130
Majlis Oman-F1-P066
Majlis Oman-F2-P066
Falaj[G23] GSS [Zone 1]
Mutrah[G21] GSS [Zone 1]
Wadi Al Kabir[G19] -A GSS [Zone 1]
Seaport-F1-P086
Seaport-F1-P086
Riyam-F1-P099
Riyam-F2-P099
Qasr al Alam-F1-P090
MEDC Distribution System Capability Statement [2020-2022]-V1.0 126

Node 1 Node 2 33kV Feeder IDNetwork
Level[kV]
Type NameLength [km]
Resistance( R )
[Ohm/km]
Reactance( X )
[Ohm/km]
Capacitance( C )
[nF/km]
Continuous Rating
[kAmps]Wadi Adai Grid H BB01 Khoula Hospital-33A-P132 Khoula Hospital-F1-P132 33 33kV UGC 300 3C Cu 3.685 0.062 0.103 260.000 0.385Wadi Adai Grid H BB02 Khoula Hospital-33B-P132 Khoula Hospital-F2-P132 33 33kV UGC 300 3C Cu 3.696 0.062 0.103 260.000 0.385Wadi Adai Grid H BB01 Khoula Hospital-33C-P132 Khoula Hospital-F3-P132 33 33kV UGC 300 3C Cu 3.164 0.062 0.103 260.000 0.385Wadi Adai Grid H BB01 Wadi Adai-33A-P175 Wadi Adai-F1-P175 33 33kV UGC 300 3C Cu 0.061 0.062 0.103 260.000 0.385Wadi Adai Grid H BB02 Wadi Adai-33B-P175 Wadi Adai-F2-P175 33 33kV UGC 300 3C Cu 0.054 0.062 0.103 260.000 0.385Wadi Adai Grid H BB01 - 33 33kV OHL 100 Dog ACSR 1.763 0.320 0.350 16.700 0.269
- Al Hamryah-33A-P035 33 33kV UGC 300 3C Cu 0.558 0.062 0.103 260.000 0.385Wadi Adai Grid H BB02 - 33 33kV OHL 100 Dog ACSR 1.720 0.320 0.350 16.700 0.269
- Al Hamryah-33B-P035 33 33kV UGC 300 3C Cu 0.603 0.062 0.103 260.000 0.385Wadi Adai Grid H BB01 Wattaya-33A-P131 Wattaya-F1-P131 33 33kV UGC 300 3C Cu 1.974 0.062 0.103 260.000 0.385Wadi Adai Grid H BB02 Wattaya-33B-P131 Wattaya-F2-P131 33 33kV UGC 300 3C Cu 2.001 0.062 0.103 260.000 0.385Wadi Adai Grid H BB01 - 33 33kV OHL 100 Dog ACSR 5.220 0.320 0.350 16.700 0.269
- Amerat 1-33A-P005 33 33kV UGC 300 3C Cu 3.127 0.062 0.103 260.000 0.385Wadi Adai Grid H BB02 - 33 33kV OHL 100 Dog ACSR 5.178 0.320 0.350 16.700 0.269
- Amerat 1-33B-P005 33 33kV UGC 300 3C Cu 3.140 0.062 0.103 260.000 0.385N4655 Al Mahaj-33-P136 Al Mahaj-33-P136 33 33kV UGC 300 3C Cu 3.799 0.062 0.103 260.000 0.385Wadi Adai Grid H BB01 - 33 33kV OHL 200 Panther ACSR 10.086 0.137 0.333 10.900 0.385
- Al Bustan Palace-33A-P017 33 33kV UGC 300 3C Cu 2.421 0.062 0.103 260.000 0.385Wadi Adai Grid H BB02 - 33 33kV OHL 200 Panther ACSR 10.113 0.137 0.333 10.900 0.385
- Al Bustan Palace-33B-P017 33 33kV UGC 300 3C Cu 2.320 0.062 0.103 260.000 0.385Wadi Adai Grid H BB01 - Al Bustan Palace-F1-P017 33 33kV OHL 200 Panther ACSR 10.086 0.137 0.333 10.900 0.385
- Qantab-33-P089-OD Qantab-F1-P089-OD 33 33kV OHL 200 Panther ACSR 2.293 0.137 0.333 10.900 0.385
Node 1 Node 2 33kV Feeder IDNetwork
Level[kV]
Type NameLength [km]
Resistance( R )
[Ohm/km]
Reactance( X )
[Ohm/km]
Capacitance( C )
[nF/km]
Continuous Rating
[kAmps]33kV Jahloot BB-HBB01 - 33 33kV OHL 200 Panther ACSR 4.947 0.137 0.333 10.900 0.385
- Jahloot-33A-P040 33 33kV UGC 300 3C Cu 0.020 0.062 0.103 260.000 0.38533kV Jahloot BB-HBB01 - 33 33kV OHL 200 Panther ACSR 4.947 0.137 0.333 10.900 0.385
- Jahloot-33B-P040 33 33kV UGC 300 3C Cu 0.020 0.062 0.103 260.000 0.38533kV Jahloot BB-HBB01 - 33 33kV OHL 200 Panther ACSR 4.947 0.137 0.333 10.900 0.385
- - 33 33kV OHL 200 Panther ACSR 11.409 0.137 0.333 10.900 0.385- Siya-33A-P120 33 33kV UGC 300 3C Cu 1.532 0.062 0.103 260.000 0.385
33kV Jahloot BB-HBB01 - 33 33kV OHL 200 Panther ACSR 26.758 0.137 0.333 10.900 0.385- - 33 33kV OHL 200 Panther ACSR 2.667 0.137 0.333 10.900 0.385- Bar Al Jissah-33A-P044 33 33kV OHL 200 Panther ACSR 3.700 0.137 0.333 10.900 0.385
33kV Jahloot BB-HBB02 - 33 33kV OHL 200 Panther ACSR 26.764 0.137 0.333 10.900 0.385- - 33 33kV OHL 200 Panther ACSR 2.661 0.137 0.333 10.900 0.385- Bar Al Jissah-33B-P044 33 33kV OHL 200 Panther ACSR 3.700 0.137 0.333 10.900 0.385
33kV Jahloot BB-HBB01 - 33 33kV OHL 200 Panther ACSR 26.758 0.137 0.333 10.900 0.385- Hussan Yitti-33A-P169-OD 33 33kV UGC 300 3C Cu 1.696 0.062 0.103 260.000 0.385
33kV Jahloot BB-HBB02 - 33 33kV OHL 200 Panther ACSR 26.764 0.137 0.333 10.900 0.385- Hussan Yitti-33B-P169-OD 33 33kV UGC 300 3C Cu 1.620 0.062 0.103 260.000 0.385
33kV Jahloot BB-HBB02 - 33 33kV OHL 200 Panther ACSR 11.515 0.137 0.333 10.900 0.385- - 33 33kV UGC 300 3C Cu 1.404 0.062 0.103 260.000 0.385- - 33 33kV OHL 200 Panther ACSR 4.088 0.137 0.333 10.900 0.385- Al Hajir-33A-P031 33 33kV UGC 300 3C Cu 0.000 0.062 0.103 260.000 0.385
33kV Jahloot BB-HBB02 - 33 33kV OHL 200 Panther ACSR 14.517 0.137 0.333 10.900 0.385- - 33 33kV UGC 300 3C Cu 2.063 0.062 0.103 260.000 0.385- Al Hajir-33B-P031 33 33kV OHL 200 Panther ACSR 0.010 0.137 0.333 10.900 0.385
33kV Jahloot BB-HBB02 - 33 33kV OHL 200 Panther ACSR 14.517 0.137 0.333 10.900 0.385- - 33 33kV UGC 300 3C Cu 2.063 0.062 0.103 260.000 0.385- - 33 33kV OHL 200 Panther ACSR 2.872 0.137 0.333 10.900 0.385- Al Atkiya-33N-P182-OD 33 33kV UGC 300 3C Cu 0.224 0.062 0.103 260.000 0.385
33kV Jahloot BB-HBB02 - 33 33kV OHL 200 Panther ACSR 11.515 0.137 0.333 10.900 0.385- Tunis-33 -P137 33 33kV UGC 300 3C Cu 1.404 0.062 0.103 260.000 0.385
33kV Jahloot BB-HBB01 - 33 33kV OHL 200 Panther ACSR 8.000 0.137 0.333 10.900 0.385- - 33 33kV OHL 200 Panther ACSR 15.516 0.137 0.333 10.900 0.385- Sawaqim 1-33B-P112-OD 33 33kV OHL 200 Panther ACSR 0.086 0.137 0.333 10.900 0.385
33kV Jahloot BB-HBB01 - 33 33kV OHL 200 Panther ACSR 8.000 0.137 0.333 10.900 0.385- ROP Al Saleel-33A-P162-OD 33 33kV UGC 300 3C Cu 1.762 0.062 0.103 260.000 0.385
33kV Jahloot BB-HBB02 - 33 33kV OHL 200 Panther ACSR 25.397 0.137 0.333 10.900 0.385- Sawaqim 2-33-P113-OD 33 33kV UGC 300 3C Cu 3.530 0.062 0.103 260.000 0.385
33kV Jahloot BB-HBB02 - 33 33kV OHL 200 Panther ACSR 8.000 0.137 0.333 10.900 0.385- ROP Al Saleel-33B-P162-OD 33 33kV UGC 300 3C Cu 1.740 0.062 0.103 260.000 0.385
33kV Jahloot BB-HBB02 - 33 33kV OHL 200 Panther ACSR 8.000 0.137 0.333 10.900 0.385- Water Pumping-33B-P193-OD 33 33kV OHL 200 Panther ACSR 30.000 0.137 0.333 10.900 0.385
33kV Jahloot BB-HBB02 - 33 33kV OHL 200 Panther ACSR 23.101 0.137 0.333 10.900 0.385- Debha-33N-P114-OD 33 33kV OHL 200 Panther ACSR 35.573 0.137 0.333 10.900 0.385
33kV Jahloot BB-HBB01 - 33 33kV OHL 200 Panther ACSR 21.000 0.137 0.333 10.900 0.385- Madinat Al Nahdah-33B-P065 33 33kV UGC 300 3C Cu 3.700 0.062 0.103 260.000 0.385
33kV Jahloot BB-HBB01 Al Masarat-33A-P068 Al Masarat-F1-P068 33 33kV UGC 300 3C Cu 1.575 0.062 0.103 260.000 0.38533kV Jahloot BB-HBB02 Al Masarat-33B-P068 Al Masarat-F2-P068 33 33kV UGC 300 3C Cu 1.525 0.062 0.103 260.000 0.385
- Mazara Feeder (Jahloot GSS)– This feeder feeds Jahloot P040, Siya P120 & Arqi P121 primary substations - Al Hajir-F1-P031(P031+P137) (Jahloot GSS) – This feeder feeds Al Hajir-P031 Transformer 1 and Tunis-P137 primary substations - Al Hajir-F2-P031(P031+P182) (Jahloot GSS) – This feeder feeds Al Hajir-P031 (Transformer 2) and Al Atkiya P182 primary substations - Sawaqim 1-F1-P112 (Quriyat fdr1) (Jahloot GSS) – This feeder feeds Sawaqim 1-P112 and ROP Al Saleel-P162 (Transformer 1) primary substations - Shehabari Feeder (Feeding ROP Saleel Tx 2+Waterpump) (Jahloot GSS) – This feeder feeds ROP Al Saleel-P162 Transformer 2 and Water Pumping-P193 primary substations
Wadi Mayh-F-P129-OD(Al Nahdha Fdr 1)
Madinat Al Nahdah-F2-P065
Al Hamryah-F2-P035
Al Hajir-F2-P031(P031+P182)
Sawaqim 2-F1-P112-OD (Quriyat 2 fdr)
Shehabari Feeder (Feeding ROP Saleel Tx 2+Waterpump)
Shehabari Feeder (Feeding ROP Saleel Tx 2+Waterpump)
Al Hajir-F1-P031(P031+P137)
Sawaqim 1-F1-P112 (Quriyat fdr1)
Sawaqim 1-F1-P112 (Quriyat fdr1)
Mazara Fdr - Jahloot1-P040 + Siya-P120 + Arqi-P121
Mazara Fdr - Jahloot1-P040 + Siya-P120 + Arqi-P121
Bar Al Jissah 1-F1-P044
Bar Al Jissah 1-F2-P044
Amerat 1-F1-P005
Amerat 1-F2-P005
Al Bustan Palace-F1-P017
Al Bustan Palace-F2-P017
Mazara Fdr - Jahloot1-P040 + Siya-P120 + Arqi-P121
Wadi Adai[G22] - [Zone 1]
Bar Al Jissah 1-F1-P044
Bar Al Jissah 1-F2-P044
Al Hajir-F1-P031(P031+P137)
Al Hajir-F2-P031(P031+P182)
Al Hamryah-F1-P035
Jahloot[G03] GSS [Zone 1]
MEDC Distribution System Capability Statement [2020-2022]-V1.0 127

Node 1 Node 2 33kV Feeder IDNetwork
Level[kV]
Type NameLength [km]
Resistance( R )
[Ohm/km]
Reactance( X )
[Ohm/km]
Capacitance( C )
[nF/km]
Continuous Rating
[kAmps]Yitty Grid H-BB02 - 33 33kV OHL 200 Panther ACSR 1.465 0.137 0.333 10.900 0.385
- - 33 33kV UGC 300 3C Cu 0.186 0.062 0.103 260.000 0.385- - 33 33kV OHL 200 Panther ACSR 3.568 0.137 0.333 10.900 0.385- Al Salam Yiti-33-P135 33 33kV UGC 300 3C Cu 0.241 0.062 0.103 260.000 0.385
Yitty Grid H-BB02 - 33 33kV OHL 200 Panther ACSR 1.465 0.137 0.333 10.900 0.385- - 33 33kV UGC 300 3C Cu 0.186 0.062 0.103 260.000 0.385- Yiti-33A-P134 33 33kV UGC 300 3C Cu 0.352 0.062 0.103 260.000 0.385
Yitty Grid H-BB01 - 33 33kV OHL 200 Panther ACSR 3.470 0.137 0.333 10.900 0.385- Yenket-33A -P133 33 33kV UGC 300 3C Cu 0.247 0.062 0.103 260.000 0.385
Yitty Grid H-BB01 - 33 33kV OHL 200 Panther ACSR 3.470 0.137 0.333 10.900 0.385- - 33 33kV UGC 300 3C Cu 0.247 0.062 0.103 260.000 0.385- Al Khairan-33A-P045 33 33kV OHL 200 Panther ACSR 3.557 0.137 0.333 10.900 0.385
Yitty Grid H-BB01 - 33 33kV OHL 200 Panther ACSR 20.237 0.137 0.333 10.900 0.385- Jabal Al Sifah-33A-P159 33 33kV UGC 300 3C Cu 0.925 0.062 0.103 260.000 0.385
Yitty Grid H-BB02 - 33 33kV OHL 200 Panther ACSR 20.237 0.137 0.333 10.900 0.385- Jabal Al Sifah-33B-P159 33 33kV UGC 300 3C Cu 1.001 0.062 0.103 260.000 0.385
Yitty Grid H-BB02 - 33 33kV OHL 200 Panther ACSR 20.243 0.137 0.333 10.900 0.385- Jabal Al Sifah-33C-P159 33 33kV UGC 300 3C Cu 0.894 0.062 0.103 260.000 0.385
Yitty Grid H-BB01 - 33 33kV OHL 200 Panther ACSR 10.548 0.137 0.333 10.900 0.385- Saraya Bander-33A-P145 33 33kV UGC 300 3C Cu 1.625 0.062 0.103 260.000 0.385
Yitty Grid H-BB02 - 33 33kV OHL 200 Panther ACSR 10.546 0.137 0.333 10.900 0.385- Saraya Bander-33B-P145 33 33kV UGC 300 3C Cu 1.544 0.062 0.103 260.000 0.385
Yitty Grid H-BB01 - 33 33kV OHL 200 Panther ACSR 10.554 0.137 0.333 10.900 0.385- Saraya Bander-33C-P145 33 33kV UGC 300 3C Cu 1.605 0.062 0.103 260.000 0.385
Node 1 Node 2 33kV Feeder IDNetwork
Level[kV]
Type NameLength [km]
Resistance( R )
[Ohm/km]
Reactance( X )
[Ohm/km]
Capacitance( C )
[nF/km]
Continuous Rating
[kAmps]33kV Quriyat BB-HBB02 Quriyat-33A-P091 Quriyat-F2-P091 33 33kV UGC 300 3C Cu 8.034 0.062 0.103 260.000 0.38533kV Quriyat BB-HBB01 Quriyat-33B-P091 Quriyat-F1-P091 33 33kV UGC 300 3C Cu 7.965 0.062 0.103 260.000 0.38533kV Quriyat BB-HBB01 Al Shahbari-33A-P092 Al Shahbari-F1-P092 33 33kV UGC 300 3C Cu 7.868 0.062 0.103 260.000 0.38533kV Quriyat BB-HBB02 Al Shahbari-33B-P092 Al Shahbari-F2-P092 33 33kV UGC 300 3C Cu 7.949 0.062 0.103 260.000 0.38533kV Quriyat BB-HBB01 - Al Shahbari-F1-P092 33 33kV UGC 300 3C Cu 7.868 0.062 0.103 260.000 0.385
- - 33 33kV OHL 200 Panther ACSR 5.078 0.137 0.333 10.900 0.385- Hail Al Ghaf-33 -P036 33 33kV UGC 300 3C Cu 1.047 0.062 0.103 260.000 0.385
33kV Quriyat BB-HBB01 - Al Shahbari-F1-P092 33 33kV UGC 300 3C Cu 7.868 0.062 0.103 260.000 0.385- - 33 33kV OHL 200 Panther ACSR 5.078 0.137 0.333 10.900 0.385- - 33 33kV UGC 300 3C Cu 1.047 0.062 0.103 260.000 0.385- Al Mazara-33 -P074 33 33kV OHL 200 Panther ACSR 15.058 0.137 0.333 10.900 0.385
33kV Quriyat BB-HBB02 - 33 33kV UGC 300 3C Cu 2.395 0.062 0.103 260.000 0.385- Dhagmar 1-33A-P021 33 33kV OHL 200 Panther ACSR 2.400 0.137 0.333 10.900 0.385
33kV Quriyat BB-HBB02 - 33 33kV UGC 300 3C Cu 2.395 0.062 0.103 260.000 0.385- - 33 33kV OHL 200 Panther ACSR 2.400 0.137 0.333 10.900 0.385- ROP Dhagmar-33N-P195 33 33kV OHL 200 Panther ACSR 0.200 0.137 0.333 10.900 0.385
33kV Quriyat BB-HBB02 - 33 33kV UGC 300 3C Cu 2.395 0.062 0.103 260.000 0.385- Street Light-33-P020 33 33kV UGC 300 3C Cu 4.665 0.062 0.103 260.000 0.38533kV Quriyat BB-HBB02 - 33 33kV UGC 300 3C Cu 2.395 0.062 0.103 260.000 0.385
- - 33 33kV UGC 300 3C Cu 4.665 0.062 0.103 260.000 0.385- - 33 33kV OHL 200 Panther ACSR 4.966 0.137 0.333 10.900 0.385- Wadi Al Arbyeen-33-P124 33 33kV UGC 300 3C Cu 4.836 0.062 0.103 260.000 0.385
33kV Quriyat BB-HBB02 - 33 33kV UGC 300 3C Cu 2.395 0.062 0.103 260.000 0.385- - 33 33kV UGC 300 3C Cu 4.665 0.062 0.103 260.000 0.385- - 33 33kV OHL 200 Panther ACSR 4.966 0.137 0.333 10.900 0.385- - 33 33kV OHL 200 Panther ACSR 2.100 0.137 0.333 10.900 0.385- RoyalCamp-33-P170 33 33kV UGC 300 3C Cu 0.138 0.062 0.103 260.000 0.385
33kV Quriyat BB-HBB02 - 33 33kV UGC 300 3C Cu 2.395 0.062 0.103 260.000 0.385- - 33 33kV UGC 300 3C Cu 4.665 0.062 0.103 260.000 0.385- - 33 33kV OHL 200 Panther ACSR 4.966 0.137 0.333 10.900 0.385- - 33 33kV OHL 200 Panther ACSR 2.100 0.137 0.333 10.900 0.385- - 33 33kV OHL 200 Panther ACSR 11.404 0.137 0.333 10.900 0.385- - 33 33kV UGC 300 3C Cu 0.377 0.062 0.103 260.000 0.385- - 33 33kV OHL 200 Panther ACSR 5.983 0.137 0.333 10.900 0.385- - 33 33kV OHL 200 Panther ACSR 5.983 0.137 0.333 10.900 0.385- Dhabab-33-P019 33 33kV OHL 200 Panther ACSR 5.983 0.137 0.333 10.900 0.385
- Yiti Feeder-P134OD, Salam YitiP135OD (Yiti GSS) – This feeder feeds Yiti 1-P134 and Al Salam Yiti-P135 primary substations - Khayran for P133 & P045 (Yiti GSS) – This feeder feeds Al Khairan-P045 and Yenkit 1-P133 primary substations - Al Shahbari-F1-P092 (Quriyat GSS)– This feeder feeds Al Shahbari-P092 (Tx 1) and additionally the Hayl Ghaf 1-P036 and Al Mazara 1-P074 primary substations by interconnecting with Jahloot Feeder - Dhagmar 1-F1 (Quriyat GSS) – This feeder feeds Dhagmar 1-P021, Street Light-P020, Wadi Al Arbyeen-P124, RoyalCamp-P170 and Dhabab-P019 primary substations
Dhagmar 1-F1-P021
Dhagmar 1-F1-P021
Dhagmar 1-F1-P021
Dhagmar 1-F1-P021
Dhagmar 1-F1-P021
Dhagmar 1-F1-P021
Saraya Bander-F1-P145
Saraya Bander-F2-P145
Saraya Bander-F3-P145
Jahloot Feeder-to Hail Ghaf and Mazara
Jahloot Feeder-to Hail Ghaf and Mazara
Khayran for P133 & P045
Khayran for P133 & P045
Jabal Al Sifah-F1-P159
Jabal Al Sifah-F2-P159
Jabal Al Sifah-F3-P159
Yitti Feeder-P134OD,Salam YitiP135OD
Yitti Feeder-P134OD,Salam YitiP135OD
Yiti[G08] GSS [Zone 1]
Quriyat[G05] GSS [Zone 1]
MEDC Distribution System Capability Statement [2020-2022]-V1.0 128

Node 1 Node 2 33kV Feeder IDNetwork
Level[kV]
Type NameLength [km]
Resistance( R )
[Ohm/km]
Reactance( X )
[Ohm/km]
Capacitance( C )
[nF/km]
Continuous Rating
[kAmps]Amerat A Grid H-BB01 - 33 33kV UGC 300 3C Cu 0.929 0.062 0.103 260.000 0.385
- - 33 33kV UGC 300 3C Cu 1.066 0.062 0.103 260.000 0.385- - 33 33kV OHL 200 Panther ACSR 3.259 0.137 0.333 10.900 0.385- Al Nahdah-33A-P006 33 33kV UGC 300 3C Cu 0.433 0.062 0.103 260.000 0.385
Amerat A Grid H-BB02 - 33 33kV UGC 300 3C Cu 0.929 0.062 0.103 260.000 0.385- - 33 33kV UGC 300 3C Cu 1.043 0.062 0.103 260.000 0.385- - 33 33kV OHL 200 Panther ACSR 3.292 0.137 0.333 10.900 0.385- Al Nahdah-33B-P006 33 33kV UGC 300 3C Cu 0.412 0.062 0.103 260.000 0.385
Amerat A Grid H-BB01 Post Office-33A-P150 Post Office-F1-P150 33 33kV UGC 300 3C Cu 2.756 0.062 0.103 260.000 0.385Amerat A Grid H-BB02 Post Office-33B-P150 Post Office-F2-P150 33 33kV UGC 300 3C Cu 2.770 0.062 0.103 260.000 0.385Amerat A Grid H-BB01 Amerat 3-33A-P179 Amerat 3-F1-P179 33 33kV UGC 300 3C Cu 4.964 0.062 0.103 260.000 0.385Amerat A Grid H-BB02 Amerat 3-33B-P179 Amerat 3-F2-P179 33 33kV UGC 300 3C Cu 4.965 0.062 0.103 260.000 0.385Amerat A Grid H-BB02 Amerat 3-33C-P179 Amerat 3-F3-P179 33 33kV UGC 300 3C Cu 4.968 0.062 0.103 260.000 0.385Amerat A Grid H-BB01 Amerat Heights-33A-P152 Amerat Heights-F1-P152 33 33kV UGC 300 3C Cu 6.091 0.062 0.103 260.000 0.385Amerat A Grid H-BB02 Amerat Heights-33B-P152 Amerat Heights-F2-P152 33 33kV UGC 300 3C Cu 6.090 0.062 0.103 260.000 0.385Amerat A Grid H-BB01 Amerat 2-33-P177 Amerat 2-F1-P177 33 33kV OHL 200 Panther ACSR 4.200 0.137 0.333 10.900 0.385
Node 1 Node 2 33kV Feeder IDNetwork
Level[kV]
Type NameLength [km]
Resistance( R )
[Ohm/km]
Reactance( X )
[Ohm/km]
Capacitance( C )
[nF/km]
Continuous Rating
[kAmps]Amerat A Grid H-BB01 Seih Dhabi-33A-P118 Seih Dhabi-F1-P118 33 33kV UGC 300 3C Cu 0.507 0.062 0.103 260.000 0.385Amerat A Grid H-BB04 Seih Dhabi-33B-P118 Seih Dhabi-F2-P118 33 33kV UGC 300 3C Cu 0.501 0.062 0.103 260.000 0.385Amerat B Grid H-BB03 - 33 33kV OHL 200 Panther ACSR 4.926 0.137 0.333 10.900 0.385
- - 33 33kV OHL 200 Panther ACSR 1.416 0.137 0.333 10.900 0.385- Madinat Al Nahdah-33A-P065 33 33kV UGC 300 3C Cu 0.663 0.062 0.103 260.000 0.385
Amerat B Grid H-BB03 - 33 33kV OHL 200 Panther ACSR 4.926 0.137 0.333 10.900 0.385- Al Jufaina-33-P194 33 33kV OHL 200 Panther ACSR 0.010 0.137 0.333 10.900 0.385
Node 1 Node 2 33kV Feeder IDNetwork
Level[kV]
Type NameLength [km]
Resistance( R )
[Ohm/km]
Reactance( X )
[Ohm/km]
Capacitance( C )
[nF/km]
Continuous Rating
[kAmps]Ghubrah Grid H-BB01 Azaiba North 2-33A-P012 Azaiba North 2-F1-P012 33 33kV UGC 300 3C Cu 4.286 0.062 0.103 260.000 0.385Ghubrah Grid H-BB02 Azaiba North 2-33B-P012 Azaiba North 2-F2-P012 33 33kV UGC 300 3C Cu 4.301 0.062 0.103 260.000 0.385
Ghubrah Grid H-BB01 - 33 33kV OHL 150 Wolf ACSR 2.732 0.186 0.337 10.800 0.350
- Azaiba South 1A-33A-P014 33 33kV UGC 300 3C Cu 5.712 0.062 0.103 260.000 0.385
Ghubrah Grid H-BB02 - 33 33kV OHL 150 Wolf ACSR 3.257 0.186 0.337 10.800 0.350
- Azaiba South 1A-33B-P014 33 33kV UGC 300 3C Cu 5.284 0.062 0.103 260.000 0.385
Ghubrah Grid H-BB02 Diplomatic City 1-33A-P022 Diplomatic City 1-F1-P022 33 33kV UGC 300 3C Cu 2.424 0.062 0.103 260.000 0.385Ghubrah Grid H-BB02 Diplomatic City 1-33B-P022 Diplomatic City 1-F2-P022 33 33kV UGC 300 3C Cu 2.427 0.062 0.103 260.000 0.385Ghubrah Grid H-BB01 Diplomatic City 1-33C-P022 Diplomatic City 1-F3-P022 33 33kV UGC 300 3C Cu 1.688 0.062 0.103 260.000 0.385Ghubrah Grid H-BB01 Ghubra North 1-33A-P023 Ghubra North 1-F1-P023 33 33kV UGC 300 3C Cu 1.295 0.062 0.103 260.000 0.385Ghubrah Grid H-BB02 Ghubra North 1-33B-P023 Ghubra North 1-F2-P023 33 33kV UGC 300 3C Cu 1.303 0.062 0.103 260.000 0.385Ghubrah Grid H-BB01 Ghubra North 1-33C-P023 Ghubra North 1-F3-P023 33 33kV UGC 300 3C Cu 1.316 0.062 0.103 260.000 0.385
Ghubrah Grid H-BB01 Ghubrah GPS-33A-P166-Pvt Ghubrah GPS-F1-P166-Pvt 33 33kV UGC 300 3C Cu 1.065 0.062 0.103 260.000 0.385
Ghubrah Grid H-BB02 Ghubrah GPS-33B-P166-Pvt Ghubrah GPS-F2-P166-Pvt 33 33kV UGC 300 3C Cu 1.065 0.062 0.103 260.000 0.385Ghubrah Grid H-BB01 Ghubrah North 02-33A-P149 Ghubrah North 02-F1-P149 33 33kV UGC 300 3C Cu 3.740 0.062 0.103 260.000 0.385Ghubrah Grid H-BB02 Ghubrah North 02-33B-P149 Ghubrah North 02-F2-P149 33 33kV UGC 300 3C Cu 3.751 0.062 0.103 260.000 0.385Ghubrah Grid H-BB01 Ghubrah North 02-33C-P149 Ghubrah North 02-F3-P149 33 33kV UGC 300 3C Cu 3.756 0.062 0.103 260.000 0.385
Node 1 Node 2 33kV Feeder IDNetwork
Level[kV]
Type NameLength [km]
Resistance( R )
[Ohm/km]
Reactance( X )
[Ohm/km]
Capacitance( C )
[nF/km]
Continuous Rating
[kAmps]MSQ Grid H-BB01 Al Khuwair North-33A-P054 Al Khuwair North-F1-P054 33 33kV UGC 300 3C Cu 1.791 0.062 0.103 260.000 0.385MSQ Grid H-BB02 Al Khuwair North-33B-P054 Al Khuwair North-F2-P054 33 33kV UGC 300 3C Cu 1.791 0.062 0.103 260.000 0.385MSQ Grid H-BB02 Al Khuwair North-33C-P054 Al Khuwair North-F3-P054 33 33kV UGC 300 3C Cu 1.791 0.062 0.103 260.000 0.385MSQ Grid H-BB01 - 33 33kV UGC 300 3C Cu 3.237 0.062 0.103 260.000 0.385
- - 33 33kV OHL 200 Panther ACSR 1.229 0.137 0.333 10.900 0.385- Intercontinental-33A-P109 33 33kV UGC 300 3C Cu 1.774 0.062 0.103 260.000 0.385
MSQ Grid H-BB02 Intercontinental-33B-P109 Intercontinental-F2-P109 33 33kV UGC 300 3C Cu 4.884 0.062 0.103 260.000 0.385MSQ Grid H-BB01 Royal Office-33A-P097 Royal Office-F1-P097 33 33kV UGC 300 3C Cu 5.361 0.062 0.103 260.000 0.385MSQ Grid H-BB02 Royal Office-33B-P097 Royal Office-F2-P097 33 33kV UGC 300 3C Cu 5.356 0.062 0.103 260.000 0.385
MSQ Grid H-BB01 Sarooj -Shati Al Qurum-33B-P110 Sarooj -Shati Al Qurum-F1-P110 33 33kV UGC 300 3C Cu 4.297 0.062 0.103 260.000 0.385
MSQ Grid H-BB02 Sarooj -Shati Al Qurum-33A-P110 Sarooj -Shati Al Qurum-F2-P110 33 33kV UGC 300 3C Cu 4.257 0.062 0.103 260.000 0.385
MSQ Grid H-BB01 - 33 33kV UGC 300 3C Cu 3.237 0.062 0.103 260.000 0.385- Information City 2-33-P038 33 33kV OHL 200 Panther ACSR 1.229 0.137 0.333 10.900 0.385
MSQ Grid H-BB01 MSQ Grid-33A-GP06 MSQ Grid-F1-GP06 33 33kV UGC 300 3C Cu 0.030 0.062 0.103 260.000 0.385MSQ Grid H-BB02 MSQ Grid-33B-GP06 MSQ Grid-F2-GP06 33 33kV UGC 300 3C Cu 0.029 0.062 0.103 260.000 0.385
Intercontinental-F1-P109
Madinat Al Nahdah-F1-P065
Amerat[G10] - B GSS [Zone 1]
Madinat Al Nahdah-F1-P065
Al Nahdah-F1-P006
Al Nahdah-F2-P006
Azaiba South 1A-F1-P014
Azaiba South 1A-F2-P014
Intercontinental-F1-P109
Amerat[G10] - A GSS [Zone 1]
Ghubrah 2[G09] GSS [Zone 2]
MSQ[GP06] - A GSS [Zone 2]
MEDC Distribution System Capability Statement [2020-2022]-V1.0 129

Node 1 Node 2 33kV Feeder IDNetwork
Level[kV]
Type NameLength [km]
Resistance( R )
[Ohm/km]
Reactance( X )
[Ohm/km]
Capacitance( C )
[nF/km]
Continuous Rating
[kAmps]MSQ Grid H-BB03 - 33 33kV OHL 200 Panther ACSR 0.883 0.137 0.333 10.900 0.385
- Al Khuwair 25-33A-P053 33 33kV UGC 300 3C Cu 2.123 0.062 0.103 260.000 0.385MSQ Grid H-BB04 - 33 33kV OHL 200 Panther ACSR 0.848 0.137 0.333 10.900 0.385
- Al Khuwair 25-33B-P053 33 33kV UGC 300 3C Cu 2.126 0.062 0.103 260.000 0.385MSQ Grid H-BB03 Al Khuwair School-33A-P146 Al Khuwair School-F1-P146 33 33kV UGC 300 3C Cu 2.883 0.062 0.103 260.000 0.385MSQ Grid H-BB03 Al Khuwair School-33B-P146 Al Khuwair School-F2-P146 33 33kV UGC 300 3C Cu 2.878 0.062 0.103 260.000 0.385MSQ Grid H-BB04 Al Khuwair School-33C-P146 Al Khuwair School-F3-P146 33 33kV UGC 300 3C Cu 2.875 0.062 0.103 260.000 0.385MSQ Grid H-BB03 Digital TV Studio-33A-P039 Digital TV Studio-F1-P039 33 33kV UGC 300 3C Cu 3.622 0.062 0.103 260.000 0.385MSQ Grid H-BB04 Digital TV Studio-33B-P039 Digital TV Studio-F2-P039 33 33kV UGC 300 3C Cu 3.627 0.062 0.103 260.000 0.385MSQ Grid H-BB03 MSQ 1-33A-P083 MSQ 1-F1-P083 33 33kV UGC 300 3C Cu 1.632 0.062 0.103 260.000 0.385MSQ Grid H-BB04 MSQ 1-33B-P083 MSQ 1-F2-P083 33 33kV UGC 300 3C Cu 1.614 0.062 0.103 260.000 0.385
MSQ Grid H-BB03 ROP -Shati Al Qurum-33A-P111 ROP -Shati Al Qurum-F1-P111 33 33kV UGC 300 3C Cu 3.290 0.062 0.103 260.000 0.385
MSQ Grid H-BB04 ROP -Shati Al Qurum-33B-P111 ROP -Shati Al Qurum-F2-P111 33 33kV UGC 300 3C Cu 3.302 0.062 0.103 260.000 0.385
Node 1 Node 2 33kV Feeder IDNetwork
Level[kV]
Type NameLength [km]
Resistance( R )
[Ohm/km]
Reactance( X )
[Ohm/km]
Capacitance( C )
[nF/km]
Continuous Rating
[kAmps]Qurum Grid H-BB01 - 33 33kV OHL 200 Panther ACSR 0.997 0.137 0.333 10.900 0.385
- - 33 33kV UGC 300 3C Cu 1.553 0.062 0.103 260.000 0.385- Information City 1-33A-P037 33 33kV UGC 300 3C Cu 0.952 0.062 0.103 260.000 0.385
Qurum Grid H-BB02 - 33 33kV OHL 200 Panther ACSR 0.116 0.137 0.333 10.900 0.385- Information City 1-33B-P037 33 33kV UGC 300 3C Cu 2.990 0.062 0.103 260.000 0.385
Qurum Grid H-BB01 - 33 33kV UGC 300 3C Cu 1.328 0.062 0.103 260.000 0.385- Lulai-33A-P095 33 33kV UGC 300 3C Cu 0.476 0.062 0.103 260.000 0.385
Qurum Grid H-BB01 - 33 33kV OHL 200 Panther ACSR 0.475 0.137 0.333 10.900 0.385- Lulai-33B-P095 33 33kV UGC 300 3C Cu 1.276 0.062 0.103 260.000 0.385
Qurum Grid H-BB01 MSQ 02-33A-P155 MSQ 02-F1-P155 33 33kV UGC 300 3C Cu 4.034 0.062 0.103 260.000 0.385Qurum Grid H-BB02 MSQ 02-33B-P155 MSQ 02-F2-P155 33 33kV UGC 300 3C Cu 4.062 0.062 0.103 260.000 0.385Qurum Grid H-BB01 MSQ 02-33C-P155 MSQ 02-F3-P155 33 33kV UGC 300 3C Cu 3.951 0.062 0.103 260.000 0.385Qurum Grid H-BB01 - 33 33kV UGC 300 3C Cu 5.990 0.062 0.103 260.000 0.385- Qurum 1-33A-P093 33 33kV OHL 200 Panther ACSR 0.469 0.137 0.333 10.900 0.385Qurum Grid H-BB02 Qurum 1-33B-P093 Qurum 1-F2-P093 33 33kV UGC 300 3C Cu 6.051 0.062 0.103 260.000 0.385Qurum Grid H-BB01 - 33 33kV OHL 200 Panther ACSR 0.480 0.137 0.333 10.900 0.385
- Qurum 2-33A-P094 33 33kV UGC 300 3C Cu 3.770 0.062 0.103 260.000 0.385Qurum Grid H-BB02 Qurum 2-33B-P094 Qurum 2-F2-P094 33 33kV UGC 300 3C Cu 3.977 0.062 0.103 260.000 0.385Qurum Grid H-BB01 Rabiat Al Qurum-33A-P096 Rabiat Al Qurum-F1-P096 33 33kV UGC 300 3C Cu 1.070 0.062 0.103 260.000 0.385Qurum Grid H-BB02 Rabiat Al Qurum-33B-P096 Rabiat Al Qurum-F2-P096 33 33kV UGC 300 3C Cu 1.087 0.062 0.103 260.000 0.385
Node 1 Node 2 33kV Feeder IDNetwork
Level[kV]
Type NameLength [km]
Resistance( R )
[Ohm/km]
Reactance( X )
[Ohm/km]
Capacitance( C )
[nF/km]
Continuous Rating
[kAmps]Bousher Grid H-BB01 Al Khuwair 17/1-33A-P050 Al Khuwair 17/1-F1-P050 33 33kV UGC 300 3C Cu 2.979 0.062 0.103 260.000 0.385Bousher Grid H-BB02 Al Khuwair 17/1-33B-P050 Al Khuwair 17/1-F2-P050 33 33kV UGC 300 3C Cu 2.991 0.062 0.103 260.000 0.385Bousher Grid H-BB01 - 33 33kV OHL 200 Panther ACSR 0.089 0.137 0.333 10.900 0.385
- Al Khuwair South-33A-P052 33 33kV UGC 300 3C Cu 1.130 0.062 0.103 260.000 0.385Bousher Grid H-BB02 - 33 33kV OHL 200 Panther ACSR 0.090 0.137 0.333 10.900 0.385
- Al Khuwair South-33B-P052 33 33kV UGC 300 3C Cu 1.142 0.062 0.103 260.000 0.385Bousher Grid H-BB01 - 33 33kV OHL 200 Panther ACSR 0.089 0.137 0.333 10.900 0.385
- Al Khuwair South-33C-P052 33 33kV UGC 300 3C Cu 1.088 0.062 0.103 260.000 0.385Bousher Grid H-BB01 Bousher G-33A-GP02 Bousher G-F1-GP02 33 33kV UGC 300 3C Cu 0.030 0.062 0.103 260.000 0.385Bousher Grid H-BB02 Bousher G-33B-GP02 Bousher G-F2-GP02 33 33kV UGC 300 3C Cu 0.029 0.062 0.103 260.000 0.385Bousher Grid H-BB01 Royal Hospital-33A-P024 Royal Hospital-F1-P024 33 33kV UGC 300 3C Cu 3.940 0.062 0.103 260.000 0.385Bousher Grid H-BB02 Royal Hospital-33B-P024 Royal Hospital-F2-P024 33 33kV UGC 300 3C Cu 3.939 0.062 0.103 260.000 0.385Bousher Grid H-BB02 Royal Hospital-33C-P024 Royal Hospital-F3-P024 33 33kV UGC 300 3C Cu 3.933 0.062 0.103 260.000 0.385Bousher Grid H-BB01 Azaiba South 1B-33A-P147 Azaiba South 1B-F3-P147 33 33kV UGC 300 3C Cu 6.079 0.062 0.103 260.000 0.385Bousher Grid H-BB02 Azaiba South 1B-33B-P147 Azaiba South 1B-F4-P147 33 33kV UGC 300 3C Cu 6.087 0.062 0.103 260.000 0.385Bousher Grid H-BB01 Azaiba South 1B-33C-P147 Azaiba South 1B-F5-P147 33 33kV UGC 300 3C Cu 6.088 0.062 0.103 260.000 0.385
Node 1 Node 2 33kV Feeder IDNetwork
Level[kV]
Type NameLength [km]
Resistance( R )
[Ohm/km]
Reactance( X )
[Ohm/km]
Capacitance( C )
[nF/km]
Continuous Rating
[kAmps]Bousher Grid H-BB03 Al Ansab 1-33A-P007 Al Ansab 1-F1-P007 33 33kV UGC 300 3C Cu 8.252 0.062 0.103 260.000 0.385Bousher Grid H-BB04 Al Ansab 1-33B-P007 Al Ansab 1-F2-P007 33 33kV UGC 300 3C Cu 8.285 0.062 0.103 260.000 0.385Bousher Grid H-BB03 Al Muna 1-33A-P084 Al Muna 1-F1-P084 33 33kV UGC 300 3C Cu 4.691 0.062 0.103 260.000 0.385Bousher Grid H-BB04 Al Muna 1-33B-P084 Al Muna 1-F2-P084 33 33kV UGC 300 3C Cu 4.676 0.062 0.103 260.000 0.385Bousher Grid H-BB03 Azaiba North 1-33A-P011 Azaiba North 1-F1-P011 33 33kV UGC 300 3C Cu 5.511 0.062 0.103 260.000 0.385Bousher Grid H-BB04 Azaiba North 1-33B-P011 Azaiba North 1-F2-P011 33 33kV UGC 300 3C Cu 5.505 0.062 0.103 260.000 0.385Bousher Grid H-BB03 Bousher 02-33A-P163 Bousher 02-F1-P163 33 33kV UGC 300 3C Cu 0.987 0.062 0.103 260.000 0.385Bousher Grid H-BB04 Bousher 02-33B-P163 Bousher 02-F2-P163 33 33kV UGC 300 3C Cu 0.999 0.062 0.103 260.000 0.385Bousher Grid H-BB04 Bousher 02-33C-P163 Bousher 02-F3-P163 33 33kV UGC 300 3C Cu 1.003 0.062 0.103 260.000 0.385Bousher Grid H-BB04 Ghubrah South 1-33A-P026 Ghubrah South 1-F1-P026 33 33kV UGC 300 3C Cu 3.374 0.062 0.103 260.000 0.385Bousher Grid H-BB03 Ghubrah South 1-33B-P026 Ghubrah South 1-F2-P026 33 33kV UGC 300 3C Cu 3.341 0.062 0.103 260.000 0.385Bousher Grid H-BB04 Ghubrah South 1-33C-P026 Ghubrah South 1-F3-P026 33 33kV UGC 300 3C Cu 3.399 0.062 0.103 260.000 0.385Bousher Grid H-BB03 Holiday Inn-33A-P051 Holiday Inn-F1-P051 33 33kV UGC 300 3C Cu 1.686 0.062 0.103 260.000 0.385Bousher Grid H-BB04 Holiday Inn-33B-P051 Holiday Inn-F2-P051 33 33kV UGC 300 3C Cu 1.774 0.062 0.103 260.000 0.385Bousher Grid H-BB03 Holiday Inn-33C-P051 Holiday Inn-F3-P051 33 33kV UGC 300 3C Cu 1.681 0.062 0.103 260.000 0.385Bousher Grid H-BB03 Tilal Al Khuwair-33A-P055 Tilal Al Khuwair-F1-P055 33 33kV UGC 300 3C Cu 1.346 0.062 0.103 260.000 0.385Bousher Grid H-BB04 Tilal Al Khuwair-33B-P055 Tilal Al Khuwair-F2-P055 33 33kV UGC 300 3C Cu 1.347 0.062 0.103 260.000 0.385Bousher Grid H-BB03 Tilal Al Khuwair-33C-P055 Tilal Al Khuwair-F3-P055 33 33kV UGC 300 3C Cu 1.351 0.062 0.103 260.000 0.385
Information City 1-F1-P037
Information City 1-F2-P037
Lulai-F1-P095
Lulai-F2-P095
MSQ[GP06] - B GSS [Zone 2]
Bousher[GP02] - B GSS [Zone 2]
Al Khuwair 25-F1-P053
Al Khuwair 25-F2-P053
Qurum[G06] GSS [Zone 2]
Bousher[GP02] - A GSS [Zone 2]
Qurum 2-F1-P094
Al Khuwair South-F1-P052
Al Khuwair South-F2-P052
Al Khuwair South-F3-P052
Qurum 1-F1-P093
MEDC Distribution System Capability Statement [2020-2022]-V1.0 130

Node 1 Node 2 33kV Feeder IDNetwork
Level[kV]
Type NameLength [km]
Resistance( R )
[Ohm/km]
Reactance( X )
[Ohm/km]
Capacitance( C )
[nF/km]
Continuous Rating
[kAmps]Ghala Heights Grid H-BB03 Mall of Oman-33B-P171 Mall of Oman-F1-P171 33 33kV UGC 300 3C Cu 3.939 0.062 0.103 260.000 0.385Ghala Heights Grid H-BB04 Mall of Oman-33C-P171 Mall of Oman-F2-P171 33 33kV UGC 300 3C Cu 3.938 0.062 0.103 260.000 0.385Ghala Heights Grid H-BB03 Mall of Oman-33A-P171 Mall of Oman-F3-P171 33 33kV UGC 300 3C Cu 3.933 0.062 0.103 260.000 0.385
Node 1 Node 2 33kV Feeder IDNetwork
Level[kV]
Type NameLength [km]
Resistance( R )
[Ohm/km]
Reactance( X )
[Ohm/km]
Capacitance( C )
[nF/km]
Continuous Rating
[kAmps]Ghala Grid H-BB01 Ansab 2-33A-P008 Ansab 2-F1-P008 33 33kV UGC 300 3C Cu 6.750 0.062 0.103 260.000 0.385Ghala Grid H-BB02 Ansab 2-33B-P008 Ansab 2-F2-P008 33 33kV UGC 300 3C Cu 6.749 0.062 0.103 260.000 0.385Ghala Grid H-BB01 Ansab STP-33A-P009 Ansab STP-F1-P009 33 33kV UGC 300 3C Cu 2.424 0.062 0.103 260.000 0.385Ghala Grid H-BB02 Ansab STP-33B-P009 Ansab STP-F2-P009 33 33kV UGC 300 3C Cu 2.421 0.062 0.103 260.000 0.385Ghala Grid H-BB01 Ghala 1-33A-P015 Ghala 1-F1-P015 33 33kV UGC 300 3C Cu 9.850 0.062 0.103 260.000 0.385Ghala Grid H-BB02 Ghala 1-33B-P015 Ghala 1-F2-P015 33 33kV UGC 300 3C Cu 9.850 0.062 0.103 260.000 0.385Ghala Grid H-BB01 Ghala 2-33A-P156 Ghala 2-F1-P156 33 33kV UGC 300 3C Cu 7.621 0.062 0.103 260.000 0.385Ghala Grid H-BB02 Ghala 2-33B-P156 Ghala 2-F2-P156 33 33kV UGC 300 3C Cu 7.635 0.062 0.103 260.000 0.385Ghala Grid H-BB01 Ghala 2-33C-P156 Ghala 2-F3-P156 33 33kV UGC 300 3C Cu 7.604 0.062 0.103 260.000 0.385Ghala Grid H-BB01 MOD Al Ansab-33A-P167 MOD Al Ansab-F1-P167 33 33kV UGC 300 3C Cu 6.430 0.062 0.103 260.000 0.385Ghala Grid H-BB02 MOD Al Ansab-33B-P167 MOD Al Ansab-F2-P167 33 33kV UGC 300 3C Cu 6.074 0.062 0.103 260.000 0.385Ghala Grid H-BB01 Oman Exhibition-33C-P165 Oman Exhibition-F1-P165 33 33kV UGC 300 3C Cu 0.348 0.062 0.103 260.000 0.385Ghala Grid H-BB01 Oman Exhibition-33A-P165 Oman Exhibition-F2-P165 33 33kV UGC 300 3C Cu 0.349 0.062 0.103 260.000 0.385Ghala Grid H-BB02 Oman Exhibition-33B-P165 Oman Exhibition-F3-P165 33 33kV UGC 300 3C Cu 0.353 0.062 0.103 260.000 0.385
Node 1 Node 2 33kV Feeder IDNetwork
Level[kV]
Type NameLength [km]
Resistance( R )
[Ohm/km]
Reactance( X )
[Ohm/km]
Capacitance( C )
[nF/km]
Continuous Rating
[kAmps]Airport Height Grid H-BB01 Airport Height 1-33A-P001 Airport Height 1-F1-P001 33 33kV UGC 300 3C Cu 3.997 0.062 0.103 260.000 0.385Airport Height Grid H-BB02 Airport Height 1-33B-P001 Airport Height 1-F2-P001 33 33kV UGC 300 3C Cu 3.956 0.062 0.103 260.000 0.385Airport Height Grid H-BB01 Airport Height 2-33A-P002 Airport Height 2-F1-P002 33 33kV UGC 300 3C Cu 3.465 0.062 0.103 260.000 0.385Airport Height Grid H-BB02 Airport Height 2-33B-P002 Airport Height 2-F2-P002 33 33kV UGC 300 3C Cu 3.512 0.062 0.103 260.000 0.385Airport Height Grid H-BB01 Airport Height 3-33A-P003 Airport Height 3-F1-P003 33 33kV UGC 300 3C Cu 4.589 0.062 0.103 260.000 0.385Airport Height Grid H-BB02 Airport Height 3-33B-P003 Airport Height 3-F2-P003 33 33kV UGC 300 3C Cu 4.671 0.062 0.103 260.000 0.385Airport Height Grid H-BB01 Airport Height 4-33A-P004 Airport Height 4-F1-P004 33 33kV UGC 300 3C Cu 2.426 0.062 0.103 260.000 0.385Airport Height Grid H-BB02 Airport Height 4-33B-P004 Airport Height 4-F2-P004 33 33kV UGC 300 3C Cu 2.503 0.062 0.103 260.000 0.385Airport Height Grid H-BB01 Airport Height 5-33A-P151 Airport Height 5-F1-P151 33 33kV UGC 300 3C Cu 5.493 0.062 0.103 260.000 0.385Airport Height Grid H-BB02 Airport Height 5-33B-P151 Airport Height 5-F2-P151 33 33kV UGC 300 3C Cu 5.551 0.062 0.103 260.000 0.385Airport Height Grid H-BB01 Azaiba North 3-33A-P013 Azaiba North 3-F1-P013 33 33kV UGC 300 3C Cu 9.130 0.062 0.103 260.000 0.385Airport Height Grid H-BB02 Azaiba North 3-33B-P013 Azaiba North 3-F2-P013 33 33kV UGC 300 3C Cu 9.202 0.062 0.103 260.000 0.385Airport Height Grid H-BB01 Azaiba North 3-33C-P013 Azaiba North 3-F3-P013 33 33kV UGC 300 3C Cu 9.129 0.062 0.103 260.000 0.385
Airport Height Grid H-BB01 MOD Technical College-33A-P081 MOD Technical College-F1-P081 33 33kV UGC 300 3C Cu 1.314 0.062 0.103 260.000 0.385
Airport Height Grid H-BB02 MOD Technical College-33B-P081 MOD Technical College-F2-P081 33 33kV UGC 300 3C Cu 1.266 0.062 0.103 260.000 0.385
Airport Height Grid H-BB02 ROP Hospital-33-P172 ROP Hospital-F1-P172 33 33kV UGC 300 3C Cu 2.035 0.062 0.103 260.000 0.385
Node 1 Node 2 33kV Feeder IDNetwork
Level[kV]
Type NameLength [km]
Resistance( R )
[Ohm/km]
Reactance( X )
[Ohm/km]
Capacitance( C )
[nF/km]
Continuous Rating
[kAmps]Rusail Industrial H-BB01 - 33 33kV OHL 200 Panther ACSR 1.263 0.137 0.333 10.900 0.385
- - 33 33kV OHL 200 Panther ACSR 1.097 0.137 0.333 10.900 0.385- - 33 33kV OHL 200 Panther ACSR 6.717 0.137 0.333 10.900 0.385- Cement Housing-33A-P088 33 33kV UGC 300 3C Cu 1.262 0.062 0.103 260.000 0.385
Rusail Industrial H-BB01 - 33 33kV OHL 200 Panther ACSR 8.932 0.137 0.333 10.900 0.385- Cement Housing-33B-P088 33 33kV UGC 300 3C Cu 1.228 0.062 0.103 260.000 0.385
Rusail Industrial H-BB01 - 33 33kV OHL 200 Panther ACSR 1.263 0.137 0.333 10.900 0.385- - 33 33kV OHL 200 Panther ACSR 1.097 0.137 0.333 10.900 0.385- - 33 33kV OHL 200 Panther ACSR 3.514 0.137 0.333 10.900 0.385- Al Jifnain 1-33-P042 33 33kV UGC 300 3C Cu 1.035 0.062 0.103 260.000 0.385
Rusail Industrial H-BB01 Rusail Industrial 1-33A-P103 Rusail Industrial 1-F1-P103 33 33kV UGC 300 3C Cu 0.547 0.062 0.103 260.000 0.385Rusail Industrial H-BB02 Rusail Industrial 1-33B-P103 Rusail Industrial 1-F2-P103 33 33kV UGC 300 3C Cu 0.541 0.062 0.103 260.000 0.385Rusail Industrial H-BB01 Rusail Industrial 2-33A-P104 Rusail Industrial 2-F1-P104 33 33kV UGC 300 3C Cu 1.991 0.062 0.103 260.000 0.385Rusail Industrial H-BB01 SQU 1-33A-P122 SQU 1-F1-P122 33 33kV UGC 300 3C Cu 4.821 0.062 0.103 260.000 0.385Rusail Industrial H-BB02 SQU 1-33B-P122 SQU 1-F2-P122 33 33kV UGC 300 3C Cu 4.821 0.062 0.103 260.000 0.385Rusail Industrial H-BB01 SQU 1-33C-P122 SQU 1-F3-P122 33 33kV UGC 300 3C Cu 4.821 0.062 0.103 260.000 0.385Rusail Industrial H-BB01 SQU 2-33A-P123 SQU 2-F1-P123 33 33kV UGC 300 3C Cu 6.866 0.062 0.103 260.000 0.385Rusail Industrial H-BB02 SQU 2-33B-P123 SQU 2-F2-P123 33 33kV UGC 300 3C Cu 6.866 0.062 0.103 260.000 0.385
Ghala[G11] - A GSS [Zone 2]
Rusail Industry[G13] - A GSS [Zone 3]
Cement Housing-F1-P088
Cement Housing-F2-P088
Cement Housing-F1-P088
Ghala Heights[G24] GSS [Zone 2]
Airport Heights [G01] - A GSS [Zone 3]
MEDC Distribution System Capability Statement [2020-2022]-V1.0 131

Node 1 Node 2 33kV Feeder IDNetwork
Level[kV]
Type NameLength [km]
Resistance( R )
[Ohm/km]
Reactance( X )
[Ohm/km]
Capacitance( C )
[nF/km]
Continuous Rating
[kAmps]Rusail Industrial H-BB03 Rusail Industrial 2-33B-P104 Rusail Industrial 2-F2-P104 33 33kV UGC 300 3C Cu 1.990 0.062 0.103 260.000 0.385Rusail Industrial H-BB03 ROP Al Khoudh-33A-P161 ROP Al Khoudh-F1-P161 33 33kV UGC 300 3C Cu 7.000 0.062 0.103 260.000 0.385Rusail Industrial H-BB04 ROP Al Khoudh-33B-P161 ROP Al Khoudh-F2-P161 33 33kV UGC 300 3C Cu 7.000 0.062 0.103 260.000 0.385Rusail Industrial H-BB03 Rusail 08-33A-P164 Rusail 08-F1-P164 33 33kV UGC 300 3C Cu 5.100 0.062 0.103 260.000 0.385Rusail Industrial H-BB04 Rusail 08-33B-P164 Rusail 08-F2-P164 33 33kV UGC 300 3C Cu 5.100 0.062 0.103 260.000 0.385Rusail Industrial H-BB04 Rusail 08-33C-P164 Rusail 08-F3-P164 33 33kV UGC 300 3C Cu 5.100 0.062 0.103 260.000 0.385Rusail Industrial H-BB03 Rusail Ind 4-33A-P158 Rusail Ind 4-F1-P158 33 33kV UGC 300 3C Cu 0.164 0.062 0.103 260.000 0.385Rusail Industrial H-BB03 Rusail Ind 4-33B-P158 Rusail Ind 4-F2-P158 33 33kV UGC 300 3C Cu 0.157 0.062 0.103 260.000 0.385Rusail Industrial H-BB04 Rusail Ind 4-33C-P158 Rusail Ind 4-F3-P158 33 33kV UGC 300 3C Cu 0.145 0.062 0.103 260.000 0.385Rusail Industrial H-BB03 Rusail Industrial 3-33A-P105 Rusail Industrial 3-F1-P105 33 33kV UGC 300 3C Cu 2.829 0.062 0.103 260.000 0.385Rusail Industrial H-BB04 Rusail Industrial 3-33B-P105 Rusail Industrial 3-F2-P105 33 33kV UGC 300 3C Cu 2.822 0.062 0.103 260.000 0.385
Rusail Industrial H-BB03 Rusail Private Factory-33A-P106 Rusail Private Factory-F1-P106 33 33kV UGC 300 3C Cu 0.795 0.062 0.103 260.000 0.385
Rusail Industrial H-BB04 Rusail Private Factory-33B-P106 Rusail Private Factory-F2-P106 33 33kV UGC 300 3C Cu 0.795 0.062 0.103 260.000 0.385
Rusail Industrial H-BB03 Rusail Housing-33A-P056 Rusail Housing-F1-P056 33 33kV UGC 300 3C Cu 3.993 0.062 0.103 260.000 0.385Rusail Industrial H-BB04 Rusail Housing-33B-P056 Rusail Housing-F2-P056 33 33kV UGC 300 3C Cu 3.987 0.062 0.103 260.000 0.385Rusail Industrial H-BB03 SQU 03-33A-P160 SQU 03-F1-P160 33 33kV UGC 300 3C Cu 6.734 0.062 0.103 260.000 0.385Rusail Industrial H-BB04 SQU 03-33B-P160 SQU 03-F2-P160 33 33kV UGC 300 3C Cu 6.731 0.062 0.103 260.000 0.385Rusail Industrial H-BB04 SQU 03-33C-P160 SQU 03-F3-P160 33 33kV UGC 300 3C Cu 6.734 0.062 0.103 260.000 0.385
Node 1 Node 2 33kV Feeder IDNetwork
Level[kV]
Type NameLength [km]
Resistance( R )
[Ohm/km]
Reactance( X )
[Ohm/km]
Capacitance( C )
[nF/km]
Continuous Rating
[kAmps]Misfah Grid H-BB02 - 33 33kV UGC 300 3C Cu 6.724 0.062 0.103 260.000 0.385- Al Awabi-33A-P139 33 33kV OHL 200 Panther ACSR 0.370 0.137 0.333 10.900 0.385Misfah Grid H-BB01 Al Misfah-33A-P080 Al Misfah-F1-P080 33 33kV UGC 300 3C Cu 3.517 0.062 0.103 260.000 0.385Misfah Grid H-BB02 Al Misfah-33B-P080 Al Misfah-F2-P080 33 33kV UGC 300 3C Cu 3.540 0.062 0.103 260.000 0.385Misfah Grid H-BB01 Al Misfah-33C-P080 Al Misfah-F3-P080 33 33kV UGC 300 3C Cu 3.537 0.062 0.103 260.000 0.385Misfah Grid H-BB01 - 33 33kV OHL 200 Panther ACSR 1.800 0.137 0.333 10.900 0.385- Cement Factory 1-33A-P079 33 33kV UGC 300 3C Cu 1.446 0.062 0.103 260.000 0.385Misfah Grid H-BB02 - 33 33kV OHL 200 Panther ACSR 1.800 0.137 0.333 10.900 0.385- Cement Factory 1-33B-P079 33 33kV UGC 300 3C Cu 1.446 0.062 0.103 260.000 0.385Misfah Grid H-BB02 - 33 33kV OHL 200 Panther ACSR 1.800 0.137 0.333 10.900 0.385
- Cement Factory 1-33C-P079 33 33kV UGC 300 3C Cu 1.446 0.062 0.103 260.000 0.385Misfah Grid H-BB02 - 33 33kV OHL 200 Panther ACSR 1.800 0.137 0.333 10.900 0.385
- Cement Factory 1-33D-P079 33 33kV UGC 300 3C Cu 1.446 0.062 0.103 260.000 0.385Misfah Grid H-BB02 - 33 33kV OHL 200 Panther ACSR 1.800 0.137 0.333 10.900 0.385
- Cement Factory 1-33E-P079 33 33kV UGC 300 3C Cu 1.446 0.062 0.103 260.000 0.385Misfah Grid H-BB01 Orpic-33A-P192 Orpic-F1-P192 33 33kV UGC 300 3C Cu 9.708 0.062 0.103 260.000 0.385Misfah Grid H-BB01 Orpic-33B-P192 Orpic-F2-P192 33 33kV UGC 300 3C Cu 9.708 0.062 0.103 260.000 0.385
Node 1 Node 2 33kV Feeder IDNetwork
Level[kV]
Type NameLength [km]
Resistance( R )
[Ohm/km]
Reactance( X )
[Ohm/km]
Capacitance( C )
[nF/km]
Continuous Rating
[kAmps]Barka Grid H-BB01 - 33 33kV OHL 200 Panther ACSR 3.665 0.137 0.333 10.900 0.385
- Manoma 1-33A-P067 33 33kV UGC 300 3C Cu 4.370 0.062 0.103 260.000 0.385Barka Grid H-BB01 - 33 33kV OHL 200 Panther ACSR 5.000 0.137 0.333 10.900 0.385
- Manoma 1-33B-P067 33 33kV UGC 300 3C Cu 1.734 0.062 0.103 260.000 0.385Barka Grid H-BB01 - 33 33kV OHL 200 Panther ACSR 12.030 0.137 0.333 10.900 0.385
- Mabelah South-33A-P061 33 33kV UGC 300 3C Cu 1.444 0.062 0.103 260.000 0.385Barka Grid H-BB01 - 33 33kV OHL 200 Panther ACSR 12.021 0.137 0.333 10.900 0.385
- Mabelah South-33B-P061 33 33kV UGC 300 3C Cu 1.644 0.062 0.103 260.000 0.385Barka Grid H-BB01 - 33 33kV OHL 100 Dog ACSR 13.377 0.320 0.350 16.700 0.269
- Old Mabelah-33A-P059 33 33kV UGC 300 3C Cu 7.362 0.062 0.103 260.000 0.385Barka Grid H-BB02 RGO Halban Camp-33-P034 Old Mabelah F1 33 33kV OHL 100 Dog ACSR 3.900 0.320 0.350 16.700 0.269Barka Grid H-BB02 RGO Halban Camp-33-P034 33 33kV OHL 100 Dog ACSR 3.900 0.320 0.350 16.700 0.269
RGO Halban Camp-33-P034 Palace Communication-33-P033 33 33kV OHL 100 Dog ACSR 0.500 0.320 0.350 16.700 0.269
Node 1 Node 2 33kV Feeder IDNetwork
Level[kV]
Type NameLength [km]
Resistance( R )
[Ohm/km]
Reactance( X )
[Ohm/km]
Capacitance( C )
[nF/km]
Continuous Rating
[kAmps]Mabelah 1 Grid H-BB01 Sur Al Hadid -33A-P116 Sur Al Hadid-F1-P116 33 33kV UGC 300 3C Cu 13.083 0.062 0.103 260.000 0.385Mabelah 1 Grid H-BB02 Sur Al Hadid -33B-P116 Sur Al Hadid-F2-P116 33 33kV UGC 300 3C Cu 13.157 0.062 0.103 260.000 0.385Mabelah 1 Grid H-BB01 Mabelah Grid-33A-GP04 Mabelah Grid-F1-GP04 33 33kV UGC 300 3C Cu 0.052 0.062 0.103 260.000 0.385Mabelah 1 Grid H-BB02 Mabelah Grid-33B-GP04 Mabelah Grid-F2-GP04 33 33kV UGC 300 3C Cu 0.052 0.062 0.103 260.000 0.385Mabelah 1 Grid H-BB02 - 33 33kV UGC 300 3C Cu 2.774 0.062 0.103 260.000 0.385
- - 33 33kV OHL 200 Panther ACSR 1.594 0.137 0.333 10.900 0.385- Mabelah Industrial-33-P191 33 33kV UGC 300 3C Cu 0.272 0.062 0.103 260.000 0.385
Mabelah 1 Grid H-BB01 - 33 33kV UGC 300 3C Cu 3.579 0.062 0.103 260.000 0.385- Mabelah PH-5-33-P190 33 33kV OHL 200 Panther ACSR 7.217 0.137 0.333 10.900 0.385
Mabelah 1 Grid H-BB01 Mabelah A-33A-P063 Mabelah A-F1-P063 33 33kV UGC 300 3C Cu 4.001 0.062 0.103 260.000 0.385Mabelah 1 Grid H-BB02 Mabelah A-33B-P063 Mabelah A-F2-P063 33 33kV UGC 300 3C Cu 3.951 0.062 0.103 260.000 0.385Mabelah 1 Grid H-BB02 Mabelah A-33C-P063 Mabelah A-F3-P063 33 33kV UGC 300 3C Cu 3.951 0.062 0.103 260.000 0.385Mabelah 1 Grid H-BB02 - 33 33kV OHL 100 Dog ACSR 7.538 0.320 0.350 16.700 0.269
- Old Mabelah-33B-P059 33 33kV UGC 300 3C Cu 3.659 0.062 0.103 260.000 0.385Mabelah 1 Grid H-BB01 Mabelah STP-33A-P140 Mabelah STP-F1-P140 33 33kV UGC 300 3C Cu 11.536 0.062 0.103 260.000 0.385Mabelah 1 Grid H-BB02 Mabelah STP-33B-P140 Mabelah STP-F2-P140 33 33kV UGC 300 3C Cu 11.540 0.062 0.103 260.000 0.385Mabelah 1 Grid H-BB01 Mabelah South PH-7-33A-P141 Mabelah South PH-7-F1-P141 33 33kV UGC 300 3C Cu 7.305 0.062 0.103 260.000 0.385Mabelah 1 Grid H-BB02 Mabelah South PH-7-33B-P141 Mabelah South PH-7-F2-P141 33 33kV UGC 300 3C Cu 7.285 0.062 0.103 260.000 0.385Mabelah 1 Grid H-BB01 - 33 33kV OHL 200 Panther ACSR 0.525 0.137 0.333 10.900 0.385
- Botanic Garden-33A-P016 33 33kV UGC 300 3C Cu 7.844 0.062 0.103 260.000 0.385Mabelah 1 Grid H-BB02 - 33 33kV OHL 200 Panther ACSR 0.525 0.137 0.333 10.900 0.385
- Botanic Garden-33B-P016 33 33kV 3Cx300 7.721 0.060 0.104 260.000 0.435 - Old Mabelah F1 (Barka GSS) – This feeder feeds RGO Halban Camp-P034, Palace Communication-P033 and Old Mabelah-P059 (Transformer 1) primary substations
Mabelah PH-5-F1-P190
Old Mabelah-F1-P059
Old Mabelah-F2-P059
Botanic Garden-F1-P016
Botanic Garden-F2-P016
Rusail Industry[G13] - B GSS [Zone 3]
Mabelah[GP04] GSS [Zone 3]
Cement Factory 1-F2-P079
Cement Factory 1-F3-P079
Cement Factory 1-F4-P079
Cement Factory 1-F5-P079
Manoma 1-F2-P067
Mabelah South-F1-P061
Mabelah South-F2-P061
Misfah[G04] GSS [Zone 2]
Barka[G02] GSS [Zone 3]
Manoma 1-F1-P067
Al Ansab 5 Fdr-(Feeding Awabi P139)
Old Mabelah F1
Mabelah Industrial-F1-P191
Cement Factory 1-F1-P079
MEDC Distribution System Capability Statement [2020-2022]-V1.0 132

Node 1 Node 2 33kV Feeder IDNetwork
Level[kV]
Type NameLength [km]
Resistance( R )
[Ohm/km]
Reactance( X )
[Ohm/km]
Capacitance( C )
[nF/km]
Continuous Rating
[kAmps]A'Salam (Mobella 2A) Grid H-BB01
Mabelah C-33A-P064 Mabelah C-F1-P064 33 33kV UGC 300 3C Cu 0.941 0.062 0.103 260.000 0.385
A'Salam (Mobella 2A) Grid H-BB02
Mabelah C-33B-P064 Mabelah C-F2-P064 33 33kV UGC 300 3C Cu 0.941 0.062 0.103 260.000 0.385
A'Salam (Mobella 2A) Grid H-BB02
Mabelah C-33C-P064 Mabelah C-F3-P064 33 33kV UGC 300 3C Cu 0.941 0.062 0.103 260.000 0.385
A'Salam (Mobella 2A) Grid H-BB01
Mabelah Shabiya-33A-P060 Mabelah Shabiya-F1-P060 33 33kV UGC 300 3C Cu 3.354 0.062 0.103 260.000 0.385
A'Salam (Mobella 2A) Grid H-BB02
Mabelah Shabiya-33B-P060 Mabelah Shabiya-F2-P060 33 33kV UGC 300 3C Cu 3.321 0.062 0.103 260.000 0.385
A'Salam (Mobella 2A) Grid H-BB02
Mabelah Shabiya-33C-P060 Mabelah Shabiya-F3-P060 33 33kV UGC 300 3C Cu 3.354 0.062 0.103 260.000 0.385
A'Salam (Mobella 2A) Grid H-BB01
Mabelah South PH-4-33A-P062 Mabelah South PH-4-F1-P062 33 33kV UGC 300 3C Cu 3.573 0.062 0.103 260.000 0.385
A'Salam (Mobella 2A) Grid H-BB02
Mabelah South PH-4-33B-P062 Mabelah South PH-4-F2-P062 33 33kV UGC 300 3C Cu 3.553 0.062 0.103 260.000 0.385
A'Salam (Mobella 2A) Grid H-BB02
Mabelah South PH-4-33C-P062 Mabelah South PH-4-F3-P062 33 33kV UGC 300 3C Cu 3.497 0.062 0.103 260.000 0.385
A'Salam (Mobella 2A) Grid H-BB01
Mabelah South PH-8-33A-P157 Mabelah South PH-8-F1-P157 33 33kV UGC 300 3C Cu 7.810 0.062 0.103 260.000 0.385
A'Salam (Mobella 2A) Grid H-BB01
Mabelah South PH-8-33B-P157 Mabelah South PH-8-F2-P157 33 33kV UGC 300 3C Cu 7.818 0.062 0.103 260.000 0.385
A'Salam (Mobella 2A) Grid H-BB02
Mabelah South PH-8-33C-P157 Mabelah South PH-8-F3-P157 33 33kV UGC 300 3C Cu 7.800 0.062 0.103 260.000 0.385
A'Salam (Mobella 2A) Grid H-BB01
Palm Mall-33A-P168 Palm Mall-F1-P168 33 33kV UGC 300 3C Cu 0.830 0.062 0.103 260.000 0.385
A'Salam (Mobella 2A) Grid H-BB01
Palm Mall-33B-P168 Palm Mall-F2-P168 33 33kV UGC 300 3C Cu 0.864 0.062 0.103 260.000 0.385
A'Salam (Mobella 2A) Grid H-BB02
Palm Mall-33C-P168 Palm Mall-F3-P168 33 33kV UGC 300 3C Cu 0.842 0.062 0.103 260.000 0.385
Node 1 Node 2 33kV Feeder IDNetwork
Level[kV]
Type NameLength [km]
Resistance( R )
[Ohm/km]
Reactance( X )
[Ohm/km]
Capacitance( C )
[nF/km]
Continuous Rating
[kAmps]Seeb Main A Grid H-BB01 Al Khoud PH-7-33A-P154 Al Khoud PH-7-F1-P154 33 33kV UGC 300 3C Cu 6.240 0.062 0.103 260.000 0.385Seeb Main A Grid H-BB02 Al Khoud PH-7-33B-P154 Al Khoud PH-7-F2-P154 33 33kV UGC 300 3C Cu 6.225 0.062 0.103 260.000 0.385Seeb Main A Grid H-BB02 Al Khoud PH-7-33C-P154 Al Khoud PH-7-F3-P154 33 33kV UGC 300 3C Cu 6.223 0.062 0.103 260.000 0.385Seeb Main A Grid H-BB02 Wadi Bahayis (RGO)-33A-P098 Wadi Bahayis (RGO)-F1-P098 33 33kV UGC 300 3C Cu 1.278 0.062 0.103 260.000 0.385Seeb Main A Grid H-BB01 - 33 33kV UGC 300 3C Cu 0.955 0.062 0.103 260.000 0.385
- Wadi Bahayis (RGO)-33B-P098 33 33kV UGC 300 3C Cu 0.333 0.062 0.103 260.000 0.385Seeb Main A Grid H-BB01 - 33 33kV OHL 200 Panther ACSR 3.688 0.137 0.333 10.900 0.385
- Al Khoud Shabiya-33A-P046 33 33kV UGC 300 3C Cu 2.209 0.062 0.103 260.000 0.385Seeb Main A Grid H-BB02 - 33 33kV OHL 200 Panther ACSR 3.688 0.137 0.333 10.900 0.385
- Al Khoud Shabiya-33B-P046 33 33kV UGC 300 3C Cu 2.209 0.062 0.103 260.000 0.385Seeb Main A Grid H-BB01 Wadi Al Lawami-33A-P117 Wadi Al Lawami-F1-P117 33 33kV UGC 300 3C Cu 1.054 0.062 0.103 260.000 0.385Seeb Main A Grid H-BB02 Wadi Al Lawami-33B-P117 Wadi Al Lawami-F2-P117 33 33kV UGC 300 3C Cu 1.041 0.062 0.103 260.000 0.385Seeb Main A Grid H-BB02 Wadi Al Lawami-33C-P117 Wadi Al Lawami-F3-P117 33 33kV UGC 300 3C Cu 1.041 0.062 0.103 260.000 0.385Seeb Main A Grid H-BB02 - 33 33kV UGC 300 3C Cu 5.044 0.062 0.103 260.000 0.385
- Wadi Al Aresh-33A-P115 33 33kV OHL 200 Panther ACSR 1.310 0.137 0.333 10.900 0.385Seeb Main A Grid H-BB01 - 33 33kV UGC 300 3C Cu 5.626 0.062 0.103 260.000 0.385
- Wadi Al Aresh-33B-P115 33 33kV OHL 200 Panther ACSR 0.927 0.137 0.333 10.900 0.385Seeb Main A Grid H-BB01 - 33 33kV UGC 300 3C Cu 0.002 0.062 0.103 260.000 0.385
- - 33 33kV OHL 200 Panther ACSR 2.176 0.137 0.333 10.900 0.385- New Al Khoud-33A-P047 33 33kV UGC 300 3C Cu 0.545 0.062 0.103 260.000 0.385
Wadi Al Aresh-F1-P115
Wadi Al Aresh-F2-P115
New Al Khoud-F1-P047
Wadi Bahayis (RGO)-F2-P098
Al Khoud Shabiya-F1-P046
Al Khoud Shabiya-F2-P046
Seeb[GP08] - A GSS [Zone 3]
Mabelah 2[G12] - A GSS [Zone 3]
MEDC Distribution System Capability Statement [2020-2022]-V1.0 133

Node 1 Node 2 33kV Feeder IDNetwork
Level[kV]
Type NameLength [km]
Resistance( R )
[Ohm/km]
Reactance( X )
[Ohm/km]
Capacitance( C )
[nF/km]
Continuous Rating
[kAmps]Seeb Main B Grid H-BB01 Seeb Grid-33A-GP08 Seeb Grid-F1-GP08 33 33kV UGC 300 3C Cu 0.037 0.062 0.103 260.000 0.385Seeb Main B Grid H-BB02 Seeb Grid-33B-GP08 Seeb Grid-F2-GP08 33 33kV UGC 300 3C Cu 0.034 0.062 0.103 260.000 0.385Seeb Main B Grid H-BB01 Sultan School-33A-P029 Sultan School-F1-P029 33 33kV UGC 300 3C Cu 3.042 0.062 0.103 260.000 0.385Seeb Main B Grid H-BB02 Sultan School-33B-P029 Sultan School-F2-P029 33 33kV UGC 300 3C Cu 3.058 0.062 0.103 260.000 0.385Seeb Main B Grid H-BB01 Al Hail South 2-33A-P153 Al Hail South 2-F1-P153 33 33kV UGC 300 3C Cu 5.829 0.062 0.103 260.000 0.385Seeb Main B Grid H-BB01 Al Hail South 2-33B-P153 Al Hail South 2-F2-P153 33 33kV UGC 300 3C Cu 5.807 0.062 0.103 260.000 0.385Seeb Main B Grid H-BB02 Al Hail South 2-33C-P153 Al Hail South 2-F3-P153 33 33kV UGC 300 3C Cu 5.799 0.062 0.103 260.000 0.385Seeb Main A Grid H-BB02 - 33 33kV UGC 300 3C Cu 0.002 0.062 0.103 260.000 0.385
- - 33 33kV UGC 300 3C Cu 0.603 0.062 0.103 260.000 0.385- New Al Khoud-33B-P047 33 33kV OHL 200 Panther ACSR 2.155 0.137 0.333 10.900 0.385
Node 1 Node 2 33kV Feeder IDNetwork
Level[kV]
Type NameLength [km]
Resistance( R )
[Ohm/km]
Reactance( X )
[Ohm/km]
Capacitance( C )
[nF/km]
Continuous Rating
[kAmps]Mawalleh A Grid H-BB01 Al Hail North 2-33A-P028 Al Hail North 2-F1-P028 33 33kV UGC 300 3C Cu 7.347 0.062 0.103 260.000 0.385Mawalleh A Grid H-BB02 Al Hail North 2-33B-P028 Al Hail North 2-F2-P028 33 33kV UGC 300 3C Cu 7.371 0.062 0.103 260.000 0.385Mawalleh A Grid H-BB01 Mawaleh C-33A-P072 Mawaleh C-F1-P072 33 33kV UGC 300 3C Cu 2.700 0.062 0.103 260.000 0.385Mawalleh A Grid H-BB02 Mawaleh C-33B-P072 Mawaleh C-F2-P072 33 33kV UGC 300 3C Cu 2.700 0.062 0.103 260.000 0.385Mawalleh A Grid H-BB01 Royal Flight-33A-P100 Royal Flight-F1-P100 33 33kV UGC 300 3C Cu 6.125 0.062 0.103 260.000 0.385Mawalleh A Grid H-BB02 Royal Flight-33B-P100 Royal Flight-F2-P100 33 33kV UGC 300 3C Cu 6.125 0.062 0.103 260.000 0.385
Mawalleh A Grid H-BB02 Mawaleh South Grid-33B-GP05 Mawaleh South Grid-F1-GP05 33 33kV UGC 300 3C Cu 0.030 0.062 0.103 260.000 0.385
Mawalleh A Grid H-BB01 Mawaleh South Grid-33A-GP05 Mawaleh South Grid-F2-GP05 33 33kV UGC 300 3C Cu 0.030 0.062 0.103 260.000 0.385
Mawalleh A Grid H-BB01 Al Khoud PH-3-33A-P048 Al Khoud PH-3-F1-P048 33 33kV UGC 300 3C Cu 2.960 0.062 0.103 260.000 0.385Mawalleh A Grid H-BB02 Al Khoud PH-3-33B-P048 Al Khoud PH-3-F2-P048 33 33kV UGC 300 3C Cu 2.926 0.062 0.103 260.000 0.385Mawalleh A Grid H-BB02 Mawaleh A-33B-P070 Mawaleh A-F2-P070 33 33kV UGC 300 3C Cu 0.887 0.062 0.103 260.000 0.385Mawalleh A Grid H-BB02 Mawaleh B-33B-P071 Mawaleh B-F2-P071 33 33kV UGC 300 3C Cu 1.937 0.062 0.103 260.000 0.385
Node 1 Node 2 33kV Feeder IDNetwork
Level[kV]
Type NameLength [km]
Resistance( R )
[Ohm/km]
Reactance( X )
[Ohm/km]
Capacitance( C )
[nF/km]
Continuous Rating
[kAmps]Mawaleh B Grid H-BB03 AL Hail South 1-33A-P030 AL Hail South 1-F1-P030 33 33kV UGC 300 3C Cu 4.445 0.062 0.103 260.000 0.385Mawaleh B Grid H-BB04 AL Hail South 1-33B-P030 AL Hail South 1-F2-P030 33 33kV UGC 300 3C Cu 4.445 0.062 0.103 260.000 0.385Mawaleh B Grid H-BB03 - 33 33kV OHL 200 Panther ACSR 0.587 0.137 0.333 10.900 0.385- Mawaleh A-33A-P070 33 33kV UGC 300 3C Cu 0.876 0.062 0.103 260.000 0.385Mawaleh B Grid H-BB03 Mawaleh A-33C-P070 Mawaleh A-F3-P070 33 33kV UGC 300 3C Cu 0.583 0.062 0.103 260.000 0.385Mawaleh B Grid H-BB03 Mawaleh B-33A-P071 Mawaleh B-F1-P071 33 33kV UGC 300 3C Cu 1.911 0.062 0.103 260.000 0.385Mawaleh B Grid H-BB04 Mawaleh B-33C-P071 Mawaleh B-F3-P071 33 33kV UGC 300 3C Cu 1.936 0.062 0.103 260.000 0.385Mawaleh B Grid H-BB03 Al Khoud PH-6-33A-P049 Al Khoud PH-6-F1-P049 33 33kV UGC 300 3C Cu 9.039 0.062 0.103 260.000 0.385Mawaleh B Grid H-BB04 Al Khoud PH-6-33B-P049 Al Khoud PH-6-F2-P049 33 33kV UGC 300 3C Cu 9.044 0.062 0.103 260.000 0.385Mawaleh B Grid H-BB03 Mawaleh South 5-33A-P148 Mawaleh South 5-F1-P148 33 33kV UGC 300 3C Cu 2.507 0.062 0.103 260.000 0.385Mawaleh B Grid H-BB04 Mawaleh South 5-33B-P148 Mawaleh South 5-F2-P148 33 33kV UGC 300 3C Cu 2.500 0.062 0.103 260.000 0.385Mawaleh B Grid H-BB04 Mawaleh South 5-33C-P148 Mawaleh South 5-F3-P148 33 33kV UGC 300 3C Cu 2.493 0.062 0.103 260.000 0.385
Node 1 Node 2 33kV Feeder IDNetwork
Level[kV]
Type NameLength [km]
Resistance( R )
[Ohm/km]
Reactance( X )
[Ohm/km]
Capacitance( C )
[nF/km]
Continuous Rating
[kAmps]MawalehNorth Grid-33-HBB A Al Hail North 1-33A-P027 Al Hail North 1-F1-P027 33 33kV UGC 300 3C Cu 1.961 0.062 0.103 260.000 0.385MawalehNorth Grid-33-HBB B Al Hail North 1-33B-P027 Al Hail North 1-F2-P027 33 33kV UGC 300 3C Cu 1.961 0.062 0.103 260.000 0.385MawalehNorth Grid-33-HBB A City Centre-33A-P073 City Centre-F1-P073 33 33kV UGC 300 3C Cu 2.500 0.062 0.103 260.000 0.385MawalehNorth Grid-33-HBB B City Centre-33B-P073 City Centre-F2-P073 33 33kV UGC 300 3C Cu 2.500 0.062 0.103 260.000 0.385MawalehNorth Grid-33-HBB A Mawaleh North-33A-P069 Mawaleh North-F1-P069 33 33kV UGC 300 3C Cu 1.000 0.062 0.103 260.000 0.385MawalehNorth Grid-33-HBB B Mawaleh North-33B-P069 Mawaleh North-F2-P069 33 33kV UGC 300 3C Cu 1.000 0.062 0.103 260.000 0.385
MawalehNorth Grid-33-HBB A Mawaleh North Grid-33A-GP01 Mawaleh North Grid-F1-GP01 33 33kV UGC 300 3C Cu 0.050 0.062 0.103 260.000 0.385
MawalehNorth Grid-33-HBB A Mawaleh North Grid-33B-GP01 Mawaleh North Grid-F2-GP01 33 33kV UGC 300 3C Cu 0.050 0.062 0.103 260.000 0.385
MawalehNorth Grid-33-HBB B Mawaleh North Grid-33C-GP01 Mawaleh North Grid-F3-GP01 33 33kV UGC 300 3C Cu 0.050 0.062 0.103 260.000 0.385
Mawaleh A-F1-P070
New Al Khoud-F2-P047
Mawaleh South[GP05] - B GSS [Zone 3]
Seeb[GP08] - B GSS [Zone 3]
Mawaleh North [GP01] GSS [Zone 3]
Mawaleh South[GP05] - A GSS [Zone 3]
MEDC Distribution System Capability Statement [2020-2022]-V1.0 134

MEDC Distribution System Capability Statement (2020-2022) – V1.0 135
Appendix E2 – Primary Substation Transformer Data
Appendix E2 presents the data used to model the primary substation power transformers for the load
flow and fault current calculation studies. The data comprises of the transformer nameplate data and
includes ONAF power rating, voltage ratio, percentage impedance (based on transformer rating) and
the tap range and step size.
Explanatory Notes:
a) The method of earthing at all the 33/11.5kV primary substations power transformers is ‘solidly
earthed’ except the following where resistance earthing is applied:
− Rusail Housing-P056 PSS
b) MEDC is currently in process of developing the typical values for zero sequence resistance and
zero sequence reactance for future improvements.

Primary Substation Transformer IDPrimary Voltage
[kV]
Secondary Voltage
[kV]
Rated Apparent Power(ONAF)[MVA]
Impedance Voltage
[%]Vector Group
Minimum Tap Position
Nominal Tap Position
Maximum Tap Position
Additional Voltage per Tap
[%]
Darsait-Tx1-P018 33 11.5 20 12.5 DYN11 1 12 15 1.67
Darsait-Tx2-P018 33 11.5 20 12.3 DYN11 1 12 15 1.67
Falaj-Tx1-P178 33 11.5 16 10.3 DYN11 3 12 15 1.67
Falaj-Tx2-P178 33 11.5 16 10.4 DYN11 1 12 15 1.67
Jibrooh-Tx1-P041 33 11.5 20 12.4 DYN11 1 12 15 1.67
Jibrooh-Tx2-P041 33 11.5 20 12.4 DYN11 1 12 15 1.67
Jibrooh-Tx3-P041 33 11.5 20 12.3 DYN11 1 12 15 1.67
Mutrah Store-Tx1-P085 33 11.5 20 12.4 DYN11 1 10 13 1.67
Mutrah Store-Tx2-P085 33 11.5 20 12.5 DYN11 1 10 13 1.67
Seaport-Tx1-P086 33 11.5 6 6.4 DYN11 1 5 7 2.50
Seaport-Tx2-P086 33 11.5 6 6.4 DYN11 1 5 7 2.50
Primary Substation Transformer IDPrimary Voltage
[kV]
Secondary Voltage
[kV]
Rated Apparent Power(ONAF)[MVA]
Impedance Voltage
[%]Vector Group
Minimum Tap Position
Nominal Tap Position
Maximum Tap Position
Additional Voltage per Tap
[%]
Bait Al Falaj-Tx1-P142 33 11.5 20 12.2 DYN11 3 12 15 1.67
Bait Al Falaj-Tx2-P142 33 11.5 20 12.2 DYN11 3 12 15 1.67
Bait Al Falaj-Tx3-P142 33 11.5 20 12.2 DYN11 3 12 15 1.67
C.B.D-Tx1-P173 33 11.5 16 9.4 DYN11 1 10 13 1.67
C.B.D-Tx2-P173 33 11.5 16 9.4 DYN11 1 10 13 1.67
C.B.D-Tx3-P173 33 11.5 16 9.4 DYN11 1 10 13 1.67
M.O.D-Tx-P143-OD 33 11.5 6 6.2 DYN11 1 5 7 2.50
Riyam-Tx1-P099 33 11.5 20 12.4 DYN11 3 12 15 1.67
Riyam-Tx2-P099 33 11.5 20 12.5 DYN11 3 12 15 1.67
Ruwi Office-Tx1-P108 33 11.5 20 12.5 DYN11 3 12 15 1.67
Ruwi Office-Tx2-P108 33 11.5 20 12.6 DYN11 3 12 15 1.67
Primary Substation Transformer IDPrimary Voltage
[kV]
Secondary Voltage
[kV]
Rated Apparent Power(ONAF)[MVA]
Impedance Voltage
[%]Vector Group
Minimum Tap Position
Nominal Tap Position
Maximum Tap Position
Additional Voltage per Tap
[%]
Ali Shihani-Tx1-P125 33 11.5 20 12.5 DYN11 3 12 15 1.67
Ali Shihani-Tx2-P125 33 11.5 20 12.5 DYN11 3 12 15 1.67
M.B.D. South-Tx1-P075 33 11.5 20 12.1 DYN11 3 12 15 1.67
M.B.D. South-Tx2-P075 33 11.5 20 12.1 DYN11 3 12 15 1.67
Majlis Oman-Tx1-P066 33 11.5 20 12.5 DYN11 3 12 15 1.67
Majlis Oman-Tx2-P066 33 11.5 20 12.4 DYN11 3 12 15 1.67
Qasr al Alam-Tx1-P090 33 11.5 20 12.2 DYN11 3 12 15 1.67
Qasr al Alam-Tx2-P090 33 11.5 20 12.3 DYN11 3 12 15 1.67
Sidab-Tx1-P119 33 11.5 6 6 DYN11 1 5 7 2.50
Sidab-Tx2-P119 33 11.5 6 6.3 DYN11 1 5 7 2.50
Wadi Al Kabir Housing-Tx1-P127-OD 33 11.5 6 6.2 DYN11 1 3 4 2.50
Wadi Al Kabir Workshop-Tx1-P126-OD 33 11.5 6 6.1 DYN11 1 5 7 2.50
Wadi Al Kabir Workshop-Tx2-P126-OD 33 11.5 6 6.5 DYN11 1 5 7 2.50
Walja-Tx1-P130 33 11.5 20 12.5 DYN11 3 12 15 1.67
Walja-Tx2-P130 33 11.5 20 12.6 DYN11 3 12 15 1.67
Primary Substation Transformer IDPrimary Voltage
[kV]
Secondary Voltage
[kV]
Rated Apparent Power(ONAF)[MVA]
Impedance Voltage
[%]Vector Group
Minimum Tap Position
Nominal Tap Position
Maximum Tap Position
Additional Voltage per Tap
[%]
Old Airport-Tx1-P107 33 11.5 20 12.1 DYN11 3 12 15 1.67
Old Airport-Tx2-P107 33 11.5 20 11.8 DYN11 3 12 15 1.67
Ruwi Market-Tx1-P076 33 11.5 20 12.2 DYN11 1 10 13 1.67
Ruwi Market-Tx2-P076 33 11.5 20 12.1 DYN11 1 10 13 1.67
Ruwi Valley-Tx1-P174 33 11.5 20 11.9 DYN11 3 12 15 1.67
Ruwi Valley-Tx2-P174 33 11.5 20 11.8 DYN11 3 12 15 1.67
Wadi Al Kabir Height 1-Tx1-P128 33 11.5 20 12.4 DYN11 3 12 15 1.67
Wadi Al Kabir Height 1-Tx2-P128 33 11.5 20 12.4 DYN11 3 12 15 1.67
Falaj[G23] GSS [Zone 1]
Mutrah[G21] GSS [Zone 1]
Wadi Al Kabir[G19] - A GSS [Zone 1]
Wadi Al Kabir[G19] - B GSS [Zone 1]
MEDC Distribution System Capability Statement [2020-2022]-V1.0 136

Primary Substation Transformer IDPrimary Voltage
[kV]
Secondary Voltage
[kV]
Rated Apparent Power(ONAF)[MVA]
Impedance Voltage
[%]Vector Group
Minimum Tap Position
Nominal Tap Position
Maximum Tap Position
Additional Voltage per Tap
[%]
Al Bustan Palace-Tx1-P017 33 11.5 16 10.2 DYN11 3 12 15 1.67
Al Bustan Palace-Tx2-P017 33 11.5 16 10.2 DYN11 3 12 15 1.67
Al Hamryah-Tx1-P035 33 11.5 20 12.4 DYN11 3 12 15 1.67
Al Hamryah-Tx2-P035 33 11.5 20 12.4 DYN11 3 12 15 1.67
Al Mahaj-Tx1-P136-OD 33 11.5 6 6.3 DYN11 1 5 7 2.50
Al Mahaj-Tx2-P136-OD 33 11.5 6 6.2 DYN11 1 5 7 2.50
Amerat 1-Tx1-P005 33 11.5 16 10.3 DYN11 3 12 15 1.67
Amerat 1-Tx2-P005 33 11.5 16 10.4 DYN11 3 12 15 1.67
Khoula Hospital-Tx1-P132 33 11.5 20 12.4 DYN11 3 12 15 1.67
Khoula Hospital-Tx2-P132 33 11.5 20 12.5 DYN11 3 12 15 1.67
Khoula Hospital-Tx3-P132 33 11.5 20 12.5 DYN11 3 12 15 1.67
Qantab-Tx-P089-OD 33 11.5 6 6.2 DYN11 1 5 7 2.50
Wadi Adai-Tx1-P175 33 11.5 20 12.6 DYN11 3 12 15 1.67
Wadi Adai-TX2-P175 33 11.5 20 12.6 DYN11 3 12 15 1.67
Wattaya-Tx1-P131 33 11.5 20 12.5 DYN11 3 12 15 1.67
Wattaya-Tx2-P131 33 11.5 20 12.6 DYN11 3 12 15 1.67
Primary Substation Transformer IDPrimary Voltage
[kV]
Secondary Voltage
[kV]
Rated Apparent Power(ONAF)[MVA]
Impedance Voltage
[%]Vector Group
Minimum Tap Position
Nominal Tap Position
Maximum Tap Position
Additional Voltage per Tap
[%]
Al Atkiya-Tx-P182-OD 33 11.5 6 6.2 DYN11 1 5 7 2.50
Al Hajir-Tx1-P031 33 11.5 20 12.2 DYN11 3 12 15 1.67
Al Hajir-Tx2-P031 33 11.5 20 12.1 DYN11 3 12 15 1.67
Al Masarat-Tx1-P068 33 11.5 10 7.6 DYN11 2 11 14 1.67
Al Masarat-Tx2-P068 33 11.5 10 7.8 DYN11 2 11 14 1.67
Arqi-Tx-P121-OD 33 11.5 3 5.5 DYN11 1 3 5 2.50
Bar Al Jissah 1-Tx1-P044 33 11.5 20 12.4 DYN11 3 12 15 1.67
Bar Al Jissah 1-Tx2-P044 33 11.5 20 12.5 DYN11 3 12 15 1.67
Debha-Tx-P114-OD 33 11 6 5.3 DYN11 1 5 7 2.50
Hussan Yitti-Tx1-P169-OD 33 11.5 6 6.4 DYN11 1 5 7 2.50
Hussan Yitti-Tx2-P169-OD 33 11.5 6 6.4 DYN11 1 5 7 2.50
Jahloot 1-Tx1-P040-OD 33 11.5 6 6 DYN11 1 6 8 2.50
Jahloot 1-Tx2-P040-OD 33 11.5 6 6.2 DYN11 1 5 7 2.50
ROP Al Saleel-Tx1-P162-OD 33 11.5 6 6 DYN11 1 5 7 2.50
ROP Al Saleel-Tx2-P162-OD 33 11.5 6 6 DYN11 1 5 7 2.50
Sawaqim 1-Tx1-P112-OD 33 11 6 6.6 DYN11 1 3 5 2.50
Sawaqim 1-Tx2-P112-OD 33 11.5 6 6.4 DYN11 1 3 5 2.50
Sawaqim 2-Tx-P113-OD 33 11.5 6 6 DYN11 1 5 7 2.50
Siya-Tx1-P120-OD 33 11.5 6 6.1 DYN11 1 3 5 2.50
Siya-Tx2-P120-OD 33 11.5 6 6.1 DYN11 1 3 5 2.50
Tunis-Tx-P137-OD 33 11.5 6 6.2 DYN11 1 5 7 2.50
Wadi Al Mayh-Tx-P129-OD 33 11.5 3 5.5 DYN11 1 3 5 2.50
Water Pumping-Tx1-P193-OD 33 6.9 6 7.6 DYN11 1 5 7 2.50
Water Pumping-Tx2-P193-OD 33 6.9 6 7.6 DYN11 1 5 7 2.50
Primary Substation Transformer IDPrimary Voltage
[kV]
Secondary Voltage
[kV]
Rated Apparent Power(ONAF)[MVA]
Impedance Voltage
[%]Vector Group
Minimum Tap Position
Nominal Tap Position
Maximum Tap Position
Additional Voltage per Tap
[%]
Al Khairan-Tx1-P045 33 11.5 6 6.1 DYN11 1 5 7 2.50
Al Khairan-Tx2-P045 33 11.5 3 5.5 DYN11 1 5 7 2.50
Al Salam Yiti-Tx-P135 33 11.5 6 6 DYN11 1 5 7 2.50
Jabal Al Sifah-Tx1-P159 33 11.5 20 11.6 DYN11 3 12 15 1.67
Jabal Al Sifah-Tx2-P159 33 11.5 20 11.6 DYN11 3 12 15 1.67
Jabal Al Sifah-Tx3-P159 33 11.5 20 11.7 DYN11 3 12 15 1.67
Saraya Bander-Tx1-P145 33 11.5 20 12.2 DYN11 3 12 15 1.67
Saraya Bander-Tx2-P145 33 11.5 20 12.1 DYN11 3 12 15 1.67
Saraya Bander-Tx3-P145 33 11.5 20 12.1 DYN11 3 12 15 1.67
Yenkit 1-Tx2-P133 33 11.5 3 5.5 DYN11 1 5 7 2.50
Yenkit 1-Tx1-P133 33 11.5 1 4.5 DYN11 1 5 7 2.50
Yiti 1-Tx1-P134 33 11.5 3 6.1 DYN11 1 5 7 2.50
Yiti 1-Tx2-P134 33 11.5 3 6.1 DYN11 1 5 7 2.50
Wadi Adai[G22] GSS [Zone 1]
Jahloot[G03] GSS [Zone 1]
Yiti[G08] GSS [Zone 1]
MEDC Distribution System Capability Statement [2020-2022]-V1.0 137

Primary Substation Transformer IDPrimary Voltage
[kV]
Secondary Voltage
[kV]
Rated Apparent Power(ONAF)[MVA]
Impedance Voltage
[%]Vector Group
Minimum Tap Position
Nominal Tap Position
Maximum Tap Position
Additional Voltage per Tap
[%]
Al Mazara-Tx1-P074-OD 33 11.5 6 6.1 DYN11 1 5 7 2.50
Al Mazara-Tx2-P074-OD 33 11.5 6 5.8 DYN11 1 5 7 2.50
Al Shahbari-Tx1-P092 33 11.5 20 12.3 DYN11 3 12 15 1.67
Al Shahbari-Tx2-P092 33 11.5 20 12.7 DYN11 3 12 15 1.67
Dhabab-Tx1-P019 33 11.5 6 6.1 DYN11 1 5 7 2.50
Dhabab-Tx2-P019 33 11.5 6 6.1 DYN11 1 5 7 2.50
Dhagmar 1-Tx1-P021 33 11.5 6 6.3 DYN11 1 5 7 2.50
Dhagmar 1-Tx2-P021 33 11.5 6 6 DYN11 1 5 7 2.50
Dhagmar 1-Tx3-P021 33 11.5 6 6.4 DYN11 1 5 7 2.50
Dhagmar 1-Tx4-P021 33 11.5 6 6 DYN11 1 5 7 2.50
Hail Al Ghaf-Tx1-P036-OD 33 11.5 6 6.2 DYN11 1 5 7 2.50
Hail Al Ghaf-Tx2-P036-OD 33 11.5 6 6.5 DYN11 1 5 7 2.50
Quriyat-Tx1-P091 33 11.5 20 12.3 DYN11 3 12 15 1.67
Quriyat-Tx2-P091 33 11.5 20 12.3 DYN11 3 12 15 1.67
Royal Camp-Tx-P170-OD 33 11.5 3 5.8 DYN11 1 5 7 2.50
Street Light-Tx-P020 33 11.5 6 6 DYN11 1 5 7 2.50
Wadi Al Arbyeen-Tx-P124 33 11.5 6 6.4 DYN11 1 5 7 2.50
Primary Substation Transformer IDPrimary Voltage
[kV]
Secondary Voltage
[kV]
Rated Apparent Power(ONAF)[MVA]
Impedance Voltage
[%]Vector Group
Minimum Tap Position
Nominal Tap Position
Maximum Tap Position
Additional Voltage per Tap
[%]
Al Nahdah-Tx1-P006 33 11.5 20 10.7 DYN11 3 12 15 1.67
Al Nahdah-Tx2-P006 33 11.5 20 10.8 DYN11 3 12 15 1.67
Amerat 2-Tx-P177-OD 33 11.5 6 6.5 DYN11 1 5 7 2.50
Amerat 3-Tx1-P179 33 11.5 20 12.2 DYN11 3 12 15 1.67
Amerat 3-Tx2-P179 33 11.5 20 12.1 DYN11 3 12 15 1.67
Amerat 3-Tx3-P179 33 11.5 20 12.2 DYN11 3 12 15 1.67
Amerat Heights-Tx1-P152 33 11.5 20 12.1 DYN11 3 12 15 1.67
Amerat Heights-Tx2-P152 33 11.5 20 12.1 DYN11 3 12 15 1.67
Post Office-Tx1-P150 33 11.5 20 12.3 DYN11 3 12 15 1.67
Post Office-Tx2-P150 33 11.5 20 12.3 DYN11 3 12 15 1.67
Primary Substation Transformer IDPrimary Voltage
[kV]
Secondary Voltage
[kV]
Rated Apparent Power(ONAF)[MVA]
Impedance Voltage
[%]Vector Group
Minimum Tap Position
Nominal Tap Position
Maximum Tap Position
Additional Voltage per Tap
[%]
Seih Dhabi-Tx1-P118 33 11.5 16 10.5 DYN11 3 12 15 1.67
Seih Dhabi-Tx2-P118 33 11.5 16 10.5 DYN11 3 12 15 1.67
Al Jufaina-Tx-P194 33 11.5 6 6.2 DYN11 1 5 7 2.50
Madinat Al Nahdah-Tx1-P065 33 11.5 20 12.8 DYN11 3 12 15 1.67
Madinat Al Nahdah-Tx2-P065 33 11.5 20 12.6 DYN11 3 12 15 1.67
Primary Substation Transformer IDPrimary Voltage
[kV]
Secondary Voltage
[kV]
Rated Apparent Power(ONAF)[MVA]
Impedance Voltage
[%]Vector Group
Minimum Tap Position
Nominal Tap Position
Maximum Tap Position
Additional Voltage per Tap
[%]
Azaiba North 2-Tx1-P012 33 11.5 20 12.2 DYN11 3 12 15 1.67
Azaiba North 2-Tx2-P012 33 11.5 20 12.6 DYN11 3 12 15 1.67
Azaiba South 1A-Tx1-P014 33 11.5 20 12.3 DYN11 3 12 15 1.67
Azaiba South 1A-Tx2-P014 33 11.5 20 12.3 DYN11 3 12 15 1.67
Diplomatic City 1-Tx1-P022 33 11.5 20 12.8 DYN11 3 12 15 1.67
Diplomatic City 1-Tx2-P022 33 11.5 20 12.6 DYN11 3 12 15 1.67
Diplomatic City 1-Tx3-P022 33 11.5 20 12 DYN11 3 12 15 1.67
Ghubra North 1-Tx1-P023 33 11.5 20 12.3 DYN11 3 12 15 1.67
Ghubra North 1-Tx2-P023 33 11.5 20 12.3 DYN11 3 12 15 1.67
Ghubra North 1-Tx3-P023 33 11.5 20 12.3 DYN11 3 12 15 1.67
Ghubrah GPS-Tx1-P166-Pvt 33 11.5 16 11.9 DYN11 3 12 15 1.67
Ghubrah GPS-Tx2-P166-Pvt 33 11.5 16 12.1 DYN11 3 12 15 1.67
Ghubrah North 02-Tx1-P149 33 11.5 20 11.7 DYN11 3 12 15 1.67
Ghubrah North 02-Tx2-P149 33 11.5 20 11.7 DYN11 3 12 15 1.67
Ghubrah North 02-Tx3-P149 33 11.5 20 11.7 DYN11 3 12 15 1.67
Quriyat[G05] GSS [Zone 1]
Amerat[G10] - A GSS [Zone 1]
Ghubrah 2[G09] GSS [Zone 2]
Amerat[G10] - B GSS [Zone 1]
MEDC Distribution System Capability Statement [2020-2022]-V1.0 138

Primary Substation Transformer IDPrimary Voltage
[kV]
Secondary Voltage
[kV]
Rated Apparent Power(ONAF)[MVA]
Impedance Voltage
[%]Vector Group
Minimum Tap Position
Nominal Tap Position
Maximum Tap Position
Additional Voltage per Tap
[%]
Al Khuwair North-Tx1-P054 33 11.5 20 11.1 DYN11 3 12 15 1.67
Al Khuwair North-Tx2-P054 33 11.5 20 11 DYN11 3 12 15 1.67
Al Khuwair North-Tx3-P054 33 11.5 20 11.1 DYN11 3 12 15 1.67
Information City 2-Tx-P038 33 11.5 5 7.2 DYN11 1 3 5 2.50
Intercontinental-Tx1-P109 33 11.5 20 10 DYN11 3 12 15 1.67
Intercontinental-Tx2-P109 33 11.5 20 10.1 DYN11 3 12 15 1.67
MSQ Grid-Tx1-GP06 33 11.5 20 12.3 DYN11 3 12 15 1.67
MSQ Grid-Tx2-GP06 33 11.5 20 12.2 DYN11 3 12 15 1.67
Royal Office-Tx1-P097 33 11.5 20 12.4 DYN11 3 12 15 1.67
Royal Office-Tx2-P097 33 11.5 20 12.7 DYN11 3 12 15 1.67
Sarooj -Shati Al Qurum-Tx1-P110 33 11.5 20 10.1 DYN11 3 12 15 1.67
Sarooj -Shati Al Qurum-Tx2-P110 33 11.5 20 10.1 DYN11 3 12 15 1.67
Primary Substation Transformer IDPrimary Voltage
[kV]
Secondary Voltage
[kV]
Rated Apparent Power(ONAF)[MVA]
Impedance Voltage
[%]Vector Group
Minimum Tap Position
Nominal Tap Position
Maximum Tap Position
Additional Voltage per Tap
[%]
Al Khuwair 25-Tx1-P053 33 11.5 20 12 DYN11 3 12 15 1.67
Al Khuwair 25-Tx2-P053 33 11.5 20 12.1 DYN11 3 12 15 1.67
Al Khuwair School-Tx1-P146 33 11.5 20 12.3 DYN11 3 12 15 1.67
Al Khuwair School-Tx2-P146 33 11.5 20 12.3 DYN11 3 12 15 1.67
Al Khuwair School-Tx3-P146 33 11.5 20 12.3 DYN11 3 12 15 1.67
Digital TV Studio-Tx1-P039 33 11.5 20 12.5 DYN11 3 12 15 1.67
Digital TV Studio-Tx2-P039 33 11.5 20 12.5 DYN11 3 12 15 1.67
MSQ 1-Tx1-P083 33 11.5 20 12.7 DYN11 3 12 15 1.67
MSQ 1-Tx2-P083 33 11.5 20 12.9 DYN11 3 12 15 1.67
ROP -Shati Al Qurum-Tx1-P111 33 11.5 20 10.1 DYN11 3 12 15 1.67
ROP -Shati Al Qurum-Tx2-P111 33 11.5 20 10.2 DYN11 3 12 15 1.67
Primary Substation Transformer IDPrimary Voltage
[kV]
Secondary Voltage
[kV]
Rated Apparent Power(ONAF)[MVA]
Impedance Voltage
[%]Vector Group
Minimum Tap Position
Nominal Tap Position
Maximum Tap Position
Additional Voltage per Tap
[%]
Information City 1-Tx1-P037 33 11.5 20 11.8 DYN11 3 12 15 1.67
Information City 1-Tx2-P037 33 11.5 20 12.2 DYN11 3 12 15 1.67
Lulai-Tx1-P095 33 11.5 20 12.6 DYN11 1 10 13 1.67
Lulai-Tx2-P095 33 11.5 20 12.7 DYN11 1 10 13 1.67
MSQ 02-Tx1-P155 33 11.5 20 12 DYN11 3 12 15 1.67
MSQ 02-Tx2-P155 33 11.5 20 12 DYN11 3 12 15 1.67
MSQ 02-Tx3-P155 33 11.5 20 12 DYN11 3 12 15 1.67
Qurum 1-Tx1-P093 33 11.5 16 10.2 DYN11 1 10 13 1.67
Qurum 1-Tx2-P093 33 11.5 16 10.1 DYN11 1 10 13 1.67
Qurum 2-Tx1-P094 33 11.5 20 12.5 DYN11 3 12 15 1.67
Qurum 2-Tx2-P094 33 11.5 20 12.5 DYN11 3 12 15 1.67
Rabiat Al Qurum-Tx1-P096 33 11.5 20 12.5 DYN11 3 12 15 1.67
Rabiat Al Qurum-Tx2-P096 33 11.5 20 12.6 DYN11 3 12 15 1.67
Primary Substation Transformer IDPrimary Voltage
[kV]
Secondary Voltage
[kV]
Rated Apparent Power(ONAF)[MVA]
Impedance Voltage
[%]Vector Group
Minimum Tap Position
Nominal Tap Position
Maximum Tap Position
Additional Voltage per Tap
[%]
Al Khuwair 17/1-Tx1-P050 33 11.5 20 12 DYN11 3 12 15 1.67
Al Khuwair 17/1-Tx2-P050 33 11.5 20 11.9 DYN11 3 12 15 1.67
Al Khuwair South-Tx1-P052 33 11.5 20 10.1 DYN11 3 12 15 1.67
Al Khuwair South-Tx2-P052 33 11.5 20 10.1 DYN11 3 12 15 1.67
Al Khuwair South-Tx3-P052 33 11.5 20 10 DYN11 3 12 15 1.67
Azaiba South 1B-Tx3-P147 33 11.5 20 12.3 DYN11 3 12 15 1.67
Azaiba South 1B-Tx4-P147 33 11.5 20 12.2 DYN11 3 12 15 1.67
Azaiba South 1B-Tx5-P147 33 11.5 20 12.2 DYN11 3 12 15 1.67
Bousher Grid-Tx5-GP02 33 11.5 20 11.8 DYN11 3 12 15 1.67
Bousher Grid-Tx6-GP02 33 11.5 20 11.9 DYN11 3 12 15 1.67
Royal Hospital-Tx1-P024 33 11.5 20 12.4 DYN11 3 12 15 1.67
Royal Hospital-Tx2-P024 33 11.5 20 12.3 DYN11 3 12 15 1.67
Royal Hospital-Tx3-P024 33 11.5 20 12.2 DYN11 3 12 15 1.67
Qurum[G06] GSS [Zone 2]
Bousher[GP02] - A GSS [Zone 2]
MSQ[GP06] - A GSS [Zone 2]
MSQ[GP06] - B GSS [Zone 2]
MEDC Distribution System Capability Statement [2020-2022]-V1.0 139

Primary Substation Transformer IDPrimary Voltage
[kV]
Secondary Voltage
[kV]
Rated Apparent Power(ONAF)[MVA]
Impedance Voltage
[%]Vector Group
Minimum Tap Position
Nominal Tap Position
Maximum Tap Position
Additional Voltage per Tap
[%]
Al Ansab 1-Tx1-P007 33 11.5 20 12 DYN11 3 12 15 1.67
Al Ansab 1-Tx2-P007 33 11.5 20 11.9 DYN11 3 12 15 1.67
Azaiba North 1-Tx1-P011 33 11.5 20 11.9 DYN11 3 12 15 1.67
Azaiba North 1-Tx2-P011 33 11.5 20 11.9 DYN11 3 12 15 1.67
Bousher 02-Tx1-P163 33 11.5 20 11.9 DYN11 3 12 15 1.67
Bousher 02-Tx2-P163 33 11.5 20 11.9 DYN11 3 12 15 1.67
Bousher 02-Tx3-P163 33 11.5 20 11.9 DYN11 3 12 15 1.67
Ghubrah South 1-Tx1-P026 33 11.5 20 10 DYN11 3 12 15 1.67
Ghubrah South 1-Tx2-P026 33 11.5 20 10.1 DYN11 3 12 15 1.67
Ghubrah South 1-Tx3-P026 33 11.5 20 10.1 DYN11 3 12 15 1.67
Holiday Inn-Tx1-P051 33 11.5 20 12.2 DYN11 3 12 15 1.67
Holiday Inn-Tx2-P051 33 11.5 20 12.4 DYN11 3 12 15 1.67
Holiday Inn-Tx3-P051 33 11.5 20 12.4 DYN11 3 12 15 1.67
Al Muna-Tx1-P084 33 11.5 20 12.2 DYN11 3 12 15 1.67
Al Muna-Tx2-P084 33 11.5 20 12.5 DYN11 3 12 15 1.67
Tilal Al Khuwair-Tx1-P055 33 11.5 20 11.8 DYN11 3 12 15 1.67
Tilal Al Khuwair-Tx2-P055 33 11.5 20 12.2 DYN11 3 12 15 1.67
Tilal Al Khuwair-Tx3-P055 33 11.5 20 12.3 DYN11 3 12 15 1.67
Primary Substation Transformer IDPrimary Voltage
[kV]
Secondary Voltage
[kV]
Rated Apparent Power(ONAF)[MVA]
Impedance Voltage
[%]Vector Group
Minimum Tap Position
Nominal Tap Position
Maximum Tap Position
Additional Voltage per Tap
[%]
Mall of Oman-Tx1-P171 33 11.5 20 12 DYN11 3 12 15 1.67
Mall of Oman-Tx2-P171 33 11.5 20 12 DYN11 3 12 15 1.67
Mall of Oman-Tx3-P171 33 11.5 20 12.1 DYN11 3 12 15 1.67
Primary Substation Transformer IDPrimary Voltage
[kV]
Secondary Voltage
[kV]
Rated Apparent Power(ONAF)[MVA]
Impedance Voltage
[%]Vector Group
Minimum Tap Position
Nominal Tap Position
Maximum Tap Position
Additional Voltage per Tap
[%]
Al Ansab 2-Tx1-P008 33 11.5 20 12.5 DYN11 3 12 15 1.67Al Ansab 2-Tx2-P008 33 11.5 20 12.4 DYN11 3 12 15 1.67
Al Ansab STP-Tx1-P009 33 11.5 20 12 DYN11 3 12 15 1.67
Al Ansab STP-Tx2-P009 33 11.5 20 12 DYN11 3 12 15 1.67
Ghala 1-Tx1-P015 33 11.5 20 12.5 DYN11 3 12 15 1.67
Ghala 1-Tx2-P015 33 11.5 20 12.5 DYN11 3 12 15 1.67
Ghala 2-Tx1-P156 33 11.5 20 12 DYN11 3 12 15 1.67
Ghala 2-Tx2-P156 33 11.5 20 12 DYN11 3 12 15 1.67
Ghala 2-Tx3-P156 33 11.5 20 12 DYN11 3 12 15 1.67
MOD Al Ansab-Tx1-P167 33 11.5 10 7.6 DYN11 3 12 15 1.67
MOD Al Ansab-Tx2-P167 33 11.5 10 7.5 DYN11 3 12 15 1.67
Oman Exhibition-Tx1-P165 33 11.5 20 12.1 DYN11 3 12 15 1.67
Oman Exhibition-Tx2-P165 33 11.5 20 12.1 DYN11 3 12 15 1.67
Oman Exhibition-Tx3-P165 33 11.5 20 12 DYN11 3 12 15 1.67
Primary Substation Transformer IDPrimary Voltage
[kV]
Secondary Voltage
[kV]
Rated Apparent Power(ONAF)[MVA]
Impedance Voltage
[%]Vector Group
Minimum Tap Position
Nominal Tap Position
Maximum Tap Position
Additional Voltage per Tap
[%]
Airport Height 1-Tx1-P001 33 11.5 20 12.3 DYN11 3 12 15 1.67
Airport Height 1-Tx2-P001 33 11.5 20 12.3 DYN11 3 12 15 1.67
Airport Height 2-Tx1-P002 33 11.5 20 12.6 DYN11 3 12 15 1.67
Airport Height 2-Tx2-P002 33 11.5 20 12.8 DYN11 3 12 15 1.67
Airport Height 3-Tx1-P003 33 11.5 20 11.7 DYN11 3 12 15 1.67
Airport Height 3-Tx2-P003 33 11.5 20 12 DYN11 3 12 15 1.67
Airport Height 4-Tx1-P004 33 11.5 20 12.1 DYN11 3 12 16 1.67
Airport Height 4-Tx2-P004 33 11.5 20 12.5 DYN11 3 12 16 1.67
Airport Height 5-Tx1-P151 33 11.5 20 12.8 DYN11 3 12 15 1.67
Airport Height 5-Tx2-P151 33 11.5 20 12.8 DYN11 3 12 15 1.67
Azaiba North 3-Tx1-P013 33 11.5 20 12.4 DYN11 3 12 15 1.67
Azaiba North 3-Tx2-P013 33 11.5 20 12 DYN11 3 12 15 1.67
Azaiba North 3-Tx3-P013 33 11.5 20 12 DYN11 3 12 15 1.67
MOD Technical College-Tx1-P081 33 11.5 20 12.4 DYN11 3 12 15 1.67
MOD Technical College-Tx2-P081 33 11.5 20 12.3 DYN11 3 12 15 1.67
ROP Hospital-Tx-P172 33 11.5 6 6.2 DYN11 2 4 9 2.50
Ghala[G11] - A GSS [Zone 2]
Airport Heights [G01] - A GSS [Zone 3]
Ghala Heights[G24] GSS [Zone 2]
Bousher[GP02] - B GSS [Zone 2]
MEDC Distribution System Capability Statement [2020-2022]-V1.0 140

Primary Substation Transformer IDPrimary Voltage
[kV]
Secondary Voltage
[kV]
Rated Apparent Power(ONAF)[MVA]
Impedance Voltage
[%]Vector Group
Minimum Tap Position
Nominal Tap Position
Maximum Tap Position
Additional Voltage per Tap
[%]
Al Jifnain 1-Tx-P042-OD 33 11.5 6 6.2 DYN11 1 4 7 2.50
Cement Housing-Tx1-P088-Pvt 33 11 5 7.4 DYN11 1 4 7 2.50
Cement Housing-Tx2-P088-Pvt 33 11 5 7.4 DYN11 1 4 7 2.50
Rusail Industrial 1-Tx1-P103 33 11 16 9.6 DYN11 3 15 19 1.24
Rusail Industrial 1-Tx2-P103 33 11 16 9.9 DYN11 3 15 19 1.24
Rusail Industrial 2-Tx1-P104 33 11.5 20 12.4 DYN11 3 12 15 1.67
Rusail Industrial 2-Tx2-P104 33 11.5 20 12.4 DYN11 3 12 15 1.67
SQU 1-Tx1-P122-Pvt 33 11.5 16 10.5 DYN11 3 12 15 1.67
SQU 1-Tx2-P122-Pvt 33 11.5 16 10.5 DYN11 3 12 15 1.67
SQU 1-Tx3-P122-Pvt 33 11.5 16 10.5 DYN11 3 12 15 1.67
SQU 2-Tx1-P123-Pvt 33 11.5 16 10.5 DYN11 3 12 15 1.67
SQU 2-Tx2-P123-Pvt 33 11.5 16 10.5 DYN11 3 12 15 1.67
Primary Substation Transformer IDPrimary Voltage
[kV]
Secondary Voltage
[kV]
Rated Apparent Power(ONAF)[MVA]
Impedance Voltage
[%]Vector Group
Minimum Tap Position
Nominal Tap Position
Maximum Tap Position
Additional Voltage per Tap
[%]
ROP Al Khoudh-Tx1-P161-Pvt 33 11.5 20 12.5 DYN11 3 12 15 1.67
ROP Al Khoudh-Tx2-P161-Pvt 33 11.5 20 12.5 DYN11 3 12 15 1.67
Rusail 08-Tx1-P164 33 11.5 20 12.1 DYN11 3 12 15 1.67
Rusail 08-Tx2-P164 33 11.5 20 12.1 DYN11 3 12 15 1.67
Rusail 08-Tx3-P164 33 11.5 20 12.1 DYN11 3 12 15 1.67
Rusail Industrial 4-Tx1-P158 33 11.5 20 12.1 DYN11 3 12 15 1.67
Rusail Industrial 4-Tx2-P158 33 11.5 20 12.3 DYN11 3 12 15 1.67
Rusail Industrial 4-Tx3-P158 33 11.5 20 12 DYN11 3 12 15 1.67
Rusail Industrial 3-Tx1-P105 33 11.5 20 12 DYN11 3 12 15 1.67
Rusail Industrial 3-Tx2-P105 33 11.5 20 12.4 DYN11 3 12 15 1.67
Rusail Private Factory-Tx1-P106 33 11.5 20 12.6 DYN11 3 12 15 1.67
Rusail Private Factory-Tx2-P106 33 11.5 20 12.5 DYN11 3 12 15 1.67
Rusail Housing-Tx1-P056 33 11.5 20 12.1 DYN11 3 12 15 1.67
Rusail Housing-Tx2-P056 33 11.5 20 11.9 DYN11 3 12 15 1.67
SQU 03-Tx1-P160-Pvt 33 11.5 20 12.3 DYN11 3 12 15 1.67
SQU 03-Tx2-P160-Pvt 33 11.5 20 11.6 DYN11 3 12 15 1.67
SQU 03-Tx3-P160-Pvt 33 11.5 20 11.6 DYN11 3 12 15 1.67
Primary Substation Transformer IDPrimary Voltage
[kV]
Secondary Voltage
[kV]
Rated Apparent Power(ONAF)[MVA]
Impedance Voltage
[%]Vector Group
Minimum Tap Position
Nominal Tap Position
Maximum Tap Position
Additional Voltage per Tap
[%]
Al Awabi-Tx1-P139 33 11.5 6 5.3 DYN11 1 3 7 2.50
Al Awabi-Tx2-P139 33 11.5 6 5.3 DYN11 1 3 7 2.50
Al Awabi-Tx3-P139 33 11.5 6 5.3 DYN11 1 3 7 2.50
Al Misfah-Tx1-P080 33 11.5 20 12.5 DYN11 3 12 15 1.67
Al Misfah-Tx2-P080 33 11.5 20 12.5 DYN11 3 12 15 1.67
Al Misfah-Tx3-P080 33 11.5 20 12.4 DYN11 3 12 15 1.67
Cement Factory 1-Tx1-P079 33 11 31.5 15 YND11 1 9 17 1.01
Cement Factory 1-Tx2-P079 33 11 31.5 15 YND11 1 9 17 1.01
Cement Factory 1-Tx3-P079 33 11.5 20 12.5 DYN11 3 12 15 1.67
Cement Factory 1-Tx4-P079 33 11.5 20 12.5 DYN11 3 12 15 1.67
Cement Factory 1-Tx5-P079 33 11.5 20 12.5 DYN11 3 12 15 1.67
Orpic-Tx1-P192 33 6.9 6.3 7.8 DYN11 1 3 5 2.50
Orpic-Tx2-P192 33 6.9 6.3 7.4 DYN11 1 3 5 2.50
Primary Substation Transformer IDPrimary Voltage
[kV]
Secondary Voltage
[kV]
Rated Apparent Power(ONAF)[MVA]
Impedance Voltage
[%]Vector Group
Minimum Tap Position
Nominal Tap Position
Maximum Tap Position
Additional Voltage per Tap
[%]
Mabelah South-Tx1-P061 33 11.5 20 12.2 DYN11 1 4 13 1.67
Mabelah South-Tx2-P061 33 11.5 20 12.4 DYN11 1 4 13 1.67
Manoma 1-Tx1-P067 33 11.5 20 11.6 DYN11 1 4 13 1.67
Manoma 1-Tx2-P067 33 11.5 20 11.5 DYN11 1 4 13 1.67
Palace Communication-Tx-P033-OD 33 11.5 6 6 DYN11 1 3 7 1.03
RGO Halban Camp-Tx-P034-OD 33 11.5 5 7.4 DYN11 1 3 7 1.03
Rusail Industry[G13] - A GSS [Zone 3]
Misfah[G04] GSS [Zone 2]
Barka[G02] GSS [Zone 3]
Rusail Industry[G13] - B GSS [Zone 3]
MEDC Distribution System Capability Statement [2020-2022]-V1.0 141

Primary Substation Transformer IDPrimary Voltage
[kV]
Secondary Voltage
[kV]
Rated Apparent Power(ONAF)[MVA]
Impedance Voltage
[%]Vector Group
Minimum Tap Position
Nominal Tap Position
Maximum Tap Position
Additional Voltage per Tap
[%]
Botanic Garden-Tx1-P016 33 11.5 20 12.2 DYN11 3 12 15 1.67
Botanic Garden-Tx2-P016 33 11.5 20 12.2 DYN11 3 12 15 1.67
Mabelah A-Tx1-P063 33 11.5 20 12.4 DYN11 3 12 15 1.67
Mabelah A-Tx2-P063 33 11.5 20 12.6 DYN11 3 12 15 1.67
Mabelah A-Tx3-P063 33 11.5 20 12.5 DYN11 3 12 15 1.67
Mabelah Grid-Tx1-GP04 33 11.5 20 12.5 DYN11 3 12 15 1.67
Mabelah Grid-Tx2-GP04 33 11.5 20 12.3 DYN11 3 12 15 1.67
Mabelah Industrial-Tx-P191 33 11.5 6 6.2 DYN11 1 3 7 2.50
Mabelah PH-5-Tx-P190 33 11.5 6 6.1 DYN11 1 3 7 2.50
Mabelah South PH-7-Tx1-P141 33 11.5 20 11.7 DYN11 3 12 15 1.67
Mabelah South PH-7-Tx2-P141 33 11.5 20 11.7 DYN11 3 12 15 1.67
Mabelah South PH-7-Tx3-P141 33 11.5 20 11.74 DYN11 3 12 15 1.67
Mabelah STP-Tx1-P140 33 11.5 10 7.7 DYN11 3 12 15 1.67
Mabelah STP-Tx2-P140 33 11.5 10 7.8 DYN11 3 12 15 1.67
Old Mabelah-Tx1-P059 33 11.5 20 11.8 DYN11 3 12 15 1.67
Old Mabelah-Tx2-P059 33 11.5 20 11.9 DYN11 3 12 15 1.67
Sur Al Hadid -Tx1-P116 33 11.5 20 12.6 DYN11 3 12 15 1.67
Sur Al Hadid -Tx2-P116 33 11.5 20 12.6 DYN11 3 12 15 1.67
Primary Substation Transformer IDPrimary Voltage
[kV]
Secondary Voltage
[kV]
Rated Apparent Power(ONAF)[MVA]
Impedance Voltage
[%]Vector Group
Minimum Tap Position
Nominal Tap Position
Maximum Tap Position
Additional Voltage per Tap
[%]
Mabelah C-Tx1-P064 33 11.5 20 12.2 DYN11 3 12 15 1.67
Mabelah C-Tx2-P064 33 11.5 20 12.2 DYN11 3 12 15 1.67
Mabelah C-Tx3-P064 33 11.5 20 12.5 DYN11 3 12 15 1.67
Mabelah Shabiya-Tx1-P060 33 11.5 20 9.6 DYN11 3 12 15 1.67
Mabelah Shabiya-Tx2-P060 33 11.5 20 9.6 DYN11 3 12 15 1.67
Mabelah Shabiya-Tx3-P060 33 11.5 20 9.6 DYN11 3 12 15 1.67
Mabelah South PH-4-Tx1-P062 33 11.5 20 12.8 DYN11 3 12 15 1.67
Mabelah South PH-4-Tx2-P062 33 11.5 20 12.5 DYN11 3 12 15 1.67
Mabelah South PH-4-Tx3-P062 33 11.5 20 12.5 DYN11 3 12 15 1.67
Mabelah South PH-8-Tx1-P157 33 11.5 20 12 DYN11 3 12 15 1.67
Mabelah South PH-8-Tx2-P157 33 11.5 20 12 DYN11 3 12 15 1.67
Mabelah South PH-8-Tx3-P157 33 11.5 20 11.9 DYN11 3 12 15 1.67
Palm Mall-Tx1-P168 33 11.5 20 12.1 DYN11 3 12 15 1.67
Palm Mall-Tx2-P168 33 11.5 20 12.1 DYN11 3 12 15 1.67
Palm Mall-Tx3-P168 33 11.5 20 12.1 DYN11 3 12 15 1.67
Primary Substation Transformer IDPrimary Voltage
[kV]
Secondary Voltage
[kV]
Rated Apparent Power(ONAF)[MVA]
Impedance Voltage
[%]Vector Group
Minimum Tap Position
Nominal Tap Position
Maximum Tap Position
Additional Voltage per Tap
[%]
Al Khoud PH-7-Tx1-P154 33 11.5 20 12.3 DYN11 3 12 15 1.67
Al Khoud PH-7-Tx2-P154 33 11.5 20 12.2 DYN11 3 12 15 1.67
Al Khoud PH-7-Tx3-P154 33 11.5 20 12.3 DYN11 3 12 15 1.67
Al Khoud Shabiya-Tx1-P046 33 11.5 20 12.4 DYN11 3 12 15 1.67
Al Khoud Shabiya-Tx2-P046 33 11.5 20 12.2 DYN11 3 12 15 1.67
New Al Khoud-Tx1-P047 33 11.5 20 12.4 DYN11 3 12 15 1.67
New Al Khoud-Tx2-P047 33 11.5 20 12.4 DYN11 3 12 15 1.67
Wadi Al Aresh-Tx1-P115 33 11.5 20 12.1 DYN11 3 12 15 1.67
Wadi Al Aresh-Tx2-P115 33 11.5 20 12.1 DYN11 3 12 15 1.67
Wadi Al Lawami-Tx1-P117 33 11.5 20 12.5 DYN11 3 12 15 1.67
Wadi Al Lawami-Tx2-P117 33 11.5 20 12.5 DYN11 3 12 15 1.67
Wadi Al Lawami-Tx3-P117 33 11.5 20 12.5 DYN11 3 12 15 1.67
Wadi Bahayis (RGO)-Tx1-P098 33 11.5 20 12.6 DYN11 3 12 15 1.67
Wadi Bahayis (RGO)-Tx2-P098 33 11.5 20 12.7 DYN11 3 12 15 1.67
Primary Substation Transformer IDPrimary Voltage
[kV]
Secondary Voltage
[kV]
Rated Apparent Power(ONAF)[MVA]
Impedance Voltage
[%]Vector Group
Minimum Tap Position
Nominal Tap Position
Maximum Tap Position
Additional Voltage per Tap
[%]
Al Hail South 2-Tx1-P153 33 11.5 20 12.3 DYN11 3 12 15 1.67
Al Hail South 2-Tx2-P153 33 11.5 20 12.3 DYN11 3 12 15 1.67
Al Hail South 2-Tx3-P153 33 11.5 20 12.3 DYN11 3 12 15 1.67
Seeb Grid-Tx1-GP08 33 11.5 20 11.7 DYN11 3 12 15 1.67
Seeb Grid-Tx2-GP08 33 11.5 20 11.7 DYN11 3 12 15 1.67
Sultan School-Tx1-P029 33 11.5 20 12.4 DYN11 3 12 15 1.67
Sultan School-Tx2-P029 33 11.5 20 12.6 DYN11 3 12 15 1.67
Mabella 2[G12] - A GSS [Zone 3]
Seeb[GP08] - A GSS [Zone 3]
Mabelah[GP04] GSS [Zone 3]
Seeb[GP08] - B GSS [Zone 3]
MEDC Distribution System Capability Statement [2020-2022]-V1.0 142

Primary Substation Transformer IDPrimary Voltage
[kV]
Secondary Voltage
[kV]
Rated Apparent Power(ONAF)[MVA]
Impedance Voltage
[%]Vector Group
Minimum Tap Position
Nominal Tap Position
Maximum Tap Position
Additional Voltage per Tap
[%]
Al Hail North 2-Tx1-P028 33 11.5 20 12.3 DYN11 3 12 15 1.67
Al Hail North 2-Tx2-P028 33 11.5 20 12.2 DYN11 3 12 15 1.67
Al Khoud PH-3-Tx1-P048 33 11.5 20 12.2 DYN11 3 12 15 1.67
Al Khoud PH-3-Tx2-P048 33 11.5 20 12.3 DYN11 3 12 15 1.67
Mawaleh C-Tx1-P072 33 11.5 20 12.7 DYN11 3 12 15 1.67
Mawaleh C-Tx2-P072 33 11.5 20 12.6 DYN11 3 12 15 1.67
Mawaleh South Grid-Tx1-GP05 33 11.5 20 11.1 DYN11 3 12 15 1.67
Mawaleh South Grid-Tx2-GP05 33 11.5 20 11.2 DYN11 3 12 15 1.67
Royal Flight-Tx1-P100 33 11.5 20 12.1 DYN11 3 12 15 1.67
Royal Flight-Tx2-P100 33 11.5 20 12.1 DYN11 3 12 15 1.67
Primary Substation Transformer IDPrimary Voltage
[kV]
Secondary Voltage
[kV]
Rated Apparent Power(ONAF)[MVA]
Impedance Voltage
[%]Vector Group
Minimum Tap Position
Nominal Tap Position
Maximum Tap Position
Additional Voltage per Tap
[%]
AL Hail South 1-Tx1-P030 33 11.5 20 12.7 DYN11 3 12 15 1.67
AL Hail South 1-Tx2-P030 33 11.5 20 12.7 DYN11 3 12 15 1.67
Al Khoud PH-6-Tx1-P049 33 11.5 20 12.5 DYN11 3 12 15 1.67
Al Khoud PH-6-Tx2-P049 33 11.5 20 12.2 DYN11 3 12 15 1.67
Mawaleh A-Tx1-P070 33 11.5 20 11 DYN11 3 12 15 1.67
Mawaleh A-Tx2-P070 33 11.5 20 11.2 DYN11 3 12 15 1.67
Mawaleh A-Tx3-P070 33 11.5 20 10.6 DYN11 3 12 15 1.67
Mawaleh B-Tx1-P071 33 11.5 20 11.9 DYN11 3 12 15 1.67
Mawaleh B-Tx2-P071 33 11.5 20 11.2 DYN11 3 12 15 1.67
Mawaleh B-Tx3-P071 33 11.5 20 10.6 DYN11 3 12 15 1.67
Mawalleh South05-Tx1-P148 33 11.5 20 12.1 DYN11 3 12 15 1.67
Mawalleh South05-Tx2-P148 33 11.5 20 12.2 DYN11 3 12 15 1.67
Mawalleh South05-Tx3-P148 33 11.5 20 12 DYN11 3 12 15 1.67
Primary Substation Transformer IDPrimary Voltage
[kV]
Secondary Voltage
[kV]
Rated Apparent Power(ONAF)[MVA]
Impedance Voltage
[%]Vector Group
Minimum Tap Position
Nominal Tap Position
Maximum Tap Position
Additional Voltage per Tap
[%]
Al Hail North 1-Tx1-P027 33 11.5 20 11 DYN11 3 12 15 1.67
Al Hail North 1-Tx2-P027 33 11.5 20 11.2 DYN11 3 12 15 1.67
City Centre-Tx1-P073 33 11.5 20 12.4 DYN11 3 12 15 1.67
City Centre-Tx2-P073 33 11.5 20 12.4 DYN11 3 12 15 1.67
Mawaleh North-Tx1-P069 33 11.5 20 12.3 DYN11 3 12 15 1.67
Mawaleh North-Tx2-P069 33 11.5 20 12.3 DYN11 3 12 15 1.67
Mawaleh North Grid-Tx1-GP01 33 11.5 20 12.3 DYN11 3 12 15 1.67
Mawaleh North Grid-Tx2-GP01 33 11.5 20 12.3 DYN11 3 12 15 1.67
Mawaleh North Grid-Tx3-GP01 33 11.5 20 12.3 DYN11 3 12 15 1.67
Mawaleh North [GP01] GSS [Zone 3]
Mawaleh South[GP05] - A GSS [Zone 3]
Mawaleh South[GP05] - B GSS [Zone 3]
MEDC Distribution System Capability Statement [2020-2022]-V1.0 143