municipal water quality investigations program … 14-15...municipal water quality investigations...
TRANSCRIPT

1
Municipal Water Quality Investigations Program 2014-2015 Work Plan
06/20/14 Final

2
This page intentionally left blank.

i
Table of Contents
1. MISSION STATEMENT and STRATEGIC PLAN _________________________________ 1
2. INTRODUCTION __________________________________________________________ 1 2.1. Background and Work Plan Structure _______________________________________ 1
2.2. Work Plan Elements _____________________________________________________ 3
2.3. MWQI Program Responsibilities ___________________________________________ 4
2.4. Program Accomplishments _______________________________________________ 6
2.5. Changes/Updates from the 2013-14 Work Plan ________________________________ 7
2.6. Challenges ____________________________________________________________ 9
2.6.1 Staffing ___________________________________________________________________________ 9 2.6.2 State Budget Actions ________________________________________________________________ 9 2.6.3 Executive Orders ___________________________________________________________________ 9
3. PROGRAM FUNDING NEEDS ______________________________________________ 10 3.1. MWQI and MWQI SPC Funds ____________________________________________ 10
3.2. Explanation of Table 1 Program Element Costs for FY 14-15 Work Plan Projects ____ 14
4. Municipal Water Quality Investigations Program Budget Impacts _________________ 17 4.1. Priority List for MWQI Program Core Elements _______________________________ 17
4.2. MWQI Program Potential Core Element Impacts ______________________________ 18
5. WATER QUALITY ASSESSMENT ___________________________________________ 18 5.1. Routine Monitoring Program _____________________________________________ 20
5.2. Short-term Monitoring __________________________________________________ 20
5.2.1 DSM2 Nutrient Study _______________________________________________________________ 21 5.2.2 Cache/Yolo Complex Pre-Restoration Baseline Monitoring _________________________________ 21 5.2.3 Pathogen Special Study Monitoring ____________________________________________________ 22
6. REAL-TIME DATA AND FORECASTING COMPREHENSIVE PROGRAM ____________ 27 6.1. RTDF-CP Real-Time Monitoring __________________________________________ 28
6.1.1 MWQI Real Time Stations ___________________________________________________________ 29 6.1.2 Gianelli WQ Station ________________________________________________________________ 31
6.2. RTDF-CP Water Quality Forecasting _______________________________________ 33
6.2.1. Continuous Refinement of Current Models ______________________________________________ 34 6.2.2. Improve How Aqueduct Pump-ins are Handled in MWQI Water Quality Forecasts _______________ 34 6.2.3. Assessment, Collection, and Archiving of Aqueduct Pump-in Data ___________________________ 35 6.2.4. Compare Water Quality Forecast to Actual Conditions ____________________________________ 35 6.2.5. Improving the DSM2 Nutrient Model ___________________________________________________ 36 6.2.6. Adding Additional Wastewater Treatment Plants to the Fingerprint ___________________________ 36 6.2.7. Potential Planning Studies __________________________________________________________ 37
6.3. RTDF-CP Information Management and Data Dissemination ____________________ 37
7. SCIENCE SUPPORT (SPECIAL STUDIES) ____________________________________ 41 7.1. Limnology of the SWP __________________________________________________ 41
7.1.1. Nutrient Budget Study ______________________________________________________________ 42 7.1.2. Nutrient Limitation Study ____________________________________________________________ 43 7.1.3. Nutrient and Nutrient Ratio Influence on Community Species Composition ____________________ 44 7.1.4. Light Limitation in the SWP __________________________________________________________ 45 7.1.5. Algal and Macrophyte Growth Study __________________________________________________ 46

ii
7.1.6. Spatial-temporal Distribution of Melosira in the SBA ______________________________________ 47 7.1.7. Distribution of Macrophytes in the SWP ________________________________________________ 48 7.1.8. Wide Swings in Canal pH Study ______________________________________________________ 49 7.1.9. San Luis Reservoir Limnology Study __________________________________________________ 51 7.1.10. Dyer Reservoir Limnology Study ____________________________________________________ 51 7.1.11. Del Valle Reservoir Limnology Study _________________________________________________ 51
7.2. State Water Project Watershed Sanitary Survey Update ________________________ 51
7.2.1 Status of Cattle Grazing in the SWP ___________________________________________________ 52 7.3. Fluorescence of Dissolved Organic Matter (FDOM) Project______________________ 54
7.4. Urban Sources and Loads Investigation ____________________________________ 59
7.5. O’Neill Forebay Mixing Study _____________________________________________ 60
7.6. Spectrofluorometer Study _______________________________________________ 62
7.7. Tidal Marsh Restoration Literature Review __________________________________ 64
7.8. Feasibility Study for MWQI Portable Water Quality Monitoring Station _____________ 66
8. OTHER MWQI FUNDED PROGRAM ACTIVITIES _______________________________ 67
8.1. Administration Work ____________________________________________________ 67
8.2. Field Unit Office Duties _________________________________________________ 68
8.3. O&M Water Quality Other Duties __________________________________________ 69
8.4. MWQI Annual Work Plan ________________________________________________ 69
8.5. DWR’s Bulletin B132, Chapter 4 - Water Quality ______________________________ 69
8.6. MWQI Agreement _____________________________________________________ 70
8.7. Workplace Safety ______________________________________________________ 70
8.8. Emergency Response __________________________________________________ 71
8.9. Miscellaneous Meetings Attended by Staff __________________________________ 71
9. PROGRAM MANAGEMENT - STATUS REPORTING ____________________________ 73
10. NON-MWQI FUNDED PROGRAM MANAGEMENT _____________________________ 74
11. OTHER REQUIRED PROGRAM COSTS _____________________________________ 74
12. ORGANIZATION CHART _________________________________________________ 76
13. GLOSSARY OF ACRONYMS AND TERMS ___________________________________ 77

iii
Figures
Figure 1. MWQI Discrete and RTDF Monitoring Locations FY 14/15 ............................................. 26
Tables
Table 1. Program Element Costs FY 14-15 (MWQI and MWQI SPC funds) .......................... 12
Table 2. MWQI Discrete sampling stations. ............................................................................ 23
Table 3. Routine and Special Study Discrete Grab Sample Deliverables and Timelines ........ 27
Table 4. MWQP Real-Time station locations, parameters, and equipment ............................. 31
Table 5. Real-Time Monitoring Deliverables and Timelines .................................................... 32
Table 6. Example of New Task List ......................................................................................... 37
Table 7. Information Management and Data Dissemination Deliverables and Timelines........ 38
Table 8. Nutrient Budget Study Deliverables and Timelines ................................................... 43
Table 9. Nutrient Limitation Study Deliverables and Timelines ............................................... 44
Table 10. Nutrient and Nutrient Ratio Influence on Community Species Composition Study Deliverables and Timelines ..................................................................................................... 45
Table 11. Light Limitation in the SWP Study Deliverables and Timelines ............................... 46
Table 12. Algal and Macrophyte Growth Study Deliverables and Timelines ........................... 47
Table 13. Spatial-temporal Distribution of Melosira in the SBA Study Deliverables and Timelines ................................................................................................................................. 48
Table 14. Distribution of Macrophytes in the SWP Study Deliverables and Timelines ............ 49
Table 15. Wide Swings in Canal pH Study Deliverables and Timelines .................................. 50
Table 16. Status of Cattle Grazing in the SWP Deliverables and Timelines ........................... 54
Table 17. FDOM Phase I Study Deliverables and Timelines .................................................. 56
Table 18. FDOM Phase II Study Deliverables and Timelines ................................................. 57
Table 19. Urban Sources and Loads Investigations Deliverables and Timelines ................... 59
Table 20. O’Neill Forebay Mixing Study Deliverables and Timelines ..................................... 61
Table 21. Spectrofluorometer Study Deliverables and Timelines ........................................... 63
Table 22. Tidal Marsh Literature Review Deliverables and Timelines ..................................... 65
Table 23. Portable Water Quality Monitoring Station Deliverables and Timelines .................. 66
Table 24. MWQI Accomplishments Report Deliverables and Timelines ................................. 68

1
1. MISSION STATEMENT and STRATEGIC PLAN
The mission of the Municipal Water Quality Investigations (MWQI) Program is to:
a) Support the effective and efficient use of the State Water Project (SWP) as a source
water supply for municipal purposes through monitoring, forecasting, and reporting of the
Sacramento San Joaquin Delta and the SWP water quality;
b) Provide early warning of changing conditions in source water quality used for municipal
purposes;
c) Provide data and knowledge based support for operational decision-making on the
SWP;
d) Conduct scientific studies of drinking water importance; and
e) Provide scientific support to the Department of Water Resources (DWR), the State
Water Project Contractors Authority (SWPCA) MWQI Specific Project Committee (MWQI
SPC), and other governmental entities.
The current MWQI 5 Year Strategic Plan, effective through June 2017, can be found at:
http://www.water.ca.gov/waterquality/drinkingwater/docs/Final_Appendices_FY13-
14WP_20130621.pdf
2. INTRODUCTION
2.1. Background and Work Plan Structure
Through this annual work plan, the MWQI Program conducts water quality monitoring in the
Sacramento-San Joaquin Delta (Delta) for municipal and industrial uses, as the Delta is
considered part of the SWP. The MWQI program incorporates their Delta water quality
monitoring data along with that of the Division of Operations and Maintenance’s (O&M) State
Water Project monitoring and then produces and disseminates daily and weekly Real-Time Data
Forecasting (RTDF) reports as explained in the Municipal Water Quality Investigations
Agreement (MWQI Agreement) between DWR’s Division of Environmental Services (DES)
MWQI Program, SWPCA, and the 16 SWP Contractors who receive municipal and industrial
(M&I) supplies from the SWP. The MWQI Program also conducts drinking water research on
2
Delta water quality, provides data and knowledge based support for DWR operations on the
SWP, and provides scientific drinking water expertise and support to DWR, the MWQI SPC,
other governmental entities, and stakeholders. Finally, the MWQI Program supports data and
database infrastructure management and sharing to enhance and improve the long-term
storage and retrieval of RTDF data, administers essential program management activities
mandated by DWR’s policies and procedures, and works to ensure the health and safety of staff
in the workplace.
This annual work plan describes work to be performed by the MWQI Program for the fiscal year
(FY) 14-15 (July 1, 2014 to June 30, 2015). Work identified in this work plan is prioritized and
developed by MWQI Program management staff and the SWPCA MWQI SPC. Adjustments to
the MWQI Program may be made at any time in a Program Year through a decision of DWR
with the concurrence of the MWQI TAC, and with the concurrence of the MWQI SPC for work
performed under the MWQI SPC Account. Examples of adjustments are unforeseen events
such as staff vacancies, workload shifts, or other resource demands placed on the program by
DWR upper management.
The MWQI Program is composed of staff from the Municipal Water Quality Investigations, Water
Quality Special Studies, and the MWQI Field sections. In addition, project partners from various
organizations work directly with program staff. The SWPCA MWQI SPC is composed of the
State Water Contractors who take M&I water supplies from the SWP, all of whom have an
interest in the monitoring of the quality of drinking water supplies in the Delta and in the SWP.
Approval of the annual work plan is provided by “voting members” of the MWQI Technical
Advisory Committee (TAC), which includes MWQI Program management staff, and the SWPCA
MWQI SPC members committed to funding the MWQI Program’s planned work. Other TAC
representatives include the California Department of Public Health (CDPH); Contra Costa Water
District (CCWD), which is an invited participant associated with the TAC; the MWQI SPC
program management consultant; and other invited members of outside agencies.
Representatives serving on the MWQI SPC can differ from those serving on the MWQI TAC.
The majority of the MWQI Program ($2.7 million in FY 14-15) is funded by the MWQI SPC
through the Statements of Charges. Additional funds are provided through the MWQI SPC for
the items listed in Section 3.2 of this Work Plan and under the "MWQI SPC Fund" column of

3
Table 1. CCWD also provides funding to the MWQI SPC for the items listed in Table 1. The
MWQI SPC members are:
1. Alameda County Flood Control and Water Conservation District, Zone Seven
2. Alameda County Water District
3. Antelope Valley-East Kern Water Agency
4. Castaic Lake Water Agency
5. Central Coast Water Authority
6. Crestline-Lake Arrowhead Water Agency
7. Kern County Water Agency, Municipal and Industrial Use
8. Mojave Water Agency
9. Metropolitan Water District of Southern California
10. Napa County Flood Control and Water Conservation District
11. Palmdale Water District
12. San Bernardino Valley Municipal Water District
13. San Gorgonio Pass Water Agency
14. San Luis Obispo County Flood Control and Water Conservation District
15. Santa Clara Valley Water District
16. Solano County Water Agency
2.2. Work Plan Elements
The MWQI Program collects discrete data, collects and disseminates real-time data, and
conducts water quality studies to develop an understanding of the sources of drinking water
contaminants which affect the quality and treatability of water supplied to municipal water
purveyors. The MWQI Program provides technical water quality expertise and data to support
modeling efforts to other units within DWR, to local municipal water agencies, and to the State
Water Resources Control Board (SWRCB) and the Regional Water Quality Control Boards, and
contributes water quality expertise while participating in regulatory and planning processes as

4
described in the work plan elements. The following work plan elements are essential functions
of the MWQI Program and are further explained in subsequent sections of this work plan.
Water Quality Assessment
The Real-Time Data and Forecasting Comprehensive Program (RTDF-CP) including
real-time water quality monitoring, forecasting, and data dissemination
Science Support (Special Studies)
Emergency Response
Workplace Safety
Other Water Quality Program Related Activities – funded by the MWQI Program
Program Management
DWR Support Activities – not funded by the MWQI Program
Data to support the efforts of the DWR modelers and MWQI project partners.
Three appendices complement the work plan by providing more in-depth information regarding
the essential elements of MWQI Program. These appendices are:
Appendix 1 – MWQI Program FY 14-15 work plan element costs and staff workload
assessments.
Appendix 2 – Project Management documentation.
Appendix 3 – Work plan schedule and process.
2.3. MWQI Program Responsibilities
In addition to the already mentioned responsibilities, MWQI program managers and staff will
participate in various drinking water quality activities external to the program, such as regulatory
activities (SWRCB, Central Valley Regional Water Quality Control Board, and CDPH) that can
affect drinking water quality and operations of the SWP. MWQI Program staff will coordinate
such activities with the MWQI SPC as in the past.

5
MWQI Program responsibilities:
Conduct long-term discrete water quality monitoring (grab samples) in the Delta
Conduct real-time water quality monitoring (automated, high frequency data collection
stations) in the Delta
Provide scientific support on Delta, SWP, and drought related drinking water issues
Analyze Delta drinking water quality monitoring data
Provide Delta drinking water quality historical data
Provide SWP drinking water quality early warning (RTDF-CP) data
Provide SWP drinking water quality forecasting (RTDF-CP) data and information
Provide support to the MWQI SPC
MWQI Program staff also provides support on occasion to:
The Delta Stewardship Council
The Delta Conservancy
The State Water Resources Control Board for their CDEN database development efforts
The California Water Quality Monitoring Council for their “My Water Quality” web portal
development efforts
The Interagency Ecological Program (IEP) for their strategic plan efforts, annual
workshop and IEP work teams
The California Water Plan for periodic update and review efforts
The DWR Safety Office for workplace safety efforts
DWR’s emergency response efforts, if needed and where possible
DWR’s annual effort in producing Bulletin 132, Chapter 4 – Water Quality
DWR drought activities

6
Customers/Regulators using MWQI data:
SWPCA MWQI SPC
Contra Costa Water District
Central Valley Regional Water Quality Control Board
California Department of Public Health
DWR’s Operation Control Office
DWR’s Bay Delta Office
Delta Conservancy
Other State government agencies
US Environmental Protection Agency
Bay Delta Conservation Plan
2.4. Program Accomplishments
The MWQI Program has accomplished a number of goals listed in the FY 13-14 work plan.
These include:
Continuous operation of five real-time water quality stations
Continuous data dissemination of water quality reports
Weekly distribution of short-term water quality forecasts
Monthly distribution of volumetric, EC, and organic carbon source fingerprints
Installation of modified water delivery systems at Hood and Vernalis stations which have
decreased the maintenance costs at these stations. The same systems will soon be
installed at the other 3 stations.
Completion of version 2 of the Field Station Real-Time Monitoring Standard Operating
Procedures for Gianelli WQ station.
Completion of WARMF Model development for the Sacramento and San Joaquin Rivers

7
Completion of O&M historical data entry project
Migration of quality controlled Real-Time Monitoring Data to WDL for data dissemination
and science support.
Completion of California Integrated Water Quality System (CIWQS) Database Search.
Publication of MWQI Summary Report to website.
Prepared Urban Sources and Loads Report to post on website and had summary report
published in the IEP Newsletter
Finished several projects to develop data for simulation of historical conditions for the
Delta and Aqueduct water quality models including assembling, synthesize, and refining
EC, DOC, and bromide data necessary to define boundary condition. These projects are
part of a large RTDF-CP Water Quality Forecast project involving the Bay Delta Office
(BDO) and Operations Control Office (OCO).
2.5. Changes/Updates from the 2013-14 Work Plan
The new MWQI Program’s work plan continues to evolve to meet the changing water quality,
regulatory, and data sharing landscape while following DWR policies and processes. In this
work plan cycle, several special studies projects are ongoing and continue forward from the FY
13-14 work plan, and many of these projects will be completed within the FY 14-15 work plan
cycle. A number of the tasks associated with the RTDF-CP were planned to continue into the
FY 14-15 work plan.
The MWQI Program staff is required to use both Water Resources Engineering Memorandum
65a (WREM65a) and Project Management Book of Knowledge (PMBOK) standards when
planning and conducting their scientific special studies since 2013. For more information about
these standards see the previous MWQI FY 13-14 work plan. Staff responsible for planning and
conducting scientific special studies, called lead investigators, manages their projects using the
basic process steps of initiating, planning, executing, monitoring and controlling, and closing a
project. MWQI staff will use project initiation forms, as well as charters, resource agreements,
and project management plans to plan, conduct, and control their projects. DWR resource
agreements serve as an agreement between the MWQI Program Manager and the Program

8
Manager in other DWR Divisions doing the work. Lead investigators may need to incorporate a
resource agreement into their projects if support is required from other DWR Divisions.
To ensure the success of the new special studies, the study’s lead investigators are responsible
for developing and refining: the project management integration, scope of work, timelines, and
cost estimates, quality; staffing and equipment requirements; and communication management,
risk management, procurement management, and stakeholder management plans. Also, the
study’s lead investigators are responsible for identifying their project’s specific reporting
requirements and relationships, participant roles and responsibilities, and monitoring change
control and reporting policies and procedures. By incorporating their knowledge along with the
basic process steps of project management, the lead investigators have additionally integrated
principles of sound scientific study design and have developed milestone tracking steps that will
need to be accomplished in order to achieve an effectively managed project while efficiently
producing deliverables within scope, schedule, and budget.
Some projects in this work plan have not yet been thoroughly discussed and developed with the
MWQI Program staff and the MWQI SPC members, therefore staff do not yet possess enough
information to develop the project initiation forms or project charters. When sufficient
information is developed and if there are sufficient staff resources, the special project may be
included in this work plan cycle or may be included in the next work plan cycle.
The MWQI SPC is committed to ensuring the success of the MWQI Program’s planned work
and therefore, has identified project partners or subject matter experts (SME’s) that have been
serving as technical advisors on several of the special study projects. Project partners have
guided and given advice to staff throughout their projects to completion. Throughout the life of
the special study projects, staff has been encouraged to meet regularly with their project
partners and provide periodic updates during monthly TAC meetings.
Special study final reports will be posted on the MWQI Program’s website at:
http://www.water.ca.gov/waterquality/drinkingwater/. Before publication, special study final
reports will follow DWR’s publication policy and will be initially peer-reviewed by the MWQI staff
then MWQI Program management followed by the project partners and MWQI SPC, and finally
by DWR’s upper management. Some of the completed reports may be published as journal
articles.
9
2.6. Challenges
The following are challenges associated with the management of the MWQI Program, and the
Municipal Water Quality Program (MWQP) Branch.
2.6.1 Staffing
In April of 2013, the MWQI Program experienced a Senior Environmental Scientist vacancy. In
June of 2013, the MWQI Program experienced an Environmental Scientist vacancy, in the
MWQI Field Section. The Senior Environmental Scientist vacancy was filled in June 2013. The
Environmental Scientist vacancy was filled in December 2013, but was moved from the MWQI
program and placed in the QA/QC program. Currently, there are no vacancies in the MWQI
Program.
2.6.2 State Budget Actions
The Governor has declared that California is currently in a state of emergency due to the current
multi-year drought. MWQP management staff has been called-on by DWR to provide expertise
on municipal water uses during high-level drought management planning meetings. Staff time
outside of management has not yet been used for drought efforts. It is highly likely that MWQP
staff will be called on during FY 14-15 to provide services to the State in its management of the
drought situation. If this fact changes, the MWQP Branch Chief will discuss needs with MWQI
management, MWQI SPC, and the TAC.
The Governor’s 2011 mandatory reduction in cell phones and vehicles had a significant impact
on DWR, DES and the MWQI Program. The current DES policy requires that staff members
conducting remote field work are in possession of a State issued cell phone. Currently, the
Field Section uses pool phones to conduct their routine water quality sampling and station
support activities. Non Field Section staff members are required to check-out phones from the
Field Section when conducting field work.
2.6.3 Executive Orders
The Governor’s 2011 order for state agencies to reduce their number of vehicles by 50%, never
resulted in MWQI losing vehicles, but it did result in the mobile monitoring vans not being
purchased in previous fiscal years. During the FY 13-14, one of these mobile lab vans
experienced serious engine and transmission issues that resulted in the vehicle being taken out
of service. The other mobile lab van has also experienced issues. At times, these issues have

10
caused MWQI difficulty completing intended field work in a timely and efficient fashion. The
replacement vans are on order and will be delivered by the end of the FY 13-14.
Finally, per the Governor’s executive order, B-06-11 of 2011, travel restrictions continue to be
fully enforced by DWR therefore, only mission-critical in-state travel which fits certain exemption
categories will be approved.
The MWQI Program will adjust accordingly by addressing the program’s core functions while
becoming more flexible with project deadlines, prioritizing training, and reducing the number of
meetings that staff are required to attend.
3. PROGRAM FUNDING NEEDS
3.1. MWQI and MWQI SPC Funds
The new three-year MWQI Agreement between the MWQI Program, SWPCA, and the 16 SWP
Contractors who receive M&I water from the SWP, took effect in January 2014. For FY 14-15,
the total budget is $3 million with $2.7 million for the DWR MWQI Program and $286,500 for the
MWQI SPC fund. The DWR MWQI Program portion will fund staff salaries including benefits,
assessments, operating expenses, Real-Time Data Forecasting, support to the DWR modelers,
and research on the quality of drinking water supplies taken from the Delta. For this FY 14-15
budgeting purposes MWQI will be using an assessed labor rate of $97 for Environmental
Scientists and $127 for engineers. The MWQI SPC portion will provide funds to retain
consultants, and purchase certain goods and services deemed necessary and desirable for
station operation and research by both the MWQI TAC and the MWQI SPC. The estimated
budget expenses for this work plan cycle are shown in Table 1.
The majority of the $2.7 million budget for the MWQI Program is funded by the SWPCA MWQI
SPC through the Statement of Charges. Additional funds are provided through the MWQI SPC
for the items listed in section 3.2 of this work plan and under the “MWQI SPC Fund” column of
Table 1. The Contra Costa Water District also provides funding to the MWQI SPC for the items
listed in Table 1.
A new contract between the MWQI Program and the San Luis and Delta Mendota Water
Authority (SLDMWA) is current and effective through December 2015. With this contract in

11
place, SLDMWA can continue to provide supplemental support of the MWQI Program water
quality monitoring equipment installed at the Jones Pumping Plant.
The FY 14-15 MWQI Program and MWQI SPC budget is presented in Table 1 below, followed
by an updated explanation of MWQI and MWQI SPC expenditures. Partner staffing in this
budget reflects 1 Person Year or 1 PY each for the Bay Delta Office and Operations Control
Office and 0.6 PY for the Division of Operations & Maintenance’s Environmental Assessment
Branch.
Managing and controlling the work done by MWQI program partner staff will be accomplished
using resource agreements. Resource agreements are mutually agreed-upon work products
and approved by Program Managers within the respective DWR Divisions. Resource
agreements can vary in length and be renewed or revised at any time with approvals by the
participating Program Managers.
For budgeting purposes DWR assesses overhead charges to the hourly rate of each member of
the MWQI staff. These assessments help to cover overhead costs including;
MWQI staff leave (holiday, vacation, sick, etc…)
Administrative staff
Management staff
Executive staff (including personnel, legal, fiscal, facilities, etc.)
Building costs and maintenance
Vehicle costs
Employee Benefits
Other DWR expenses
While the hourly employee costs including assessments have been static for many years they
are subject to change. At times unexpected costs may be assessed to the hourly rate of MWQI
staff. These increases in assessments may be due to a number of reasons including, but not
limited to, emergency response, lawsuits, and legislative mandates. NOTE - The MWQI
Program is being reimbursed $90,000.00 in FY 13-14 for assessments that should have been
charged to the correct DWR program. In general these costs come in the form of temporary
increases to assessments over a short period of time.

12
Table 1. Program Element Costs FY 14-15 (MWQI and MWQI SPC funds)
Workplan Element Program Element 2014/15 IO#
Labor Hours Labor Cost
Contract costs OE&Ec Total Cost
MWQI/SPC Fund
Total Budget
5 Water Quality Assessment
5.1 Routine Monitoring Program VWQASSMENT13 752 $72,944 $5,000 $77,944 $77,944
5.2 Short-term Monitoring VWQASSMENT13 1824 $176,928 $54,000 $230,928 $230,928
6 RTDF-Comprehensive Program
6.1 RTDF-CP Real Time Monitoring
6.1.1a MWQI Real Time Stations VRTMONITOR13 2336 $226,592 $21,400 $55,000 $302,992 $25,000 $327,992
6.1.2 Gianelli WQ Station VGIANNELLI13 1064 $103,208 $4,600 $8,000 $115,808 $115,808
6.2 RTDF-CP Water Quality Forecasting
6.2.1 BDO- Bay Delta Office Modeling VRTBDOMODL13 1768 $224,536 $224,536 $224,536
6.2.2 OCO- Operations Control Office Modeling VRTOCOMODL13 1768 $224,536 $224,536 $224,536
6.2.3 Model Support - Trends Analysis, modeling, rpt VTRENDSAMR13 104 $10,088 $10,088 $10,088
6.3 RTDF-CP Information Management and Data Dissemination
6.3.1 RTDF Data Dissemination & Reporting VRTDDISRPT13 1264 $122,608 $122,608 $13,000 $135,608
6.3.2 Administration and Database Activitiesb $0 $62,400 $62,400
7 Science Support (Special Studies)
7.1 7.1 Limnology of the SWP VLIMNOLOGY13 1944 $188,568 $188,568 $65,000 $253,568
7.1.1 Nutrient Budget Study VNTDYNSTDY13 1144 $110,968 $110,968 $110,968
7.1.2 Nutrient Limitation Study VLIMNUTLIM14 360 $34,920 $34,920 $34,920
7.1.3 Nutrient and Nutrient Ratio Influence on Community Species Composition VLIMNRATIO14 144 $13,968 $13,968 $13,968
7.1.4 Light Limitation in the SWP VLIMLIGHTL14 688 $66,736 $66,736 $66,736
7.1.5 Algal and Macrophyte Growth Study VLIMAMGROW14 120 $11,640 $11,640 $11,640
7.1.6 Spatial-temporal Distribution of Melosira in the SBA VLIMMELOSI14 696 $67,512 $67,512 $67,512
7.1.7 Distribution of Macrophytes in the SWP VLIMMACROP14 600 $58,200 $58,200 $58,200
7.1.8 Wide Swings in Canal pH Study VLIMPHSTUD14 528 $51,216 $51,216 $51,216
7.1.9 San Luis Reservoir Study VLIMSLRSRV14 0 $0 $0 $0
7.1.10 Dyer Reservoir Study VLIMDYRSRV14 0 $0 $0 $0
7.1.11 Del Valle Reservoir Study VLIMDLRSRV14 0 $0 $0 $0
7.2 7.2.1 Cattle Impacts to SWP Water Quality VSANSURVEY14 480 $46,560 $46,560 $46,560
7.3 7.3 FDOM Phase II VFDOMPOCS013 800 $77,600 $2,000 $79,600 $79,600
7.4 7.4 Urban Sources and Loads Investigation VURBANSL0013 80 $7,760 $7,760 $7,760
7.5 7.5 O'Neill Forebay Mixing Study VONEILFRBY13 80 $7,760 $7,760 $7,760
7.6 7.6 Spectrofluorometer Study VSPCTROFLU13 160 $15,520 $15,520 $2,000 $17,520
7.7 7.7 Tidal Marsh Restoration Literature Review VTIDALMRSH13 160 $15,520 $15,520 $15,520
7.8 7.8 Feasibility Study for MWQI Portable Monitoring Sta. VPORTBLSTN13 80 $7,760 $7,760 $7,760
8 Other MWQI Funded Program Activities
8.1 Administration Work VDWRRQDDPC13 1640 $159,080 $10,000 $169,080 $169,080
8.2 Field Unit Office Duties VFUOFCWORK13 1200 $116,400 $5,000 $121,400 $121,400
8.3 O & M WQ other duties (Daniel may not be charging to this IO#) VOMWQHQ00013 $500 $500 $500
8.4 MWQI Annual Workplan VWORKPLAN013 528 $51,216 $51,216 $51,216
8.5 DWR Bulletin 132 VBULL132WQ13 120 $11,640 $11,640 $11,640
8.7 Workplace Safety VSAFTYDOCS13 136 $13,192 $500 $13,692 $13,692
8.8 Emergency Response V911RESPNS13 40 $3,880 $3,880 $3,880
8.9 Miscellaneous meetings attended by staff VOTHERWQPA13 400 $38,800 $38,800 $38,800
9 Program Management-Status Reporting VPROGMMGMT13 1792 $173,824 $173,824 $89,100 $262,924
10 Non-MWQI Funded Program Management $0 $0 $0
11 Other Required Program Costs $3,000 $3,000 $30,000 $33,000
11.1 MEO Insurance & Fuel G1111290005I $1,000 $1,000 $1,000
Total 24800 $2,511,680 $29,000 $141,000 $2,681,680 $286,500 $2,968,180
a 6.1.1 Includes contracts with San Luis & Delta Mendota Water Authority, and maintenance contracts for WQ Station analyzers. b Includes Dennis' time(funded by the MWQI SPC). c Operating Equipment & Expenses * DWR assessments are equally charged to programs to cover costs of Departmental overhead expenses. For example, administration, legal, and executive offices.
**The MWQI Program includes 11 PY for staff and 3 PY for program partners in OCO, BDO, and O&M. ES Staff time has been calculated at $97 per hour, and Engineer Staff time at $127 per hour.

13
This page intentionally left blank.
14
3.2. Explanation of Table 1 Program Element Costs for FY 14-15 Work Plan
Projects
Specific Tasks to be Implemented using MWQI SPC Funds
The MWQI SPC will provide funding to provide technical support on program tasks associated
with the MWQI Program:
Program Element 6.1.1 MWQI Real Time Stations
$25,000 allocated, if needed, for real time station and special study equipment and/or
rental needs
Program Element 6.3.1 RTDF Data Dissemination & Reporting
Consultant to provide technical expertise on the RTDF-CP Program up to $13,000.
Program Element 6.3.2 Administration and Database Activities
Consultant to provide technical and managerial expertise with RTDF-CP administration,
database activities, and data management support up to $62,400.
Program Element 7.1 Limnology of SWP
Consultant will act as the Project Manager to provide technical and managerial expertise
for the Limnology of SWP Study up to $40,000.
$25,000 allocated, if needed for equipment purchases.
Program Element 7.6 Spectrofluorometry Study
Consultant to provide technical expertise on the MWQI Spectrofluorometry Study up to
$2,000.
Program Element 9 Program Management/Status Reporting
Consultant to administer MWQI SPC managed fund and serve as a liaison between
MWQI and the MWQI SPC up to $80,000. The MWQI SPC Consultant will provide
technical and managerial expertise on program tasks associated with the MWQI
Program. The consultant serves as a member of the MWQI TAC, administers the MWQI
SPC fund, and serves as a liaison between the MWQI SPC and the MWQI Program. The

15
SWPCA General Manager will charge time to this budget when working on MWQI
activities or attending meetings.
Program Management expenses including State Water Contractor staff services, legal,
administration expenses, and Annual Meeting costs up to $9,100.
Program Element 11 Unassigned Funds
Consultant to continue work on artificial neural network model, up to $30,000.
MWQI contracts required for FY 14-15 Work Plan Elements
The MWQI Program maintains a planned budget of $29,000 to cover the total expenses of the
following contracts:
1. Element 6.1.1 – The contract has been extended with the SLDMWA that covers
minor repair work and the cost of phone service at the Jones Pumping Plant where
MWQI maintains a RTDF water quality station. The service is necessary for safety
reasons since staff may be working for extended periods of time in the lower level of
this pumping plant where their cell phones may not have service, and in case of
emergency staff would need access to a working landline phone ($2000).
2. Element 6.1.1 – The MWQI Program maintains the contract with All Cal Services
that provides a portable toilet at the Hood RTDF WQ Station. This service is
necessary since staff may be on-site for extended periods of time while calibrating
the instruments and there are no other similar facilities in the local vicinity ($1000).
3. Element 6.1.2 – The GE/Sievers contract provides the MWQI Program preventative
maintenance services, reagents, and labor for repair and service of the Sievers
organic carbon analyzers ($26,000).

16
MWQI Operating Equipment and Expenses using the MWQI Program’s Planned Budgeted
Funds
Program Element 5.1 Routine Monitoring Program
$5,000, allocated for equipment and supplies related to the discrete monitoring program.
Program Element 5.2 Short Term Monitoring
$54,000, allocated for contract lab analysis costs, equipment, and supplies.
Program Element 6.1.1: MWQI Real-Time Stations
$55,000 allocated for the purchase of replacement filters, miscellaneous station supplies,
and analyzer specific components and service agreements.
Program Element 6.1.2: Gianelli WQ station
$8,000 allocated for the purchase of replacement filters, miscellaneous station supplies,
and analyzer specific components and service agreements.
Program Element 7.3: FDOM Proof of Concept Phase II Study
$2,000 allocated for repairs and the purchase of quantitative standards for instrument
calibrations.
Program Element 8.1: Administration Work
$10,000 allocated for training classes, registration fees, travel related expense, and the
cost for the annual or offsite meetings. The Annual Meeting costs may include rental
fees for a facility, A/V equipment and technical assistance, deposit for reserving dates
and other miscellaneous meeting package elements. This budget covers the additional
training expenses for new staff and promoted staff in the MWQI Program.
Program Element 8.2: Field Unit Office Duties
$5,000 allocated for needed repairs to Field Section prep trailer and the trailer deck.
Program Element 8.3: O&M WQ Other Duties
$500 allocated for the purchase of quantitative standards for instrument calibrations.
Program Element 8.7: Workplace Safety

17
$500 allocated for the purchase of miscellaneous safety equipment for example, vehicle
fire extinguishers and first aid kits, personal flotation devices, earplugs, safety glasses,
etc.
Program Element 11: Other Required Program Costs
$1,000 allocated for the expenses associated with insurance and fuel for the MWQI
Program’s field support sampling vehicles. Currently the Field Support Section has four
vehicles in its service fleet, two vans and two trucks that are necessary to maintain the
MWQI Program’s continuous monitoring and support to various special studies.
4. Municipal Water Quality Investigations Program Budget
Impacts
Staff time may shift occasionally from the work described in this work plan due to situations that
may arise, such as the need to work on drought activities, Bay Delta Conservation Plan (BDCP),
or other DWR priority activities. MWQI Program core elements will receive priority throughout
this fiscal year work plan, and are listed in priority of importance to the MWQI SPC. If it
becomes apparent that there are demands on these core elements, the water quality
monitoring, RTDF-CP and support will continue as the highest planned priority.
4.1. Priority List for MWQI Program Core Elements
1. Water quality monitoring (both real-time and discrete) at existing stations and sites
2. Modeling duties associated with real-time forecasting used in the RTDF daily and
weekly reports
3. Production and dissemination of daily and weekly RTDF reports
4. Data management activities pertaining to database infrastructure enhancement and
development to improve long-term storage and retrieval of RTDF data
5. Special Studies

18
6. Program management activities listed in the MWQI agreement and those mandated
by DWR required for health and safety of the MWQI Program staff. This includes
monthly MWQI TAC meetings and budget updates.
7. Other required Program activities that are mandated by DWR and/or essential to the
MWQI Program (i.e. purchasing, contracts, budgeting, 2014 DWR Environmental
Scientist Workshop, safety and policy training, specific meetings and conferences).
4.2. MWQI Program Potential Core Element Impacts
Work on specific program core elements that could be delayed pending any staff vacancies or
re-prioritization to other projects by DWR Management (as in, drought work):
Report production deadlines and timelines associated with some tasks
Cross-training of MWQI staff on modeling and GIS functions
Delay of RTDF data management tasks when assistance is needed from the Division of
Technology Services or MWQI Program staff. The MWQI Program’s Data Management
Consultant (Dennis Huff) can continue to work his regularly scheduled hours since his
contract costs are funded by the MWQI SPC.
If needed, implementation of special studies will be delayed to accommodate core
Program elements.
To ensure that core functions are not affected, some staff may curtail participation in MWQI
Program’s related meetings such as the Environmental Scientist Workshop.
5. WATER QUALITY ASSESSMENT
Water quality assessment has been a key feature of the MWQI Program since its inception in
1983. MWQI Program data are used by DWR, the MWQI SPC, non-governmental
organizations, the public, and numerous other federal, State, and local agencies. These entities
use MWQI data for drinking water supply planning studies, to identify long-term trends in
drinking water quality, and to help DWR and other agencies develop research and mitigation
measures to reduce drinking water contaminants in Delta waters and the SWP. Additionally, in
collaboration with the Bay Delta Office (BDO), Operations & Maintenance (O&M), and

19
Operations Control Office (OCO), monitoring data from the Delta and California Aqueduct are
used to further develop the “early warning” system that provides advance notice to Delta water
users of possible drinking water quality problems.
The MWQI Program provides this information to the MWQI SPC so that they may better
manage source water quality conditions. Monitoring data are collected through two different
monitoring strategies, 1) discrete grab samples, and 2) continuous real-time monitoring via
remotely located instrumentation. This section focuses on discrete or ‘grab sample’ monitoring
for FY 14-15. Section 6.1 focuses on continuous, remote real-time monitoring.
Outside of routine discrete monitoring, additional costs were to be incurred in FY 13-14 to
purchase two new vehicles. The two MWQI mobile laboratory vans have reached the end of
their useful life, and their replacements should be received in FY 14-15. The intent was for one
van to be purchased in FY 13-14 and one in FY 14-15, but due to the State purchasing process,
MWQI will be receiving both vans in FY 14-15. The initial estimate described in last year’s work
plan was $90,000 per van. Since retrofitting is no longer planned, the vans’ actual cost will be
reduced to closer to $30,000 per van. The plan is for the charges to be applied to the FY 13-14
and not impact the budget of the FY 14-15 work plan. These vehicles, and all work and
equipment described in this section will be charged to Water Quality Assessment, IO#
VWQASSMENT13.
Discrete monitoring in the FY 14-15 work plan is similar to the FY 13-14 work plan. The only
difference from FY 13-14 is the addition of 3 sites, one of which was added mid-FY 13-14.
These changes bring the total number of MWQI monitoring locations to 28. Twelve of these
sites are part of the MWQI Program’s long-term monitoring program with data available for a
number of years. The additional monitoring sites are associated with short-term modeling
support and other approved special studies.
Table 2 lists all of the monitoring sites planned for FY 14-15. Figure 1 is a map of the discrete
and real-time sampling sites. Table 3 lists projects and expected delivery dates of data
associated with each location.

20
5.1. Routine Monitoring Program
IO# – VWQASSESSMENT13, Funds Budgeted – $77,944, Hours Budgeted - 752
The collection at long-term monitoring sites remains mostly unchanged from FY 13-14; the
exception being the slight relocation of the Rock Slough monitoring site at the Contra Costa
Water District’s fish screen facility. In March 2014, the site was moved from the canal bridge
behind the fish screen to the actual fish screen location on Rock Slough. This is less than 500
feet from the canal bridge location.
As part of real-time instrument quality control, discrete samples are collected bi-weekly at the
Banks Pumping Plant, Jones Pumping Plant, Gianelli Pumping Plant, and Hood and Vernalis
river stations. These river and canal samples are collected to examine instrument performance,
but since they are collected from the appropriate location in the waterways, they are also
representative discrete samples. Discrete sample data are available through the DWR’s Water
Data Library (WDL).
Deliverables and timelines associated with discrete sample collection are shown in Table 3.
5.2. Short-term Monitoring
IO# – VWQASSESSMENT13, Funds Budgeted – $230,928, Hours Budgeted - 1824
Aside from MWQI’s routine monitoring program, other samples are collected for what is termed
“short-term monitoring” activities. These activities only involve monitoring and do not have an
associated report due from MWQI staff. Therefore, short-term monitoring is listed here in
Element 5 along with the routine monitoring. Monitoring activities tied to special studies are
covered in work plan Element 7. In FY 14-15, one short-term monitoring project will be added,
two will continue, and one will be dropped.
MWQI will be removing the reference to last year’s Eastside WARMF/Yolo DSM2 study, but
monitoring at the sites associated with this short-term monitoring effort will continue under the
DSM2 Nutrient Study (Sec. 5.2.1). Eastside WARMF/Yolo DSM2 monitoring was initiated in
2010 to help improve both WARMF and DSM2 model response. Sampling was conducted
monthly and during storm events. The study was to run through October 2013 with the
possibility of it continuing an additional 1-2 years. Because of the overlap with DSM2 Nutrient
Study, this project has been removed from the FY 14-15 work plan.

21
The continuing and new short-term monitoring projects are described below.
Table 2 lists all of the monitoring sites planned for FY 14-15. Figure 1 is a map of the discrete
and real-time sampling sites. Table 3 lists projects and expected delivery dates of data
associated with each location.
5.2.1 DSM2 Nutrient Study
A Delta Simulation Model 2 (DSM2) nutrient modeling study was put forward by the MWQI SPC
for inclusion in MWQI’s FY 13-14 work plan and is being continued for the FY 14-15 work plan.
The goal of this monitoring is to define water quality conditions at key DSM2 nodes located
throughout the Delta region so that the DSM2 nutrient model can be improved. Weekly data
were requested last year, but the MWQI’s resources do not allow for sampling at that frequency.
To meet the data needs, MWQI Program staff will sample the DSM2 nodes twice a month.
Monitoring for the DSM2 nutrient model will continue for an additional year, through the end of
the FY 14-15 work plan. At that time, the need for continued monitoring will be assessed.
Project management documentation of this study can be found in Appendix 2. A separate
monitoring plan document is in the process of being completed, and describes the details
behind this study.
5.2.2 Cache/Yolo Complex Pre-Restoration Baseline Monitoring
In the coming years, numerous ecologically driven restoration projects are planned to be
constructed in the Cache Slough Complex. The Cache Slough Complex includes the Yolo
Bypass, Liberty Island, Sacramento Deep Water Ship Channel and other north-west Delta
tributaries that drain into the Cache Slough system, a tributary of the Sacramento River near Rio
Vista. Planned restoration projects are of various sizes but cumulatively could total over 8000
acres. These planned habitat restoration activities will have unknown impacts to in-stream
drinking water quality; therefore, they may result in additional costs to drinking water
municipalities treating thru-Delta water. Currently, other DWR groups and sister agencies are
beginning to initiate baseline monitoring efforts as required by the Fish Restoration Program
Agreement (FRPA). FRPA is an agreement between DWR and the Department of Fish and
Wildlife to implement habitat restoration actions for listed fish species under the Biological
Opinions and Incidental Take Permit for SWP operations in the Delta. The proposed FRPA
monitoring program is still in the initial phase of development and it is unclear if drinking water

22
quality concerns will be covered by the FRPA monitoring plan and when monitoring might
commence.
Due to the uncertainty regarding FRPA monitoring, and with the backing of the MWQI SPC, the
MWQI Program will conduct a two-phased approach to help define baseline, pre-restoration
water quality in the Cache Slough Complex. Phase 1 involves working with FRPA to make sure
that drinking water quality monitoring concerns are addressed in future FRPA monitoring. If this
is successful, the MWQI Program may be able to step-back from its monitoring responsibilities
tied to Phase 2 of this study. Phase 2 is the MWQI Program staff leading field monitoring of key
locations in the Cache Slough Complex. Both phases will run concurrently. A separate
monitoring plan has been completed which describes the details of this study.
5.2.3 Pathogen Special Study Monitoring
MWQI will collaborate with the Drinking Water Policy Work Group and possibly, the Delta
Regional Monitoring Program to conduct a special study on pathogens and indicator organisms
in the Delta. The monitoring will be conducted at the same time that the drinking water agencies
conduct the next round of monitoring to comply with the Long Term 2 Enhanced Surface Water
Treatment Rule (LT2ESWTR). That monitoring is scheduled to begin in April 2015 and will end
in March 2017. The Drinking Water Policy Work Group is currently working on a proposed
monitoring plan that will be submitted to the Delta Regional Monitoring Program. MWQI’s role
will be to collect the pathogen samples and ship them to the laboratory for analysis. The number
of monitoring locations has not been determined but it will likely be six to ten of the existing
MWQI monitoring locations.

23
Table 2. MWQI Discrete Grab Sampling Stations.
# Stations WDL Stations
(ID) Analytes Collected Frequency Study
1
Natomas East Main Drainage Canal
NATOMAS EMDC A EL CAMINO RD (A0V83671280)
Std. Mineral, nutrients, TOC, DOC, UVA, turbidity, bromide, metals
Monthly Routine
2
American River at E.A. Fairbairn WTP Intake
American River at W.T.P. (A0714010)
Std. Mineral, nutrients, TOC, DOC, UVA, turbidity, bromide
Monthly Routine
3
Sacramento River at West Sacramento WTP Intake
Sacramento River at W. Sac Intake Structure (A0210451)
Std. Mineral, nutrients, TOC, DOC, UVA, turbidity, and bromide, metals
Monthly
Routine
4
Sacramento River at Hood
Sacramento R A Hood (B9D82211312)
Std. Mineral, nutrients, TOC, DOC, UVA, turbidity, bromide, Mn
Once every two weeks
Routine
5
Sacramento River at Mallard Island
Sacramento River @ Mallard Island (E0B80261551)
Std. Mineral, nutrients, TOC, DOC, UVA, turbidity, bromide, CBOD, BOD
Once every two weeks1
Routine, DSM2 Nutrient
6
San Joaquin River near Vernalis
San Joaquin R. nr. Vernalis
(B0702000)
Std. Mineral, nutrients, TOC, DOC, UVA, turbidity, bromide, Mn, CBOD, BOD
Once every two weeks
Routine, DSM2 Nutrient
7
Old River at Bacon Island
Old River at Bacon Island (B9D75811344)
Std. Mineral, nutrients, TOC, DOC, UVA, turbidity, bromide
Monthly
Routine
8
Old River at Station 9
Old R. nr. Bryon (St 9) (NEAR HWY 4 BRIDGE)
(B9D75351342)
Std. Mineral, nutrients, TOC, DOC, UVA, turbidity, bromide, Mn
Monthly
Routine
9
Banks Pumping Plant at Headworks
Delta P.P. Headworks at H.O. Banks PP
(KA000331)
Anions, TOC, DOC (MWQI);
Std. Mineral, turbidity, UVA, TOC, DOC, bromide, total phosphorous, total suspended solids, phytoplankton, purgeable organics, taste and odor (MIB & geosim), asbestos, and radiological, pesticides and herbicides(O&M)
Depending on analyte, Bi-weekly (MWQI), Monthly (O&M), or
Quarterly (O&M)
Routine
10
Contra Costa Canal @ Rock Slough
Contra Cost Canal @ Rock Slough Fish Screen
(B9C75861385)
Std. Mineral, nutrients, TOC, DOC, UVA, turbidity, and bromide
Monthly Routine
11
Middle River @ Union Point
Middle River A Union Point
Std. Mineral, Turbidity, UVA, TOC, DOC, Bromide, nutrients, Mn
Monthly Routine

24
# Stations WDL Stations
(ID) Analytes Collected Frequency Study
(B9D75351292)
12 Jones Pumping Plant at DMC
Eastside Delta Mendota Canal intake at Jones PP
(B9C74781351)
Anions, TOC, DOC
Once every two weeks
Routine
13
Gianelli Pumping/Generating Plant
Gianelli WQ Station near Pumping Plant
(ON003050)
Anions, TOC, DOC Once every two weeks
Routine
14
Colusa Ag Drain near. Sacramento River
Ag Drain on Colusa Basin Main Drain
(A0294500)
Std. Mineral, nutrients, TOC, DOC, UVA, turbidity, bromide, Suspended Solids
Monthly &
Rice Drainage events
Routine
15
Shag Sl. @ Liberty Island
(Yolo Bypass West Toe Drain)
ShagSl@LibIslBr
(B9S81841416)
Std. Mineral and nutrients, TOC, DOC, UVA, suspended solids, chlorophyll, CBOD, BOD, THMFP, HAAFP
Biweekly Cache Slough Complex; DSM2 Nutrient
16
Mokelumne River @ Benson’s Ferry
Benson’s Ferry
(B9D81371295)
Std. Mineral, nutrients, TOC, DOC, UVA, turbidity, bromide, suspended solids, chlorophyll, CBOD, BOD
Biweekly DSM2 Nutrient
17 Calaveras River @ UOP Footbridge
Calaveras R @ UOP
(B9D75851208)
Std. Mineral and nutrients, TOC, DOC, UVA, suspended solids, chlorophyll, CBOD, BOD
Biweekly DSM2 Nutrient
18 Sacramento River @ Westin Boat Dock
SacR. @ Westin BtDoc
(B9D832212010)
Std. Mineral and nutrients, TOC, DOC, UVA, suspended solids, chlorophyll, CBOD, BOD
Biweekly DSM2 Nutrient
19 Southern tip of Liberty Island
S. Liberty Is.
(B9D81461410)
Std. Mineral and nutrients, TOC, DOC, UVA, suspended solids, chlorophyll, THMFP, HAAFP
Biweekly Cache Slough Complex
20 Cache Slough nr Ryer Island
(Lower Cache Slough)
Cache Sl nr. Ryer Is
(B9D81281401)
Std. Mineral and nutrients, TOC, DOC, UVA, suspended solids, chlorophyll, THMFP, HAAFP
Biweekly Cache Slough Complex
21 Miner Slough above Prospect
Miner Sl @ Hwy84 Br
(B9D81751379)
Std. Mineral and nutrients, TOC, DOC, UVA, suspended solids, chlorophyll, THMFP, HAAFP
Biweekly Cache Slough Complex
22 Miner Slough below Prospect (but above
Miner Sl below P
(B9D814103910)
Std. Mineral and nutrients, TOC, DOC, UVA, suspended
Biweekly Cache Slough Complex

25
# Stations WDL Stations
(ID) Analytes Collected Frequency Study
confluence with Cache Slough)
solids, chlorophyll, THMFP, HAAFP
23 Lisbon Weir (Yolo Bypass East Toe Drain)
YOLOBYLISBON
(B9D82851352)
Std. Mineral and nutrients, TOC, DOC, UVA, suspended solids, chlorophyll, THMFP, HAAFP
Biweekly Cache Slough Complex
24 Sacramento Shipping Channel above Prospect Island
SDWC
(B9D81621397)
Std. Mineral and nutrients, TOC, DOC, UVA, suspended solids, chlorophyll, THMFP, HAAFP
Biweekly Cache Slough Complex
25 Upper Cache Slough (below Ulatis Creek)
Upper Cache Sl
(B9S81841416)
Std. Mineral and nutrients, TOC, DOC, UVA, suspended solids, chlorophyll, THMFP, HAAFP
Biweekly Cache Slough Complex
26 Lindsey Slough at Hastings Island Bridge
Lindsey Sl. at Bridge
(B9D81481421)
Std. Mineral and nutrients, TOC, DOC, UVA, suspended solids, chlorophyll, THMFP, HAAFP
Biweekly Cache Slough Complex
27 Wildlands Restoration outfall at Stair-step
Wildlands
B9D82011403
Std. Mineral and nutrients, TOC, DOC, UVA, suspended solids, chlorophyll, THMFP, HAAFP
Biweekly Cache Slough Complex
28 Liberty Cut at Stair-step
LibertyCut@StrairStep
B9D82011400
Std. Mineral and nutrients, TOC, DOC, UVA, suspended solids, chlorophyll, THMFP, HAAFP
Biweekly Cache Slough Complex
1 Mallard Island is a monthly routine monitoring location, but for the DSM2 Nutrient study
samples will be collected every two weeks.
Physical Parameters collected at all sites: Temperature, pH, Turbidity, Dissolved Oxygen,
and Specific Conductance
Standard Mineral analysis includes: Ca, Mg, Na, K, B, Alkalinity, Chloride, Bromide,
Nitrate, Sulfate, Dissolved Solids, Specific Conductance
Standard Nutrient analysis includes: Nitrate + Nitrite, Ammonia, Organic Nitrogen and
Ammonia, Total Phosphorus (unfiltered), and orthophosphorus

26

27
Table 3. Routine and Special Study Discrete Grab Sample Deliverables and Timelines
Deliverable Participants Start Date Estimated Completion
Date
Records of monthly and bi-weekly monitoring data.
MWQI N/A Currently available upon request
Records of periodic calibration of
field monitoring equipment
MWQI N/A Currently available upon request
Records demonstrating
consistent and timely application
of QA/QC procedures
MWQI N/A Currently available upon request
Timely analysis and posting of results to the Water Data Library
MWQI N/A Monthly
Available on-line
Eastside Streams WARMF and Yolo DSM2 Monitoring
MWQI October 2010
Complete
DSM2 Nutrient Monitoring MWQI September 2013
Reassess Feb 2015
Cache Slough Complex, FRPA Engagement
MWQI June 2013 Reassess Feb 2015
Cache Slough Complex Monitoring
MWQI September 2013
Reassess Feb 2015
N/A = not applicable or available
6. REAL-TIME DATA AND FORECASTING
COMPREHENSIVE PROGRAM
The RTDF-CP focuses on providing a single location that compiles and disseminates real-time
drinking water quality data gathered across agencies to enable water managers to make
operating decisions based on observed and forecasted changes in water quality. The RTDF-CP
includes a network of real-time water quality monitoring stations and a modeling component
intended to allow greater predictive ability of water quality in real-time and the future.
The RTDF-CP crosses organizational boundaries within DWR and gathers data from other
agencies to obtain valuable information. Historically, the geographic scope of the MWQI
Program was confined to the Delta. However, the scope of real-time monitoring and forecasting
encompasses not only the watersheds of the Delta, but also the SWP, and portions of the
28
federal Central Valley Project that are interconnected to the Delta and SWP. As a result, this
element includes MWQP funded positions within DWR’s Bay Delta Office (BDO), the Operations
Control Office (OCO), and the Division of Operations and Maintenance, Water Quality Section
(O&M WQ) as well as a contract with the SLDMWA.
The RTDF-CP Consists of Three Principle Activities:
1. Remote instrumentation that provides real-time water quality data
2. Modeling to provide water quality forecasting
3. Information management and dissemination of real-time data to interested parties
Emergency response is also part of the RTDF-CP, but is treated separately in this work plan.
Real-time monitoring, forecasting and data dissemination activities are guided by the RTDF
Steering Committee, a group of technical experts composed of MWQI Program staff, Contra
Costa Water District and participating MWQI SPC agencies. The RTDF Steering Committee
reports to the MWQI TAC.
6.1. RTDF-CP Real-Time Monitoring
Real-time water quality data are used to:
a) Make informed operational decisions affecting the Delta and SWP.
b) Support the development of water quality forecasting tools for better management of
SWP water supplies.
c) Provide early warning of changing water quality conditions for users downstream.
d) Provide information for water quality and water supply planning studies.
In addition to DWR and the MWQI SPC, this information is used by many federal, state, and
local agencies, non-governmental organizations, and the public.
This program element is comprised of:
a) Instrumentation installed at key remote locations.

29
b) Field operations which ensure proper operation and maintenance of all automated
sampling equipment.
c) The timely transmission of real-time data.
d) The documentation of Standard Operating Procedures.
e) The implementation and documentation of data QA/QC.
6.1.1 MWQI Real Time Stations
IO# – VRTMONITOR13, Funds Budgeted – $302,992, Hours Budgeted - 2336
(Note: Field Support Section staff will continue to charge to the specific RTDF charge number
(VRTMONITOR13). Field office labor associated with real-time monitoring (RTM) includes:
ordering RTM supplies; phone consultation with instrument manufacturers; creation of RTM QC
sampling runs; creation of instrument specific chemical standards, solutions, and reagents; in-
office repairs to station peripheral components such as pumps, compressors, etc., cleaning of
equipment used on RTM runs; data entry and analysis of RTM QC data; and working on
instruments remotely via Remote Desktop and data logger telemetry programs. Commodity and
service charges will also continue to be charged to the RTDF Charge number.
Table 4 summarizes station locations, water quality parameters, and automated analyzer
equipment used by the MWQI Program’s RTM. Figure 1 shows the location of the RTM
stations.
Currently, there are four MWQI Program remote real-time stations located in the Delta and one
south of the Delta (Table 4). The Delta stations include Hood located on the Sacramento River
near the town of Hood, Banks Pumping Plant located at the head of the California Aqueduct,
Jones Pumping Plant located at the head of the Federal Central Valley Project (CVP) Delta-
Mendota Canal and Vernalis located on the San Joaquin River near the town of Vernalis. The
southern station, Gianelli, is located within the O&M San Luis Field Division on O’Neill Forebay
below San Luis Reservoir. Gianelli is funded separately from the other stations as the work is
funded through an Environmental Scientist position which is part of a resource agreement with
O&M. In addition station expenses are tracked independently to better control costs.
In the past year, a new sample flow manifold system was installed at Hood and Vernalis. These
manifolds cut down on the amount of sample water needed for organic carbon analysis. This in
turn decreases staff travel time used for station visits, and consumables used by the analyzers

30
making it less expensive to operate the instrument. In the near future, three more of these
systems will be installed at Banks, Jones and Gianelli making the field aspect of the RTDF more
efficient and cost effective.
One of the deliverables in the FY 13-14 work plan focused on creating a Quality Controlled
(QC’d) real-time data set for station online data. This deliverable was completed in December of
2013. Interested parties now have the ability to look up real-time data that has gone through a
screening process (document to be completed by June 2014) using the WDL. The WDL is the
preferred storage location due to its ability to query results as the user’s needs dictate, and the
general understanding that data within the WDL have been QC’d.

31
6.1.2 Gianelli WQ Station
IO# – VGIANNELLI13, Funds Budgeted – $115,808, Hours Budgeted - 1064
In order to more closely track time and expenditures related to the Gianelli water quality station,
a separate IO was created (VGIANNELLI13). The funding for this station goes largely toward
the salary for an Environmental Scientist position held within O&M Water Quality.
Table 4. MWQP Real-Time station locations, parameters, and equipment
MWQP Station/CDEC Station
MWQI Program Parameters & Instruments
Non-MWQI Program Parameters
Sacramento River at Hood (CDEC = SRH)
TOC, DOC (Sievers 900-oxidation)
Water: chlorophyll, EC, DO, pH, temperature and
turbidity.
Atmospheric: solar radiation, temperature, wind speed
and direction.
San Joaquin River near Vernalis (CDEC = SJR)
TOC, DOC ( Sievers 5310-oxidation) bromide,
chloride, nitrate, sulfate, (Dionex ICS-2100)
Water: chlorophyll, DO, EC, pH, river flow and stage,
temperature and turbidity.
Delta P.P. Headworks
(CDEC = HRO)
TOC, DOC ( Sievers 5310-oxidation), bromide,
chloride, nitrate, sulfate, (Dionex ICS-2100)
Water: EC, fluorescence, pH, pump discharge,
temperature, turbidity, UVA 254.
Atmospheric: temperature, wind speed and direction.
Jones Pumping Plan (CDEC = TRP)
TOC, DOC, ( Sievers 5310-oxidation), bromide,
chloride, nitrate, sulfate, (Dionex ICS-2100)
Water: EC, pump discharge, temperature.
Gianelli P/G Plant (CDEC = ONG)
TOC, DOC (Sievers 5310), EC, temp, turbidity, DO, pH
(YSI 6600) bromide, chloride, nitrate, sulfate
(Metrohm IC 850)
N/A
N/A = not applicable or available
The RTDF-CP will continue to monitor water quality using in-situ instrumentation providing
current, real time, water quality information.
Table 5 summarizes the deliverables and timelines associated with real-time monitoring.

32
Table 5. Real-Time Monitoring Deliverables and Timelines
(Lead organization(s) are shown in bold)
Deliverable Participants Estimated Start
Date Estimated
Completion Date
Continue operation of automated stations at Hood, Banks, Jones, Vernalis, and
Gianelli
MWQI Program, O&M Water
Quality Ongoing Ongoing
A) Update SOPs: documenting maintenance, operation and
quality assurance/quality control of all in-situ equipment.
B) Continue to work towards standardizing, streamlining, and consolidating DWR’s in-situ equipment, data quality
control, and data dissemination.
MWQI Program
O&M Water Quality
MWQI Program
O&M Water Quality
NCRO
IEP
July 2013
N/A
A) TBD
B) Ongoing
Evaluate the need, and planning for, other installations
per the RTDF-CP (together with RTDF Steering
Committee).
RTDF SC
MWQI TAC
July 2008 Ongoing
Provide readily accessible data and fill in TDS/EC data gaps on
pump-in activities.
TDS data is posted in WDL
Check 13 = KA007089
Check 21 = KA017226
Check 23 = KA019705
Check 29 = KA024454
Check 39 = KA029021
Semitropic 2 = GKA02098
Semitropic 3 = GKA02070
CVC = GKA02380
Kern Water Bank Canal = GKA02382
O&M WQ July 2008 Ongoing

33
Deliverable Participants Estimated Start
Date Estimated
Completion Date
Arvin Edison Canal = GKA02773.
N/A = not applicable or available
6.2. RTDF-CP Water Quality Forecasting
IO# – VRTBDOMODL13, Funds Budgeted – $224,536, Hours Budgeted - 1768
IO# – VRTOCOMODL13, Funds Budgeted – $224,536, Hours Budgeted - 1768
IO# – VTRENDSAMR13, Funds Budgeted – $10,088, Hours Budgeted - 104
The modeling/forecasting component of the RTDF-CP continues to update and make
improvements to existing models to further develop their capabilities. These include the WARMF
tributary watershed models and DSM2 Delta and Aqueduct Extension models. The MWQP
continues to collaborate with the OCO and the BDO to accomplish these forecasting tasks. The
objective of this effort is to better incorporate forecast modeling insight with water quality
monitoring and maximize the use of modeling results by water quality managers.
In FY 12-13 BDO completed WARMF model calibration. The model can now be used for DOC
forecasts in the Sacramento and San Joaquin rivers. Another FY 12-13 goal was to produce
weekly DOC forecasts for the Delta and the California Aqueduct. This goal has been achieved.
The weekly report, sent out each Monday, now includes the DOC forecasts.
During the previous fiscal year, the MWQP focused on the Historical and Short-term forecasts
and on tasks associated with Seasonal Forecasts. During FY 14-15, the modeling sub-group of
the RTDF Steering Committee suggested potential new areas of model development which
would provide new information that could be helpful to interested parties and would also improve
modeling capabilities.
The modeling sub-group of the RTDF Steering Committee will continue to work on the
implementation of these ideas. The new task list will be used to coordinate all of the modeling
products and will be updated each month to track work completed by the BDO and OCO. In
addition, the new task list will continue to be reviewed and discussed at the monthly RTDF
Steering Committee meetings.

34
In late 2013, the RTDF Steering Committee decided that due to the completion of many of the
modeling tasks, the Gantt chart, previously used to monitor the progress of the modeling tasks,
would no longer be needed. For FY 14-15, the RTDF Steering Committee will adopt an Excel
based spreadsheet to monitor future modeling activities; similar to the one currently used for
BDO project monitoring. There are two PYs devoted to modeling activities; one in BDO and one
in OCO. In addition, MWQI staff provides support for some of the modeling tasks.
6.2.1. Continuous Refinement of Current Models
Lead Investigator – Bryant Giorgi and Siqing Liu
The models and the data that are used in the models are continuously updated and refined by
the BDO and OCO modelers. This is considered to be a routine ongoing task.
A potential new project was identified by the modeling sub-group to improve forecasting
capability for Delta consumptive use. Examples of possible improvements include preparing up-
to-date Delta land use surveys each year, installing flow gauges at key Delta locations and
improving Delta precipitation data available from the existing station or adding new precipitation
stations. This project needs further refinement by the modeling sub-group.
6.2.2. Improve How Aqueduct Pump-ins are Handled in MWQI Water Quality
Forecasts
Lead Investigator – Bryant Giorgi
Project Partner –Tony Liudzius
Short-Term Forecasts
Interested SWP urban contractors and MWQI staff will investigate if data for planned or
scheduled aqueduct pump-ins for the near term (defined here as less than 2 months) are
available and the feasibility of obtaining this information on an ongoing basis. The goal of this
effort is to include more accurate, up-to-date pump-in information in the MWQI short-term water
quality forecasts.
If improved pump-in information is available, this effort will include establishing procedures for
acquiring the information on an ongoing basis. Also, if any support tools are needed to help
automate and process pump-in forecasts for inclusion in the water quality forecasts they will be
developed under this project.

35
Seasonal Forecasts
This task is the same as described above for the short-term forecasts, except that the desired
scheduled or planned pump-in information will be for the current year (or slightly longer) to
conform with the timeframe used in the Seasonal water quality forecasts.
6.2.3. Assessment, Collection, and Archiving of Aqueduct Pump-in Data
Lead Investigator – TBD – MWQI Staff Person
Project Partner – Tony Liudzius
This project consists of identifying and cataloging all known sources of actual aqueduct pump-in
data (both flows and water quality). If it is determined this information is useful to the MWQI
Program or in producing water quality forecasts, this task will include data gathering and storing
the information on an appropriate database or archive which will be available to appropriate
parties.
6.2.4. Compare Water Quality Forecast to Actual Conditions
Lead Investigator – Bryant Giorgi
Project Partner – Elaine Archibald
This project consists of a study/investigation comparing forecast water quality from the MWQI
models with actual water quality conditions over a specified study period to gain a better
understanding of how the models work. The structure, goals, and deliverables of this study and
the specific period to be examined will be established by the study work group. One possibility is
to examine the first three to four months of 2014 when water quality conditions declined due to
the drought and some Contractors were surprised at the concentrations of bromide and organic
carbon in water pumped from the Delta.

36
6.2.5. Improving the DSM2 Nutrient Model
Lead Investigator – Hari Rajbandhari
Project Partner – Elaine Archibald
Hari Rajbhandari (DWR BDO) developed the capability to simulate nutrient dynamics and
primary production in DSM2 QUAL in 1995. RMA refined the model under contract to MWDSC
in 2009. Since that time, additional data have been collected by MWQI and others that can be
used to refine the model. The first step in this project will be to determine the questions that
need to be asked to better understand nutrient dynamics in the Delta. Once the questions are
identified, the next step will be to determine which models are needed to answer the questions
and what data are needed to refine or calibrate the models. The DSM2 Nutrient Model may be
sufficient to answer some questions; however, a more sophisticated nutrient model may be
needed to answer other questions.
6.2.6. Adding Additional Wastewater Treatment Plants to the Fingerprint
Lead Investigator – Siqing Liu and MWQI Staff Person
Project Partner – Elaine Archibald
The Delta Modeling Section of BDO has developed a fingerprint model that shows the percent
of treated wastewater at various locations in the Delta and the contributions of EC and DOC
from these wastewater treatment plants. It currently includes the Sacramento Regional
Wastewater Treatment Plant, the Stockton Regional Wastewater Control Facility and the
Manteca-Lathrop Wastewater Control Facility. There are nine other wastewater treatment plants
that discharge to the Delta. The goal of this project is to add as many additional Delta
wastewater treatment plants as possible to the fingerprint model, based on the availability of
effluent flow, EC, and DOC data.
In FY 13-14, MWQI staff conducted a search of the CIWQS database for wastewater treatment
effluent data. That information will be updated through the end of 2013 and earlier data will be
obtained from files at the Central Valley Regional Water Board. These data will be provided to
BDO so that the fingerprint model can be updated through 2013.

37
6.2.7. Potential Planning Studies
Lead Investigator – TBD
Project Partner – TBD
The RTDF Steering Committee will investigate the need to conduct planning studies based on
project operations under assumed hydrologies, water demands, institutional constraints, and
project operation goals. Using different scenarios, planning studies would be a great tool for
determining potential drought related issues.
Table 6. Example of New Task List
6.3. RTDF-CP Information Management and Data Dissemination
IO# – VRTDDISRPT13, Funds Budgeted – $122,608, Hours Budgeted - 1264
This program element includes the information management and data dissemination tasks
associated with the RTDF real time stations and the synthesis of real-time data from a variety of
federal, State and local agency water quality monitoring programs. The RTDF-CP provides rapid
data quality control, analysis, and dissemination of results to all interested parties. QC’d RTDF
real time data, are stored in the California Water Data Library (WDL) (http://wdl.water.ca.gov/)
and on an MWQP server and posted to DWR’s California Data Exchange Center (CDEC)
(http://cdec.water.ca.gov/). Daily and weekly summary emails containing a variety of information
including real time data, modeling results, Delta commentary, weather updates, hydrological
conditions, and other information that is of interest to the MWQI SPC and other users are sent
out and posted to the RTDF-CP web
site:(http://water.ca.gov/waterquality/drinkingwater/rtdf_rprt.cfm).
Task #
Partner
Model Headline Task Start Projected
Finish %
Complete
1 OCO Aqueduct Extension
Add/Refine pump-ins
New Pump-in addition
July
2014
September 2014
25%
2 BDO HEC-RAS
WARMF Replacement
Trial HEC-RAS model
run
July
2014
December 2014
25%

38
Information management and dissemination tasks have the goal of enabling real-time analytical
data and modeled forecasting data to be presented in user-friendly information products. Tasks
under this program element include:
a) Continued refinement of the WDL data set (i.e. fully accessible historical MWQI
Program data, and repository for current O&M Water Quality and MWQI Program water
quality data).
b) Continued database management refinement.
c) Continued development and enhancement of online tools for editing, evaluating and
interpreting MWQI Program water quality data (QA/QC and scientific visualization).
d) Improving means to distribute daily and weekly water quality reports via the internet.
e) Improving database development for storage and management of real-time data.
The MWQI Program has developed, and continues to improve in-house software used for data
QC and display. The Field Unit’s maintenance and calibration records and field journal entries
have been integrated into this tool enabling all MWQI staff to evaluate real-time data. Staff also
continues to make improvements to the MWQI Program Management application, website and
database. This application produces the MWQI Program monthly status report for review at
TAC meetings.
Tasks and deadlines for the data dissemination portion of the RTDF program are shown below
in Table 7.
Table 7. Information Management and Data Dissemination Deliverables and Timelines
(Lead organization(s) is (are) shown in bold)
Task Participants Estimated Start
Date Estimated
Completion Date
Improve/Upgrade database infrastructure. This task includes:
A) Continue to implement updates and patches as appropriate.
MWQI Program
A) January 2009
B) January 2009
A) Ongoing
B) Ongoing

39
Task Participants Estimated Start
Date Estimated
Completion Date
B) Continue enhancement of manual and automated QA/QC processes to the database.
Initial screening tools have been completed. Continued evaluation is needed to eliminate questionable data. Work on capability to test and apply to historic data.
C) Continue to develop the station journal database and applications, including the creation of intranet browsing tools.
D) Continue to develop desktop data management tools. Enhance plotting capabilities. Link time series and QA/QC.
E) Continue to document and maintain infrastructure.
F) Add new sensors to the database as needed
C) January 2010
D) January 2010
E) July 2009
F) January 2010
C) Ongoing
D) Ongoing
E) Ongoing
F) Ongoing
Improve Field Data Communications. This task includes:
A) Continue to develop, test and enhance intranet/ internet components.
B) Develop and implement as feasible procedures,
MWQI Program
A) January 2011
B) July 2011
A) Ongoing
B) Ongoing

40
Task Participants Estimated Start
Date Estimated
Completion Date
practices and standards for supporting the reliability of field system data systems.
Provide timely access to current QA/QC’d SWP operations data i.e. conduct QA/QC on historical data and remove inconsistencies and gaps.
OCO/Office of Reconciliations
N/A Ongoing
Development and enhancement of RTDF data dissemination products,
A) As needed, add new stations & sensors to the website or daily summary table.
B) * As needed, enhance the website presentation.
C) Enhance procedures for emailing the daily summary report.
MWQI Program
A) N/A
B) N/A C) N/A
A) Ongoing as needed
B) * Ongoing as needed
C) Ongoing as needed
N/A = not applicable or available
* The RTDF web page is currently being reviewed for updating. This should take place over the
next few months pending review and approval of the RTDF Steering Committee.

41
7. SCIENCE SUPPORT (SPECIAL STUDIES)
The Special Studies described in this MWQI Program FY 14-15 work plan have been identified
by the MWQI Program in consultation with the MWQI SPC as valuable contributions to
improving drinking water quality through improved understanding of processes affecting source
waters, storage, and conveyance. Some studies from the FY 13-14 work plan are ongoing and
updated summaries of these studies are discussed below, along with summaries of proposed
new special study work.
7.1. Limnology of the SWP
MWQI SPC Project Manager – Rich Losee
Lead Investigators – Mark Bettencourt, Ted Swift, Marcia Scavone-Tansey & Jason Moore
IO# – VLIMNOLOGY13, Funds Budgeted – $188,568, Hours Budgeted - 1944
This project was originally conceived, in the FY 13-14 Work Plan, as a long-term limnological
and ecological study of the State Water Project. It has evolved to more directly address the
Contractors specific issues and concerns with the goal of demonstrably improving the
management of the SWP, particularly with regard to drinking water quality, through the
application of limnological and ecological principles. The SWP Contractors have identified an
extensive list of problems, issues and concerns associated with drinking water quality of the
SWP. These issues range from the occurrence of objectionable levels of algal produced taste
and odor compounds, to indirect impacts on drinking water quality through the obstruction of
Contractor aqueduct turnouts by aquatic plant material. Improved management of these
problems will be achieved by gaining an understanding of the limnology and ecology of the
organisms involved and applying this knowledge to develop optimal control and treatment
strategies. This is an ambitious multi-year program; to be successful it will require cooperation
and collaboration across Divisions within DWR, including O&M Water Quality, OCO, and the
Field Divisions, as well as the MWQI SPC, consultants and academics. An important function
the MWQI staff will perform is the coordination of the efforts of the participating entities.
The various water quality problems and issues are often related by a common parameter that
causes or exacerbates the problem. For example, Delta water has eutrophic to hypereutrophic
nutrient levels that support the excessive growth of filter clogging algae on the South Bay

42
Aqueduct, taste and odor producing cyanobacteria throughout the SWP, and submersed
macrophytes in several parts of the system. Therefore, a study of nutrients in the SWP will
contribute to the solution of multiple Contractor problems. The science support studies will be
designed in such a way as to efficiently provide information to be applied to multiple MWQI SPC
member problems. In the Work Plan the support studies are organized as follows: nutrient
related, organism growth and growth rate related, spatial and temporal distribution of the
problem organisms in the aqueduct, photosynthesis driven pH excursions, and reservoir
limnology.
The MWQI SPC has contracted with Rich Losee to serve as the project manager to coordinate
and lead this project.
7.1.1. Nutrient Budget Study
Lead Investigator – Marcia Scavone-Tansey
Project Partners – Rich Losee and Elaine Archibald
IO# – VNTDYNSTDY13, Funds Budgeted – $110,968, Hours Budgeted - 1144
Nutrients play an important role in the proper functioning of aquatic ecosystems. However,
when they are present in excessive concentrations, the algal and aquatic plant growth that
occurs may cause a variety of undesirable effects, such as algal blooms and heavy submersed
macrophyte growth, which can result in elevated organic carbon, reduced dissolved oxygen,
significant taste and odor (T&O) issues, production of toxic algal compounds, high levels of
ammonia and undesirable disinfection byproducts, physical obstruction in conveyance facilities,
obstruction in water treatment filters, and increased costs of water treatment. The goals of this
study are to understand the nutrient sources to the SWP and their fate and transport in the
SWP. Several objectives have been accomplished in the first year of this study including the
assembly of an extensive dataset from which nutrient budget and other analyses will be
performed. In this next phase of the study, the objective is to investigate Delta nutrient sources
as well as turn-in and runoff nutrient input to SWP conveyance and storage facilities by
developing nutrient budgets at the export pumps and selected reaches within the SWP. These
are paper studies that are likely to spawn additional studies to improve our understanding of
specific fate and transport processes in the SWP. The additional studies will be identified after
this phase of the work is completed. A progress report will be completed after the data analysis
has been conducted. A decision will be made at that time as to whether this report will become

43
an official MWQI work product or if the results of this study will be combined with the results
from other studies within the broader Limnology Project.
Table 8. Nutrient Budget Study Deliverables and Timelines
Deliverables Participants Estimated Start
Date
Estimated Completion
Date
Obtain water quality and flow/pumping data for Phase 2 locations
MWQI Program MWQI SPC
April 2014 June 2014
Develop time series graphs for Phase 2 locations
MWQI Program MWQI SPC
July 2014 September 2014
Conduct additional data analysis for Phase 2 locations and prepare Draft Report
MWQI Program & Project
Services Office
September 2015 December 2014
Submit Draft Progress Report to DWR management and MWQI SPC for review
MWQI Program MWQI SPC
December 2014 March 2015
Respond to comments and finalize Progress Report
MWQI Program MWQI SPC
March 2015 April 2015
7.1.2. Nutrient Limitation Study
Lead Investigator – Ted Swift
Project Partner – Rich Losee
IO# – VLIMNUTLIM14, Funds Budgeted – $34,920, Hours Budgeted - 360
The objective of this study is to investigate the theoretical nutrient limitation as it might occur
over space and time in the SWP. This is a paper study using the nutrient data assembled in the
Nutrient Budget Study (Project 7.2.1) and literature information on limiting nutrients for the algal
and macrophyte species that occur in the Delta and aqueducts and lakes of the SWP. The first
step will be to calculate the nutrient ratios at locations of problematic algal or macrophyte growth
in the SWP to determine which nutrients may be limiting during different seasons of the year. A
progress report will be completed after the data analysis has been conducted. A decision will be
made at that time as to whether this report will become an official MWQI work product or if the
results of this study will be combined with the results from other studies within the broader
Limnology Project.

44
The next step will be to explore the feasibility of developing a nutrient status index for key
locations in the SWP. This would be updated after each sampling event when the data are
available from the WDL and reported, possibly in the RTDF update.
Table 9. Nutrient Limitation Study Deliverables and Timelines
Deliverables Participants Estimated Start
Date
Estimated Completion
Date
Conduct literature review of nutrient limitation for Melosira, T&O producing algae and submersed macrophytes.
MWQI Program MWQI SPC
July 2014 July 2014
Examine nutrient ratios MWQI Program MWQI SPC
July 2014 July 2014
Develop nutrient status index MWQI Program MWQI SPC
August 2014 August 2014
Submit Draft Progress Report to DWR management and MWQI SPC for review
MWQI Program MWQI SPC
August 2014 September 2014
Respond to comments and finalize Progress Report
MWQI Program
MWQI SPC
September 2014 September 2014
7.1.3. Nutrient and Nutrient Ratio Influence on Community Species Composition
Lead Investigator – Ted Swift
Project Partner – Rich Losee
IO# – VLIMNRATIO14, Funds Budgeted – $13,968, Hours Budgeted - 144
The primary objective of this literature review is to follow the progress of Irwin van
Nieuenhuyse’s work and the Dick Dugdale group’s work on nutrients and nutrient ratios as they
affect benthic and planktonic algal community composition, respectively. After conducting the
literature review and reviewing the information developed in the Nutrient Budget Study (Project
7.2.1) and the Nutrient Limitation Study (Project 7.2.2), hypotheses of SWP community algal
species composition will be developed. These hypotheses will be tested in future studies of algal
species composition. The work product from this study will be a progress report summarizing
the key findings from the literature review and a list of hypotheses to be tested in the next phase
of work.

45
Table 10. Nutrient and Nutrient Ratio Influence on Community Species Composition Study Deliverables and Timelines
Deliverables Participants Estimated Start
Date
Estimated Completion
Date
Conduct literature review and examine data
MWQI Program MWQI SPC
March 2015 March 2015
Submit Draft Progress Report to DWR management and MWQI SPC for review
MWQI Program MWQI SPC
March 2015 April 2015
Respond to comments and finalize Progress Report
MWQI Program
MWQI SPC
April 2015 April 2015
7.1.4. Light Limitation in the SWP
Lead Investigator – Ted Swift
Project Partner - Rich Losee
IO# – VLIMLIGHTL14, Funds Budgeted – $66,736, Hours Budgeted - 688
The objective of this study will be to determine the amount of light reduction necessary to
sufficiently reduce the growth of algae and submersed macrophytes to control the problems they
cause in the SWP. This study will support the development of strategies and treatments to
control filter clogging diatoms on the SBA, taste and odor producing algae throughout the SWP
and submersed macrophytes in the SWP aqueducts.
The first step in this study is to conduct a literature review of light limitation of filamentous
diatoms (Melosira, specifically if available), benthic cyanobacteria (T&O producers if available)
and submersed macrophytes (particularly of problematic species in the SWP). Note that
Maggie Spoo-Chupka of MWDSC should be used as a primary resource for the T&O producers.
Another task in this study will be to refine the turbidity versus light attenuation regression using
the existing IEP database of turbidity and photic depth. The work product from this study will be
a progress report summarizing the key findings from the literature review and the analysis of the
turbidity and photic depth data. The progress report should address the practicality of using
light reduction to control algal or macrophyte growth.

46
The next step will be to develop a protocol to measure light and light attenuation in the SWP
aqueducts. After the protocol has been developed and reviewed, sensors will be purchased and
tested at locations that will be determined later in this study.
Table 11. Light Limitation in the SWP Study Deliverables and Timelines
Deliverables Participants Estimated Start
Date
Estimated Completion
Date
Conduct literature review and examine data
MWQI Program MWQI SPC
August 2014 September 2014
Submit Draft Progress Report to DWR management and MWQI SPC for review
MWQI Program MWQI SPC
October 2014 October 2014
Respond to comments MWQI Program
MWQI SPC
November 2014 November 2014
Develop light measuring protocol and submit to DWR management and MWQI SPC for review
MWQI Program
MWQI SPC
December 2014 January 2015
Respond to comments and finalize protocol
MWQI Program
MWQI SPC
February 2015 February 2015
Purchase sensors MWQI Program
MWQI SPC
February 2015 March 2015
7.1.5. Algal and Macrophyte Growth Study
Lead Investigator – Ted Swift
Project Partner - Rich Losee
IO# – VLIMAMGROW14, Funds Budgeted – $11,640, Hours Budgeted - 120
The objective of this study will be to develop methods to measure algal and macrophyte growth
rates in the laboratory and in the field. The first step in this study is to conduct a literature
review on the following topics:
Laboratory methods for measuring growth and primary production of algae in culture to
assess the response of species of interest to manipulated parameters affecting growth,
such as light and nutrient levels.

47
Field method to estimate primary production for whole reaches of the aqueduct
Field method to measure photosynthetic rates for small areas of the aqueduct benthic
community where flow/turbulence or light intensity varies. The latter will be used to
assess small scale vertical and horizontal differences in primary productivity.
The work product from this study will be a progress report summarizing the key findings from the
literature review.
Table 12. Algal and Macrophyte Growth Study Deliverables and Timelines
Deliverables Participants Estimated Start
Date
Estimated Completion
Date
Conduct literature review MWQI Program MWQI SPC
February 2015 February 2015
Submit Draft Progress Report to DWR management and MWQI SPC for review
MWQI Program MWQI SPC
February 2015 March 2015
Respond to comments and finalize Progress Report
MWQI Program
MWQI SPC
March 2015 March 2015
7.1.6. Spatial-temporal Distribution of Melosira in the SBA
Lead Investigator – Jason Moore
Project Partner – Rich Losee
IO# – VLIMMELOSI14, Funds Budgeted – $67,512, Hours Budgeted - 696
The objective of this study is to assess the spatial and temporal distribution of filter clogging
diatoms in the SBA. The first phase of this study is to conduct a literature review and develop a
method for sampling Melosira in the SBA to determine its spatial and temporal distribution. The
work product from this study will be a progre696ss report summarizing the key findings from the
literature review. After the method has been developed and reviewed, MWQI staff will
coordinate with O&M Water Quality and with the Delta Field Division to determine the most
efficient way to conduct the field work. A monitoring plan will be developed to assess the
distribution of Melosira biomass in the SBA to help determine a method to more efficiently
manage filter clogging by these algae. Ideally, the monitoring will be conducted during the algal
growth season of June to October, 2014.

48
Table 13. Spatial-temporal Distribution of Melosira in the SBA Study Deliverables and Timelines
Deliverables Participants Estimated Start
Date
Estimated Completion
Date
Conduct literature review and develop sampling method
MWQI Program MWQI SPC
May 2014 May 2014
Submit Draft Progress Report to DWR management and MWQI SPC for review
MWQI Program MWQI SPC
June 2014 June 2014
Respond to comments MWQI Program
MWQI SPC
June 2014 June 2014
Develop monitoring plan and coordinate with O&M
MWQI Program
O&M
MWQI SPC
June 2014 June 2014
Conduct monitoring MWQI Program
O&M
MWQI SPC
July 2014 October 2014
Submit Draft Progress Report to DWR management and MWQI SPC for review
MWQI Program MWQI SPC
November 2014 December 2014
Respond to comments and finalize Progress Report
MWQI Program
MWQI SPC
December 2014 January 2015
7.1.7. Distribution of Macrophytes in the SWP
Lead Investigator – Jason Moore
Project Partner – Rich Losee
IO# – VLIMMACROP14, Funds Budgeted – $58,200, Hours Budgeted - 600
The objective of this study is to assess the macrophyte distribution and abundance, especially in
the Coastal Branch and the San Luis Canal reach of the California Aqueduct and to determine if
it is feasible to control macrophyte growth in the SWP. The Coastal Branch may be the best
location to control macrophytes because of its small size. The first phase of this study is to
conduct a literature review of submersed macrophyte sampling methods. The work product from
this study will be a progress report summarizing the key findings from the literature review. After
the method has been selected, MWQI staff will coordinate with O&M Water Quality and with the

49
San Joaquin Field Division to determine the most efficient way to conduct the field work. A
monitoring plan will be developed prior to field work initiation.
Table 14. Distribution of Macrophytes in the SWP Study Deliverables and Timelines
Deliverables Participants Estimated Start
Date
Estimated Completion
Date
Conduct literature review and develop sampling method
MWQI Program MWQI SPC
August 2014 September 2014
Submit Draft Progress Report to DWR management and MWQI SPC for review
MWQI Program MWQI SPC
September 2014 October 2014
Respond to comments and finalize Progress Report
MWQI Program
MWQI SPC
October 2014 November 2014
Develop monitoring plan and coordinate with O&M for field work in next work plan cycle
MWQI Program
O&M
MWQI SPC
January 2015 February 2015
Macrophyte sampling pilot study
MWQI Program
O&M
MWQI SPC
June 2015 July 2015
7.1.8. Wide Swings in Canal pH Study
Lead Investigator – Jason Moore
Project Partner – Rich Losee
IO# – VLIMPHSTUD14, Funds Budgeted – $51,216, Hours Budgeted - 528
The goal of this effort is to apply limnological principles to decrease the treatment plant
difficulties resulting from photosynthetically driven pH excursions in the SBA. Note that a
solution to this problem will likely also solve the Melosira filter clogging issue. The objectives of
this study are to 1) understand the magnitude of the problematic pH excursion events and the
inorganic carbon chemistry and buffering capacity of the SBA; and 2) to quantify the magnitude
and diurnal dynamics of specific pH excursion events before, during, and after algaecide
treatment. The first step will be to analyze the historical data to identify the magnitude and
frequency and seasonality of pH excursion events, and to understand the inorganic carbon

50
chemistry and buffering capacity during the events. The work product from this phase will be a
progress report that discusses the key findings from the data review. This work will be
conducted by Rich Losee in April 2014.
The next phase will be to conduct monitoring during pH excursion events. This will involve
continuous measurement of pH and oxygen, upstream and downstream of the reach of interest
on the SBA before, during and after treatments to control Melosira. Inorganic carbon and
alkalinity of the water will be monitored to assess the buffering capacity. This phase of the study
will require coordination with O&M Water Quality and the Delta Field Division. Ideally, the
monitoring will be conducted during the algal growth season of June to October, 2014.
Table 15. Wide Swings in Canal pH Study Deliverables and Timelines
Deliverables Participants Estimated Start
Date
Estimated Completion
Date
Analyze historical data MWQI SPC April 15, 2014 Completed
Submit Draft Progress Report to DWR management and MWQI SPC for review
MWQI Program MWQI SPC
May 2014 June 2014
Respond to comments and finalize Progress Report
MWQI Program
MWQI SPC
June 2014 July 2014
Develop monitoring plan and coordinate with O&M
MWQI Program
MWQI SPC
June 2014 July 2014
Conduct pilot monitoring MWQI Program
O&M
MWQI SPC
July 2014 October 2014
Submit Draft Progress Report to DWR management and MWQI SPC for review
MWQI Program MWQI SPC
November 2014 December 2014
Respond to comments MWQI Program
MWQI SPC
December 2014 January 2015

51
7.1.9. San Luis Reservoir Limnology Study
Lead Investigator – TBD
Project Partner - TBD
IO# – VLIMSLRSVR14 Funds Budgeted – $0 – hours 0
This study will involve conducting profiles in San Luis Reservoir to better understand the water
quality implications of drawing the reservoir down.
7.1.10. Dyer Reservoir Limnology Study
Lead Investigator – TBD
Project Partner - TBD
IO# – VLIMDYRSVR14 Funds Budgeted – $0 – hours 0
The water quality impacts of bird roosting and operations of Dyer Reservoir will be investigated
in this study.
7.1.11. Del Valle Reservoir Limnology Study
Lead Investigator – TBD
Project Partner - TBD
IO# – VLIMDLRSVR14 Funds Budgeted – $0 – hours 0
This study will investigate the limnological conditions in Del Valle Reservoir and potential
methods of controlling methyl mercury.
7.2. State Water Project Watershed Sanitary Survey Update
Since 1990, the water agencies treating water from the SWP have been required to conduct a
watershed sanitary survey every five years. This is a requirement based on the California
Surface Water Treatment Rule, and is administered by the California Department of Public
Health (CDPH). In Title 22 of the California Code of Regulations, a sanitary survey is defined as
“a physical and hydrogeological description of the watershed, a summary of source water quality
monitoring data, a description of activities and sources of contamination, a description of any
significant changes that have occurred since the last survey which could affect the quality of the
source water, a description of watershed control and management practices, an evaluation of

52
the system's ability to meet requirements of this chapter, and recommendations for corrective
actions.”
Initially, the SWC, and more recently the MWQI SPC, has assumed responsibility for conducting
the Watershed Sanitary Survey of the SWP. The California State Water Project Watershed
Sanitary Survey, 2011 Update (2011 Update) was conducted by a Consultant under contract to
the DWR and was overseen by the MWQI Program Sanitary Survey Subcommittee.
Although a sanitary survey is required to be completed every five years, last year marked the
beginning of a new format for the State Water Project Watershed Sanitary Survey. In prior
years, one survey was completed to satisfy the mandated requirement in the 5th year. This was
a tremendous effort each time the survey was completed. CDPH, MWQI Program staff, and
MWQI SPC have agreed to an approach that will make the sanitary surveys more useful to
CDPH and the MWQI SPC, and will not require an inordinate amount of staff time in one year.
The new format will consist of annual sanitary surveys. The first four sanitary surveys will focus
on a particular issue or region of interest. The fifth survey will be a review of water quality data
for the entire SWP. The five annual reports will be submitted to CDPH as they are completed
and will be packaged together in the 5th year. This new format has been developed with the
approval of CDPH, and will satisfy the requirement of a sanitary survey every 5 years.
7.2.1 Status of Cattle Grazing in the SWP
Lead Investigator – Sonia Miller
Project Partner – Elaine Archibald
IO# – VSANSURVEY14, Funds Budgeted – $46,560, Hours Budgeted - 480
This project is the second annual survey using the new format. The focus will be on an analysis
of the impacts of cattle grazing in the watershed areas of various State Water Project facilities.
Each of the previous SWP Watershed Sanitary Surveys has addressed cattle grazing in various
watersheds of the SWP. The objective of this sanitary survey is to update the information and
consolidate it into one report. The previous SWP Watershed Sanitary Surveys will be reviewed
to determine which watersheds have (or previously had) cattle grazing. A detailed scope of work
will be developed that identifies the watersheds that will be included and the methodology for
updating the information on cattle grazing and grazing management practices and for assessing
potential impacts on water quality. The draft scope of work will be submitted to the Sanitary

53
Survey Subcommittee for review and approval in July 2014. The scope will likely consist of the
following tasks:
Conduct Regulatory and Policy Review – State and local regulations and policies on
cattle grazing in watersheds of drinking water supplies will be described.
Evaluate and Analyze Cattle Grazing Data – The information on number of cattle,
seasonality of grazing, and grazing management practices will be updated for each
watershed. Any activities that have occurred to limit the impacts of grazing, such as
development of grazing management practices or installation of fencing will be described.
Describe Impacts on Water Quality – Pathogen and indicator bacteria data will be
reviewed to determine if there are any discernible impacts of cattle grazing on water
quality.
Develop Key Findings and Recommendations – Key findings and recommendations
will be developed based on the analysis of the cattle grazing information and water
quality data.
Prepare Report – The sections of the report will be as follows:
I. Executive Summary
II. Introduction
III. Regulatory Environment
IV. Current Status of Cattle Grazing in the Watersheds of the SWP
V. Water Quality Impacts of Cattle Grazing
VI. Findings and Recommendations
The Status of Cattle Grazing in the SWP deliverables and timelines are shown below in Table
16. Project management documentation for this study can be found in Appendix 2.

54
Table 16. Status of Cattle Grazing in the SWP Deliverables and Timelines
Deliverables Participants Estimated Start Date
Estimated Completion
Date
Develop detailed scope of work
MWQI Program & MWQI SPC
July 2014 July 2014
Obtain data for analysis and prepare Draft Report
MWQI Program & MWQI SPC
July 2014 October 2014
Submit Draft Report to Sanitary Survey Subcommittee for initial review
MWQI Program & Sanitary Survey Subcommittee
October 2014 November 2014
Respond to comments MWQI Program December 2014
December 2014
Submit Revised Draft Report to Sanitary Survey Subcommittee for review
MWQI Program & Sanitary Survey Subcommittee
December 2014
January 2015
Respond to comments MWQI Program January 2015 January 2015
7.3. Fluorescence of Dissolved Organic Matter (FDOM) Project
Lead Investigator – Shaun Rohrer
Project Partner – Alex Rabidoux
IO# – VFDOMPOCS014, Funds Budgeted – $77,600, Hours Budgeted - 800
Phase I of this project, FDOM Proof of Concept study, will continue into FY 14-15 while it goes
through the review and editing process. Data collection for the Phase I will continue during the
implementation of the new work plan, however the data for Phase II can be collected
concurrently. Data collection for Phase I will end in July 2014 (one full year from initial
deployment) and the final report will begin to be developed in June. The final report will build on
what was presented in the Phase I mid-study report while adding in the last six months of data.
Deliverable and timeline for this are included in Table 17.
Building on the FDOM Proof of Concept study, Phase II will expand on information currently
being gathered by Phase I. Currently, a custom built fluorometer (a Turner Designs Cyclops 7)

55
is installed at Banks Pumping Plant (Banks) on the State Water Project (SWP). At the end of
Phase I, FDOM will be correlated to dissolved organic carbon (DOC) and a regression model
will be obtained. Literature reviews have shown significant relationships between FDOM and
DOC and it may be possible to use FDOM as a proxy for DOC measurements. Phase II will not
only expand on the FDOM and DOC relationship, but also add in correlations between FDOM
and TOC and FDOM and disinfection by-products formation potential (DBP-FPs). Currently, the
regression model being run for FDOM is correlated to DOC measurements using a filtered water
sample. Phase II will expand on this correlation and run samples of unfiltered water through the
FDOM and see how those values correlate with the TOC concentrations as the real world
application of FDOM sensors will be deployment in the field without the benefits of filtering.
DBP concentrations will be obtained through an outside laboratory (Weck Lab) submitted
through grab samples. The amount of sampling is yet to be determined, but may be monthly or
bi-weekly. It may be necessary to determine the least amount of samples needed to develop
the correlation between FDOM and DBP’s.
Certified standards of differing concentrations of Quinine Sulfate will be used to test the “drift” of
the data being collected by the fluorometer. Standards will be administered monthly. As
demonstrated by the MWQI field unit during Phase I, proper maintenance is required for FDOM
data consistency. Cleaning of the FDOM’s lens and flow through cap will need to be made bi-
weekly at a minimum. After two weeks, bio-fouling may occur affecting the quality of the data. It
may be necessary to repair the instrument if the sensor is found to be damaged in some way
throughout the term of Phase II.
The FDOM will be deployed at Banks for one year to encompass seasonal changes. Since the
equipment is already installed, it may be possible to run the end of the Phase I concurrently with
the beginning of Phase II. Phase I will wrap up in June 2014, but it is possible to begin Phase II
as early as May 2014. Phase II will run from May 2014 to May 2015. A mid study progress
report will be developed (November 2014-January 2015) with a final report at the end of the
project. The FDOM Phase II project deliverables and timelines are shown below in Table 17
and 18. Project management documentation for this study can be found in Appendix 3.

56
Table 17. FDOM Phase I Study Deliverables and Timelines
Deliverables Participants Estimated Start Date
Estimated Completion
Date
Continue with Data Collection MWQI Program June 2014 July 2014
Begin draft of Final Report MWQI Program
June 2014 August 2014
Submit draft report to DWR management and MWQI SPC for review
MWQI Program & MWQI SPC
August 2014 September 2014
Respond to Comments MWQI Program September 2014
September 2014
Submit Revised draft report to DWR management and MWQI SPC for review
MWQI Program September 2014
October 2014
Respond to comments MWQI Program October 2014 December 2014
Submit Draft Final Report to DWR Editors for formatting and editorial review
MWQI Program & MWQI SPC
December 2014
December 2014
Publish Final Report MWQI Program January 2015 January 2015
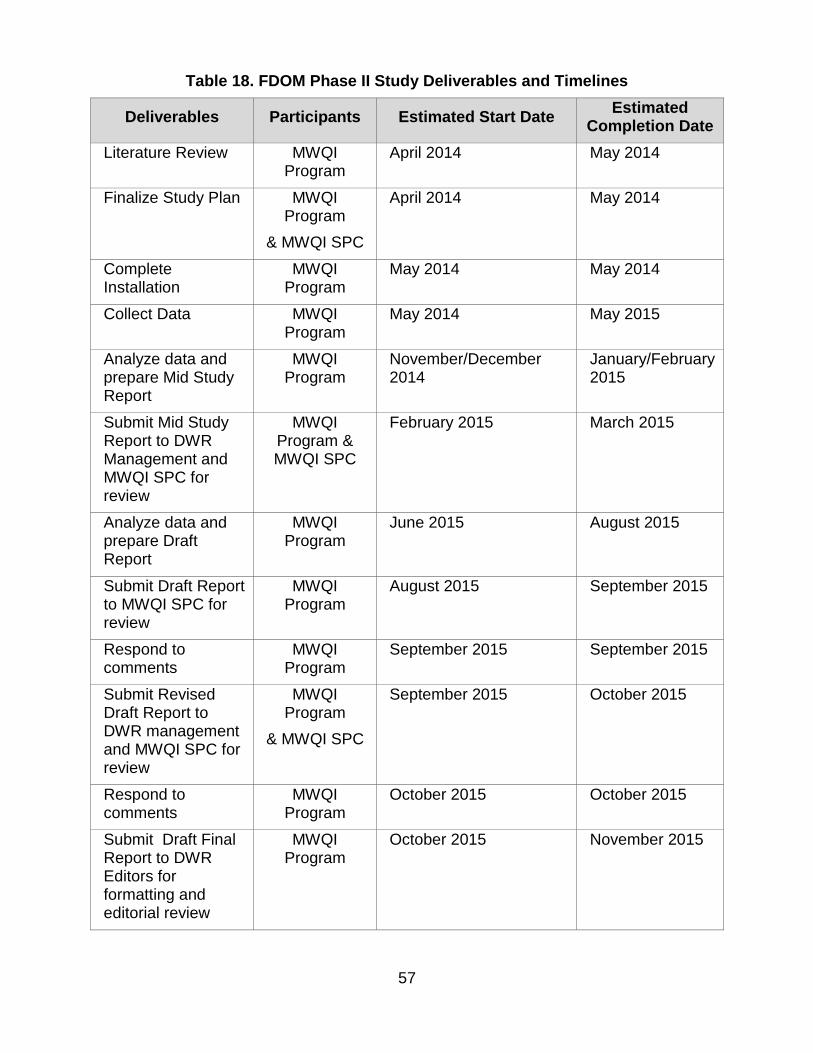
57
Table 18. FDOM Phase II Study Deliverables and Timelines
Deliverables Participants Estimated Start Date Estimated
Completion Date
Literature Review MWQI Program
April 2014 May 2014
Finalize Study Plan MWQI Program
& MWQI SPC
April 2014 May 2014
Complete Installation
MWQI Program
May 2014 May 2014
Collect Data MWQI Program
May 2014 May 2015
Analyze data and prepare Mid Study Report
MWQI Program
November/December 2014
January/February 2015
Submit Mid Study Report to DWR Management and MWQI SPC for review
MWQI Program & MWQI SPC
February 2015 March 2015
Analyze data and prepare Draft Report
MWQI Program
June 2015 August 2015
Submit Draft Report to MWQI SPC for review
MWQI Program
August 2015 September 2015
Respond to comments
MWQI Program
September 2015 September 2015
Submit Revised Draft Report to DWR management and MWQI SPC for review
MWQI Program
& MWQI SPC
September 2015 October 2015
Respond to comments
MWQI Program
October 2015 October 2015
Submit Draft Final Report to DWR Editors for formatting and editorial review
MWQI Program
October 2015 November 2015
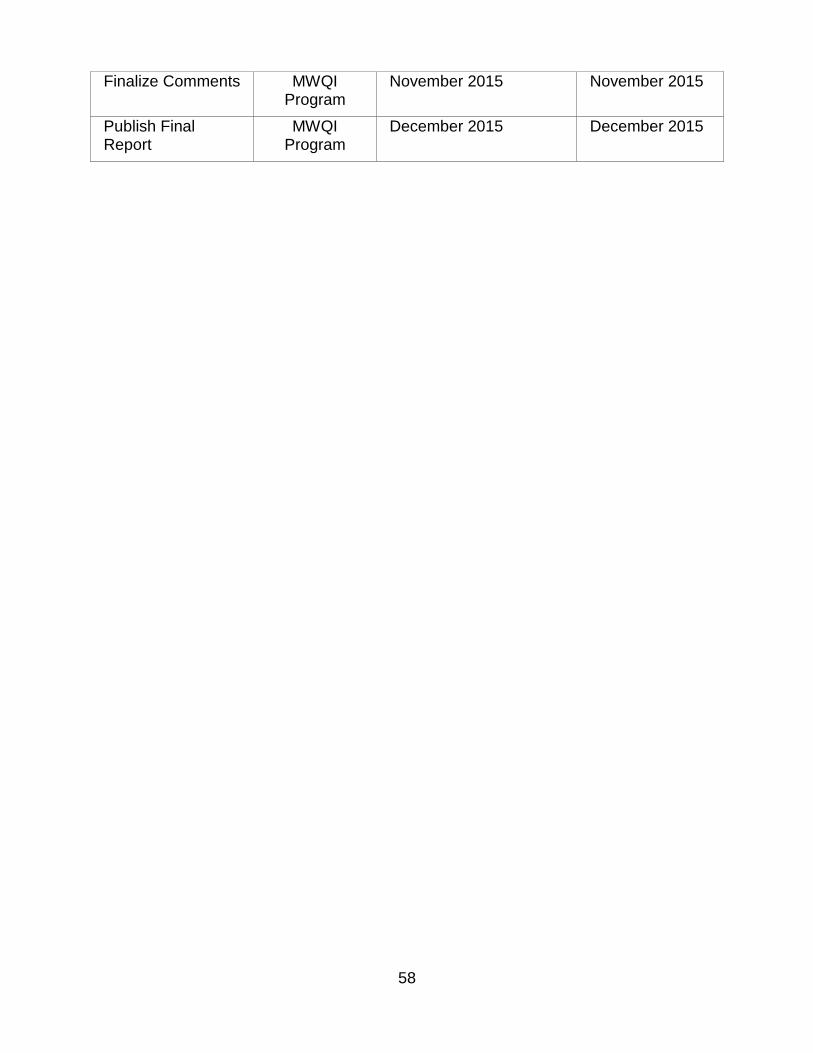
58
Finalize Comments MWQI Program
November 2015 November 2015
Publish Final Report
MWQI Program
December 2015 December 2015

59
7.4. Urban Sources and Loads Investigation
Lead Investigator – Rachel Pisor
IO# – VURBANSL0013, Funds Budgeted – $7,760, Hours Budgeted - 80
This is an ongoing study that began in the FY08-09 work plan. The tasks that will be completed
in this work plan cycle consist of the editing and reviewing processes that occur prior to
publication of the final report.
Prior to this work plan, the draft report was reviewed by DWR management and MWQI SPC.
The work from the previous work plan consists of an editorial review by technical writers in the
Project Services Office, incorporation of their comments, an additional review of an updated
QA/QC section, and a final review from DWR management. Incorporation of management
comments and the approval to print process is projected to take place in the current work plan.
The Urban Sources and Loads Investigations project deliverables and timelines are shown
below in Table 19.
Table 19. Urban Sources and Loads Investigations Deliverables and Timelines
Deliverables Participants Estimated Start Date
Estimated Completion
Date
Send Draft Final Report to DWR Editors and incorporate edits from editors
MWQI Program & Project
Services Office
February 2014 Complete
Draft Final Report for review by MWQI
MWQI Program Mid-April 2014 Complete
Approval to Print Process MWQI Program May 2014 August 2014
Final Report Published MWQI Program August 2014 August 2014

60
7.5. O’Neill Forebay Mixing Study
Lead Investigator – Jason Moore
Project Partners – Tony Liudzius and Elaine Archibald
IO# – VONEILFRBY13, Funds Budgeted – $7,760, Hours Budgeted - 80
This study was initiated during the FY08-09 work plan to investigate the amount of mixing that
occurs in O’Neill Forebay between the various source waters. A preliminary report was drafted
by MWQI staff in the 3rd quarter of 2012. The scope of the project was expanded to include a
spreadsheet modeling approach in the 1st quarter of 2013. Analysis continued until the final
model was developed in October 2013
First Draft of the revised report is complete as of March 2014. The future O’Neill Forebay
Mixing Study project deliverables and timelines are shown below in Table 20.

61
Table 20. O’Neill Forebay Mixing Study Deliverables and Timelines
Deliverables Participants Estimated Start
Date Estimated
Completion Date
Submit Draft Report to MWQP management and MWQI SPC Project Partners for review
MWQI Program & MWQI SPC
2008-2009 work plan
Complete
Review draft and receive comments from MWQP Management and MWQI SPC Project Partners
MWQI Program & MWQI SPC
March 2014 June 2014
Respond to Comments MWQI, Program June 2014 June 2014
Submit Revised Draft Report to MWQI SPC and OWQ Chief for review
MWQI, Program, OWQ Chief, &
MWQI SPC
July 2014 July 2014
Respond to Comments MWQI, Program August 2014 September 2014
Send Draft Final Report to DWR Editors for formatting and editorial review
MWQI Program & Project Services
Office
September 2014 September 2014
Incorporate comments MWQI Program
October 2014 November 2014
Send draft for final review by DES Chief and DWR Executive
MWQI Program, DES Executive Secretary, DES Chief, & DWR
Executive office
November 2014 February 2015
Incorporate Comments MWQI Program February 2015 March 2015
Publish Final Report MWQI Program, DWR Publishing,
& DES IT
March 2015 April 2015

62
7.6. Spectrofluorometer Study
Lead Investigator – Ted Swift
Project Partner – Rich Losee
IO# – VSPCTROFLU13, Funds Budgeted – $15,520, Hours Budgeted - 160
This is a study that began in the FY09-10 work plan, to be substantially complete before the
FY14-15 Work Plan. This research was identified as an area of expertise needed by the MWQI
Program. This study evaluates the utility of spectrofluorometry as a method of rapidly
quantifying COCs such as DOC, and organic nitrogen as a source of DBP precursors by
correlating spectral peaks in the fluorescence excitation-emission matrix (EEM) with lab
analyses for DOC, nutrients, and DBP precursors, using samples from 12 stations within and
around the Delta, and two wastewater treatment plants. This study also seeks to identify
distinctive characteristics of Delta source waters to provide “fingerprints” that could be used to
validate Delta water quality models. The final report is expected to be substantially complete by
the beginning of the FY, with a low level of MWQI effort to maneuver it through final DWR
management approval in the FY14-15 Work Plan. The spectrofluorometer deliverables and
timelines are shown below in Table 21.

63
Table 21. Spectrofluorometer Study Deliverables and Timelines
Deliverables Participants Estimated Start Date
Estimated Completion Date
Incorporate 1st round comments
MWQI Program March 2014 30 May 2014
Submit Draft Report to MWQP management and MWQI SPC for review
MWQI Program & MWQI SPC
30 May 2014 30 May 2014
Review draft and receive comments from MWQP Management and MWQI SPC Project Partners
MWQI Program & MWQI SPC
2 June 2014 28 July 2014
Respond to Comments MWQI, Program 28 July 2014 15 August 2014
Submit Revised Draft Report to MWQI SPC and OWQ Chief for review
MWQI, Program, OWQ Chief, & MWQI SPC
15 August 2014
29 August 2014
Respond to Comments MWQI, Program 29 August 2014
12 September 2014
Send Draft Final Report to DWR Editors for formatting and editorial review
MWQI Program & Project Services Office
12 September 2014
10 October2014
Incorporate comments MWQI Program
13 October 2014
16 October 2014
Send draft for final review by DES Chief and DWR Executive
MWQI Program, DES Executive Secretary, DES Chief, & DWR
Executive office
17 October 2014
6 January 2015 -3 February 2015
Incorporate Comments MWQI Program 6 January 2015 -3 February 2015
27 January 2015 -24 February 2015
Publish Final Report MWQI Program, DWR Publishing, & DES IT
30 Januaary 2015 – 27 February 2015
13 February 2015-13 March 2015

64
7.7. Tidal Marsh Restoration Literature Review
Lead Investigator – Sonia Miller
Project Partner – Alex Rabidoux
IO# – VTIDALMRSH13, Funds Budgeted – $15,520, Hours Budgeted - 160
This is an ongoing special study started in the FY10-11 work plan. The purpose of this study is
to review, compile, and summarize existing research on the impact of tidal wetlands in the Delta.
State, federal, and local agencies will be adding thousands of acres of tidal marsh to the Delta.
Several examples include the most recent draft of the Bay Delta Conservation Plan (BDCP)
which proposes creation or restoration of 65,000 acres of tidal wetland in the Delta, including the
Suisun Marsh. The recent Delta Smelt Biological Opinion for SWP operations in the Delta also
calls for the restoration of 8,000 acres of intertidal and sub-tidal wetlands.
One negative impact from wetland restoration is the production of dissolved organic carbon
(DOC) which at high concentrations can cause disinfection by products (DBPs) during the
chlorination process of water treatment. DBPs are carcinogenic, highly regulated, and can lead
to increased scrutiny and regulation of water treatment plant operations.
The deliverables and timelines are shown below in Table 22. Project management
documentation for this study can be found in Appendix 2.

65
Table 22. Tidal Marsh Literature Review Deliverables and Timelines
Deliverables Participants Estimated Start
Date Estimated
Completion Date
Prepare Draft Report for MWQP management
MWQI Program Complete Complete
Respond to Comments MWQI Program Complete Complete
Submit Draft Report to MWQP management and MWQI SPC Project Partners for review
MWQI Program
MWQI SPC
June 2014 August 2014
Respond to Comments MWQI Program September 2014 September 2014
Submit Revised Draft Report to MWQI SPC and OWQ Chief for review
MWQI, Program, OWQ Chief, & MWQI
SPC
September 2014 October 2014
Respond to Comments MWQI, Program October 2014 October 2014
Send Draft Final Report to DWR Editors for formatting and editorial review
MWQI Program & Project Services
Office
October 2014 November 2014
Incorporate Comments MWQI Program November 2014 November 2014
Send draft for final review by DES Chief and DWR Executive
MWQI Program, DES Executive Secretary, DES Chief, & DWR
Executive office
November 2014 March 2015
Incorporate Comments MWQI Program March 2015 March 2015
Publish Final Report MWQI Program, DWR Publishing, & DES IT
March 2015 April 2015

66
7.8. Feasibility Study for MWQI Portable Water Quality Monitoring Station
Lead Investigator: Arin Conner
IO# – VPORTBLSTN13, Funds Budgeted – $7,760, Hours Budgeted - 80
This is an ongoing study from the FY 10-11 work plan, and timelines associated with this study
continue to remain flexible to accommodate field staff’s primary responsibilities associated with
real-time station operations and maintenance. Meanwhile, using a self-contained, portable
monitoring station continues to provide the benefit of allowing for the collection of real-time
water quality data without committing to the construction cost normally associated with a
permanent facility. Moreover, portable stations, much like the one installed at the Gianelli
pumping plant, could potentially be used as a semi-permanent installation with the addition of
security devices, ample electrical supply, and some simple preparations. Ready-made portable
stations are now currently available at reasonable cost, are cost-effective alternatives to the cost
of permanent buildings, and can be pre-ordered and outfitted to the specifications required by
the client. This study will investigate the feasibility of using a ready-made portable station
including features necessary to outfit a portable water quality station using minimal staff time
and cost. Actual construction of the portable station would be dependent upon approval by the
MWQI Program and the MWQI SPC. The acquired information including design specification
and quotes will be summarized in a draft report and provided to the MWQI SPC.
The deliverables and timelines are shown below in Table 25.
Table 23. Portable Water Quality Monitoring Station Deliverables and Timelines*
Deliverables Participants Estimated Start
Date
*Estimated Completion
Date
Investigate the design and cost of constructing a portable water quality station
MWQI Program June 2012 August 2012
Identify alternatives of ready-made prefabricated portable buildings
MWQI Program August 2012 November 2012
Investigate options to design specifications
MWQI Program November 2012 December 2012
Identify alternatives of power sources, HVAC systems, and exterior and interior lighting
MWQI Program February 2013 March 2013

67
Obtain quotes MWQI Program June 2013 June 2013
Summarize information in a draft report
MWQI Program June 2014 August 2014
Publish final report MWQI Program August 2014 October 2014
*Schedule is subject to change.
8. OTHER MWQI FUNDED PROGRAM ACTIVITIES
MWQI staff work on some tasks that seem peripheral to the approved projects, but are actually
an inescapable part of the job. For this reason internal order numbers (IO’s) under Section 8 are
intended to describe these tasks and help define the associated time requirements. In this
section administrative activities, employee safety, and other overhead type requirements are
discussed.
In addition to these, MWQI staff is occasionally requested to support other DWR activities. For
example, MWQI staff may be asked to provide technical assistance, review and revise plans, or
provide support that improves workplace safety practices. Such assistance by the MWQI staff
may directly or indirectly benefit the MWQI program stakeholders and the MWQI SPC, and
therefore is funded by the MWQI budget.
As it has done in the past, MWQI will continue to inform the TAC and MWQI SPC members
about work on these tasks. MWQI will achieve this through updates during the monthly TAC
meetings, by providing details in this and future work plans, and through expenditure reports
presented quarterly at TAC meetings.
8.1. Administration Work
IO# – VDWRRQDDPC13, Funds Budgeted – $169,080, Hours Budgeted – 1640
In general, the Administrative Work IO (VDWRRQDDPC13) covers meetings, conferences,
training, and certain office duties for all MWQI staff. Each of these is more closely described
below.
All training and conferences fall under this section. MWQI Program staff attend training classes
focused on drinking water quality, but also attend classes outside of water quality to develop
their skills and prepare for career advancement. Another form of training is workshop

68
attendance, such as the annual Environmental Scientist Workshop; and conference attendance,
such as the IEP Workshop, CWEMF Annual Meeting, Bay Delta Science Conference, etc.
Other required program activities include office duties such as preparing training and travel
expense claim forms; general email activities; preparing MWQI meeting agendas, handouts, and
meeting minutes; and preparing equipment maintenance contracts. Also, most in-house
meetings attended by staff are charged to this IO, including the TAC and Branch meetings. Staff
time is also charged to this IO for attending and preparing for the MWQI & Contractors Annual
Meeting.
Preparation of the MWQI Fact Sheet - The MWQI Specific Project Committee (SPC) has
requested that MWQI prepare a brief (2 to 5 page) fact sheet that summarizes the major
accomplishments at the end of each FY. The purpose of this report is to highlight the value of
the MWQI Program to senior managers and board members of the SWP M&I Contractors. The
MWQI SPC will develop the format and prepare the report for FY 2013/2014 and MWQI staff will
then develop the FY 2014/2015 report using the same format. The production of this fact sheet
will be done by MWQP management staff. Funding for this fact sheet comes from the
management budget.
Table 24. MWQI Accomplishments Report Deliverables and Timelines
Deliverables Participants Estimated Start
Date
Estimated
Completion
Date
Discuss major accomplishments
at TAC meeting
MWQI Program
& MWQI SPC
April 2015 April 2015
Submit draft report to MWQI
SPC for review
MWQI Program May 2015 May 2015
Submit final report to MWQI
SPC
MWQI Program June 2015 June 2015
8.2. Field Unit Office Duties
IO# – VFUOFCWORK13, Funds Budgeted – $121,400, Hours Budgeted - 1200

69
The Field Unit Office Duties IO (VFUOFCWRK13) is intended to track the cost of the Field
Section facility by tracking time and expenses charged to maintaining the Bryte Trailer offices.
This IO also acts as the general charge number for field section staff when attending section
meetings and other general office activities. This information will be a valuable planning tool for
the senior staff member leading the Field Section, which will allow for the budgeting of facility
repairs, as needed.
8.3. O&M Water Quality Other Duties
IO# – VOMWQHQ00013, Funds Budgeted – $500, Hours Budgeted - are paid for by O&M
The MWQI Program funds 0.6 PY of a position within O&M, which is managed under a resource
agreement (an agreement between the two divisions explaining work to be performed). This
FY, all MWQI related charges for this position will fall to the Gianelli water quality station
operation IO which is covered in Section 6.1.2. This FY, Element 8.3 is only planned to be used
to pay MWQI’s share of the O&M employee’s training (60%).
8.4. MWQI Annual Work Plan
IO# – VWORKPLAN013, Funds Budgeted – $51,216, Hours Budgeted - 528
The cost of staff time spent developing, reviewing, and producing the final annual work plan will
be tracked within the MWQI Program so that management, staff, and the MWQI SPC can gain
an understanding of the time and cost involved in producing this document. This information will
provide a valuable tool for planning, organizing, managing, and controlling the production of
future work plans.
Charges to this section (IO# VWORKPLAN13) are all work plan development activities including
work plan meetings, work plan text development, budget and timelines, and project initiation
documents. All of this information is included in the annual work plan document. All steps
beyond those described here are to be charge to the specific study IO number and not the work
plan IO.
8.5. DWR’s Bulletin B132, Chapter 4 - Water Quality
IO# – VBULL132WQ13, Funds Budgeted – $11,640, Hours Budgeted – 120

70
The MWQI Program staff will actively participate in writing the appropriate portions of the DWR
Bulletin 132, Chapter 4 - Water Quality for version 132-13. Bulletin 132, Management of the
California State Water Project, is a series of annual reports that describe the status of SWP
operations and water deliveries. Each annual report updates information regarding project costs
and financing, water supply planning, power operations, and significant events that affect the
management of the SWP. Each also presents hydrologic information for the water year, capital
construction information for the fiscal year, and water delivery, operations, maintenance, and
other activities for the calendar year.
The cost of staff time spent revising and reviewing specific sections within chapter 4-water
quality that pertain to the MWQI Program will be tracked so that management staff and the
MWQI SPC can gain an understanding of the time and cost involved in producing our
contributions to this document that is required by DWR to be provided annually to the SWP
Contractors. This information will provide a valuable management tool for planning, organizing,
managing, and controlling staff’s work time on the production of future bulletins.
8.6. MWQI Agreement
If MWQI Program staff assist with developing any future MWQI funding agreement their work
time and costs will be tracked and reported through the quarterly expenditures reports. It is not
anticipated that staff will spend any time in FY 14-15 since the three year agreement covering
FY 14-15 to FY 16-17 was executed in February 2014.
8.7. Workplace Safety
IO# – VSAFTYDOCS13, Funds Budgeted – $13,692, Hours Budgeted – 136
Per the Resources Agency Secretary, DWR developed a DWR Safety Office and has a Chief
Safety Officer that is responsible for leading DWR’s implementation of a world-class workplace
safety program. The workplace safety program will provide uniformity and consistency across
DWR, and involves every staff member contributing to a safer workplace. DES is committed to
supporting DWR’s workplace safety program with its total quality management approach;
commitment to the health and safety of its employees, partners and visitors; and values
workplace safety through leadership, recognition, and education.

71
DES created a Safety Support Workgroup to enhance and refine its comprehensive workplace
safety program both in office and field locations; ensure compliance with all applicable federal,
State, and local laws and regulations; provide the required inspections, assessments, corrective
actions, training, and reporting; and make recommendations that will elevate the DES workplace
safety program to meet DWR’s goals of a world-class level.
MWQI staff will contribute to this broader workplace safety program effort by contributing staff
time in the division level efforts. On the project/study level, MWQI staff will ensure that safety
equipment, safety protocols and documentation, and required training are part of every project.
All of the work on safety program development, safety meeting attendance, and project specific
safety activities and equipment will be charged to the Workplace Safety IO number
(VSAFTYDOCS13).
8.8. Emergency Response
IO# – V911RESPNS13, Funds Budgeted – $3,880, Hours Budgeted – 40
Any staff involvement with emergency response (ER) during this work plan cycle will include:
attending ER meetings, restocking of drinking water quality ER kits, providing emergency
assistance for drinking water quality monitoring as requested by emergency responders and
assisting the DWR’s Emergency Management Committee (EMC) as needed in the development
of a DWR Drinking Water Quality ER Plan.
8.9. Miscellaneous Meetings Attended by Staff
IO# – VOTHERWQPA13, Funds Budgeted – $38,800, Hours Budgeted – 400
The MWQI Program staff has historically contributed to numerous DWR support activities that
pertain to the MWQI Program and will continue to provide support as needed. The cost of staff
time spent on these support activities will be tracked so that management staff and the MWQI
SPC can gain an understanding of the time and cost involved. This information will provide a
valuable management tool for planning, organizing, managing, and controlling staff’s workloads,
project time allocations, and overall costs to the MWQI Program.
The following information provides a brief description where staff may be requested to provide
their drinking water quality expertise:

72
California Water Quality Monitoring Council (CWQMC) - (Per Senate Bill 1070, the MWQI
Program staff will actively participate in the CWQMC collaboration network that requires
the boards, departments and offices within the California Environmental Protection
Agency (Cal/EPA) and the California Natural Resources Agency to integrate and
coordinate their water quality and related ecosystem monitoring, assessment, and
reporting. MWQI Program staff will assist in improving the coordination and cost-
effectiveness of water quality and ecosystem monitoring and assessment, enhance the
integration of monitoring data across departments and agencies, and increase public
accessibility to monitoring data and assessment information by participating in meetings,
and providing technical support and water quality data.
State Water Resources Control Board (SWRCB) - The MWQI Program staff will actively
continue to support data dissemination activities to the California Environmental Data
Exchange Network (CEDEN) data portals, and provide technical support in the
development of the Regional Monitoring Programs (RMP).
DWR California Water Plan - The MWQI Program staff will actively participate in writing
the appropriate water quality portions of the CA Water Plan and any updates to future
Plans. No work is anticipated in FY 14-15 since the 2013 Water Plan was recently
completed and the next one is due in 2018.
DWR’s GIS efforts - The MWQI Program staff will participate occasionally in the monthly
GIS meeting because GIS is a powerful tool that is used in some instances on special
studies to help us visualize, analyze, interpret, and understand data to reveal
relationships, patterns, and trends. The MWQI Program staff may also occasionally
participate in GIS training classes and the annual GIS conference.
Delta Conservancy educational outreach events

73
9. PROGRAM MANAGEMENT - STATUS REPORTING
IO# – VPROGMMGMT13, Funds Budgeted – $173,824, Hours Budgeted – 1792
The MWQI Program Senior Environmental Scientists are responsible for these following specific
management tasks:
Supervise and direct the work of the MWQI Environmental Scientists and scientific aides
and other technical staff assisting with MWQI projects.
Assign and distribute staff work then monitor staffing levels, project schedules, monitor
and evaluate work performance, and conduct staff workload assessments to improve
efficiency, save time, resources and money.
Conduct routine staff meetings, prepare staff’s annual appraisal and development (A&D)
reports, determine staff training needs, approve staff’s training and time-off requests, and
verify and approve staff attendance.
Coordinate the preparation, or prepare and provide the appropriate MWQI Program
meeting agendas, monthly status report, budget expenditure reports, and meeting
minutes.
Coordinate the MWQI-SWP Urban Contractors annual meeting.
Ensure MWQI TAC members continue to receive all draft materials, and that committee
members continue to have the opportunity to participate in technical meetings of interest.
Monitor progress on MWQI Program elements outlined in work plan.
Address personnel, contracted services, and equipment related issues for the MWQI
Program.
Conduct interviews and hire qualified staff to backfill vacancies.
Provide technical support to management for meetings, conference and workshops
related to drinking water quality issues.
Prepare correspondence as needed to provide information to the MWQI SPC.
All time spent on these tasks is charged to the Program Management IO number
(VPROGMMGMT13). Only Senior Environmental Scientist in the MWQI branch charge to
Program Management.

74
10. NON-MWQI FUNDED PROGRAM MANAGEMENT
As stated previously, since DWR is a matrix management organization staff may be requested
to assist with supporting various DWR activities by providing technical support, evaluations and
analysis of data, timely document and plan reviews, and may occasionally attend meetings.
Some of these support activities are not funded by the MWQI Program budget. For example, the
MWQI Program staff who assist with writing, evaluating data pertaining to drinking water related
research, or conducting reviews of BDCP project chapters, environmental documents, and plans
will charge the BDCP budget. Also, the MWQI Program staff that assist with the DWR Water
Planning Information Exchange (PIE) efforts will charge the Water PIE budget.
The amount of work time that staff spends on these types of non-MWQI funded activities is
infrequent, and rarely impacts their normal workloads. MWQI program staff members serve as
DWR’s technical drinking water quality experts. Work done on non-MWQI projects is beneficial
to DWR and is indirectly beneficial to MWQI stakeholders.
11. OTHER REQUIRED PROGRAM COSTS
IO# – G1111290005I, Funds Budgeted – $1,000 for Mobile Equipment Operations (fuel &
vehicle insurance), Funds budgeted for PSO – $3000 for the portable restroom contract
The DWR Project Services Office (PSO) provides technical reviews, evaluations, analysis and
presentation of data pertaining to water related research projects and programs and is used by
the MWQI Program staff for technical reviews of special studies and reports prior to publication.
The cost of PSO support services has historically been covered by the DWR monthly overhead
assessments which are spread out amongst DWR Divisions’ budgets. As of July 1, 2013 the
PSO services were no longer covered by DWR’s overhead assessments. As of the writing of
this work plan, the PSO has not yet made available the cost of their technical review and
support services, but the MWQI Program allocated $3000 for this work plan cycle to cover costs
incurred for any technical reviews of the special studies.
The Artificial Neural Network Project (ANN) may continue into FY 14/15. A placeholder budget
of $30,000 was approved by the MWQI SPC.
DWR’s Mobile Equipment Operation’s (MEO) provides insurance and fuel to support the
vehicles used by the Field Support Section staff for their routine water quality assessment

75
efforts. The MEO office staff will continue to support the MWQI Program by providing customer
support through cost effective fleet management and maintenance of mobile equipment owned
by DWR. The MWQI Program allocated $1000 for this work plan cycle to cover costs incurred
for this support.
Expenditures for these types of services not assigned to any specific program element will be
tracked and reported in the column entitled "Operating Equipment and Expenses", on the
monthly expenditure reports that will be provided as handouts prior to the TAC meetings.
The MWQI Program is not responsible for directly tracking expenditures of the MWQI SPC
Fund, but Program staff will work directly with MWQI SPC staff to obtain the expenditure
amounts periodically and will include these amounts in the monthly expenditure reports provided
prior to the TAC meetings.
On occasion, if the MWQI Program needs additional water quality monitoring equipment,
laboratory services, or technical support from consulting services, Program management staff
will discuss the need for these types of additional services with the MWQI SPC Consultant and
the MWQI SPC. The cost of additional services will also be tracked and reported in the monthly
expenditure reports.

76
12. ORGANIZATION CHART
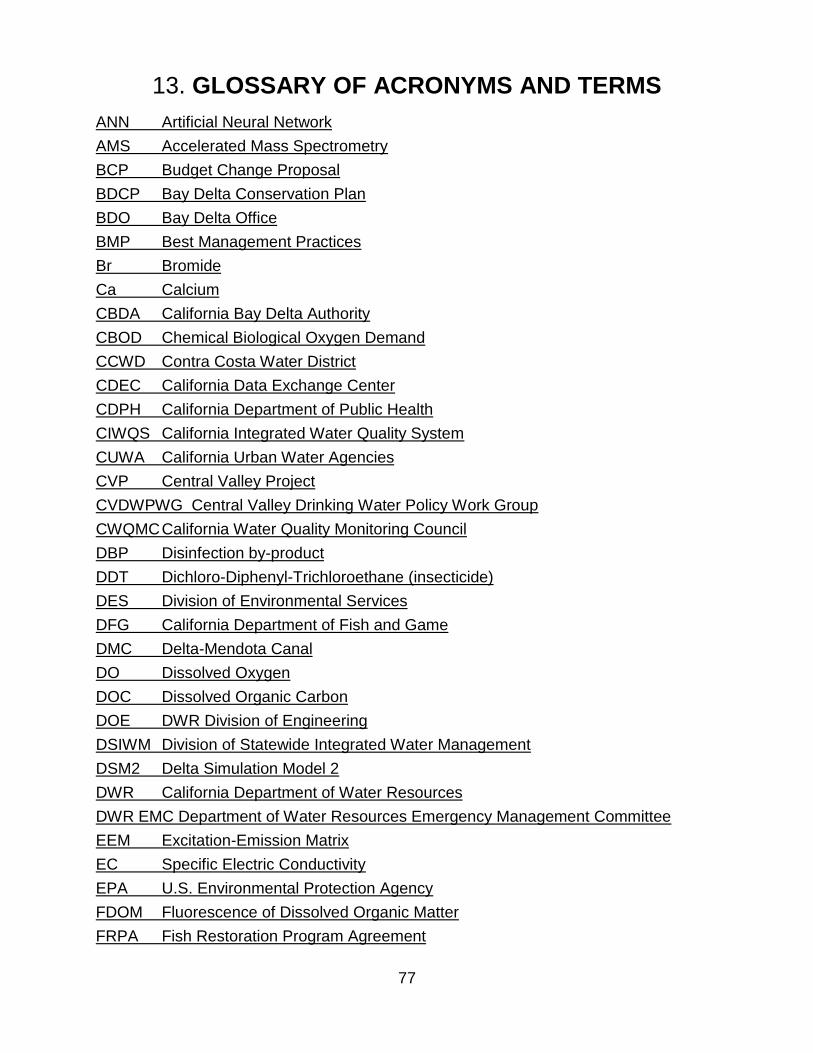
77
13. GLOSSARY OF ACRONYMS AND TERMS
ANN Artificial Neural Network
AMS Accelerated Mass Spectrometry
BCP Budget Change Proposal
BDCP Bay Delta Conservation Plan
BDO Bay Delta Office
BMP Best Management Practices
Br Bromide
Ca Calcium
CBDA California Bay Delta Authority
CBOD Chemical Biological Oxygen Demand
CCWD Contra Costa Water District
CDEC California Data Exchange Center
CDPH California Department of Public Health
CIWQS California Integrated Water Quality System
CUWA California Urban Water Agencies
CVP Central Valley Project
CVDWPWG Central Valley Drinking Water Policy Work Group
CWQMC California Water Quality Monitoring Council
DBP Disinfection by-product
DDT Dichloro-Diphenyl-Trichloroethane (insecticide)
DES Division of Environmental Services
DFG California Department of Fish and Game
DMC Delta-Mendota Canal
DO Dissolved Oxygen
DOC Dissolved Organic Carbon
DOE DWR Division of Engineering
DSIWM Division of Statewide Integrated Water Management
DSM2 Delta Simulation Model 2
DWR California Department of Water Resources
DWR EMC Department of Water Resources Emergency Management Committee
EEM Excitation-Emission Matrix
EC Specific Electric Conductivity
EPA U.S. Environmental Protection Agency
FDOM Fluorescence of Dissolved Organic Matter
FRPA Fish Restoration Program Agreement

78
FSR Feasibility Status Report, used in information technology planning
FY Fiscal Year
GC-MS Gas Chromatography Mass Spectrophotometer
GIS Geographic Information System
HAA Haloacetic Acid
HAAFP Haloacetic Acid Formation Potential
IC Ion Chromatography, Inorganic Carbon (e.g., dissolved carbon dioxide)
IEP Interagency Ecological Program
IO Internal Order number
IT Information Technology
KHP Potassium hydrogen phthalate
LC-MS Liquid Chromatography Mass Spectrometry
MEO Mobile Equipment Operations
MWDSC Metropolitan Water District of Southern California
MGD Million Gallons per Day
MWDSC Metropolitan Water District of Southern California
MWQI Municipal Water Quality Investigations
MWQI SPC Municipal Water Quality Investigations Specific Projects Committee
Na Sodium
NALMS North American Lake Management Society
NEMDC Natomas East Main Drainage Canal
NDBA N-nitroso-di-n-butylamine
NDMA N-nitroso-dimethylamine
NDPA N-nitroso-di-n-propylamine
NHD National Hydrography Dataset
NMEA N-nitroso-methylethylamine
NMOR N-nitrosomorpholine
NPDES Non-Point Discharge Elimination System
NPYR N-nitroso-pyrrolidine
NMR Nuclear Magnetic Resonance (analysis)
O&M Department of Water Resources Division of Operations and Maintenance
O&M WQ Division of Operations and Maintenance Water Quality Section
OC Organic carbon
OCO Operation Controls Office (DWR O&M)
OEE Operating Expenses and Equipment
QA/QC Quality Assurance/Quality Control
P/G Pumping/Generation

79
PCB polychlorinated byphenyls
PY Person Year
QA/QC Quality Assurance, Quality Control
QC Quality Control
RTD Real-time Data
RTDF Real-time Data and Forecasting Program
RTDF-CP Real-time Data and Forecasting – Comprehensive Program
RTM Real Time Monitoring
SBA South Bay Aqueduct
SCWA Solano County Water Agency
SDIP South Delta Improvement Program
SLDMWA San Luis and Delta Mendota Water Authority
SME Subject Matter Expert
SOP Standard Operating Procedure
SPC Specific Project Committee
SUVA Specific ultraviolet absorbance
SWC State Water Contractors
SWP State Water Project
SWPCA State Water Project Contractors Authority
SS Sanitary Survey Update
TAC Technical Advisory Committee
TBD To Be Determined
TDS Total Dissolved Solids
THM Trihalomethane
THMFP Trihalomethane formation potential
TKN Total Kjeldahl Nitrogen
TMDL Total Maximum Daily Load
TNC The Nature Conservancy
TOC Total (dissolved and suspended particulate) organic carbon
UCD University of California at Davis
USBR U.S. Bureau of Reclamation
USGS United States Geological Survey
UVA n Ultraviolet absorbance at wavelength n
VAMP Vernalis Adaptive Management Program
WARMF Watershed Analysis Risk Management Framework
WDL California Water Data Library
WWTP Waste Water Treatment Plants