municipal bonds build america - naco · often flow to non-residents, ... municipal bonds build...
TRANSCRIPT

Emilia IstrateNACo Director of Research
Municipal Bonds Build America A County Perspective on Changing the Tax-Exempt Status of Municipal Bond Interest
NACo Policy research PaPer series • issUe 1 • 2013

AcknowledgMentsThe author wants to thank the 45 counties that provided data on their 2012 interest payments on tax-exempt municipal bonds. I am also indebted to Dustin McDonald and the Govern-ment Financial Officers Association for all the help provided in collecting county interest payment data. The author is grateful to Councilwoman Helen Holton from Baltimore City, Md. and Commissioner John O’Grady from Franklin County, Ohio for their support with the case studies. For the information in the case studies, I would like to thank Kenneth Wilson from Franklin County, Ohio, Tim Firestine from Montgomery County, Md., and Steve Kraus from Baltimore City, Md. For their substantive comments along the writing process and on a draft of the report, the author thanks Michael Decker, Matt Fabian, Susan Gaffney, George Friedlander, Tim Firestine, and David Parkhurst. Within the National Association of Counties, the author would like to thank Matt Chase for his critical advice and guidance on the entire process. Other NACo staff members — including Michael Belarmino, Deborah Cox, Bob Fogel, Tom Goodman and Hadi Sedigh— made thought-ful and insightful contributions along the way. I also thank Camille Galdes for research assistance and for providing the maps used in this report, Nicholas Lyell for creating the website interactive for this report, Matthew Fellows for designing the webpage of the report, and Jack Hernandez for graphic design.
For More InForMAtIon, contAct: Emilia Istrate, PhDDirector of ResearchNational Association of CountiesPhone: [email protected] Michael BelarminoAssociate Legislative DirectorAssociate General CounselNational Association of CountiesPhone: [email protected]

National Association of Counties Municipal Bonds Build America
3
cAse study
executive summaryCounties, states and other localities are the main funders of infrastructure in the United States. Municipal bonds enable state and locals to build essential infrastructure projects, such as schools, hospitals and roads. Congress and the Administration are currently debating federal tax reform, including a cap or a repeal of the tax-exempt status of municipal bond interest. An analysis of the municipal bond market and of the estimated impact of a 28 percent cap and a repeal of the tax-exempt status of municipal bond interest on the 3,069 county governments reveals that:
1 – Municipal bonds finance a wide range of locally selected infrastructure projects and have a long history of low default rates. Between 2003 and 2012, counties, states and other localities invested $3.2 trillion in infrastructure through long-term tax-exempt municipal bonds, 2.5 times more than the federal investment. In counties, the legislature of the county government has to approve a bond issuance and often voters also approve the bond financing. Municipal bonds maintain a track record of low default rates, better than comparable corpo-rate bonds.
2 – Any tax imposed on currently tax-exempt municipal bond interest will affect all Americans, as investors in municipal bonds and as taxpayers securing the payment of municipal bonds. American households hold almost three-quarters of the municipal bond market, for retirement plan diversification and as a way to invest in their communities. A cap or a repeal of the tax-exempt status of municipal bond interest would deeply affect Americans’ retirement nests and asset formation. In the same time, the higher debt service would impact counties and other state and local governments’ budgets and directly affect taxpayers.
3 – In 2012 alone, the debt service burden for counties would have risen by $9 billion if municipal bonds were taxable over the last 15 years and by about $3.2 billion in case of a 28 percent cap. Large counties (with more than 500,000 residents) would have borne more than half of the cost, and small counties would have been most at risk to lose access to the municipal bond market. On a larger scale and longer time horizon, counties, states, localities and state/local authorities would have paid $173.4 billion more in interest between 2003 and 2012 with a 28 percent cap on the benefit of their tax-exempt municipal bonds for the 21 largest infrastructure purposes in the last 10 years. The cost would have soared to almost $500 billion in case of a repeal of the tax-exempt status of municipal bond interest during the last decade.
Municipal Bonds Build America National Association of Counties
4
cAse study #1
The tax-exemption of municipal bond interest from federal income tax represents one of the best examples of the federal-state-local partnership. Because of the federal tax exemption, investors are willing to buy municipal bonds that pay less interest relative to other securities. With a cap or the elimination of the exemption entirely, investors will want to receive greater interest payments, which would be borne by the counties, states, localities and state/local authorities. Finally, all Americans, as taxpayers securing the payment of municipal bonds, will incur the cost.
Municipal bonds are a proven, decentralized investment tool that maintains the decision-making for infrastructure with state and local leaders in partnership with their residents. It allows Ameri-cans to diversify their retirement portfolios into safe investments and provides them an opportu-nity to invest in their communities. Using municipal bonds, both small, rural counties and large, urban counties finance schools, hospitals, roads and other essential infrastructure projects. Any change to the tax-exempt status of the municipal bond interest will only multiply the woes of a beset U.S. infrastructure system.
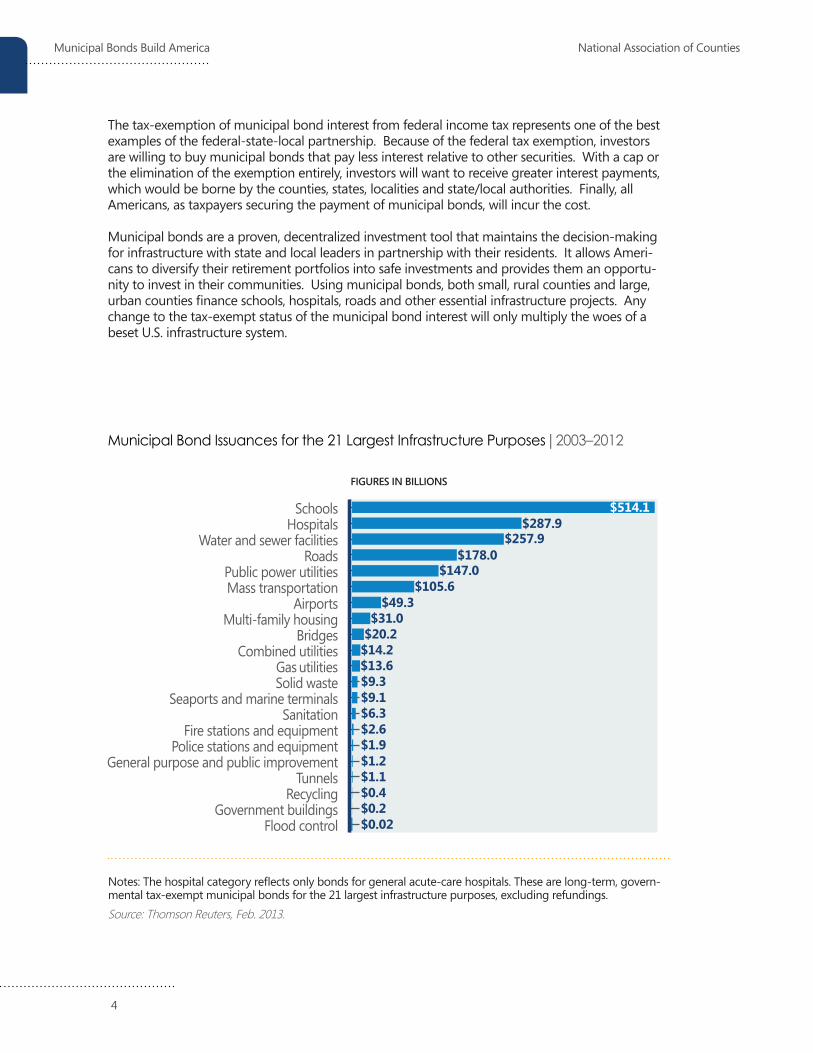
Municipal Bond Issuances for the 21 Largest Infrastructure Purposes | 2003–2012
Notes: The hospital category reflects only bonds for general acute-care hospitals. These are long-term, govern-mental tax-exempt municipal bonds for the 21 largest infrastructure purposes, excluding refundings. Source: Thomson Reuters, Feb. 2013.
FiGUres iN BillioNs
$514.1$287.9
$257.9$178.0
$147.0$105.6
$49.3$31.0
$20.2$14.2$13.6$9.3$9.1$6.3$2.6$1.9$1.2$1.1$0.4$0.2$0.02

National Association of Counties Municipal Bonds Build America
5
IntroductionCounties, states and other localities have been the stewards of infrastructure in the United States throughout the nation’s history. A functioning and evolving municipal bond market allowed the United States to build infrastructure over centuries. Municipal bonds have been a staple for the activity of state and local governments in the United States since the 1800s, with early efforts such as New York’s state bonds financing the Erie Canal.1
The tax-exemption status arrived early in the 20th century, when the federal income tax came into being in 1913. Initially viewed as part of the co-sovereignty rule of no taxation between different levels of government, the exemption of municipal bonds from federal income tax is justified on an economic basis.2 Municipal bonds finance infrastructure projects, such as roads, whose benefits often flow to non-residents, for example drivers passing through a county and using county roads. One of the roles of the federal government is to cover for these benefits that cross boundaries, especially when they cross state borders.
Similar to states and other localities, counties use municipal bonds as the main financing mechanism to build infrastructure. The 3,069 counties, which serve 94 percent of Americans, have a major role in public works construction and infrastructure ownership. Counties invest more than $52 billion annually in roads, highways, jails, hospitals, water and wastewater facilities, and other public works projects.3 Counties are also major owners of infrastructure. For example, counties own 45 percent of the nation’s roads and more than 200,000 bridges.4
Counties, as well as states and other local govern-ments and local/state authorities, would be deeply affected by the change to the tax-exempt status of municipal bond interest in the proposed 2014 Administration’s budget. The Administration reiterated a modified 2011 proposal of a 28 percent cap on the benefit accruing to investors in tax-exempt bonds. This cap would apply not only to newly issued bonds, but it would also apply to municipal bonds already purchased, an unprecedented move that would cause issuance costs to rise. Others, such as the National Commission on Fiscal Responsibility and Reform (the “Simp-son-Bowles Commission”), proposed full taxation on the interest for newly issued municipal bonds, part of its 2010 deficit-reduction recommendations.
The goal of this analysis is to provide a county perspective on the municipal bond market and to estimate the impact of possible changes to the tax-exempt status of municipal bond interest on counties. This study discusses the importance of municipal bonds to infrastructure in the United States; the locally driven nature of the financing; the safety of municipal bonds as an investment; the relationship between issuers and investors; and how costs would be borne by counties, states, other local governments and their residents. Finally, the paper provides a series of cost estimates of a 28 percent cap and a repeal of the tax-exempt benefit of municipal bonds for counties and municipal issuers by state.
Counties, as wellas states, otherlocal governmentsand local/stateauthorities, would bedeeply affected bya change to thetax-exempt statusof municipal bondinterest.

Municipal Bonds Build America National Association of Counties
6
Background: the Municipal Bond Issuance Process in countiesSimilar to households, businesses or other governments, counties have three options when it comes to financing long-term purchases: pay from annual revenue, save up to pay for the project or borrow money. Most often, counties use a mix of these three options to build infrastructure projects such as schools, hospitals, roads or water facilities. For the debt part, usually county gov-ernments sell municipal bonds for which they pay investors the amount borrowed (the principal) and the agreed interest for a defined period of time.
Counties, states, localities and state/local authorities issue most of their municipal bonds for long-term governmental projects, which qualify for the exemption from the federal income tax. More specifically, the buyers of tax-exempt municipal bonds do not have to pay federal income tax on the interest earned on their investment. Counties and other non-federal governments and authorities issued $378.9 billion worth of long-term municipal bonds in 2012.5 In the same year, 88 percent of long-term municipal bond issuances were tax-exempt.6 Overall, the available municipal bonds (outstanding) in 2012 were valued at $3.7 trillion.7
This study uses the term “municipal bonds” to represent long-term tax-exempt municipal bonds in the analysis of the impact of changes to the tax-exempt status of municipal bond interest.
Municipal bonds are a form of financing, not funding. Counties, states, and local governments and authorities secure the funding source for their bonds either through general tax revenue (for general obligation bonds) or through the anticipated income resulting from the funded project (for revenue bonds). More than a third of 2012 municipal bond issuances were general obligation bonds, with the rest being structured as revenue bonds.8

National Association of Counties Municipal Bonds Build America
7
Municipal bonds are debt instruments used by counties and other state and local govern-ments and authorities to finance infrastructure projects.
Municipal bond issuances are municipal bonds that have been sold in a particular quarter/year. Not all of them are new munici-pal bonds, as some issuances are a refinance of previously issued municipal bonds. The total amount of municipal bonds issued during a particular quarter/year represents the “flow” value of the municipal bond market.
Municipal bonds outstanding are all the municipal bonds that are still being paid off, independent of when they were issued. The total amount of outstanding municipal bonds at one point in time represents the “stock” value of the municipal bonds market.
Tax-exempt status of municipal bonds means that the buyers of most municipal bonds do not have to pay federal income tax on the interest earned on their investment.
Governmental municipal bonds are tax-exempt bonds that meet several conditions, including that the issuer of a municipal bond has to show that no more than 10 percent of the proceeds from the municipal bond will be used by a private business and that no more than 10 percent of the revenues to repay the bond comes from a private business.9
General obligation bonds are municipal bonds repaid from the general tax revenue of the jurisdiction issuing the bond.
Revenue bonds are municipal bonds repaid from the anticipated income resulting from the funded project.
The proposed 28 percent cap on the tax-exempt status of municipal bond interest would limit the tax benefit for municipal bond holders in tax brackets above 28 percent. For example, an investor who is in the 33 percent federal income tax bracket would have to pay 5 percent federal income tax on the interest earned on previously tax-exempt municipal bonds.
The proposed repeal of the tax-exempt status of municipal bond interest would make all municipal bonds taxable, meaning that municipal bond investors would have to pay federal income tax on the interest earned on their investment.
Principal is the bond amount that a county or any other municipal bond issuer borrows from investors.
Price of a municipal bond is the actual amount that an investor pays to buy the municipal bond, which can be higher (at a premium) or lower (at a discount) than the principal.
Maturity is the date when a county or any other municipal bond issuer has to pay back the principal to bond investors.
Interest/coupon rate is the annual rate of compensation that a county or any other mu-nicipal bond issuer pays to the bond investors. This is a percentage of the principal.
Yield is the annual rate of return on municipal bonds. It is different from the bond interest rate because it takes into account the price paid by the bond investor and the length of time he/she held the bond. For example, on Jan, 1st an investor buys a bond with a principal of $1,000 and interest/coupon rate of 5 percent at a price of $950. After one year, the investor earns $50 in interest, which is equivalent to a yield of 5.26 percent ($50/$950).
key terMs used In thIs study

Municipal Bonds Build America National Association of Counties
8
how counties Finance Infrastructure with Municipal BondsThe 3,069 county governments differ in budget size, fulfilled functions and number of residents served. Notwithstanding, similar to state or other local governments, usually counties issue bonds when they need to finance infrastructure projects such as the construction of schools, roads,courthouses and other government buildings. Most often, county governments do not have enough cash to pay in full for an infrastructure project. Further, borrowing allows matching the life of the asset with the payment period.
In the simplest form, the bond process starts with the proposal of a new infrastructure project.10 Counties and the entities whose budgets are approved by the county government (depending on the state, for example, school districts, hospitals) keep track of the changes happening to the resident population in their jurisdiction to see if they need any new facilities. For example, based on projected student enrollment relative to the capacity of current facilities, a school district may assess when and where it needs a new school. The school district includes it in its strategic facilities plan, and if its budget requires county approval, it sends it to the county government. Often, the entity also proposes ways to fund/finance the new infrastructure project.
The division of the county government in charge of its finances (for example, county executive, budget administrator, finance director or treasurer) includes the proposal in the Capital Improve-ment Program (CIP), as part of the capital budgeting plan. State and local governments are
required to establish a capital budgeting plan by the General Accounting Service Board.11 In general, the county finance representative makes recommenda-tions on each item in the CIP regarding the validity of the case for a new facility and ways of financing/funding the project. At this point, the county assesses whether the project may be financed through municipal bonds based on the direct revenue sources available for building the project (county-based revenue, intra-governmental transfers), the county’s resource allocation across different purposes, the necessary revenue to back the bond financing and any limitations of county debt.
The division of the county government in charge of finances submits the CIP (in case of small counties, the specific bond proposals) and its recommenda-tions to the county legislative body. The legislative body reviews the proposals and decides if the item will be included in the capital budget and financed through a bond.
Sometimes, county residents are asked to approve a bond issuance, depending on the require-ments existent in the state constitution and county laws. If that is the case, the county puts the bond issuance for voter approval on the ballot in the following local/state/federal election. Most often, simple majority is sufficient for bond approval, but some counties (such as those in Califor-nia) require other type of majority. Once the county legislature and/or constituents approve a bond issuance, the county needs to structure the bond for sale. Often, large counties have in-house staff that structure the bonds
Counties issuebonds usually when they need to finance infrastructure projects such as the construction of schools, roads,courthouses and other government facilities.

National Association of Counties Municipal Bonds Build America
9
backed by the county’s taxes (general obligation bonds). Small counties that do little capital construction use financial advisors. In case of revenue bonds, most counties use financial advisors and feasibility consultants to estimate the project’s revenue that will secure the bond. In addition, counties use bond counsels for the legal work on structuring bonds.
Counties issue/sell municipal bonds in two ways: competitive or negotiated. They sell to under-writers, who are security firms or investment banks that act as brokers in the municipal bonds market. In a competitive sale, counties send a preliminary offering statement on the bond to underwriters ahead of sale. On the day of sale, underwriters submit their bids electronically and an automatic system selects the underwriter with the lowest interest rate offered for the bond. While this is the most commonly-used procedure for general obligation bonds, counties sometimes use negotiated sales in the case of more complicated revenue bonds. The county selects a group of underwriters and on the day of sale it negotiates the bond price, often helped by external financial advisors.
A county’s bond issuance process can take from three months to two years, depending on the type of bond and the county’s capacity to deal with bonds. Small counties have to plan much further in advance for their bond issuances, because they seldom issue bonds and do not have dedicated staff to deal with capital budgeting and bond issuances. Beyond the bond assessment and approval process, they need to hire external advisors and a bond counsel for legal work, complete the bond documentation, and get a bond rating. While the process lasts about three months for a large county, small counties have to start several months earlier and spend substantially before the bond hits the market. In the case of revenue bonds that require feasibility studies, the process may take up to two years.

Municipal Bonds Build America National Association of Counties
10
Findings1. Municipal bonds finance a wide range of locally selected infrastructure projects and have a long history of low default rates. Municipal bonds finance mostly long-term infrastructure projects.12 In contrast, Treasury bills — a market that is almost three times the size of the muni market — finance both operating and capital expenses, as the federal government does not have a separate capital budget.13
Counties, states and other localities are the stewards of infrastructure in the United States. By accessing the municipal bond market, they try to meet the rapidly growing needs of an aging infrastructure system and continuing demands of the public. Between 2003 and 2012, counties, states, localities and state/local authorities invested $3.2 trillion through municipal bonds. In contrast, the federal government provided $1.3 trillion in support of public works, through direct spending, grants to states and localities, and the exclusion of the municipal bond interest payment from the federal income tax (SEE FIGURE 1).
Unlike taxable bonds, the tax-exempt municipal bond market allows the financing of both small and large infrastructure projects, from the less than $1 million library in a small county to the
cAse study #1
FIgure 1. Municipal Bond Issuances and Federal Government Support for Infrastructure | Trillion Dollars, 2003-2012
Sources: Thomson Reuters, Feb. 2013; OMB, Table 9.2—Major Public Physical Capital Invest-ment Outlays in Current and Constant (FY 2005) Dollars: 1940–2014; Congressional Research Service, Tax-Exempt Bonds: A Description of State and Local Government Debt, 2012; OMB, Table 16-1. Estimates of Total Income Tax Expenditures For Fiscal Years 2012-2018.
FiGUres iN TrillioNs
● Long-Term Tax-Exempt Muni Bonds● Federal Tax Exclusion of the Interest
on Muni Bonds ● Direct Federal Nondefense Invest-
ment in Public Works● Federal Grants for Public Works

FrAnklIn county, ohIo 16 Franklin County, Ohio, home to about 1.2 million residents, is the 30th largest county in the United States and part of the Columbus, Ohio metropolitan area. The county had about $257.2 million in outstanding general obligation tax-exempt municipal bonds in 2012 and did not issue any bonds last year.
If the tax exemption on municipal bond interest were capped to 28 percent during the last 15 years, the county would have had to pay about $1.5 million additionally in interest in 2012 alone. The 2012 interest payment would have increased by $4.3 million if the tax exemption were not in place over the last 15 years.17 As a result, the county would have less money to allocate to vital public safety, community security, justice, and health/human service programs.
The county’s current municipal bonds finance a variety of infrastructure purposes, from courthous-es, roads and energy conservation to sanitary engineering projects. One of the county’s largest projects funded with tax-exempt municipal bonds is the Common Pleas Courthouse, the state’s first Leadership in Energy and Environmental Design (LEED) certified county courthouse. Another infrastructure bond is a 2010 $2.22 million issuance for the rehabilitation of two aging sanitary sewer facilities (Taylor Estates and Holton Park), necessary to improve sewer services for residents within un-incorporated areas of the county as well as meeting compliance standards set by the Ohio Environmental Protection Agency for the treatment of wastewater.
The county’s bond issuances do not require voter approval as long as each bond issuance for the county and other jurisdictions in the county stays within 10 mills of property tax for specific purposes, based on the Ohio Revised Code debt limitations.18
The county limits the debt service on general obligation bonds to 5 percent of the total resources available in the General Revenue Fund, which includes the forecasted annual revenue and unobli-gated cash from the previous year. Given that the county’s current tax-exempt debt is general obligation, this debt affordability rule applies to all the county’s tax-exempt bonds. By following this rule, the county closely aligns with the State of Ohio policy on debt affordability. Its conser-vative approach to debt affordability and an excellent track record has earned the county an AAA rating from both Moody’s and Standard & Poor’s Corp.’s (S&P) rating agencies since 1993.
The county takes advantage of its AAA bond rating and employs competitive sales on new money issuances and negotiated sales on refunding bonds. Most of the county’s investors are mutual funds and insurance companies.
cAse study 1
National Association of Counties Municipal Bonds Build America
11

Municipal Bonds Build America National Association of Counties
12
FIgure 2. Municipal Bond Approval Rates, Issuance and Volume | By Type of Bond Issuer, November 2012
Source: Bond Buyer, Bond Election Results Nov. 2012, 2013.
billion dollar toll road in a large county. About 10 percent of outstanding municipal bonds are for projects under $1 million.14 Between 2003 and 2012, counties, states and other localities invested $1.65 trillion in new infrastructure projects among the largest 21 infrastructure categories (SEE FIGURE ON PAGE 4). About half of this investment financed school and hospital construction, with another quarter for water and sewer facilities and roads.15 Counties such as Franklin County, Ohio, use the municipal bonds to finance a variety of infrastructure purposes, sometimes to comply with federal and state regulations (SEE CASE STUDy 1).
Municipal bonds have a ground-up approval system, a unique feature on the bond market. The legislative body of a county government has to approve a bond issuance, and sometimes the constituents are asked for their vote. The federal government and corporations do not go through this process. If Treasury bonds would follow a similar approval system as municipal bonds, Congress would have to approve every Treasury bill issuance and occasionally require a national referendum.
Counties’ legislatures approve the projects submitted by the county executive body for debt financing as part of the capital budget.19 Sometimes, counties cannot issue the bonds before they obtain voter approval in states such as Alaska or Arizona. Some states are very specific — in Oklahoma, counties may not contract debt to exceed the expected revenue for the coming fiscal year without an election and approval of three-fifths of the electors voting in that election.20
● Bond Issuance Approval Rate● Bond Volume Approval Rate

National Association of Counties Municipal Bonds Build America
13
Voters approve investment in infrastructure financed through municipal bonds. Seventy-nine (79) percent of the projects submitted for voter approval passed in Nov. 2012. Education — mainly school construction — represented half of the number of projects submitted for voter approval.21 Among localities, counties were the bond issuers with the highest approval rates, both by number of issuances and value of projects approved (SEE FIGURE 2).
Residents approve municipal bonds on the ballot because they can see the tangible results of a municipal bond — a school building, a road, a courthouse, a hospital or another piece of infra-structure. For example, residents of Fairfax County, Va., approved a $120 million transportation bond on Nov. 2, 2010, debt used to pay the county’s required contribution to the Washington Metropolitan Transit Authority’s CIP. The transit authority has a six-year CIP aimed at replacing the current buses and subway cars, building new bus garages, and improving its entire system for increased safety.22
Municipal bonds are safe investments. Municipal bonds of all levels of Moody’s credit ratings had lower default rates than corporate bonds between 1970 and 2012 (SEE TABLE 1). For example, municipal bond issuers of Baa credit rating had 0.3 percent default rate, higher than corporate issuers of Aaa rating. Even during the Great Recession, when counties and other municipal bond issuers had a hard time making ends meet, the municipal bonds defaults remained at low levels. From 2010 through May 2013, the municipal bonds default rate (rated and unrated bonds togeth-er) was 0.4 percent.23
Municipal bonds constitute a safe investment because counties, states and local governments and authorities issue bonds specifically to finance infrastructure. In comparison, corporate bond proceeds often go unspent, when they are used to leverage the existing company’s cash resources
1 year 3 years 10 years
Rating/IssuerCorporate
Issuers
Municipal Bond
Issuers
Corporate Issuers
Municipal Bond
Issuers
Corporate Issuers
Municipal Bond
IssuersAaa 0.00% 0.00% 0.01% 0.00% 0.50% 0.00%Aa 0.02% 0.00% 0.14% 0.00% 0.92% 0.01%A 0.06% 0.00% 0.41% 0.01% 2.48% 0.05%
Baa 0.18% 0.01% 0.90% 0.06% 4.74% 0.30%Ba 1.13% 0.18% 5.44% 0.92% 19.72% 2.85%B 4.13% 2.21% 15.29% 6.14% 42.00% 13.88%
Caa-C 16.85% 5.77% 37.21% 9.67% 69.63% 12.66%
tABle 1. Cumulative Default Rates by Initial Moody’s Rating, Corporate Issuers and Municipal Bond Issuers | 1970-2012
Notes: The cumulative default rates are one-year, three-year and ten-year averages between 1970 and 2012 for municipal issuers and corporate issuers. Source: Moody’s Investors Service, Inc., US Municipal Bond Defaults and Recoveries, 1970-2012, May 2013.

Municipal Bonds Build America National Association of Counties
14
as a way to merely increase the company cash ratio. Further, the market taxes any missteps in fiscal stewardship at the local level in two ways:
h Credit agencies lower the credit ratings of the municipal bond issuer and consequently the local or state government/authority faces higher borrowing costs for its future debt, and
h Investors reduce their future purchases of bond issuances or demand greater yield from issuers unable to keep their loan commitments.
Often, counties face state constitutional limitations on the amount of debt they can issue. For example, in Michigan, no county may go into debt to exceed 10 percent of the assessed valuation of the property within the county’s corporate limits. While counties have the power to tax, they often cannot raise their taxes without the approval of their constituents. Further, some states limit the annual increases in local taxes. For example, California’s Proposition 13 limited property tax increases to no more than 2 percent per year as long as the property was not sold.24 Many of the municipal bond issuers cannot solve a bond default through bankruptcy like corporations. States cannot file for bankruptcy and 26 states prohibit their municipalities from filing for bankruptcy.25
Municipal bonds represent the main financing tool for infrastructure in the United States. In addi-tion, they respond to locally identified needs, and voters often approve the infrastructure projects proposed for bond financing. Municipal bonds have maintained a track record of low default rates — including throughout the Great Recession — better than taxable corporate bonds. There are numerous market mechanisms, state constitutional limitations and local administration rules that ensure counties follow a conservative approach to debt.
National Association of Counties Municipal Bonds Build America
15
2. Any tax imposed on currently tax-exempt municipal bond interest will affect all Americans, as investors in the municipal bonds and as taxpayers securing the payment of municipal bonds.The federal tax-exempt status of municipal bond interest aligns closely the issuers of municipal bonds and their investors. Because of the federal tax exemption (and in most states, a state exemption), investors are willing to buy municipal bonds that pay less in interest relative to other securities. Therefore, counties and other municipal bond issuers finance their infrastructure at lower debt service costs than they would be able to if the federal exemption did not exist.
Counties are involved in the municipal bond market both as issuers of debt and as funders of debt issued by other entities. As issuers, counties accounted for about 6.2 percent of the municipal bond issuances in 2012.26 Counties finance with municipal bonds both their capital needs and the necessities of the local entities whose budgets they approve (SEE CASE STUDy 2). Further, counties secure the funding of other bonds, such as state and local authorities’ bonds. For example, Baltimore City, Md., will contribute $20 million annually to fund a 2013-approved $1.1 billion Maryland state authority bond to finance school construction in the city.27
Both large and small counties can access the municipal bonds to finance their infrastructure needs, because of the tax exemption and other specific characteristics of municipal bonds. In 2011, 44,000 state and local entities had over one million different municipal bonds outstanding. In contrast, there were fewer than 50,000 different corporate bonds.28 Smaller issuers, mostly rural issuers, can finance projects of less than $1 million and have lower debt payments. For example, Roscommon County, Mich. — a county of about 25,000 residents — paid $15,431 in interest on its debt in 2012.
American households are the largest holders of municipal bonds. Households own 45 percent of all municipal bonds, with mutual funds (that act as proxies for households) holding another 29 percent.29
One of the main reasons Americans buy municipal bonds is to diversify their retirement portfolios. Half of the Americans who hold municipal bonds are people over 65 years old and another 23 percent are people between 55 and 65 years old. Households invest in municipal bonds because they are safe and because they are more familiar with them than with other securities when they purchase bonds of the jurisdictions in which they live. Most states also exempt interest gained on municipal bonds from state income tax but only if they are issued by entities within the state. As a result, most holders of municipal bonds invest in bonds that fund projects within their jurisdiction or their state.30
Americans of all incomes invest in essential infrastructure with the help of municipal bonds. In 2010, 84 percent of Americans who benefit from the tax-exempt status of municipal bond interest earned less than $250,000 annually (SEE FIGURE 3). Slightly less than half of the tax-exempt income (47.5 percent) went to households earning more than $250,000.
Any change to the tax-exempt status of municipal bond interest would have a double effect on American households. If municipal bonds lose the tax-exempt status, all municipal bondholders would have to pay federal income taxes on the interest earned on new investment in municipal bonds. Alternatively, in case of a 28 percent cap, only investors in tax brackets above 28

Municipal Bonds Build America National Association of Counties
16
percent would have to pay the difference between their federal income tax rate and 28 percent on their interest earned on their holdings of municipal bonds. Most investors in municipal bonds are American households; therefore, the change to the tax-exempt status of municipal bond interest would have a direct impact on American households’ retirement plans and asset formation.
But this is only the direct effect. Americans also secure with their state and local taxes the payment of municipal bonds. Any cap or repeal of the tax-exempt status will affect issuers such as counties. Investors who would have to start paying federal taxes on their earned interest would sell at least part of their holdings to invest in higher-return assets. With less demand for municipal bonds, counties, states and localities will have to pay more for their debt. For the new investors, coun-ties would have to offer higher interest rates to compensate for the federal taxes and additional investor protection elements to make municipal bonds comparable with other taxable bonds such as corporate debt. This increase in costs will be ultimately borne by taxpayers.
The federal government would raise a minimal amount of money with a cap or repeal of the tax-exempt status of municipal bond interest. The 2014 federal budget estimated the foregone federal tax for municipal bonds at $26 billion in 2012.33 This assumes that all the holders of the current stock of municipal bonds would continue to keep their municipal bonds even if they had to pay federal taxes on them. In fact, investors, especially those in the higher federal income tax brackets, will diversify away from municipal bonds into lighter-taxed assets such as corporate stocks with low dividend returns. With some of the investors choosing to sell their municipal bonds turned taxable, the federal government may accrue at most between $7.9 and $10.9 billion in case of a full repeal, about a third of the 2014 federal budget estimation.34
FIgure 3. Share of the Number of All Returns Reporting Tax-Exempt Interest Income in 2010 | By Size of Adjusted Gross Income
Source: IRS, Table 1.4 All Returns: Sources of Income, Adjustments, and Tax Items, by Size of Adjusted Gross Income, Tax Year 2010.

National Association of Counties Municipal Bonds Build America
17
MontgoMery county, Md. 31
Montgomery County, Md., is one of the few counties in the country with more than one million residents and is part of the Washington, D.C., metropolitan area. The county had about $2.2 billion in outstanding tax-exempt municipal bonds and issued $295 million in tax-exempt general obliga-tion bonds as of June 2012. The county’s strong fiscal stewardship earned it an AAA credit rating.
Half of the county’s current municipal bonds finance public schools, because the county approves the budgets of school districts. Transportation is the second-largest infrastructure purpose for the county, with one-fifth of the 2012 bond issuances financing transportation projects.
The county’s council approves all tax-exempt bond issuances, as part of the capital budget. If a bond issuance is above $13 million–$14 million (adjusted to inflation), the county council needs to pass a law in order to issue debt. Voters can petition projects to referendum.
The county uses a spending-affordability approach to capital budgeting, based on which the an-nual bond interest payment (together with lease payments) should not be higher than 10 percent of the operating budget. In addition, the county pays upfront another 10 percent of the planned bond issuance as a type of down payment. This approach includes a variety of measures of debt affordability such as:
h Debt should not exceed 1.5 percent of the market value of taxable real property. h Real debt per capita should be maintained between $1,000–$2,000. h The ratio of debt to total personal income should not exceed 3.5 percent. h Two-thirds (between 60 percent and 75 percent) of debt at the beginning of any given period
should be paid off within 10 years.
The county takes advantage of its AAA bond rating and employs competitive sales on general obligation issuances and negotiated or competitive sales on revenue bonds. Most of the county’s investors are households.
If the benefit from the tax exemption of municipal bonds were capped to 28 percent during the last 15 years, the county would have had to pay about $14.1 million additionally in interest in 2012. The 2012 interest payment would have increased by $40.2 million, if the tax exemption were repealed over the last 15 years.32 As a result, the county would have had to either delay or not complete certain infrastructure projects, given its limits on debt service relative to the operating budget.
cAse study 2

Municipal Bonds Build America National Association of Counties
18
A 28 percent cap would produce even less than the estimated cost of repeal, given that the cap would not tax investors in the federal tax brackets below 28 percent and would not impose the full federal tax rate for higher-income tax brackets, but only the difference between the federal tax bracket and 28 percent. For example, municipal bondholders in the 33 percent tax bracket would pay a federal income tax of 5 percent on municipal bond interest and those in the 35 percent tax bracket would pay 7 percent.
Is the cap the run-up before a repeal? The federal income tax exemption of municipal bond interest has been in existence since the current tax code was enacted 100 years ago. Given that its basis is statutory and not constitutional, an introduction of a cap, and especially a retroactive cap, may open the door to a full repeal of tax-exempt status in future years. This will induce an additional cost for issuers, a “tax risk premium” to compensate buyers of municipal debt for the risk that the benefit of the municipal bonds might be further diminished.
The example of commercial banks in the 1980s is instructive. Until 1982, commercial banks could deduct from their taxable income the interest paid on municipal bonds. The 1982 Tax Equity and Fiscal Responsibility Act capped the benefit to 85 percent of the interest paid. Another statute two years later (the 1984 Deficit Reduction Act) further reduced the tax advantage for banks to 80 percent of interest paid on municipal bonds. Only four years after the initial cap, the 1986 Tax Reform Act eliminated deductions by banks of interest earned on municipal bonds.35 Commercial banks drastically reduced their investments in municipal bonds as a result (SEE FIGURE 4).
FIgure 4. Top Five Holders of Municipal Bonds, Share of Municipal Bonds Outstanding | 1960–2012
Notes: The category “insurance companies” combines municipal bond holdings of property-casualty insurance companies and life insurance companies. These data reflect the Dec. 2011 Federal Reserve revisions of the outstanding municipal debt data starting with 2004. The Federal Reserve did not apply the new method to revise estimates for municipal bonds outstanding before 2004.Source: Federal Reserve, Flow of Funds Accounts, March 2013.
Households Mutual Funds
Commercial Banks Money Market Funds
Insurance Companies
1960 2012

National Association of Counties Municipal Bonds Build America
19
3. the 2012 debt service burden for counties would have risen by $9 billion if the municipal bonds were taxable over the last 15 years and by about $3.2 billion in case of a 28 percent cap. Overall, the 3,069 counties would have paid $3.2 billion in additional interest payments in 2012 with a 28 percent cap on the benefit of their tax-exempt municipal bonds over the last 15 years and $9 billion in case of a repeal of the tax-exempt status over the same period (SEE TABLE 2). These are average effects based on historical market conditions; the cost of a cap or a repeal would have varied based on the size of the issuer, the credit rating of the issuer and the specific characteristics of the bond issuance.
Taxpayers would have shouldered the additional cost ultimately. One way to balance the budget with an increased debt service is to cut operational expenditures. Lower operational expenditures means less capacity for a county to deliver services to its residents. Another way to accommodate the increase in debt would have been to forego or delay infrastructure projects, affecting the county’s ability to keep up with aging infrastructure and residents’ needs. Finally, for counties that are not bound by state limitations of local tax increases, a possibility, never popular, would have been to increase property or sales taxes to generate more revenue.
Both small, rural counties and large, urban counties would have been affected by a change to the tax-exempt status of municipal bond interest (SEE MAP 1).
FiGUres iN MillioNs
● 12.1 – 64.2● 1.31 – 11.6 ● 0.22 – 1.3● 0.07 – 0.22● less than 0.07
MAP 1. Estimated Cost of a 28 Percent Cap of the Tax-Exempt Benefit of Municipal Bond Interest for Counties | 45 Surveyed Counties, 2012
The cost estimates for all municipal bond issuers are average effects based on historical market conditions; the cost of a cap or a repeal would vary from these averages based on the size of the issuer, the credit rating of the issuer and the specific characteristics of the bond issuance.Sources: NACo analysis of 2012 county interest payments on tax-exempt municipal bonds collected for 45 counties.

Municipal Bonds Build America National Association of Counties
20
tABle 2. Estimated Cost of a 28 Percent Cap or a Repeal of the Tax-Exempt Benefit of Municipal Bonds for Counties, Top 10 Surveyed Counties, 2012
Notes: The estimated cost of a 28 percent cap to the benefit of the tax-exempt status of municipal bond interest to counties is how much more counties would have had to pay in interest in 2012 if the cap were in place over the last 15 years.The estimated cost of a repeal of the benefit of the tax-exempt status of municipal bonds to counties is how much more counties would have had to pay in interest in 2012 if municipal bonds were fully taxable over the last 15 years.The cost estimates for all municipal bond issuers are average effects based on historical market conditions; the cost of a cap or a repeal would vary from these averages based on the size of the issuer; the credit rating of the issuer; and the specific characteristics of the bond issuance. Large counties have more than 500,000 residents, small counties have less than 50,000 residents and the rest qualify as medium-sized counties.Sources: NACo analysis of 2012 county interest payments on tax-exempt municipal bonds; U.S. Census Bureau, 2012 Population Estimates; U.S. Census Bureau, American Community Survey 2011 5-year estimates.
Rank County County
Population Type
Population, 2012
estimated cost of 28 percent
cap, 2012 (millions)
estimated cost of
repeal, 2012 (millions)
1City and County of San Francisco, Calif. Large 825,863 64.2 183.4
2Philadelphia City-County, Pa. Large 1,547,607 53.2 152.0
3 King County, Wash. Large 2,007,440 32.5 93.0
4Boston/Suffolk County, Mass. Large 744,426 19.6 55.9
5 Fairfax County, Va. Large 1,118,602 14.6 41.86 Montgomery County, Md. Large 1,004,709 14.1 40.27 Mecklenburg County, N.C. Large 969,031 13.6 38.9
8Anchorage Municipality, Alaska
Medium-Sized 298,610 13.1 37.3
9 Baltimore City, Md. Large 621,342 12.4 35.510 Shelby County, Tenn. Large 940,764 11.6 33.1
45 surveyed counties 20,543,020 280.4 801.23,069 counties 296,048,214 3,162.7 9,036.2Large Counties 137,776,040 1,998.1 5,708.8Medium-sized counties 118,534,786 907.7 2,593.4Small Counties 39,737,388 256.9 733.9

National Association of Counties Municipal Bonds Build America
21
BAltIMore cIty, Md. 37
Baltimore City, Md., is a rare case of local government: While an independent city, Baltimore City fulfills county functions and therefore is treated as a county equivalent under Maryland law. The city is not part of Baltimore County, which is a separate government entity.
Part of the Baltimore, Md., metropolitan area, the city had 621,342 residents in 2012, which placed it among the most populous 100 counties in the United States. The city had about $2.5 billion in outstanding tax-exempt municipal bonds in 2012 and paid about $83.4 million in interest on its debt in the last fiscal year.
If the tax exemption on municipal bonds were capped to 28 percent during the last 15 years, the city would have had to pay about $12.4 million additionally in interest in 2012. The 2012 interest payment would have increased by $35.5 million if the tax exemption were repealed.38
The city invests its tax-exempt bond proceeds in numerous infrastructure purposes, with water and wastewater projects, such as correction of sanitary sewer overflows, representing the largest infrastructure category.
Issuance of general obligation bonds requires voter approval, while the city issues revenue bonds based on city council ordinances. Both households and institutional investors hold Baltimore City municipal bonds.
The city not only issues bonds but also contributes to securing funding for other bonds that finance projects in the city. Baltimore City will contribute $20 million annually to fund a future $1.1 billion Maryland state authority bond to finance school construction. On May 16, 2013, Governor Martin O’Malley signed into law the Baltimore City Public School Construction and Revitalization Act of 2013, a 10-year school construction plan. The State of Maryland and the city school system will also each contribute $20 million annually to secure the funding of the school bonds.39
cAse study 3

Municipal Bonds Build America National Association of Counties
22
Smaller counties would have been most at risk to lose access to the municipal bond market. These counties issue small bonds occasionally and investors have less information on the characteristics and history of each of these issuers. As a result, small counties’ bonds are not as liquid as bonds from large issuers, and small counties have to pay more to investors to buy their bonds. For example, Belmont County, Ohio, is considering upgrading its wastewater treatment plant, using proceeds from a potential $5 million bond. Even in the current low interest rates environment, the smaller county would have to pay an increase of 3 to 4 percent over the life of the project if municipal bonds were entirely taxable, which would make the bond cost-prohibitive.36
Large counties (with more than 500,000 residents) would have borne more than half of the cost, on average. For example, the City and County of San Francisco, Calif., would have had to pay $64.2 million more in interest in 2012 in the case of a 28 percent cap over the last 15 years and $183.4 million if all municipal bonds were taxable over the same period (SEE TABLE 2). Most of the top 10 surveyed counties with the largest cost of a 28 percent cap are large counties, such as Baltimore City, Md. (SEE CASE STUDy 3).
FiGUres iN BillioNs
● $4.4 – $24.4● $2.3 – $4.3 ● $1.6 – $2.2● $0.6 – $1.5● $0.1 – $0.5
MAP 2. Estimated Cost of a 28 Percent Cap of the Tax-Exempt Benefit of Municipal Bonds for the Largest 21 Infrastructure Purposes | By State, 2003-2012
Notes: The cost by state reflects the cost of a 28 percent cap to all the municipal bond issuers in a state – not only the cost to the state government. The study calculates the cost by state based on long-term tax-exempt municipal bonds for 21 infrastructure purposes, excluding refunding.The cost estimates for all municipal bond issuers are average effects based on historical market conditions, the cost of a cap or a repeal would vary from these averages based on the size of the issuer, the credit rating of the issuer and the specific characteristics of the bond issuance. Source: NACo analysis of Thomson Reuters Feb. 2013 data.

National Association of Counties Municipal Bonds Build America
23
But smaller, medium-sized counties such as Anchorage Municipality, Alaska would also have felt the pressure of added debt service. Home to about 300,000 people (a medium-sized county), the county would have paid $13.1 million additionally in the case of a 28 percent cap in 2012, more than much larger counties in the lower 48 states (SEE TABLE 2). This reflects Anchorage Munici-pality’s prominent role in building infrastructure in the area, from financing school construction, electric utilities, to water and wastewater facilities.
Large or small, issuers with weaker credit ratings (or unrated) would have had to pay more to investors than average estimates suggest. The average estimates in this study use the Bond Buyer 20-Bond Index as a base, which has an average rating equivalent to Standard & Poor’s Corp.’s AA. For weaker-rated entities such as the City-County of Philadelphia, the additional costs would be higher than the estimates in this study.
But this is not only about counties. Any change to the tax-exempt status of municipal bonds would limit the capacity of all municipal bonds issuers (counties, states, localities and state/local authorities) to deal with the infrastructure needs of their jurisdictions.
Counties, states, localities and state/local authorities would have paid $173.4 billion in additional interest payments between 2003 and 2012 with a 28 percent cap on the benefit of their tax-exempt municipal bonds for the largest 21 infrastructure purposes in the last 10 years and almost $500 billion in case of a repeal of the tax-exempt status of municipal bond interest during the same period (SEE METHODOLOGICAL APPENDIx for a delineation of the 21 largest infrastructure purposes and an explanation of estimates).
The cost estimates for all municipal bond issuers are average effects based on historical market conditions, the cost a cap or a repeal would have varied based on the size of the issuer, the credit rating of the issuer and the specific characteristics of the bond issuance.
The cost of any change to the tax-exempt status of municipal bond interest varies significantly across the country. Municipal issuers in large states such as California, Texas and New york would be the most affected by changes to the tax-exempt status, based on the large volumes of munic-ipal bonds issued in these states over the last ten years (SEE MAP 2). For example, counties and other municipal issuers in Texas would have had to pay $20.3 billion more in interest for the 21 largest infrastructure purposes over the last decade if a 28 percent cap were in place (SEE TABLE 3).
Small and large counties and other municipal bond issuers (states, other local governments, state and local authorities) would feel the burden of increased debt service cost. The costs would find their way to taxpayers — through cuts in state and local government services, delayed or foregone infrastructure projects, or direct increases in state and local taxes.

Municipal Bonds Build America National Association of Counties
24
tABle 3. Estimated Cost of a 28 Percent Cap and Cost of Repeal of the Tax-Exempt Benefit of Municipal Bonds for the Largest 21 Infrastructure Purposes | Top 10 States, 2003-2012
Notes: The United States total reflects 50 states, the District of Columbia and U.S. territories. The cost by state reflects the cost of a 28 percent cap or a repeal borne by all the municipal bond issuers in a state. The study calculates this cost by state based on long-term tax-exempt municipal bonds for 21 infrastructure purposes, excluding refunding.The cost estimates for all municipal bond issuers are average effects based on historical market conditions, the cost of a cap or a repeal would vary from these averages based on the size of the issuer, the credit rating of the issuer and the specific characteristics of the bond issuance. Source: NACo analysis of Thomson Reuters Feb. 2013 data.
Rank State
estimated cost of a 28 percent cap on the benefit of the tax-
exempt status of municipal bond interest, 2003–2012 (billions)
estimated cost of a repeal of the tax-exempt status
of municipal bond interest, 2003–2012 (billions)
1 California $24.4 $69.82 Texas $20.3 $58.03 New York $15.7 $44.94 Florida $10.8 $30.95 Pennsylvania $8.0 $22.96 New Jersey $6.6 $18.87 Illinois $6.2 $17.88 Washington $5.2 $14.99 Ohio $5.2 $14.810 Michigan $4.9 $13.9
United states $173.4 $495.3

National Association of Counties Municipal Bonds Build America
25
conclusionMunicipal bonds are the largest financing mechanism for U.S. infrastructure that puts the selec-tion, approval, financing and funding in the hands of state and local entities. Bound by market mechanisms, state constitutional limitations and local administration rules, counties and other municipal bond issuers follow a conservative approach to debt. As a result, municipal bonds have maintained a track record of low default rates, including throughout the Great Recession.
Any tax imposed on currently tax-exempt municipal bond interest will affect all Americans, as investors in the municipal bonds and as taxpayers securing the payment of municipal bonds. American households hold almost three-quarters of the municipal bond market, mostly for retirement plan diversification and as a way to invest in their communities. A cap or a repeal of the tax-exempt status would deeply affect Americans’ retirement nests and asset formation. In the same time, the higher debt service would impact counties and other state and local governments’ budgets and their ability to deliver services to all of their residents.
Counties, as all the other municipal bond issuers, would feel the full effect of the change to the tax-exempt status. This study estimates that counties would have paid $3.2 billion more in interest in 2012 in case of a 28 percent cap to the tax-exempt benefit of municipal bonds over the last 15 years. Counties’ debt service burden would have risen by $9 billion in case of a repeal of the tax-exempt status of municipal bond interest.
Counties welcome additional funding and financing tools for infrastructure because of the numer-ous needs of the U.S. infrastructure system. However, the creation of these tools should be additive and not substituted for the successful, well-established tax-exempt municipal bond market that provides access to an unmatched range of issuers, especially small issuers.
The U.S. municipal bond market is unique in the world because of its high liquidity for a sub-national debt market, longevity and track record of low failure rates. At a time when other countries are looking into ways to create sub-national debt markets and decentralize funding and financing infrastructure, the U.S. federal government is trying to reverse a history of 100 years of tax-exemption of municipal bonds. Especially in this fragile recovery when counties, states and localities are still reeling from the effects of the recession, there has never been a worse time to start than now.
Any tax imposed on currently tax-exempt municipalbond interest will affect all Americans, as investors inmunicipal bonds and as taxpayers securing the payment of municipal bonds.

Municipal Bonds Build America National Association of Counties
26
This study follows the 28 percent cap and repeal cost methodology employed in the Feb. 2013 joint report by the National Association of Counties, U.S. Conference of Mayors, and the National League of Cities.40 It calculates the cost in two ways:
1 – For the estimates of a 28 percent cap and repeal cost for all municipal bond issuers, it estimates how much the municipal bond issuers in a specific state — not only the state government — would have had to pay additionally in interest for their tax-exempt municipal bonds between 2003 and 2012 if a cap/repeal were in place over the last decade. The same methodology was employed in calculating the cost for U.S. long-term, tax-exempt municipal bonds.
2 – For the estimates of a 28 percent cap and repeal cost of municipal bonds for counties, this research estimates how much more county issuers would have had to pay in interest in 2012 if a 28 percent cap/repeal of their tax-exempt municipal bond interest were in place over the last 15 years.
The county and state/national cost estimates are not comparable because they are calculated with different methods, applied to different municipal bond indicators and extended over different time horizons (SEE TABLE A1). While it would have been preferable to have comparable estimates across different types of municipal bond issuers, it is difficult to collect data on tax-exempt municipal bond issuances for each year between 2003 and 2012 at county level in a reasonable timeline.
Over the last decade, counties and other state/local governments and authorities financed more than $1.65 trillion in major infrastructure projects with municipal bonds (SEE FIGURE ON PAGE 4). These represent the largest 21 infrastructure purposes by the cumulative long-term tax-exempt bond issuances between 2003 and 2012, excluding refunding.
This research calculates the cost of a 28 percent cap by adding 70 basis points (bps) to the base inter-est rate and estimates the cost of a repeal by adding 200 bps to the base interest rate. The increase in the interest rate by 70 bps in case of a 28 percent retroactive cap reflects the additional interest necessary for tax-exempt bond yields to reach similarly rated taxable bonds yields in normal market conditions (based on 1991–2012 data on yields of AA-rated general obligation tax-exempt bonds and yields of AA corporate bonds).41
For a repeal, the additional 200 bps to the interest rate reflect not only the difference in return with similarly rated taxable bonds in normal market conditions, but also additional costs incurred by tax-exempt bonds to become substitutable with taxable bonds. Beyond the federal tax-exempt status, there are two major structural differences between municipal bonds and taxable bonds:42
1 – Municipal bonds are less liquid than taxable bonds because they are issued in small amounts — each with its own maturity (so-called “serial maturity”) — instead of large issuances with a single maturity. Because of the small amounts, municipal bonds have high transaction costs, and investors cannot sell them as quickly as taxable bonds (such as corporate debt or Treasury bills). Other factors contribute to the low liquidity of municipal bonds, including the heterogeneity of the municipal bond market (an aggregate of 50 state municipal bond markets) and the inability to hedge municipal bonds. As a result, investors require extra interest (“liquidity premium”) — about 25 bps for average municipal bond issuers, but can be upwards of 35-40 bps for smaller issuers such as small and medium-sized counties.
MethodologIcAl APPendIX

National Association of Counties Municipal Bonds Build America
27
tABle A1. Assumptions for the Estimation of the Cost of a 28 Percent Cap or a Repeal of the Tax-Exempt Status of Municipal Bond Interest for Counties and for All Municipal Bond Issuers
Cost estimates for Counties
Cost estimates for all Municipal Bond issuers
applied to
County 2012 interest payment on all of the county’s outstanding tax-exempt municipal bonds
Cumulative value of long-term, tax-exempt municipal bond issuances for the largest 21 infrastructure purposes between 2003 and 2012, excluding refunding
Cost estimate for 2012 2003–2012estimated cap/repeal in force over
1998–2012 2003–2012
Base interest rate
Median value of the Bond Buyer 20-Bond Index over the 15-year period 1998–2012
Median value of the Bond Buyer 20-Bond Index for the year of issuance between 2003 and 2012
estimated additional average interest rate cost in case of a 28 percent cap
70 bps 70 bps
estimated additional average interest rate cost in case of a repeal of the tax-exempt status
200 bps 200 bps
Does the additional average interest rate cost vary with the credit rating or the size of the issuer?
No No
Average maturity of a munici-pal bond
15 years 15 years
source of municipal bond data County-collected data Thomson Reuters, Feb. 2013 vintage
2 – Municipal bonds offer more flexibility to issuers than taxable bonds. Municipal bonds have a 10-year optional call, which means that after 10 years the municipal bond issuer can buy back the bond at the same price as it sold it a decade previously. This diminishes the interest rate risk for the issuers and its taxpayers, as the issuer can refinance if the interest rates are lower or if it needs to restructure its debt. Taxable bonds have “make-whole” calls, which make it very difficult for the issuer to buy back the bond without a significant premium.43 If the issuer of tax-exempt municipal bonds wants to keep this feature once it loses its tax-exempt status, it has to compen-sate investors in taxable bonds with at least 25 bps additionally.
The additional 200 bps to the interest rate reflects the average spread between a AA-rated 20 years municipal bond and AA-rated 20 years corporate bond over the last 22 years (135 bps), the liquidity premium (25 bps–40 bps), and the optional call cost (25 bps). The cost estimates for all municipal bond issuers are average effects based on historical market conditions, the cost of a cap or a repeal would vary from these averages based on the size of the issuer, the credit rating of the issuer and the specific characteristics of the bond issuance.

Municipal Bonds Build America National Association of Counties
28
The estimates assume normal market conditions, based on historic data, because the estimated costs in this study are retrospective and because the current market conditions are an exception in long-term trends. Under current market conditions, the estimated cost would be significantly lower, given the low interest rate environment generated by quantitative easing in the United States and abroad.44 As a result, taxable bonds (both the Treasury bills and corporate bills) have very low yields currently, closing the yield spread with tax-exempt municipal bonds. However, this situation is temporary, because the goal of quantitative easing is a provisional boost to the economy in times of recession and weak recovery. Otherwise, quantitative easing would produce rampant inflation in the economy.
Together with the Government Financial Officers Association, this study collected 2012 interest payment data from 45 counties that represent 7 percent of the resident population served by the 3,069 county governments. This study uses the distribution of households by county population types from the universe of 3,069 county governments and an average cost per household by county population types from the sample to estimate the cost of a cap or a repeal for the 3,069 counties and for the main three groups of counties (SEE TABLE A2).
This study estimates based on average effects, which is a major simplification in a field such as mu-nicipal bonds, where rates and characteristics are unique to each bond issue. However, every attempt has been made to produce conservative estimates of the costs of a 28 percent cap or a repeal of the tax-exempt status of municipal bond interest, therefore providing a lower bound of a potential range of estimated costs.
tABle A2. The Distribution of County Population and Households By County Population Type, 45 Surveyed Counties and 3,069 Counties
county Population Type Population,
2012 Share of total population
Number of households, 2011
Share of total number of households
Large Counties (>500k residents)
137,776,040 46.5% 48,987,568 45.3%
Medium-sized counties (50-500k)
118,534,786 40.0% 43,941,836 40.6%
Small Counties (<50k residents)
39,737,388 13.4% 15,293,191 14.1%
3,069 counties 296,048,214 100.0% 108,222,595 100.0%
Large Counties (>500k residents)
16,815,583 81.9% 6,182,947 81.7%
Medium-sized counties (50-500k)
3,519,997 17.1% 1,300,066 17.2%
Small Counties (<50k residents)
207,440 1.0% 82,216 1.1%
45 surveyed counties 20,543,020 100.0% 7,565,229 100.0%
Source: U.S. Census Bureau, 2012 Population Estimates; U.S. Census Bureau, American Community Survey 2011 5-year estimates.

National Association of Counties Municipal Bonds Build America
29
1. Landes, David S., Joel Mokyr, William J. Baumol (eds), 2012. The Invention of Enterprise: Entrepreneurship from Ancient Mesopotamia to Modern Times, Princeton University Press.
2. Congressional Research Service, Tax-Exempt Bonds: A Description of State and Local Government Debt, 2012.
3. The National Association of Counties (NACo) analysis of U.S. Census Bureau, 2007 Census of Governments, 2009.
4. The National Association of Counties (NACo) analysis of U.S. Department of Transportation 2008 and 2012 data.
5. Based on SIFMA, Issuances in the U.S. Bond Markets, May 14, 2013.6. Bond Buyer based on Thomson Reuters data (data available on March 8, 2013).7. Based on SIFMA, Outstanding U.S. Bond Market Debt, March 07, 2013.8. Bond Buyer, A Decade of Municipal Bond Finance, 2013.9. U.S. Code Title 26, Subtitle A, Chapter 1, Subchapter B, Part IV, Subpart A, Section 141 Private activity bond;
qualified bond.10. This is a general explanation of the bond process at county level, as many variations may exist from this
average situation. 11. Governmental Accounting Standards Board, Summary of Statement No. 34, Basic Financial Statements—
and Management’s Discussion and Analysis—for State and Local Governments. Issued June 1999.12. Other purposes are to meet cash flow needs and to finance non-governmental private projects.13. Emilia Istrate and Robert Puentes, 2009, Investing for Success: Examining a Federal Capital Budget and a
National Infrastructure Bank, Brookings Institution.14. As of May 2013. Bloomberg data, May 2013.15. Thomson Reuters, Feb. 2013.16. Personal communication with Kenneth Wilson, Deputy county Administrator, Franklin county, OH, May 9,
2013.17. Based on the assumptions made in this study. For more explanation, see the Methodology Appendix.18. One mill is one-thousandth of a cent and it is the unit of the mill rate. The mill rate is the property tax per
thousand dollars of assessed property value. The assessed valuation of Franklin County for collection year 2012 was approximately $26.3 billion. As a result, the debt ceiling for a county bond issuance in 2012 was around $263 million. Ohio Code, Article 5705.51 Indirect debt limitation, available at http://codes.ohio.gov/orc/5705.51 and Article 133.07 Net indebtedness of county - certain securities not considered in calculation, available at http://codes.ohio.gov/orc/133.07.
19. The form of a county legislative body usually differs by state, such as Florida’s five- or seven-member com-mission, Texas’ five-member commissioner’s court, California’s board of supervisors, or Arkansas’s quorum courts, composed of 9 to 15 members based on population. Sometimes, the type of a county legislature differs among the counties within a state. For example, Delaware has three counties, two with county councils and one with a Levy Court Commission.
20. Matthew Sellers, County Authority: A State by State Report, the National Association of Counties, 2010.21. Bond Buyer, Bond Election Results, Nov. 2012, 2013.22. Center for Transportation Excellence, Past Transportation Ballot Measures, available at http://www.cfte.org/
elections/744/fairfax-county.23. Municipal Market Advisors data, May 2013.24. California Tax Data, California Property Tax Information, available at http://www.californiataxdata.com/pdf/
Prop13.pdf.25. Larry Swedroe, Can Credit Ratings on Municipal Bonds Be Trusted, CBS News, Feb. 6, 2013, available
at http://www.cbsnews.com/8301-505123_162-57567791/can-credit-ratings-on-municipal-bonds-be-trusted.
26. Bond Buyer, A Decade of Municipal Bond Finance, 2013.
endnotes

Municipal Bonds Build America National Association of Counties
30
27. Maryland Stadium Authority, Baltimore City Public Schools Construction, available at http://www.mdstad.com/current-projects/baltimore-city-public-schools-construction.
28. U.S. Securities and Exchange Commission, Report on the Municipal Securities Market, July 2012.29. This “mutual funds” share of municipal bonds includes mutual funds, money market funds, close-end
funds, and exchange-traded funds. See Figure 4.30. Kidwell, David S., Timothy W. Koch and Duane R. Stock. 1984. “The Impact of State Income Taxes on
Municipal Borrowing Costs.” National Tax Journal, vol. 37, no. 4, (Dec.), pp. 551-61.31. Personal communication with Tim Firestine, Chief Administrative Officer of Montgomery county, MD, April
8, 2013.32. Based on the assumptions made in this study. For more explanation, see the Methodology Appendix.33. OMB, Table 16-1. Estimates of Total Income Tax Expenditures for Fiscal years 2012–2018.34. James M. Poterba, Arturo Ramirez Verdugo. 2008. Portfolio Substitution and the Revenue Cost of
Exempting State and Local Government Interest Payments from Federal Income Tax. NBER Working Paper Series, Working Paper 14439.
35. Section 265(b)(3) of the tax code allows 80 percent of the interest of “qualified tax-exempt obligation” be deducted by banks. A qualified tax-exempt obligation is a tax-exempt obligation that is (1) issued after Aug. 7, 1986, by a qualified small issuer, (2) is not a private activity bond, and (3) is designated by the issuer as qualifying for the exception.
36. Charlie Ban, Losing muni-bonds tax-exemption hard on small counties, County News, April 22, 2013.37. Personal communication with Steve Krause, Chief, Bureau of Treasury Management, Baltimore City, Md.,
May 13, 2013.38. Based on the assumptions made in this study. For more explanation, see the Methodology Appendix,39. Maryland Stadium Authority, Baltimore City Public Schools Construction, available at http://www.mdstad.
com/current-projects/baltimore-city-public-schools-construction.40. National Association of Counties, National League of Cities, U.S. Conference of Mayors, Protecting Bonds
to Save Infrastructure and Jobs, Feb. 2013, available at http://www.naco.org/research/Pages/municipal-bonds.aspx.
41. George Friedlander, Mikhail Foux, and Vikram Rai, Volatility Grinds to a Halt, CITI US Municipal Market Comment, April 26, 2013.
42. George Friedlander, The Fate of the Tax Exemption, CITI US Municipal Strategy Notes, May 21, 2013.43. A make-whole call feature allows the issuer to call the security prior to the stated maturity date at the
greater of par or par plus the “make whole premium.” The make-whole premium is generally determined based on the yield of a comparable Treasury, for taxable securities, plus a predetermined yield spread.
44. Friedlander,George, Mikhail Foux, and Vikram Rai, Volatility Grinds to a Halt, CITI US Municipal Market Comment, April 26, 2013.

National Association of Counties Municipal Bonds Build America
31

25 MASSACHUSETTS AVENUE, NW | SUITE 500 | WASHINGTON, DC 20001202.393.6226 | FAX 202.393.2630 | www.naco.org
fb.com/NACoDCtwitter.com/NACoTweets
youtube.com/NACoVideolinkedin.com/in/NACoDC
ABout nAcoThe National Association of Counties (NACo) assists America’s counties in pursuing excellence in public service by advancing sound public policies, promoting peer learning and accountability, fostering intergovernmental and public-private collaboration, and providing value-added services to save counties and taxpayers money. Founded in 1935, NACo provides the elected and appointed leaders from the nation’s 3,069 counties with the knowledge, skills and tools necessary to advance fiscally responsible, quality-driven and results-oriented policies and services to build healthy, vibrant, safe and fiscally resilient counties.
NACo Policy research PaPer series • issUe 1 • 2013
Municipal Bonds Build America A County Perspective on Changing the Tax-Exempt Status of Municipal Bond Interest