munich personal repec archive - torrentfreak · pdf filemunich personal repec archive...
TRANSCRIPT
MPRAMunich Personal RePEc Archive
Intelligence and Crime: A novel evidencefor software piracy
Raufhon Salahodjaev and Shoirahon Odilova and Antonio R.
Andres
2016
Online at https://mpra.ub.uni-muenchen.de/71569/MPRA Paper No. 71569, posted 25 May 2016 05:53 UTC
1
Intelligence and Crime: A novel evidence for software piracy
Shoirahon Odilova
Department of Business & Management,
Donghua University, Shanhai, China
Email: [email protected]
Antonio Rodríguez Andrés
Universidad del Norte
School of Business
Km 5 via a Puerto Colombia, Barranquilla, Colombia
Email: [email protected]
Raufhon Salahodjaev
Department of Economics
University of South Florida, USA
Email: [email protected]
Abstract: The aim of this paper is to test the hypothesis that software piracy rats are lower in
more intelligent nations. Thus, we econometrically estimate the effect of national IQ on software
piracy rates, using data for 102 nations for the year 2011. Our findings offer strong support for
the assertion that intelligence is inversely related to the software piracy rates. After controlling
for the potential effect of outlier nations in the sample, software piracy rate declines by about 5.3
percentage points if national IQ increases by 10 points.
Keywords: software piracy; IQ; intelligence; cross-country; institutions; copyright
2
1. Introduction
From a legal point of view, the intellectual property rights cover three distinct sets of
rights: trademark, patents, and copyright (Besen & Raskind, 1991). Copyright refers to types of
commodity information/intellectual property goods, having certain features. Information goods
have two important public goods characteristics. First, their consumption is inherently non-rival.
That is the use that one person makes of a piece of information does not decrease the possibility
of use by others. Second, information and intellectual property goods may be non-excludable in
the sense that the producer of the intellectual property goods is often unable to exclude non-
payers from consuming goods without due authorization (Varian, 1998). Intellectual property
law responds to this problem by giving producers certain exclusive rights that exclude non-
payers from certain uses of their intellectual property goods. Although, assigning IPRs is not the
only way to deal with exclusion (for instance, bundling). IPRs law recognizes that no exclusion
would create poor incentives for the creation of IP goods. But at the same time, permanent
intellectual property rights would lead to the standard deadweight loss of a monopoly. Thus, an
adequate IP system must ensure a fair balance between these two conflicting objectives.
As regards intellectual property protection, one serious concern for copyright holders is
piracy; that is, the unauthorized use of copyrighted goods. When a legal copyright exists, those
who wish to gain access to the original copyrighted work must pay the copyright holder the
access price. If an individual obtains access without paying a price, that person is said to have
incurred an act of piracy. Even though piracy occurs for all types of intellectual property and can
take many forms depending on the access type and intellectual property mechanism (Watt,
2001), one of the most worrying areas nowadays is certainly the piracy of business software
applications. Business software piracy has been related to economic growth (Andrés & Goel,
3
2012), shadow economy (Goel and Nelson, 2012) scientific output (Asongu, 2014), innovation
(Banerjee & Chatterjee, 2010), and industry profits (Gomes et al., 2013). It has been calculated
that for each authentic copy distributed there are up to 10 illicit copies downloaded from internet
or copied from friends or members of family (Reavis & Rumelt, 1991). According to BSA (2011
p. 1) "[t]he global piracy rate for PC software hovers at 42 percent [and] [t]he commercial value
of this shadow market of pirated software climbed ... to $63.4 billion in 2011".
Consequently, investigating the determinants and effects of software piracy has been
paramount object of empirical studies over the last decade (see e.g. Andrés. 2006a,b; Goel &
Nelson, 2012; Bezmen et al., 2006; Chen et al., 2010; Arai, 2011; Boyce, 2011)1. By and large,
related studies show that economic development, institutional arrangements, political regimes
and cultural proxies are determinants of 'softlifting' behavior on a cross-country level. Our
research offers a quite different avenue in understanding the cross-national variations in software
piracy rates. We depart from a celebrated article by Lynn & Vanhanen (2002 p. 194) who claim
that "national [intelligence levels] are a causal factor responsible for the differences in economic
development". Based on conclusions formulated by Lynn & Vanhanen (2002) we conjecture that
intelligence may be important antecedent of software piracy through which it has impact on
economic growth and innovation. Notably, we presume that there are a number of channels
through which intelligence is related to software piracy, the first of which is economic
development. Related literature reports that economic development is one of the most robust
predictors of software piracy rates. Economic wealth, proxied by GDP per capita, is statistically
significantly and negatively associated with cross-national piracy rates (e.g., Andrés, 2006b;
Andrés & Goel, 2012; Bagchi et al., 2006; Robertson et al., 2008). On the other hand, in their
celebrated articles devoted to the understanding of intelligence Lynn & Vanhanen (2002, 2006)
1see e.g. Gomes et al. (2015) for an excellent survey on empirical literature which explains software piracy.
4
suggest national IQ as an explanation for cross nations variations in per-person gross domestic
product (GDP) and other country-level economic outcomes. Similarly, Ram (2007), using data
for 98 nations, reports that IQ has statistically significant effect on economic growth. As
cognitive abilities have positive effect on economic development, we may conjecture that
intelligence will be inversely related to software piracy rates. More recently, Meisenberg (2012)
p. 103 concludes that "high IQ is associated not only with high per-capita GDP ... but also with
more equal income distribution".
Another potential impact of intelligence on software piracy rates is quality of institutions.
Whereas weak institutions and poor policies lead to greater 'soflifting' (Kovačić, 2007; Andrés,
2006a, there is confirmation that strong and stable institutions, competent enforcement
authorities and anxiety of prosecution reduces the likelihood of infringement (Marron & Steel,
2000; Lysonski & Durvasula, 2008). Indeed, Kanyama (2014), using data on 164 nations for the
years 2006 - 2010, finds that intelligence has positive impact on quality of institutions. Similarly,
Salahodjaev (2015a), using Barro type growth regressions, shows that the effect democracy on
economic growth is mediated by intelligence. In particular, intelligence reduces the negative
association between democracy and economic growth in weak democratic economies. On the
microeconomic level high IQ (educated) individuals have higher levels of political participation
(e.g. Milligan et al., 2004). This is especially important because securing intellectual property
rights in the digital era demands intellectual skills and competence as involved government
authorities need to recognize the perceptions and rules balancing the rights of individual agents
and of general users.
We may then conjecture that intelligence has negative effect on software piracy as high
IQ individuals are more competent (Luciano et al., 2006; Soto-Calvo et al., 2015). For example,
5
Sub (1996) finds that intelligence is among predictors problem solving competences. Similarly,
Rigas et al. (2002) report positive correlations between IQ and problem-solving experiment
(r=0.43 for Kühlhaus scenario; r=0.34 for NEWFIRE scenario).
Finally, software piracy is also symbolized by criminal endeavor, a behavior that has also
been related to intelligence. For instance, Templer & Rushton (2011) report a negative
correlation between IQ and different measures of crime (murder, rape, robbery and assault) in the
USA. Earlier Rushton & Templer (2009 p. 345) conclude that "[c]ross-national differences in
rate of violent crime (murder, rape, and serious assault) were significantly correlated with a
country's IQ scores (mean r = .25, such that the higher the IQ, the lower the rate of crime)".
Bartels et al. (2010) tested the hypothesis that violent and property crimes rate are lower in states
with higher IQ scores using data for the years 2005-2006. They showed that National
Assessment of Educational Progress (NAEP) reading and math standardized test scores a proxy
for calculating IQ estimates has significant and negative effect on crime rates in the USA.
Salahodjaev (2015b) provides evidence on the impact of intelligence on the size of shadow
economy. The author applies OLS method and an instrumental variable (IV) 2SLS regression
technique. The estimates show that the negative effect of intelligence remains robust when
controlled for conventional determinants of an underground economy. In addition, intelligence
predicts the likelihood of involvement in criminal activities (Herrnstein & Murray, 1994)
instrumental to reduce the software piracy rates.
This article starts from the following hypothesis:
Does any association exist between IQ and software piracy rate at a national level?
6
2. Data and methods
Dependent variable
The data on software piracy rate is obtained from BSA (2012). It measures the percentage
of software that is being used illegally, without the purchase of a license. This variable ranges
from 0 % (no piracy) to 100 % (i.e. all software installed is pirated). The BSA measures the
piracy of commercial software. These estimates are one of the most reliable ones and have been
used largely in empirical papers (for instance Andrés, 2006a,b; Andrés & Goel, 2012; Goel &
Nelson, 2012; Gomes et al., 2013a; Banerjee et al., 2005; and Andrés & Asongu, 2013)2. In the
current paper, we focus on end-user piracy where consumers will use the software at home, and
software is not sold to the others (commercial piracy).The underlying method for estimating the
piracy rate and commercial value of unlicensed software in a nation is as follows: the amount of
PC software distributed subtracted from the amount of software legally obtained. Once the
amount of unlicensed software is known, the PC software piracy rate is estimated as a share of
total software installed for 108 nations.
Independent variable
The key independent variable is average national intelligence, measured by national IQ
scores. We draw the cross-national dataset on national IQs from Lynn & Vanhanen (2012). The
authors update a previous edition of national IQ data by Lynn & Vanhanen (2002). Their latest
dataset contains intelligence quotient scores for 190 counties and has been extensively used in
related literature over the past decade (Lynn, 2012; Daniele, 2013; Salahodjaev & Azam, 2015;
2 See Traphagan and Griffith (1998) and Png (2010) for a discussion on the reliability of piracy data.
7
Obydenkova & Salahodjaev, 2016; Salahodjaev, 2016). Hereafter, after elimination potentially
missing observations for the piracy rate, IQ scores extend from 64 in Cameroon to 107.1 in
Singapore.
Control variables
First we control for GDP per capita. Cross-national studies report that software piracy
rates are inversely related to the level of economic development (Andrés, 2006b; Bagchi et al.,
2017; Kigerl, 2013).
Related studies document that nations with lower economic opportunities and more
inequality are associated with greater levels of software infringement (Andres, 2006a; Chen et
al., 2010). We use index of economic freedom (EFI) from Heritage Foundation as a proxy for
economic freedom and opportunity. The EFI covers 10 freedoms - from property rights to
entrepreneurship in majority nations of the world. Furthermore, software piracy rates are lower
in nations with British civil law. Indeed, nations with British common law recognize the
significance of intellectual property rights. Thus, we use binary variable for nations with British
common law.
To investigate the impact of political regimes on software piracy rate we use democratic
index from Freedom House. The democracy index is estimated as the average of civil liberties
and political rights. Finally, to investigate the role of corruption in software piracy we use
Corruption perceptions index (CPI) from Transparency International. Table 1 presents
descriptive statistics.
8
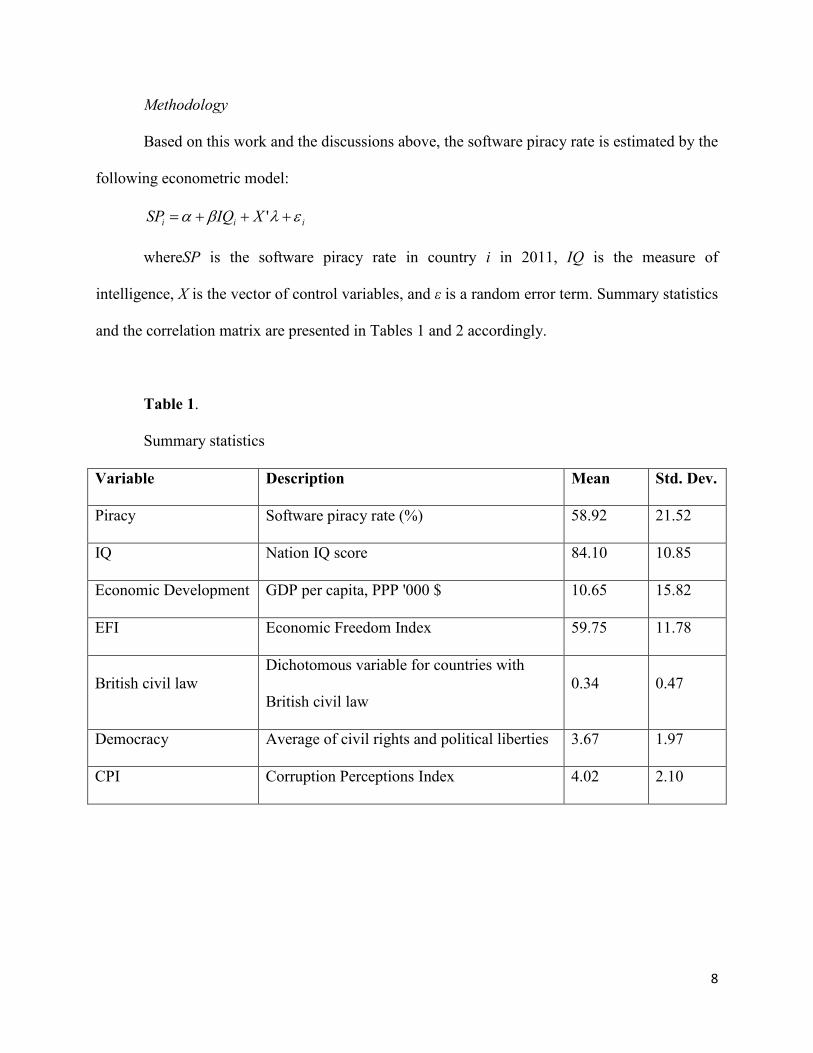
Methodology
Based on this work and the discussions above, the software piracy rate is estimated by the
following econometric model:
iii XIQSP '
whereSP is the software piracy rate in country i in 2011, IQ is the measure of
intelligence, X is the vector of control variables, and ε is a random error term. Summary statistics
and the correlation matrix are presented in Tables 1 and 2 accordingly.
Table 1.
Summary statistics
Variable Description Mean Std. Dev.
Piracy Software piracy rate (%) 58.92 21.52
IQ Nation IQ score 84.10 10.85
Economic Development GDP per capita, PPP '000 $ 10.65 15.82
EFI Economic Freedom Index 59.75 11.78
British civil law Dichotomous variable for countries with
British civil law 0.34 0.47
Democracy Average of civil rights and political liberties 3.67 1.97
CPI Corruption Perceptions Index 4.02 2.10
9
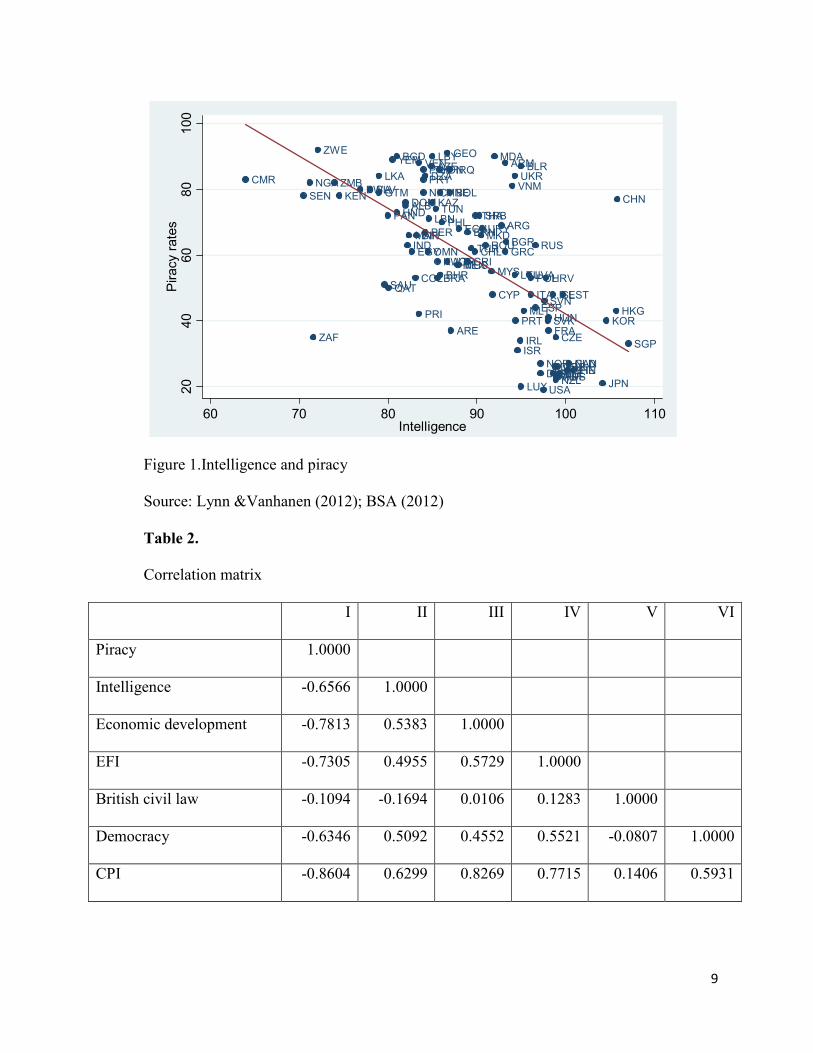
Figure 1.Intelligence and piracy
Source: Lynn &Vanhanen (2012); BSA (2012)
Table 2.
Correlation matrix
I II III IV V VI
Piracy 1.0000
Intelligence -0.6566 1.0000
Economic development -0.7813 0.5383 1.0000
EFI -0.7305 0.4955 0.5729 1.0000
British civil law -0.1094 -0.1694 0.0106 0.1283 1.0000
Democracy -0.6346 0.5092 0.4552 0.5521 -0.0807 1.0000
CPI -0.8604 0.6299 0.8269 0.7715 0.1406 0.5931
ALB
DZA
ARG
ARM
AUSAUT
AZE
BHR
BGDBLR
BEL
BOL
BIH
BWA
BRA
BRNBGR
CMR
CAN
CHL
CHN
COL
CRI
HRV
CYP
CZE
DNK
DOM
ECU
EGY
SLV
EST
FIN
FRA
GEO
DEU
GRC
GTM
HND
HKGHUN
ISL
IND
IDNIRQ
IRLISR
ITA
JPN
JOR
KAZKEN
KOR
KWT
LVA
LBN
LBY
LTU
LUX
MKD
MYS
MLT
MUSMEX
MDA
MNE
MAR
NLD
NZL
NICNGA
NOR
OMN
PAK
PAN
PRY
PERPHL
POL
PRTPRI
QAT
ROU RUS
SAU
SEN
SRB
SGP
SVK
SVN
ZAF
ESP
LKA
SWECHE
THATUN
TUR
UKR
ARE
GBR
USA
URY
VEN
VNM
YEM
ZMB
ZWE
20
40
60
80
100
Piracy
rate
s
60 70 80 90 100 110Intelligence
10
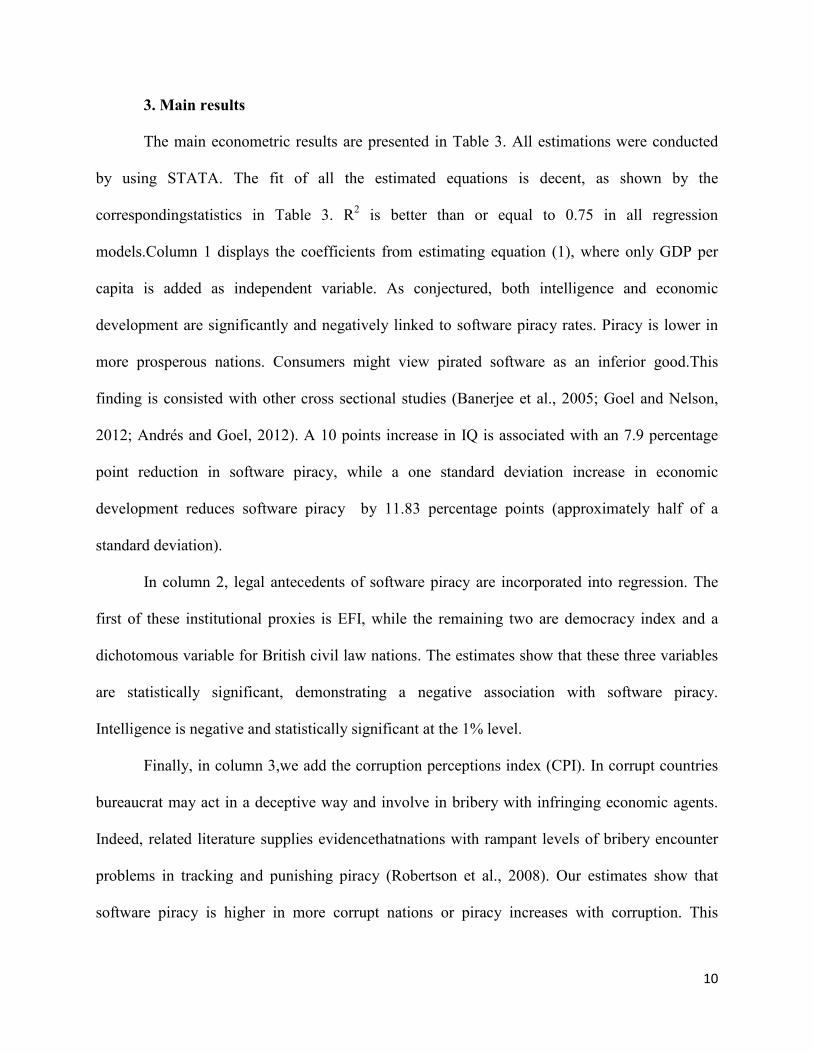
3. Main results
The main econometric results are presented in Table 3. All estimations were conducted
by using STATA. The fit of all the estimated equations is decent, as shown by the
correspondingstatistics in Table 3. R2 is better than or equal to 0.75 in all regression
models.Column 1 displays the coefficients from estimating equation (1), where only GDP per
capita is added as independent variable. As conjectured, both intelligence and economic
development are significantly and negatively linked to software piracy rates. Piracy is lower in
more prosperous nations. Consumers might view pirated software as an inferior good.This
finding is consisted with other cross sectional studies (Banerjee et al., 2005; Goel and Nelson,
2012; Andrés and Goel, 2012). A 10 points increase in IQ is associated with an 7.9 percentage
point reduction in software piracy, while a one standard deviation increase in economic
development reduces software piracy by 11.83 percentage points (approximately half of a
standard deviation).
In column 2, legal antecedents of software piracy are incorporated into regression. The
first of these institutional proxies is EFI, while the remaining two are democracy index and a
dichotomous variable for British civil law nations. The estimates show that these three variables
are statistically significant, demonstrating a negative association with software piracy.
Intelligence is negative and statistically significant at the 1% level.
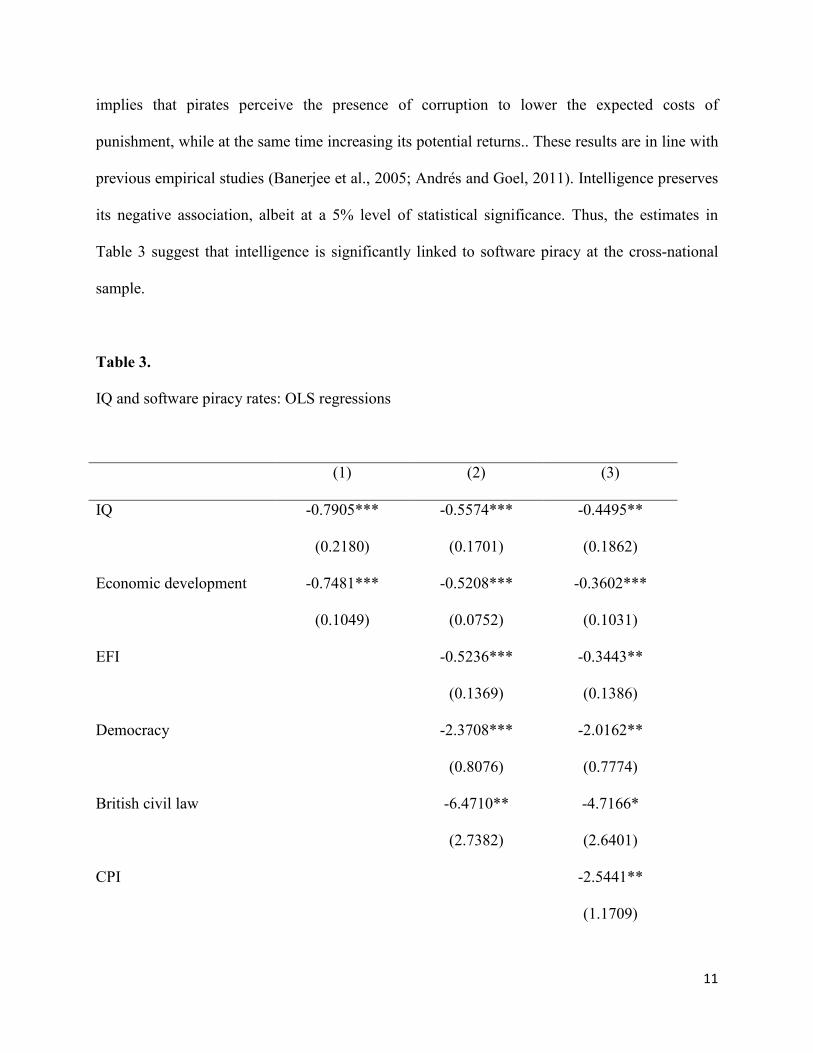
Finally, in column 3,we add the corruption perceptions index (CPI). In corrupt countries
bureaucrat may act in a deceptive way and involve in bribery with infringing economic agents.
Indeed, related literature supplies evidencethatnations with rampant levels of bribery encounter
problems in tracking and punishing piracy (Robertson et al., 2008). Our estimates show that
software piracy is higher in more corrupt nations or piracy increases with corruption. This
11
implies that pirates perceive the presence of corruption to lower the expected costs of
punishment, while at the same time increasing its potential returns.. These results are in line with
previous empirical studies (Banerjee et al., 2005; Andrés and Goel, 2011). Intelligence preserves
its negative association, albeit at a 5% level of statistical significance. Thus, the estimates in
Table 3 suggest that intelligence is significantly linked to software piracy at the cross-national
sample.
Table 3.
IQ and software piracy rates: OLS regressions
(1) (2) (3)
IQ -0.7905*** -0.5574*** -0.4495**
(0.2180) (0.1701) (0.1862)
Economic development -0.7481*** -0.5208*** -0.3602***
(0.1049) (0.0752) (0.1031)
EFI -0.5236*** -0.3443**
(0.1369) (0.1386)
Democracy -2.3708*** -2.0162**
(0.8076) (0.7774)
British civil law -6.4710** -4.7166*
(2.7382) (2.6401)
CPI -2.5441**
(1.1709)
12
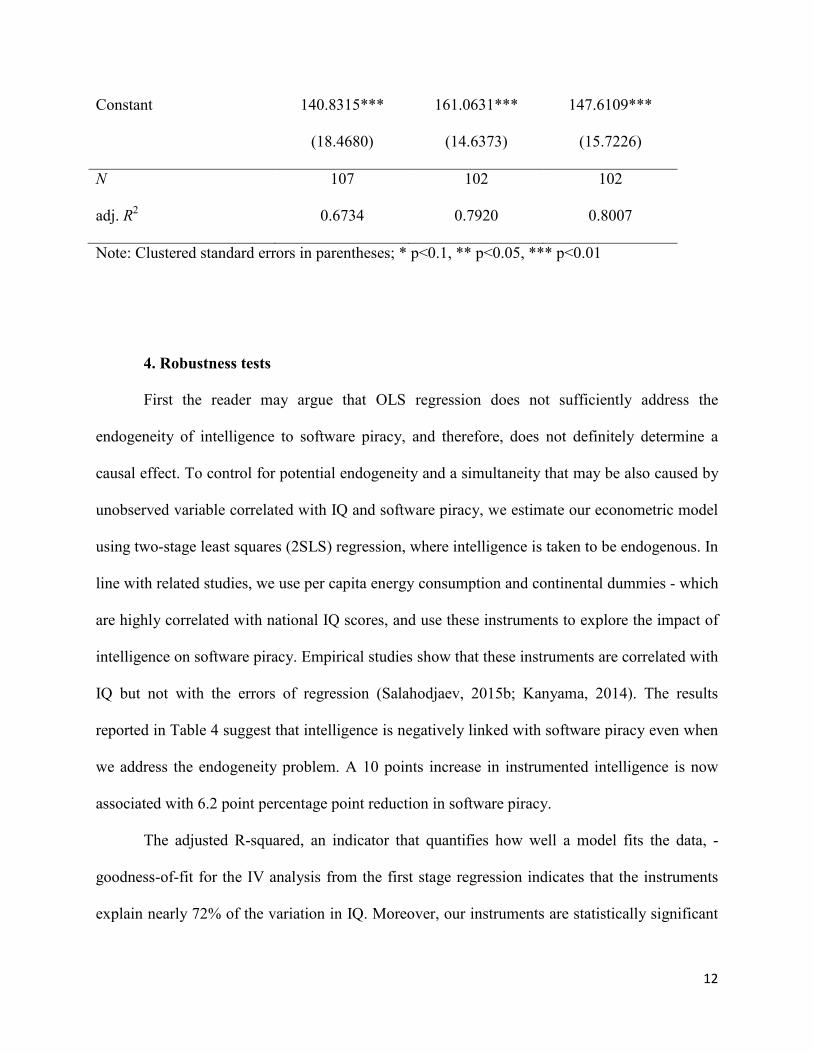
Constant 140.8315*** 161.0631*** 147.6109***
(18.4680) (14.6373) (15.7226)
N 107 102 102
adj. R2 0.6734 0.7920 0.8007
Note: Clustered standard errors in parentheses; * p<0.1, ** p<0.05, *** p<0.01
4. Robustness tests
First the reader may argue that OLS regression does not sufficiently address the
endogeneity of intelligence to software piracy, and therefore, does not definitely determine a
causal effect. To control for potential endogeneity and a simultaneity that may be also caused by
unobserved variable correlated with IQ and software piracy, we estimate our econometric model
using two-stage least squares (2SLS) regression, where intelligence is taken to be endogenous. In
line with related studies, we use per capita energy consumption and continental dummies - which
are highly correlated with national IQ scores, and use these instruments to explore the impact of
intelligence on software piracy. Empirical studies show that these instruments are correlated with
IQ but not with the errors of regression (Salahodjaev, 2015b; Kanyama, 2014). The results
reported in Table 4 suggest that intelligence is negatively linked with software piracy even when
we address the endogeneity problem. A 10 points increase in instrumented intelligence is now
associated with 6.2 point percentage point reduction in software piracy.
The adjusted R-squared, an indicator that quantifies how well a model fits the data, -
goodness-of-fit for the IV analysis from the first stage regression indicates that the instruments
explain nearly 72% of the variation in IQ. Moreover, our instruments are statistically significant
13
at the conventional levels. For example, a one standard deviation increase in per person energy
consumption is associated with approximately 2.7point increase in IQ. The usefulness of the
instruments is also supported by the first stage "F value" (F=22.90; p=.00)3.
On the other hand, outlier and influential data points can have a substantial influence on
estimates and inferences from cross-national data (Rodrik, 2012). Indeed, in the mean regression
approach the effect of outlier on the estimate rises with the square of its size. For example,
Swartz and Welsch (1986, p. 171) note: “OLS and many other commonly used maximum
likelihood techniques have an unbounded influence function; any small subset of the [extreme]
data can have an arbitrarily large [effect] on their coefficient estimates.”. To address this
limitation of OLS regression we use robust regression (RR). RR starts by fitting the model,
estimating Cook's D and removing any data points for which D>1. Thenceforth RR runs
iteratively: it fits a regression, estimates case weights from absolute error terms, and re-estimates
the model again using those weights. These iterations end when maximum adjustment in weights
falls below tolerance.
The estimates reported in Column 2 suggest that intelligence is negative and statistically
significant at the 1% level. The numerical interpretation is that software piracy rate declines by
about 5.3 percentage points if national IQ increases by 10 points.
Finally, we tested the robustness of our results to the inclusion of additional control
variables.Illegal copying might respond to legal tendencies towards or against protected IPRs.
Previous empirical literature suggests that stronger IPRs protection reduces the rates of software
piracy (Andrés, 2006b). Indeed, the degree of economic development might be also correlated
with judicial and policing maturity, and it is possible to interpret it as a proxy variable for
property rights enforcement. For that purpose, we include the IPR enforcement index (IPR) 3 Available from authors upon request
14
collected by the World Economic Forum (WEF) as a measure of the general strength of IPRs
protection across countries.This index is built based on answers from local professionals and is
bi-annually published in the WEF annual Global Competitiveness Report. Furthermore, this
index captures the enforcement component of IPR protection which reacts the current law
perspectives and practices on its protection. The survey asked whether, if intellectual property
protection in your country is: (1=weak or non-existent, 7=equal to the world’s most stringent).
Higher values of the index indicate higher levels of IPRs protection. Responses from the experts
are tabulated and averaged for each country in question. In addition to this, following Goel and
Nelson (2012), we also control fora measure of punishment, the effectiveness (impartiality) of
courts (Courts). This cross-country index is expected to capture the potential punishments (costs)
for piracy – impartial courts lowers piracy by prosecuting more pirates and dissuading potential
pirates.
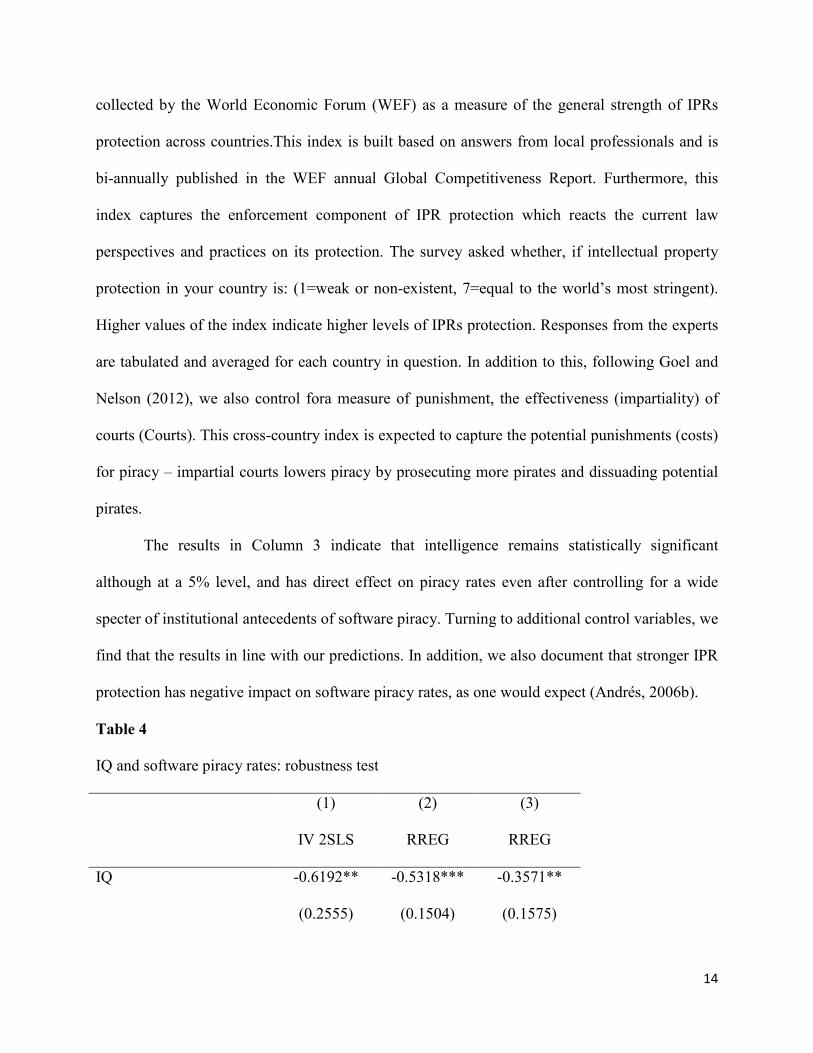
The results in Column 3 indicate that intelligence remains statistically significant
although at a 5% level, and has direct effect on piracy rates even after controlling for a wide
specter of institutional antecedents of software piracy. Turning to additional control variables, we
find that the results in line with our predictions. In addition, we also document that stronger IPR
protection has negative impact on software piracy rates, as one would expect (Andrés, 2006b).
Table 4
IQ and software piracy rates: robustness test
(1)
IV 2SLS
(2)
RREG
(3)
RREG
IQ -0.6192** -0.5318*** -0.3571**
(0.2555) (0.1504) (0.1575)
15
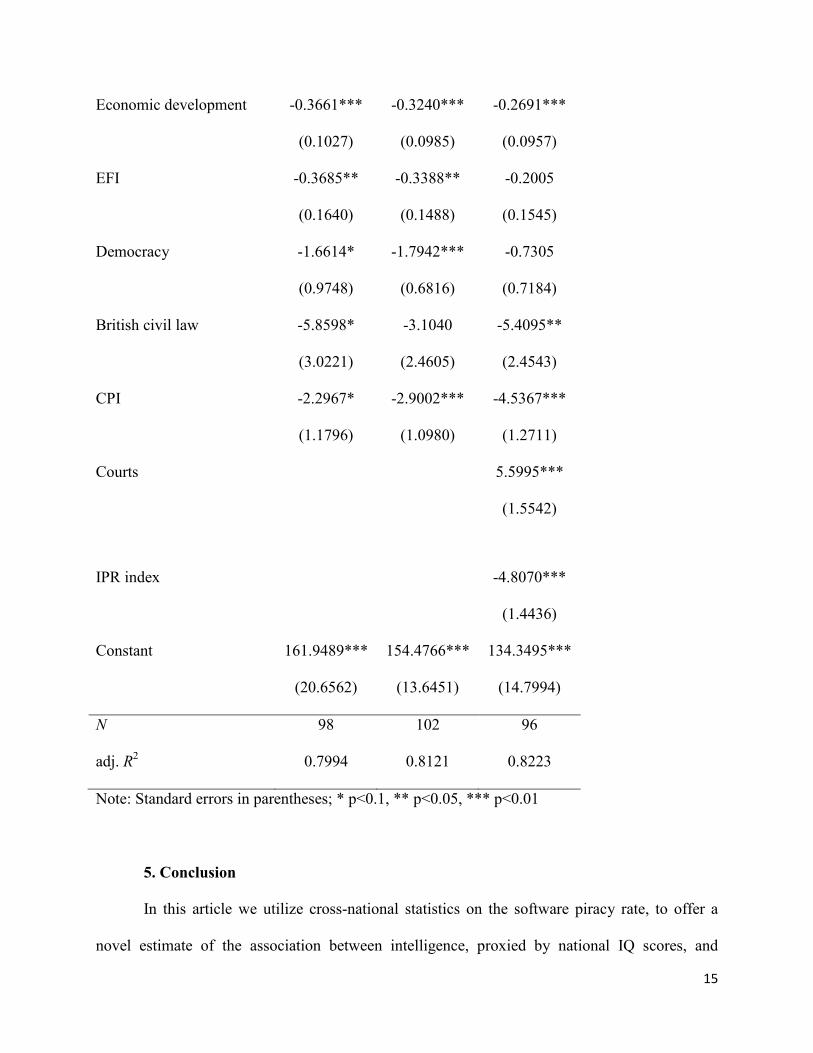
Economic development -0.3661*** -0.3240*** -0.2691***
(0.1027) (0.0985) (0.0957)
EFI -0.3685** -0.3388** -0.2005
(0.1640) (0.1488) (0.1545)
Democracy -1.6614* -1.7942*** -0.7305
(0.9748) (0.6816) (0.7184)
British civil law -5.8598* -3.1040 -5.4095**
(3.0221) (2.4605) (2.4543)
CPI -2.2967* -2.9002*** -4.5367***
(1.1796) (1.0980) (1.2711)
Courts 5.5995***
(1.5542)
IPR index -4.8070***
(1.4436)
Constant 161.9489*** 154.4766*** 134.3495***
(20.6562) (13.6451) (14.7994)
N 98 102 96
adj. R2 0.7994 0.8121 0.8223
Note: Standard errors in parentheses; * p<0.1, ** p<0.05, *** p<0.01
5. Conclusion
In this article we utilize cross-national statistics on the software piracy rate, to offer a
novel estimate of the association between intelligence, proxied by national IQ scores, and
16
'softlifting'. We find that intelligence has statistically significant negative impact on piracy rates.
We also conclude that the estimates remain robust when we address potential endogeneity of IQ
and for the existence of outlier countries in the sample.
On the other hand, it is crucial to highlight that albeit our findings suggest that more
intelligent societies are inversely associated with the software piracy rates, this should not be
taken as universal evidence that society with higher intelligent quotient is a requirement to
alleviate software piracy. Our findings indicate that if ruling elite enforces policies to decrease
software piracy, intelligence provides a credible proxy of the degree of consent of such policies.
Indeed, agents with higher cognitive abilities are more politically active.
Our estimates extend the findings of Salahodjaev (2015b), Potrafke (2012) and Kanyama
(2014), who show that intelligence predicts rent-seeking behavior, corruption and quality of
institutions.
References
Andrés, A.R. (2006a). Software piracy and income inequality.Applied Economics Letters,
13, 101-105.
Andrés, A.R. (2006b). The Relationship between Copyright Software Protection and
Piracy: Evidence from Europe.” European Journal of Law and Economics, 21, 29–51
Andrés, A. R., & Goel, R. K. (2012). Does software piracy affect economic growth?
Evidence across countries. Journal of Policy Modeling, 34(2), 284-295.
Andrés, A.R., & Goel, R.K. (2011). Corruption and software piracy: A comparative
perspective. Policy & Internet, 3, 1-22.
17
Andrés, A.R., & Asongu, S. (2013). Fighting Software Piracy: Which governance tools
matter for Africa?. Journal of Business Ethics, 118, 667-682.
Arai, Y. (2011). Civil and criminal penalties for copyright infringement. Information
Economics and Policy, 23(3), 270-280.
Asongu, S. A. (2014). Software piracy and scientific publications: knowledge economy
evidence from Africa. African Development Review, 26(4), 572-583.
Bagchi, K., Kirs, P., & Cerveny, R. (2006). Global software piracy: Can economic factors
alone explain the trend? Communications of the ACM, 49(6), 70-75.
Banerjee, D., Khalid, A. M., & Strum, J.-.E. (2005) Socioeconomic development and
software piracy: an empirical assessment, Applied Economics, 37, 2091–7.
Banerjee, D., & Chatterjee, I. (2010).The impact of piracy on innovation in the presence
of technological and market uncertainty. Information Economics and Policy, 22(4), 391-397.
Bartels, J. M., Ryan, J. J., Urban, L. S., & Glass, L. A. (2010).Correlations between
estimates of state IQ and FBI crime statistics. Personality and Individual Differences, 48(5), 579-
583.
Besen, S. M. & Raskind, L. J. (1991). “An Introduction to the Law and Economics of
Intellectual Property.”Journal of Economic Perspectives. 5, 3–27.
Bezmen, T. L., & Depken, C. A. (2006). Influences on software piracy: Evidence from
the various United States. Economics Letters, 90(3), 356-361.
Boyce, J. A. (2011). International determinants of software piracy (Doctoral
dissertation).
Chen, C., Chen, C., & Yeh, C. (2010). Determinants of software piracy: Evidence from
Far East countries. Journal of International and Global Economic Studies, 3(2), 53-62.
18
Daniele, V. (2013). Does the intelligence of populations determine the wealth of
nations?. The Journal of Socio-Economics, 46, 27-37.
Goel, R.K., & Nelson, M (2012). Shadow Economy and International Piracy.Applied
Economics Letters, 22, 1951-1959
Gomes, N. D., Cerqueira, P. A., & Almeida, L. A. (2013). Determinants of World Wide
Software Piracy Losses.UC Coimbra. GEMF 2013-19.
Gomes, N. D., Cerqueira, P. A., & Almeida, L. A. (2015). A survey on software piracy
empirical literature: Stylized facts and theory, Information Economics and Policy, 32, 29-37,
Herrnstein, R. J., & Murray, C. (1994).The bell curve: Intelligence and class structure in
American life. New York, NY: Free Press
Kanyama, I. K. (2014). Quality of institutions: Does intelligence matter?.Intelligence, 42,
44-52.
Kovačić, Z. J. (2007). Determinants of worldwide software piracy. Neuseeland: Open
Polytechnic of New Zealand.
Luciano, M., Wainwright, M. A., Wright, M. J., & Martin, N. G. (2006). The heritability
of conscientiousness facets and their relationship to IQ and academic achievement. Personality
and Individual Differences, 40(6), 1189-1199.
Lysonski, S., & Durvasula, S. (2008). Digital piracy of MP3s: consumer and ethical
predispositions. The Journal of Consumer Marketing, 25 (3), 167.
Lynn, R. (2012). IQs predict differences in the technological development of nations
from 1000 BC through 2000 AD. Intelligence, 40(5), 439-444.
Lynn, R., & Vanhanen, T. (2002). IQ and the wealth of nations. Westport, CT: Praeger.
19
Lynn, R., & Vanhanen, T. (2006). IQ and global inequality. Augusta, GA: Washington
Summit.
Marron, D. B., & Steel, D. G. (2000). Which countries protect intellectual property? The
case of software piracy. Economic inquiry, 38(2), 159-174.
Meisenberg, G. (2012). National IQ and economic outcomes. Personality and Individual
Differences, 53(2), 103-107.
Milligan, K., Moretti, E., & Oreopoulos, P. (2004). Does education improve citizenship?
Evidence from the United States and the United Kingdom. Journal of Public Economics, 88(9),
1667-1695.
Obydenkova, A., & Salahodjaev, R. (2016). Intelligence, democracy, and international
environmental commitment. Environmental research, 147, 82-88.
Png, I. (2010). On the reliability of software piracy statistics. Electronic Commerce
Research and Applications, 9, 365-373.
Potrafke, N. (2012). Intelligence and corruption. Economics Letters, 114(1), 109-112.
Ram, R. (2007). IQ and economic growth: Further augmentation of Mankiw–Romer–
Weil model. Economics Letters, 94(1), 7-11.
Reavis Conner, K., & Rumelt, R. P. (1991). Software piracy: An analysis of protection
strategies. Management Science, 37(2), 125-139.
Rigas, G., Carling, E., &Brehmer, B. (2002). Reliability and validity of performance
measures in microworlds. Intelligence, 30(5), 463–480.
Robertson, C. J., Gilley, K. M., Crittenden, V., & Crittenden, W. F. (2008).An analysis of
the predictors of software piracy within Latin America. Journal of Business Research, 61(6),
651-656.
20
Robertson, C., Gilley, K. M., & Crittenden, W. F. (2008). Trade liberalization,
corruption, and software piracy. Journal of Business Ethics, 78(4), 623-634.
Rodrik, D. (2012). Why we learn nothing from regressing economic growth on
policies. Seoul Journal of Economics, 25(2), 137-151.
Rushton, J. P., & Templer, D. I. (2009). National differences in intelligence, crime,
income, and skin color. Intelligence, 37(4), 341-346.
Salahodjaev, R. (2015a). Democracy and economic growth: The role of intelligence in
cross-country regressions. Intelligence, 50, 228-234.
Salahodjaev, R. (2015b). Intelligence and shadow economy: A cross-country empirical
assessment. Intelligence, 49, 129-133.
Salahodjaev, R., & Azam, S. (2015). Intelligence and gender (in) equality: Empirical
evidence from developing countries. Intelligence, 52, 97-103.
Salahodjaev, R. (2016). Intelligence and deforestation: International data.Forest Policy
and Economics, 63, 20-27.
Soto-Calvo, E., Simmons, F. R., Willis, C., & Adams, A. M. (2015). Identifying the
cognitive predictors of early counting and calculation skills: Evidence from a longitudinal study,
Journal of Experimental Child Psychology, 140, 16-37.
Swartz, S., & Welsch, R.E. (1986). Applications of bounded influence and diagnostic
methods in energy modelling. In D.A. Belsley, & E. Kuh (Eds.),Model reliability. Cambridge,
MA: MIT Press.
Templer, D. I., & Rushton, J. P. (2011). IQ, skin color, crime, HIV/AIDS, and income in
50 US states. Intelligence, 39(6), 437-442.
21
Traphagan, M. & Griffith, A. (1998). “Software Piracy and Global Competitiveness:
Report on Global SoftwarePiracy.” International Review of Law Computer. 12, 431–451.
Varian, H. R. (1998). “Markets for Information Goods.” Mimeo. University of California,
Berkeley.
Watt, R. (2001). “Prices in Cultural Markets: A Theoretical Introduction for Beginners.”
http://www.serci.org/documents/pricing.pdf.