multispectral analysis of color vision deficiency tests
TRANSCRIPT
� 104
ISSN 1392–1320 MATERIALS SCIENCE (MEDŽIAGOTYRA). Vol. 17, No. 1. 2011
Multispectral Analysis of Color Vision Deficiency Tests
Sergejs FOMINS 1 ∗
, Maris OZOLINSH 2
1
Optometry and Vision Science Department, University of Latvia, Kengaraga 8, LV-1063 Riga, Latvia
2
Institute of Solid State Physics, University of Latvia, Kengaraga 8, LV-1063 Riga, Latvia
Received 01 September 2010; accepted 24 November 2010
Color deficiency tests are usually produced by means of polygraphy technologies and help to diagnose the type and
severity of the color deficiencies. Due to different factors, as lighting conditions or age of the test, standard
characteristics of these tests fail, thus not allowing diagnosing unambiguously the degree of different color deficiency.
Multispectral camera was used to acquire the spectral images of the Ishihara and Rabkin pseudoisochromatic plates in
the visible spectrum. Spectral data was converted to cone signals, and successive mathematics applied to provide a
simple simulation of the test performance. Colorimetric data of the each pixel of the test image can be calculated and
distribution of color coordinates is presented.
Keywords: pseudoisochromatic plates, multispectral analysis, color vision, CIE chromaticity diagram.
1. INTRODUCTION∗
Multispectral imaging is widely used in different fields
of science. One of the most common applications to
mention is astrology, agriculture, medicine and biology. In
recent research it was shown how spectral data can be
applied to analyze the human skin [1]. Our interest is
basically related the field of human color vision. Color
vision in most of vertebrates as also human species is
provided by three types of photoreceptors, sensitive to blue
wavelength lights (445 nm peak), green (540 nm peak) and
yellow (565 nm peak) parts of the visible spectrum [2, 3].
Due to genetic reasons person could miss one, some
pigments, which results in functional individualities of
color perception [4]. The most common are color
anomalies, than one class of the pigment is replaced by the
class already represented in other cones (L or M) and could
be up to 6 % of population in males [5]. Dichromacy is
represented in fewer amounts in population and is around
2 % [5]. Where are different techniques for diagnostics of
color vision deficiency and anomaly: anomaloscopes,
arrangement tests (Farnsworth D-15, D-100),
pseudoisochromatic plates. Most popular and easily
applicable are pseudoisochromatic screening test plates [5].
In the last decade many research evaluating the quality and
performance of the color deficiency tests being made.
Color vision test performance can be evaluated either in
clinical trials or by objective spectral and colorimetric
measurement of the color used in the tests [5 –
8].
Spectroscopic data are transformed into color coordinates
and conformity to dichromate confusion lines is evaluated
[9, 10]. Usually both of the analyses are necessary when
the novel test is introduced [11]. It has been shown [9] that
different test books have significant variations, so the
printing technology and the age of the test should be taken
into account. To our mind, evaluation of the
pseudoisochromatic tests can benefit from the use of
multispectral imaging. The spectral data of the test can be
acquired on the whole spatial scale, which cannot be
�����������������������������������������������������������
∗
Corresponding author. Tel.: +371-67-260796; fax: +371-67-132778.
E-mail address: [email protected] (S. Fomins)
obtained in spectroscopic or colorimetric measurement.
The advantages of multispectral analysis could be a
possibility to apply the higher mathematical apparatus in
two dimensions over the test surface at any spectral
channel of the obtained visible spectra.
In the context of this work we show the possibilities of
multispectral imaging to be used for analysis of the
performance of the tests and extended spectroscopic
evaluation as additional tool to the accepted clinical
validity testing [8].
1.1. Pseudoisochromatic plates
Pseudoisochromatic (PIC) plates are example of color
camouflage. The object and background of the test design
are colored spots or patches of randomly aligned size and
luminance [5]. This particular properties provide size and
luminance noise, so only color information can be used by
individual to detect the latent object. The colors of the
background and test spots are aligned along the dichromate
confusion lines, with variations of luminance and
chromatic saturation.
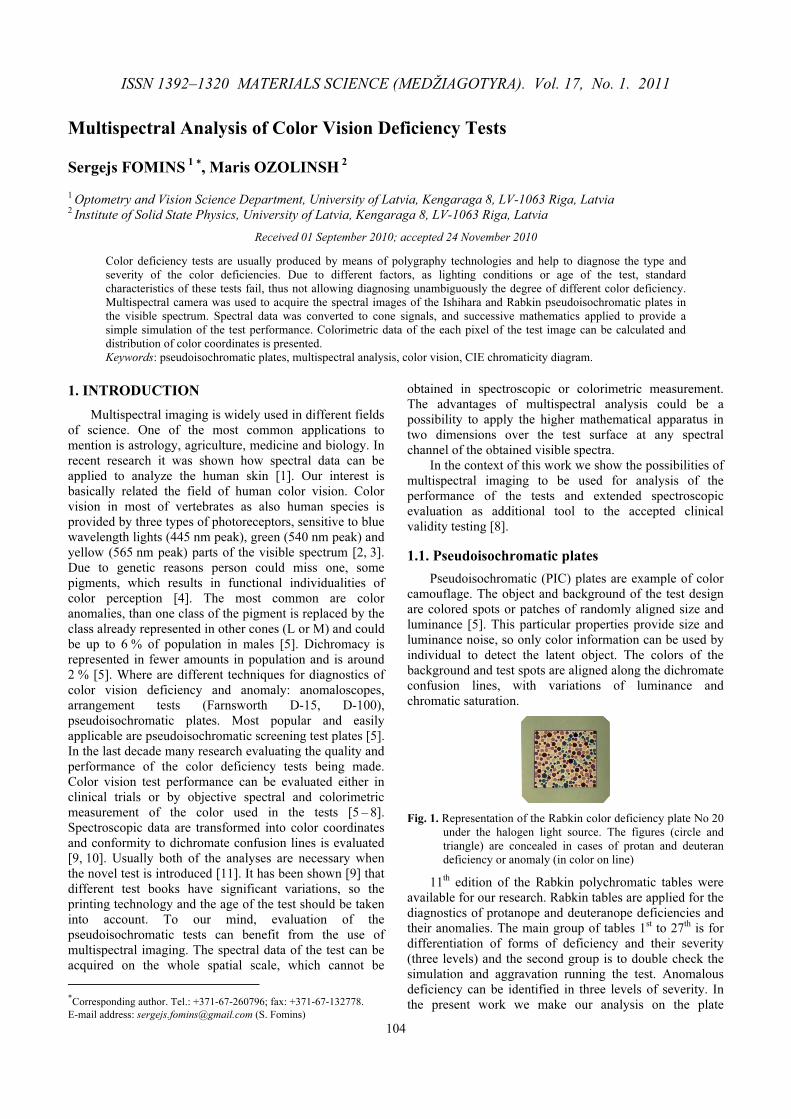
Fig. 1. Representation of the Rabkin color deficiency plate No 20
under the halogen light source. The figures (circle and
triangle) are concealed in cases of protan and deuteran
deficiency or anomaly (in color on line)
11th
edition of the Rabkin polychromatic tables were
available for our research. Rabkin tables are applied for the
diagnostics of protanope and deuteranope deficiencies and
their anomalies. The main group of tables 1st
to 27th
is for
differentiation of forms of deficiency and their severity
(three levels) and the second group is to double check the
simulation and aggravation running the test. Anomalous
deficiency can be identified in three levels of severity. In
the present work we make our analysis on the plate

� 105
seventeen of the Rabkin test, which helps to discern
between protanomaly and deuteranomaly within three
levels of severity [12].
Another test designed by Japanese doctor Shinobu
Ishihara in the beginning of the XX century is the one of
most popular and widely used printed tests was used for
analysis together with Rabkin test [9]. Both of these two
tests use the same "vanishing" design, when latent object is
concealed for individuals with anomaly or deficiency.
2. EXPERIMENTAL DETAILS
Spectral images of the tests were acquired with CRI
Nuance II Vis 07 spectral imaging system with Nikon AF
Micro-Nikkor 60mm f2.8D objective mounted. Spectral
images were taken in the range of 420 nm to 720 nm with
the 10 nm step. For the illumination of the test, ordinary
12 V 35 W halogen bulb without filter was used. There are
no specific lighting indications for Rabkin test [12]. The
Ishihara pseudoisochromatic test contains considerations
for daylight lit illumination [13]. In our geographic area it
could be not easy to find the daylight adequately lit room
in winter time. For this reason, we suggest, that in many
cases screening take place in different illumination condi-
tions and the most used is a typical halogen bulb light
source. The halogen bulb irradiance spectrum was meas-
ured with Ocean Optics USB4000-VIS-NIR spectrometer
through the calibrated Ocean Optics optical fiber. The
color temperature of the lamp is around 4000 K and it has
continuous spectra (Fig. 2).
Fig. 2. Halogen bulb (12 V, 35 W) irradiance spectrum
A semi gloss paper is used for Rabkin test and as a
result it produces the glare and smudges with the straight
lighting. To avoid the glare and reflections from the paper
surface, 45/0 illumination geometry was chosen [14]. The
spectral camera was placed just in front of the test and the
halogen bulb was placed 45 degrees to the test plane. The
light source was placed at 1.5 m distance to produce the
homogenous illumination of the measured
pseudoisochromatic plate's surface.
3. ANALYSIS
In case of color dichromacy subjects are missing long
wavelength sensitive (LWS or L cones in case of
protanopy) or middle wavelength sensitive receptors
(MWS or M in the case of deuteranopy). Multispectral data
provide an easy background for simulation of the
deficiencies, due to the possibility to apply the cone
spectral sensitivity functions to each pixel of the acquired
image and introduce the missing signal. In the case of
anomaly the pigment of LMS and M cones differs only
slightly, which results in reduced, but anyway trichromatic
color vision [4, 5].
To transform the acquired multispectral images to L,
M, S cone signals we have used the cone sensitivity
functions (Eq. 1)
∑ ⋅=
∑ ⋅=∑ ⋅=
720
420
;)()()(
720
420
);()()(
720
420
);()()(
λλλ
λλλλλλ
sWS
mWMlWL
(1)
where W(λ) is the multispectral image of the Rabkin tests
(consisting of 31 layer) obtained with the 10 nm step from
420 nm to 720 nm; l(λ), m(λ), s(λ) are the cone spectral
sensitivities by Stockmann et al. [2].
The 17th
plate of Rabkin test is really suitable for this
analysis, as it diagnose between deuter and protan with C
level of severity. Dichromate and A, B level subjects
would miss in this test. From the Ishihara 12th
plate was
chosen for analysis as it helps to identify severity of the
deuter- and protan- anomalies in a way similar to Rabkin
17th
plate. We were not aware of the color saturation and
design details of the tests, except available information on
test design [5]. The cones sensitivities used to design these
tests were slightly different from used in our study, as also
tests could be designed on the principles different from the
modern color science [15]. Fig. 3 and Fig. 4 show different
representations of the L and M signal proportions and
resulting appearance of the latent object. Through the
manipulations with the LMS images we have identified
that the 0.85L –
M case corresponds the most to the
behavior of the normal color vision subject and
proportional subtraction of a⋅0.85L –
b⋅M can be used to
simulate the anomaly (a, b > 0) or deficiency (a, b = 0) of
the one of the cone signals. In our analysis we have used
normalized cone sensitivities, which mean we have similar
signals of L, M and S cones influenced only by our
acquired multispectral data.
Fig. 3. Anomalous perception simulation for Rabkin plate No 17.
Protanomalous perception simulation would highlight
"triangle" object (bottom row) and simulation for
deuteranomalous perception would make "circle" object
more explicit (top row)
Fig. 4. Anomalous perception simulations for Ishihara plate
No 12. In the case of strong protanomaly object "five"
should be more prominent and in case of deuteranomaly,
person would perceive object "three". In the case of mild
anomalies person would see can see both numbers
protan-
omaly
deuter-
anomaly
�������������������������������������������������������������������
��������������� �������������������������������������������
protan-
omaly
deuter-
anomaly
��������������������������������������������������������������������
���������������� ������������������������������������������
� 106
In Figs. 3 and 4 a simple simulation of anomaly by
manipulating the L and M signal magnitudes is introduced.
The latent objects in the Fig. 3 (Rabkin test 17th
plate) are
separated according to the LWS or MWS cone signal
changes, which is in accord with the test design. In the case
of Ishihara plate No 13 (Fig. 4) latent objects are present
for deuteranomaly simulation and almost invisible for
protanomaly simulation. However, the test shows the right
tendency for object "three" to be present for deuteranope
deficiency and to disappear for protanope deficiency. It is
necessary to remark, that Ishihara`s PIC tests are designed
to be used in lit daylight illumination.
3.1. Distribution of color coordinates in CIE
chromaticity diagram
To obtain the coordinates for chromaticity diagram
color matching functions are necessary as defined by CIE
(Commission Internationale de l'éclairage) or International
Commission of Illumination. For our purposes we have
used CIE defined color matching functions for 10 degree
observer (1964), because measured test`s surface subtends
more than 2 degrees of visual angle in vertical and
horizontal directions [14 –
16].
In the pseudoisochromatic plates colors of the hidden
objects and background are supposed to be arranged along
the dichromate confusion lines. Multispectral analysis of
the tests helps to gather the spectra of the each point of the
image and allows calculation of CIE x, y coordinates each
particular pixel. Two-dimensional histogram of the CIE x,
y coordinates can be calculated, as shown in Fig. 5 and
Fig. 6. The latent objects of the Rabkin plate No 17 are
separated to decrease the confusion of coordinates and to
make the interpretation easier. The lines in the figures
show the direction of the dichromate confusion lines.
Confusion lines represent the series of narrow zones in
the CIE x, y with identically perceived colors for dichro-
matic vision. Colors along the isochromatic lines look the
same if no luminance difference is introduced between two
colors. Isochromatic data for anomalous trichromats are
similar to those of the corresponding dichromats, but do
not include the complete range of chromaticities [5]. For
this reason highly saturated colors can be perceived by
anomalous vision, and small color changes should be used
for classification of the severity of color anomaly. Dichro-
matic convergence points for isochromatic confusion lines
are given for all three types of deficiencies (see Table 1)
[5, 17].
In Fig. 5 (top) the biggest spot corresponds for the
yellow background, as it subtends the large area of the test.
The green spots (of the "triangle" object) are arranged
horizontally over the background spot and background red
spots are on the right of the background. There are four
spots which align along protanope confusion lines or
deuteranope confusion lines. For protanopic latent object
("circle") the top right spot is not on the confusion lines.
For the deuteranope stimuli top left spot do not have any
spot to be aligned with on the confusion line. In such way
these two spots are seen in the case of dichromacy. Spots
aligned on the confusion lines are arranged in different
distances from each other and in such way this design
makes the diagnostics of the severity possible.
Table 1. Copunctal points of dichromate confusion lines
Deficiency (anomaly) type x y
Protanopic (red lines) 0.7465 0.2535
Deuteranopic (green lines) 1.40 –0.40
Tritanopic 0.1748 0.00
Fig. 5. CIE x, y coordinates distribution for plate No 17 of Rabkin
test. Top figure is the 'triangle' object (seen by protanope)
and bottom figure is for the 'circle' object of the test (seen
by deuteranope). Red solid lines represent deuteranope
confusion lines with starting point in coordinate x = 1.40;
y = –0.40. Green dashed lines show confusion lines for the
protanope with coordinates at x = 0.7465; y = 0.2535 [17]
(in color on line)
The same logic can be applied for analysis of Ishihara
plate (Fig. 6). However, in this case arrangement of the
spots is not that obvious, especially for the object "five"
(Fig. 6, bottom). The influence of chromaticity coordinates
on test performance can be clearly seen in our simulation
in Fig. 4 for particular plate. As the spots of both objects
are aligned along the protanope confusion lines (green
lines), decrease of L signal is producing pronounced
vanishing of objects in simulated images. Almost all of the
spots of object "five" are aligned along deuteranope
confusion lines (Fig. 6, bottom), which makes the latent
object to disappear when M cone signal is decreased.
3.2. Hue dispersion
Conversion of the spectral data to the CIE x,y chroma-
ticity diagram coordinates can be used to analyze the hue
dispersion in the test. As we can see from Figs. 5 and 6 the
Ishihara test shows wider dispersion of the color

� 107
coordinates, for both – background and test stimuli.
However, no extension along some axis is present in the
Ishihara plate No 12. The dispersion can be characterized
with the
Fig. 6. CIE x,y coordinates distribution in plate No 12 of Ishihara
test. Top figure is for the "three" object and bottom figure
is for the "five" object. Red solid lines represent confusion
lines for the deuteranope with copunctal point in x = 1.40;
y = –0.40. Green dashed lines show confusion lines for the
protanope with coordinates at x = 0.7465, y = 0.2535 [17]
(in color on line)
Fig. 7. Dispersion of the test hues in the CIE x, y chromaticity
diagram and the Gaussian fit (two figures on the right) of
the data points. X axis in the graphs on the right show the
CIE x, y values. The probability is placed on the y axis
Gaussian function along two cardinal axes of the hue
distribution (Eq. 2)
2
2
2
)(
2
π2
1
)(σ
σ
ax
Gexf
−−
= , (2)
where σ is a standard deviation; e is an exponent function;
a is a mean value of the function.
To compare two tests we tried to find the σ (95 %) of
the Gaussian fit for the dispersion. For the Rabkin test
sigma values for the particular area (Fig. 7) were 0.0053
and 0.021 for cardinal axes of distribution. For Ishihara test
sigma values were 0.011 for the minor axis and 0.023 for
the major axis. Distributions for "triangle" object of
Rabkin plate No 17 appear not elongated in diagonal
direction, which can be seen for the "circle" objects colors
(Fig. 5).
Our results show that, in alternative to the previous
colorimetric or spectrometry studies, tests colors subtend
some area in the CIE x, y chromaticity diagram. We
suggest that dispersion can differ depending on the printing
technology and also the age of the test. This probably can
be the reason for Ishihara test to show larger dispersions.
However, it is difficult to judge about particular quantity.
This probably should be studied in connection with clinical
data, to understand the benefits or drawbacks of chromatic
dispersion on test performance.
4. RESULTS AND DISCUSSION
In the first part of analysis we have provided the
algorithm for two dimensional simulations of the color
deficiencies. The spectral data of each multispectral image
are transformed to cone signals images. Mathematics
similar to that between the cones inputs in the human
retina are applied to obtain the simulations of the
dichromatic perception of the color deficiency tests.
In the second part of our analysis colorimetric values
of the tests are calculated and their distributions across the
chromaticity diagram are given. The design of plates
becomes visible from the arrangement of the colors in the
CIE chromaticity diagram. Multispectral analysis provides
two dimensional spatial data and makes possible
calculation of the distribution of colors, which can arise to
different factors as: used printing technology and
dilapidation of the test. Distributions for Rabkin test show
elongation of the chromaticity coordinates in the diagonal
direction (from blue to yellow colors). No such elongation
is observed for Ishihara test plate. We should remark,
colors in Rabkin test are produced by printing technique
that uses halftoning. Ishihara test is printed by solid dyes
with no seen dots. However, this effect can be perceived
by high magnification and observing the test closely, but
the dots are not apparent in acquired multispectral images.
Colorimetric studies of the color deficiency tests
usually identify variations of the color coordinates from
test to test [9, 10]. If spectrometer of chromameter is used
for measurements only restricted part (or integral area) of
the test surface can be measured. To our mind, this can be
produced by variations of the coordinates in different
measurements and at different test spot locations. The
distributions of color coordinates for test object colors
shown in our analysis subtend area of 0.015 till 0.02 units
in CIE chromaticity diagram. Due to this fact, there is
some tolerance available for the alignment of the test
colors on the confusion lines. On the other side, if the
distributions overlap the confusion lines, too large
dispersions can impact the test diagnostic abilities.
5. CONCLUSIONS
We have measured the multispectral images of two
pseudoisochromatic test plates in the visible spectrum from
420 nm to 720 nm. Spectral images were converted to cone
��
��
� 108
signals with successive post-processing to introduce the
performance of the test for anomalous color vision. Color
coordinates of the test latent objects and background were
calculated and distributions of colors were found. We
suppose that, color dispersions are produced by print
technology, which is disclosed by elongation of chromatic
dispersion.
Acknowledgements
Research was supported by Latvian Council of Science
and European Social Fund (Project No 2009/0138/1DP/
/1.1.2.1.2/09/IPIA/VIAA/004. We are grateful to
Optometry and Vision Science Department of University
of Latvia for offered Rabkin and Ishihara
pseudoisochromatic plates.
REFERENCES
1. Jakovels, D., Spigulis, J., Saknite, I. Multi-spectral
Mapping of In-vivo Skin Hemoglobin and Melanin
Progress in Biomedical Optics and Imaging 11 (41) 2010
[Note(s): 77152Z.1-77152Z.6].
2. Stockman, A., Sharpe, L. T. Spectral Sensitivities of the
Middle- and Long-wavelength Sensitive Cones Derived
from Measurements in Observers of Known Genotype
Vision Research 40 2000: pp. 1711 –
1737.
3. Stockman, A. Sharpe, L. T. Tritanopic Color Matches and
the Middle- and Long-wavelength Sensitive Cone Spectral
Sensitivities Vision Research 40 2000: pp. 1739 –
1750.
4. Neitz, M., Neitz, J. Molecular Genetics of Color Vision and
Color Vision Defects Arch Ophthalm 118 2000:
pp. 691 –
700.
5. Birch, J. Diagnosis of Defective Color Vision. Second
edition. Butterworth-Heinemann, United Kingdom,
Edinburgh, 2001.
6. Cole, B. L. Assessment of Inherited Colour Vision Defects
in Clinical Practice Clinical and Experimental Optometry
90 2007: pp. 3157 –
175.
7. Cole, B. L., Lian, K. Y., Lakkis, G. The new Richmond
HRR Pseudoisochromatic Test for Colour Vision is Better
than the Ishihara Test Clinical and Experimental
Optometry 89 (2) 2006: pp. 73 –
80.
8. Birch, J., McKeever, L. M. Survey of the Accuracy of New
Pseudoisochromatic Plates Ophthalmic and Physiological
Optics 13 (1) 2007: pp. 35 –
40.
9. Lee, D. Y., Honson, M. Chromatic Variation of Ishihara
Diagnostic Plates Color Research and Application
Supplement 28 (4) 2003: pp. 267 –
276.
10. Bailey, J. E., Neitz, M., Tait, D. M., Neitz, J. Evaluation of
an Updated HRR Color Vision Test Visual Neuroscience
21 2004: pp. 431 –
436.
11. Neitz, M., Neitz, J. A New Mass Screening Test for Color –
Vision Deficiencies in Children Color Research and
Application. Tests and Techniques Supplement 26 2001:
pp. 239 –
249.
12. Rabkin, E. B. Polychromatic Plates for Color Sense
Examination (Е. Б. Рабкин "Полихроматические таблицы
для исследования цветоощущения"). (10th
ed.).
Ю. М. Сапожков, Minsk, 1998.
13. Ishihara, S. Ishihara`s Test for Colour Blindness. Concise
Edition. Isshinkai, Tokyo, Japan, 1965.
14. Hunt, R. W. G. Measuring Color (2nd
ed.). Ellis Horwood,
New York, 1991.
15. Brainard, D. H., Stockman, A. Colorimetry. OSA
Handbook of Optics (3rd edition, M. Bass, ed). McGraw-
Hill, New York, 2010: pp. 10.1 –
10.52.
16. Berns, R. S. Billmayer and Saltzman`s Principles of Color
Technology. (3rd edition). Wiley, New York, 2000.
17. Smith, V. C., Pokorny, J. Spectral Sensitivity of the Foveal
Cone Photopigments between 400 and 500 nm Vision
Research 15 1975: pp. 161 –
171.