multiple sclerosis: risk perception, symptoms and
TRANSCRIPT

MULTIPLE SCLEROSIS: RISK PERCEPTION, SYMPTOMS AND TREATMENT
A Thesis Submitted to the College of
Graduate and Postdoctoral Studies
In Partial Fulfillment of the Requirements
For the Degree of Doctor of Philosophy
In the School of Public Health
University of Saskatchewan
Saskatoon
By
Khrisha Bernadine Alphonsus
© Copyright Khrisha Bernadine Alphonsus, June, 2019. All rights reserved.
i
PERMISSION TO USE
In presenting this thesis/dissertation in partial fulfillment of the requirements for a Postgraduate
degree from the University of Saskatchewan, I agree that the Libraries of this University may
make it freely available for inspection. I further agree that permission for copying of this
thesis/dissertation in any manner, in whole or in part, for scholarly purposes may be granted by
the professor or professors who supervised my thesis/dissertation work or, in their absence, by
the Head of the Department or the Dean of the College in which my thesis work was done. It is
understood that any copying or publication or use of this thesis/dissertation or parts thereof for
financial gain shall not be allowed without my written permission. It is also understood that due
recognition shall be given to me and to the University of Saskatchewan in any scholarly use
which may be made of any material in my thesis/dissertation. I certify that the version I
submitted is the same as that approved by my advisory committee.
Requests for permission to copy or to make other uses of materials in this thesis/dissertation in
whole or part should be addressed to:
Requests for permission to copy or to make other uses of materials in this thesis/dissertation in
whole or part should be addressed to:
Executive Director, School of Public Health
University of Saskatchewan
104 Clinic Place Saskatoon
Saskatchewan S7N 2Z4
Canada
OR
Dean, College of Graduate and Postdoctoral Studies
University of Saskatchewan
116 Thorvaldson Building, 110 Science Place
Saskatoon, Saskatchewan S7N 5C9
Canada

ii
ABSTRACT
Multiple sclerosis (MS) is a neurological disease of the central nervous system which causes the
nerves to deteriorate over time. MS affects individuals between the ages of 20 to 45 years of age
and both biological and environmental factors are associated with the disease. Canada has one of
the highest rates of MS in the world along with several European countries. The definitive cause
and cure for MS had not been determined and because of this the quality of life of people living
with MS is poor. This thesis investigates the following topics: population awareness about
second hand smoke exposure and its association with MS; the importance of having social
support and its effect on managing pain in MS; medication use; and the effectiveness of exercise
in improving the physical, mental and social quality of life of people living with MS.
The analysis shows that there was a lack of knowledge in second hand smoke exposure and risk
of MS development in the Canadian population. Individual responses in agreeing or disagreeing
to whether second hand smoke exposure was a risk factor for MS varied based on the provinces
in which respondents resided, demographic factors, having a member of the household smoke
inside the home and whether the respondents were bothered by second hand smoking.
Analysis of national survey data of people living with MS found that having social support was
beneficial for reducing pain. Having someone to take you to the doctor, confide/talk to, to do
something enjoyable with and to take you to the emergency was found to be significantly
associated with a lower reporting of pain. In a separate analysis, using complementary treatment
for MS was associated with lower odds of medication use. The use of behavior modification
models as a tool for medication adherence is important for individuals living with chronic
conditions who have a hard time coping with change.
In an analysis of the effect of complementary therapies on MS, aerobic exercise such as treadmill
training, cycling, aquatic exercise and high intensity interval training and physiotherapy was
found to have greater effect on physical, mental and social health as opposed to other types of
complementary treatments.

iii
ACKNOWLEDGEMENTS
First, I would like to thank God for giving me the knowledge and strength to complete this
research. I would like to express my sincere gratitude to my PhD supervisor, Dr. Carl D’Arcy for
his unconditional support, guidance, advices and expertise throughout this research.
I want to thank my thesis advisory committee Dr. Rein Lepnurm, Dr.Wolfgang Walz, Dr.
Xiangfei Meng and Dr. Cindy Feng (chair) for their support and guidance. I would like to
express my gratitude to all of the faculty members who have taught me throughout the years at
the University of Saskatchewan. I also want to thank Mrs. Marylin Rana, thesis-based program
assistant for organizing committee meetings and for her support.
I also want to express my gratitude to Statistics Canada for their support in granting me
permission to use the Survey on Living with Neurological Conditions in Canada (SLNCC) data
set and the Saskatchewan Research Data Centre (RDC) for providing me accesses to carry out
the data analysis.
I acknowledge the financial support received from the School of Public Health and University of
Saskatchewan for Graduate Scholarships and Graduate Teaching Fellowship. I acknowledge the
Canadian Research Data Centre Network for the Emerging Scholars Grant as well as travel
awards received jointly from the College of Graduate and Postdoctoral Studies, the International
Student and Study Abroad Centre, the Graduate Students Association and the University of
Saskatchewan Students’ Union as well as the Canadian Institute of Health Research (CIHR) and
School of Public Health.
iv
DEDICATION
To my Mom (Mary Expedita Sebastiampillai Alphonsus) and Dad (Alphonsus Santhiyapillai) for
their love, support, guidance, prayers and for believing in me.

v
TABLE OF CONTENTS
PERMISSION TO USE ................................................................................................................... i
ABSTRACT .................................................................................................................................... ii
ACKNOWLEDGEMENTS ........................................................................................................... iii
DEDICATION ............................................................................................................................... iv
TABLE OF CONTENTS ................................................................................................................ v
LIST OF TABLES ....................................................................................................................... viii
LIST OF FIGURES ....................................................................................................................... ix
LIST OF ABBERVIATIONS ....................................................................................................... xii
CHAPTER 1: AN INTRODUCTION TO MULTIPLE SCLEROSIS ........................................... 1
1.1 Demographic Factors Associated with Multiple Sclerosis ................................................... 1
1.2 Types of Multiple Sclerosis................................................................................................... 2
1.3 Diagnosis of Multiple Sclerosis ............................................................................................ 4
1.4 Genetic and Environmental Factors Associated with Multiple Sclerosis ............................. 4
1.5 Treatment for Multiple Sclerosis........................................................................................... 7
1.6 Complementary treatment for MS......................................................................................... 8
1.7 The health care cost of MS .................................................................................................... 9
1.8 Overview of MS in Canada ................................................................................................... 9
1.8 References ........................................................................................................................... 17
CHAPTER 2: OBJECTIVES OF THIS RESEARCH .................................................................. 24
2.1 Rationale for this Research ................................................................................................. 24
2.2 Context of this Research ..................................................................................................... 24
2.3 Study Design ....................................................................................................................... 25
2.4 Data Sources ........................................................................................................................ 26
2.5 Statistical Analysis .............................................................................................................. 27
2.6 References ........................................................................................................................... 28
CHAPTER 3: PREDICTORS OF PEOPLE’S PERCEPTIONS OF SECOND HAND SMOKE
EXPOSURE AS A RISK FACTOR FOR MULTIPLE SCLEROSIS ......................................... 29
3.1 Introduction ......................................................................................................................... 30
3.2 Methods ............................................................................................................................... 33
3.2.1 Data Source................................................................................................................... 33
3.2.2 Study Sample ................................................................................................................ 33
vi
3.2.3 Variables assessed ........................................................................................................ 35
3.3 Analysis ............................................................................................................................... 35
3.4 Results ................................................................................................................................. 36
3.4.1 Results based on complete case analysis ...................................................................... 36
3.4.2 Results based on Multiple Imputation .......................................................................... 50
3.5 Discussion ........................................................................................................................... 55
3.7 References ........................................................................................................................... 60
CHAPTER 4: PSYCHOSOCIAL FACTORS ASSOCIATED WITH PAIN IN PEOPLE WITH
MS ................................................................................................................................................. 64
4.1 Introduction ......................................................................................................................... 65
4.2 Methods ............................................................................................................................... 69
4.2.1 Data Source................................................................................................................... 69
4.2.2 Variables assessed ........................................................................................................ 69
4.3 Analysis ............................................................................................................................... 70
4.4 Results ................................................................................................................................. 71
4.5 Discussion ........................................................................................................................... 74
4.6 References ........................................................................................................................... 78
CHAPTER 5: USING COMPLEMENTARY/ALTERNATIVE TREATMENTS (CAMS)
REDUCE ADHERENCE TO MS MEDICATION ...................................................................... 82
5.1 Introduction ......................................................................................................................... 83
5.2 Methods ............................................................................................................................... 86
5.2.1 Data Source................................................................................................................... 86
5.2.2 Variables assessed ........................................................................................................ 86
5.3 Analysis ............................................................................................................................... 87
5.4 Results ................................................................................................................................. 89
5.5 Discussion ........................................................................................................................... 97
5.6 References ......................................................................................................................... 102
CHAPTER 6: THE EFFECT OF EXERCISE, YOGA AND PHYSICAL THERAPY ON THE
QUALITY OF LIFE OF PEOPLE WITH MULTIPLE SCLEROSIS: SYSTEMATIC REVIEW
AND META-ANALYSIS. ......................................................................................................... 106
6.1 Quality of Life and MS ..................................................................................................... 107
6.2 Methods ............................................................................................................................. 109
6.2.1 Data sources and searches .......................................................................................... 109
vii
6.2.2 Effect sizes and statistical analysis ............................................................................. 110
6.3 Results ............................................................................................................................... 111
6.3.1 The Effect of Aerobic, Anaerobic, Mixed Exercise, Yoga and Physiotherapy on
Physical, Mental and Social Domains of Quality of Life .................................................... 119
6.3.2 Aerobic Exercise ......................................................................................................... 123
6.3.3 Anaerobic Exercise ..................................................................................................... 127
6.3.4 Yoga............................................................................................................................ 127
6.3.5 Physiotherapy ............................................................................................................. 127
6.3.6 Combination of exercises ........................................................................................... 130
6.3.7 Summary of Results.................................................................................................... 130
6.4 Discussions ........................................................................................................................ 132
6.5 References ......................................................................................................................... 135
CHAPTER 7: CONCLUSIONS ................................................................................................. 142
7.1 Summary of Findings ........................................................................................................ 142
7.2 Practical Implications ........................................................................................................ 145
7.3 Limitations ........................................................................................................................ 146
7.4 Future Work ...................................................................................................................... 147
APPENDIX A: Additional file for Chapter 6 ............................................................................. 149
viii
LIST OF TABLES
Table 1.1: Protective and risk factors associated with MS. Adapted from (Ramagopalan et al.,
2010). ...............................................................................................................................................5
Table 1.2: Prevalence of MS in Canadian Provinces. Adapted from (Beck et al.,2005). ..............14
Table 3. 1:Descriptive statistics and univariate analysis for perception of second hand smoking as
a risk factor for MS based on complete case analysis (N=4,229)………………………………..38
Table 3. 2: Multivariate analysis for perceptions of second hand smoke as a risk factor for MS
based on complete case analysis (N=4,229). .................................................................................41
Table 3. 3: Comparison of categorical variables that were significant from multivariate analysis
based on p<0.05. ............................................................................................................................46
Table 3.4:Descriptive statistics and univariate analysis for perception of second hand smoking as
a risk factor for MS based on multiple imputations (N=7,166). ....................................................51
Table 3. 5:Multivariate analysis for perceptions of second hand smoke as a risk factor for MS
based on multiple imputation. ........................................................................................................53
Table 4.1:Descriptive statistics and univariate analysis of predictors associated with
pain………………………………………………………………………………………….........72
Table 4.2: Multivariate analysis of predictors association with odds of pain in people with
MS…. .............................................................................................................................................73
Table 5.1: Univariate analysis for predictors associated with medication
usage……………………………………………………………………………………………..92
Table 5. 2: Multivariate analysis of predictors associated with medication usage. .......................96
Table 5. 3: Comparisons of odds ratios based on significant variables from the multivariate
analysis. ..........................................................................................................................................97
Table 6.1: Description of studies that were included in the meta-analysis……………………..113
Table 6.2:Effect size estimates for interventions based on domains of quality of life. ...............131
ix
LIST OF FIGURES
Figure Page
Figure 1.1: Clinically isolated syndrome is the first attack of MS on an individual and lasts for 24
hours which causes inflammation or demyelination. Figure adapted from (MS Society of
Canada,2018). ..................................................................................................................................2
Figure 1.2: Relapsing-remitting MS is the most common type with new symptoms appearing
during relapses. Figure adapted from (MS Society of Canada,2018). .............................................3
Figure 1.3: Secondary progressive MS starts off with relapses and disability gets worse over
time. Figure adapted from (MS Society of Canada,2018). ..............................................................3
Figure 1.4: Primary progressive MS is defined by a gradual increase in disability without
relapses. Figure adapted from (MS Society of Canada,2018). ........................................................4
Figure 1.5: Multiple sclerosis crude prevalence rate for individuals aged 20 years and older in
Canada from 2003 to 2015. Adapted from (Public Health Agency of Canada, Public Health
Infobase, 2018). .............................................................................................................................11
Figure 1.6: Multiple sclerosis age standardized incidence rate per 100,000 for individuals ages 20
years and older in Canada from 2003 to 2015. Adapted from (Public Health Agency of Canada,
Public Health Infobase, 2018). .......................................................................................................12
Figure 1.7: Multiple sclerosis crude incidence rate per 100,000 in Canada for 2015. Adapted
from (Public Health Agency of Canada, Public Health Infobase, 2018). ......................................13
Figure 1.8: Mortality rates from MS in Canada from 1975 to 2009. Adapted from (Public Health
Agency of Canada, Public Health Infobase, 2018). .......................................................................16
Figure 3. 1: Model for predictors associated with people’s perceptions of whether second hand
smoke exposure is associated with MS…………………………………………………………..32
Figure 3. 2: Flow chart of study sample used for complete case analysis. ....................................34
Figure 3. 3: Number of respondents by province. .........................................................................37
Figure 3.4:The percentage of respondents who agreed or disagreed to second hand smoke
exposure being a risk factor for MS development out of 4,229 observations. ..............................37
Figure 3. 5: Predicted probabilities and 95% CI of agreement for second hand smoking as a risk
factor for MS by sex and smoking status. ......................................................................................47

x
Figure 3. 6: Predicted probabilities and 95% CI of agreement for second hand smoking as a risk
factor for MS by age. .....................................................................................................................48
Figure 3.7:Predicted probabilities and 95% CI of agreement for second hand smoking as a risk
factor for MS by whether respondent was bothered by second hand smoke exposure. ................49
Figure 4.1: Biopsychosocial model of pain recognizes that psychological, social and
environmental factors play a role in pain. Adapted from (Gatchel et al.,2007).………………..66
Figure 4. 2: Pain Model. This diagram shows the variables which are considered in the model
building process for pain…………………………………………………………………………68
Figure 4.4: Percentage of people with pain vs no pain…………………………………………..71
Figure 5. 1: Model for MS medication use………………………………………………………88
Figure 5. 2: Number of people living with MS based on age categories………………………... 90
Figure 5. 3: Percentage of people living with MS based on income categories…………………90
Figure 5. 4: Education level of respondents with MS…………………………………………… 91
Figure 6. 1:PRISMA flow diagram for exercise, yoga and physical therapy on health related
quality of life……………………………………………………………………………………111
Figure 6.2: a) The effect of all types of complementary therapy on the physical health of people
living with MS. b) Funnel plot with pseudo 95% confidence limits for all types of
complementary therapy. ...............................................................................................................120
Figure 6.3:a) The effect of all types of complementary therapy on the mental health of people
living with MS. b) Funnel plot with pseudo 95% confidence limits for all types of
complementary therapy. ...............................................................................................................121
Figure 6.4: a) The effect of all types of complementary therapy on the social health of people
living with MS. b) Funnel plot with pseudo 95% confidence limits for all types of
complementary therapy. ...............................................................................................................122
Figure 6.5: a) The effect of aerobic exercise on the physical health of people living with MS. b)
funnel plot with pseudo 95% confidence limits for aerobic exercise. .........................................124
Figure 6.6: a) The effect of aerobic exercise on the mental health of people living with MS. b)
funnel plot with pseudo 95% confidence limits for aerobic exercise. .........................................125
Figure 6.7: a) The effect of aerobic exercise on the social health of people living with MS. b)
Funnel plot with pseudo 95% confidence limits for aerobic exercise. ........................................126

xi
Figure 6. 8: a) The effect of physiotherapy on the physical health of people living with MS. b)
Funnel plot with pseudo 95% confidence limits for physiotherapy. ...........................................128
Figure 6. 9:a) The effect of physiotherapy on the mental health of people living with MS. b)
Funnel plot with pseudo 95% confidence limits for physiotherapy. ...........................................129
xii
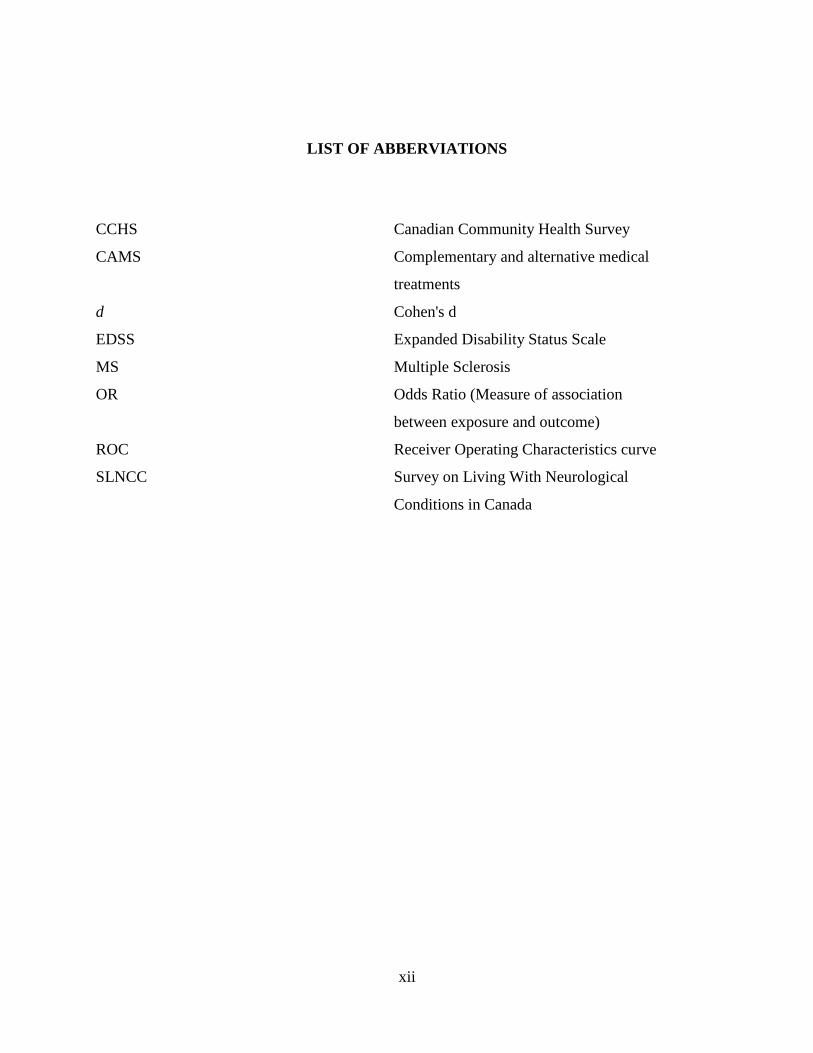
LIST OF ABBERVIATIONS
CCHS Canadian Community Health Survey
CAMS Complementary and alternative medical
treatments
d Cohen's d
EDSS Expanded Disability Status Scale
MS Multiple Sclerosis
OR Odds Ratio (Measure of association
between exposure and outcome)
ROC Receiver Operating Characteristics curve
SLNCC Survey on Living With Neurological
Conditions in Canada
1
CHAPTER 1: AN INTRODUCTION TO MULTIPLE SCLEROSIS
1.1 Demographic Factors Associated with Multiple Sclerosis
Multiple sclerosis (MS) is a neurological disease of the central nervous system that attacks the
myelinated axons.1–3 As of 2008, the countries with the highest estimated prevalence include
Hungary (176 per 100 000), Slovenia (150), Germany (149), United States of America (135),
Canada (132.5), Czech Republic (130), Norway (125), Denmark (122), Poland (120) and Cyprus
(110).4 The Canadian Institute for Health Information (CIHI) states that there are an estimated
93,500 Canadians who live with MS which makes Canada one of the countries with the highest
rates of this disease.5 In a recent study in Ontario, Canada found that the prevalence of MS
increased by 69% from 1.57 per 1,000 in 1996 to 2.65 in 2013.6 This increase in prevalence was
due to decline in mortality rates, the incidence remained stable.6 In another study based in
Canada estimated the number of incidence MS cases per year to rise from 4051 cases in 2011 to
4794 cases per 100 000 in 2031.7
When looking at the demographic variables, women are affected in greater numbers in
comparison to men and people of Northern European descent are at an increased risk.1 MS
affects individuals starting between the ages of 20 to 45 years of age and though sometimes the
disease starts in childhood.8–10 Both biological and environmental factors are associated with the
disease.8–10 Life expectancy of patients with MS is shortened 7 to 14 years compared to the
general population.11 However, disability as a result of the disease is progressive and therefore
diminishes the quality of life over time.12 About 20% of patients are bedridden after 15 years
following the onset of MS. Another 20% of patients may require a wheelchair or use crutches
because of walking diffculties.12

2
1.2 Types of Multiple Sclerosis
There are four categories of MS which include relapsing-remitting, secondary progressive,
primary progressive and progressive relapsing MS.1 Approximately 85% of patients with MS
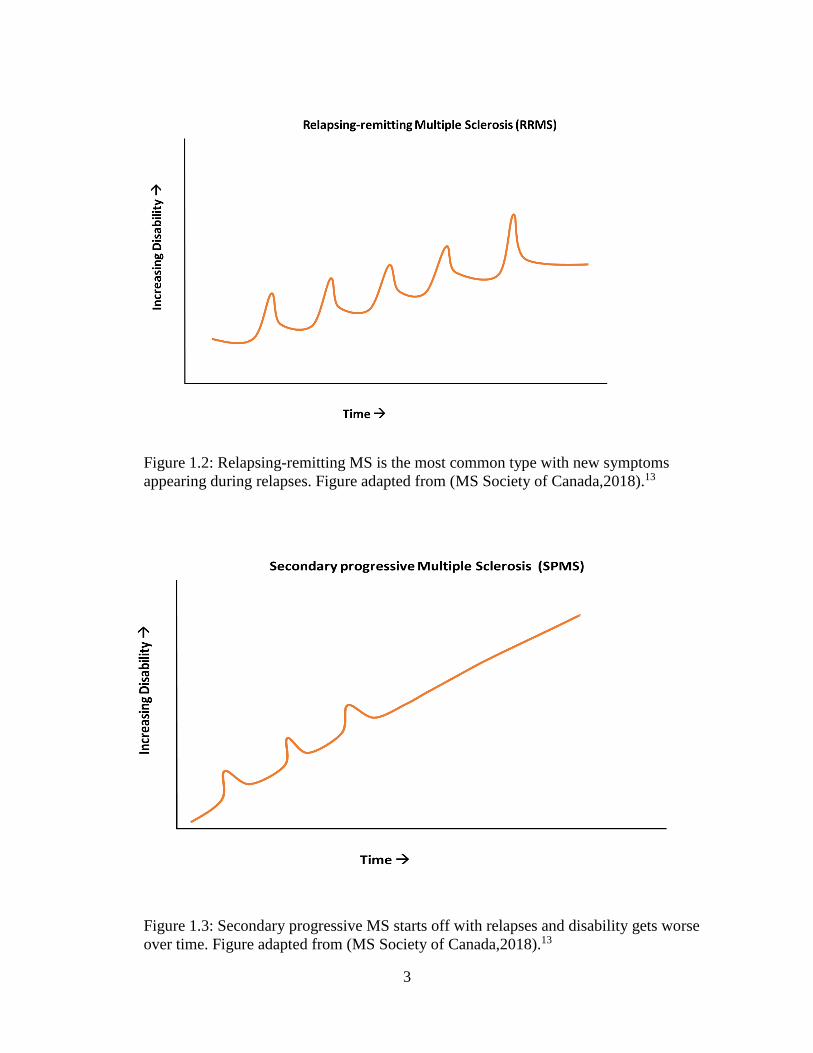
have the relapsing remitting form which consists of episodic relapses and remissions. The first
attack is known as a clinically isolated syndrome (CIS) which is a single episode of neurological
symptoms which suggest that MS is present (figure 1.1).13 Magnetic resonance imaging (MRI)
tests are usually done in order to find if there are any abnormalities in the brain or spinal cord.13
If multiple attacks occur then the disease is seen as entering in the relapsing remitting stage
(RRMS) (figure 1.2).13 RRMS is characterized by unpredictable relapses which are defined as
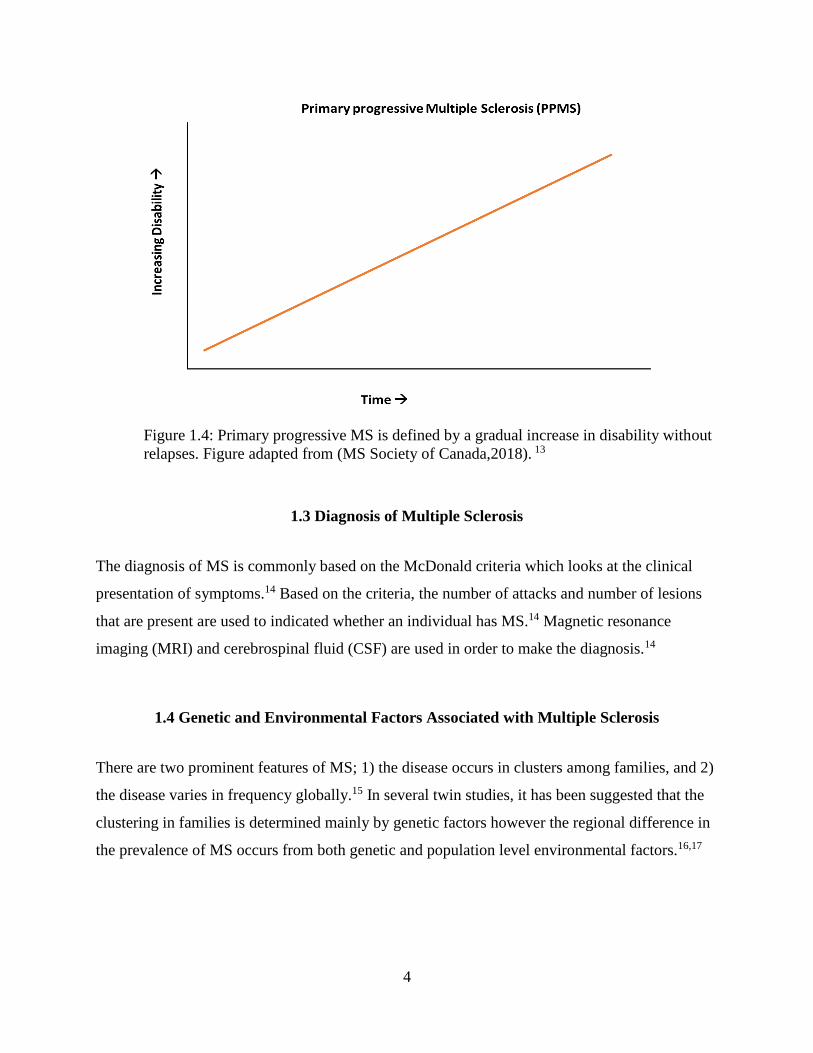
flare-ups in which new symptoms may occur.13 After RRMS, the patients disease tend to evolve
into secondary progressive MS (SPMS) (figure 1.3).13 In this stage relapses and remission
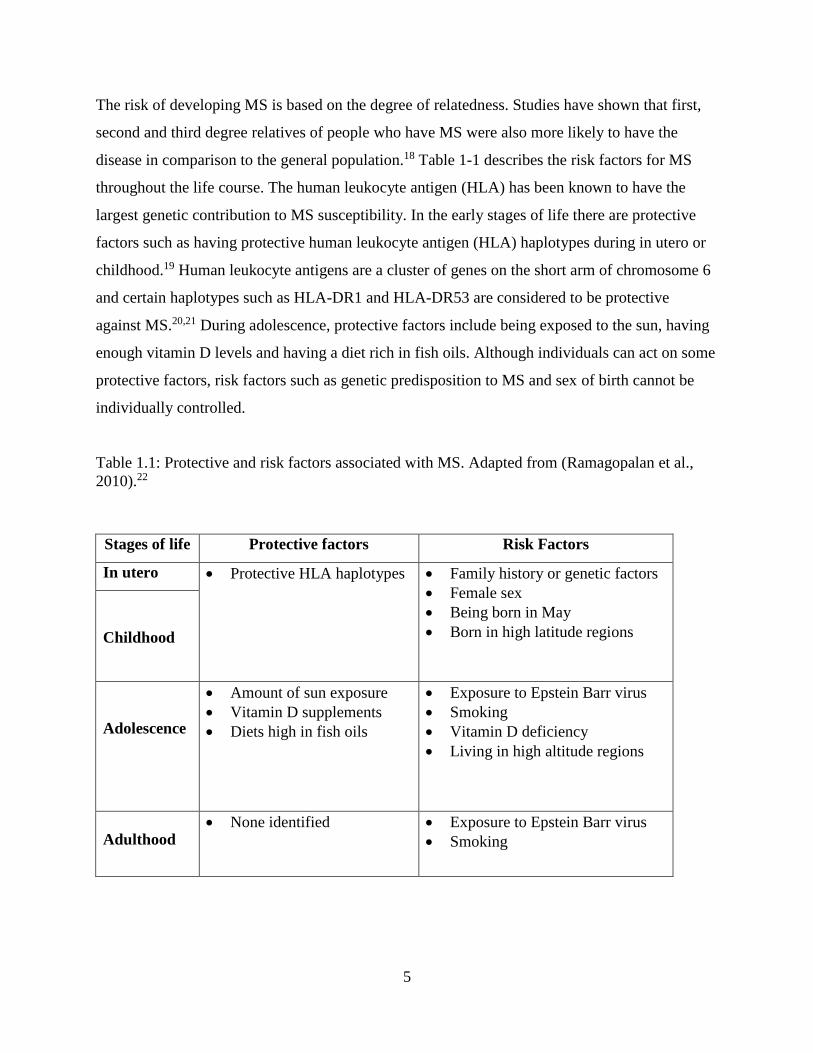
become less noticeable and disease progression is steady.13 Only 15% of patients will have a
primary progressive MS type and some will transition to progressive relapsing MS (figure
1.4).13 Progressive relapsing MS is caused by a slow progression in disability without relapses.13
Figure 1.1: Clinically isolated syndrome is the first attack of MS on an individual and lasts for 24
hours which causes inflammation or demyelination. Figure adapted from (MS Society of
Canada,2018).13
3
Figure 1.2: Relapsing-remitting MS is the most common type with new symptoms
appearing during relapses. Figure adapted from (MS Society of Canada,2018).13
Figure 1.3: Secondary progressive MS starts off with relapses and disability gets worse
over time. Figure adapted from (MS Society of Canada,2018).13
4
Figure 1.4: Primary progressive MS is defined by a gradual increase in disability without
relapses. Figure adapted from (MS Society of Canada,2018). 13
1.3 Diagnosis of Multiple Sclerosis
The diagnosis of MS is commonly based on the McDonald criteria which looks at the clinical
presentation of symptoms.14 Based on the criteria, the number of attacks and number of lesions
that are present are used to indicated whether an individual has MS.14 Magnetic resonance
imaging (MRI) and cerebrospinal fluid (CSF) are used in order to make the diagnosis.14
1.4 Genetic and Environmental Factors Associated with Multiple Sclerosis
There are two prominent features of MS; 1) the disease occurs in clusters among families, and 2)
the disease varies in frequency globally.15 In several twin studies, it has been suggested that the
clustering in families is determined mainly by genetic factors however the regional difference in
the prevalence of MS occurs from both genetic and population level environmental factors.16,17
5
The risk of developing MS is based on the degree of relatedness. Studies have shown that first,
second and third degree relatives of people who have MS were also more likely to have the
disease in comparison to the general population.18 Table 1-1 describes the risk factors for MS
throughout the life course. The human leukocyte antigen (HLA) has been known to have the
largest genetic contribution to MS susceptibility. In the early stages of life there are protective
factors such as having protective human leukocyte antigen (HLA) haplotypes during in utero or
childhood.19 Human leukocyte antigens are a cluster of genes on the short arm of chromosome 6
and certain haplotypes such as HLA-DR1 and HLA-DR53 are considered to be protective
against MS.20,21 During adolescence, protective factors include being exposed to the sun, having
enough vitamin D levels and having a diet rich in fish oils. Although individuals can act on some
protective factors, risk factors such as genetic predisposition to MS and sex of birth cannot be
individually controlled.
Table 1.1: Protective and risk factors associated with MS. Adapted from (Ramagopalan et al.,
2010).22
Stages of life Protective factors Risk Factors
In utero Protective HLA haplotypes Family history or genetic factors
Female sex
Being born in May
Born in high latitude regions
Childhood
Adolescence
Amount of sun exposure
Vitamin D supplements
Diets high in fish oils
Exposure to Epstein Barr virus
Smoking
Vitamin D deficiency
Living in high altitude regions
Adulthood None identified Exposure to Epstein Barr virus
Smoking

6
Along with genetics, environmental factors have been known to play a role in MS
development.9,23 Epstein-Barr virus (EBV) has been found to be a risk factor in many studies.9
The risk for MS increases among individuals who have a history of infectious mononucleosis
which occurs due to EBV infection as a teenager or in adulthood.9 The increased risk of
developing MS for individuals who had EBV is possibly due to the enhanced permeability of the
blood brain barrier which is triggered by the acute primary EBV infection.24 Once the B-cells
cross the blood brain barrier and enter CNS, various mechanisms take part that result in the
development of MS pathology.24 Other environmental factors such as smoking and lack of
vitamin D can result in an interaction with EBV which could also lead to MS.24 However, some
studies have found that there is a low risk for MS among individuals who are seronegative for
EBV and more than 95% of the adult population are infected with EBV therefore it is not
possible for all of them to develop MS.9 This is known as the EBV paradox.
Other risk factors for MS include cigarette smoking. Studies have indicated that smoking
increases the risk of conversion from clinical isolated syndrome to MS.22,25 Several studies have
found an increased risk of developing MS among individuals who smoke cigarettes.26 One study
found a hazard ratio of 3.6 (95% CI 1.3 to 9.9) for individuals who had ever smoked a cigarette
compared with individuals who had never smoked.26 Another study done in Sweden found that
smoking affects the risk of developing MS regardless of the age at exposure and both duration
and intensity of smoking increases the risk of MS.27 Second hand smoke exposure is associated
with many health effects such a cardiovascular disease and cancer and is also a risk factors for
MS. In a study done on passive smoke exposure and its effect on MS, it was found that exposure
to smoke is associated with higher risk of developing MS.28
Lack of vitamin D is also a risk factor for MS. Vitamin D is available from two sources, the first
is through exposure to ultraviolet B radiation (UVB) through sunlight and the second is through
diet.29 Foods such as milk, cereal, orange juice, cheese, salmon, tuna and vitamin supplements
contains vitamin D2.29 Increased vitamin D which is associated with lower risk of MS could be
due to apoptosis of the autoreactive B-cells.24 There is an inverse relationship between amount of
UVB received from sunlight and vitamin D concentration. One study found that individuals who
were exposed to sunlight for at least 2 hours per day had lower odds of getting MS OR=0.47

7
(95%CI 0.26 to 0.84).29 Another study found that higher sun exposure as a child and in early
adolescence was associated with a decreased risk of MS development.30
However, other studies have found that vitamin d levels and sunlight are independent of each
other.31 Vitamin D supplementation compared to natural sunlight has still not been proven to be
effective in altering disease activity.31 Regardless of whether these hypothesis are valid,
individuals who have low levels of vitamin D could still take these supplements at moderate
doses as a protective mechanism.31
1.5 Treatment for Multiple Sclerosis
There is no cure for the disease, however, there are several treatment options for minimizing the
symptoms of MS such as medication, venous angioplasty, stem cell therapy, urinary
catheterization, rehabilitation and psychotherapy however, medication is the most widely used
treatment for controlling symptoms of MS and preventing relapses from occurring.32 Disease
modifying therapies help shorten the duration of MS attacks and decrease their frequency. There
are currently eight types of medications that are used to reduce disease progressions.1 These
include drugs such as Beta interferons (Avonex, Rebif, Betaseron, Extavia), Glatiramer acetate
(Copaxone), Mitroxantrone (Novantrone), Natalizumab (Tysabri), Fingolimod (Gilenya).1 Since
medications don’t cure MS, many patients turn to other types of treatments and become less
adherent to taking medication as prescribed. One of the most controversial treatments is an
angioplasty procedure known as liberation therapy in which the “blocked” veins are opened up in
order to improve blood flow and drainage from the brain.33 Chronic cerebrospinal venous
insufficiency (CCSVI) in which the veins are blocked was proposed by the Italian physician Dr.
Zamboni as the cause of MS, however evidence now strongly suggests that CCSVI does not lead
to MS.34–36

8
1.6 Complementary treatment for MS
Complementary treatment is treatment that is used along with medication.37 Non-invasive MS
treatments include a wide range of options such as exercise, food and diet, stress management
and acupuncture.37 At least a third of MS patients have used complementary and alternative
treatments (CAM). Exercise is one type of complementary treatment that has been shown to
improve movement and balance among patients with MS. In addition, exercise reduces stress and
promotes recovery in patients with MS.38,39 However there has been few studies that have
examined the effect of various types of exercises and physical therapy on the different domains
of quality of life such as physical, mental and social. Although exercise may benefit overall
quality of life, the effects on specific domains such as the physical domain; the mental and social
domains has been less studied.
Types of complementary treatment include cannabis, diet, exercise, vitamin and mineral
supplements, relation techniques, acupuncture, massage and psychological approaches.40 Many
reviews have stated that exercise and yoga has improved many aspects of a person’s life
especially in those with MS.41 Yoga is an Indian practice that incorporates mind and body
awareness. There are many types of yoga such as Hatha which focuses on poses and breathing,
Ashtanga and Vinyasa yoga which is more physically demanding, Iyengar yoga which is based
on the precision of the poses, Bikram yoga which is taught in a heated room and Kundalini yoga
based on breathing and physical poses.42 In a randomized controlled trail of yoga and exercise in
MS it was found that subjects with MS who participated in either a 6 month yoga or exercise
class showed an improvement in fatigue as opposed to the control group.43 In another study done
on an Ananda yoga program found that significant improvements were found in strength,
balance, mental health and overall quality of life.44 Other types of complementary treatments
such as massage therapy has also been found to reduce pain, improve balance and walking speed
and those who used both massage therapy and exercise therapy were also found to reduce pain.45

9
1.7 The health care cost of MS
In Canada the total per capita health care cost for adults who were 20 and older in 2011 was
$16,800 for individuals with MS.7 The total annual heath sector costs for MS is expected to risk
to $2 billion by 2013.7 In a study done in Canada where MS patients completed a web based
questionnaire, it was found that the mean cost per patient per year increased as disability
increased.46 Patients with mild disability define by an expanded disability status scale (EDSS)
score from 0 to 3 spent a mean of $30,836 per year and for a patient with severe disability (EDSS
4 to 6.5) a patient spent a mean of $77,981 per year.46 Another Canadian study stated that the
largest cost associated with EDSS was the inability to work which increased as EDSS
increased.47 However if disease progression is delayed or slowed these costs can be reduced.
1.8 Overview of MS in Canada
Canada has one of the highest rates of MS in the world.48 Based on the Survey of Living with
Neurological Conditions in Canada (SLNCC) 2010 to 2011 there were 93,500 Canadians
diagnosed with Multiple Sclerosis (MS) with a prevalence of 290 cases per 100,000 people.49
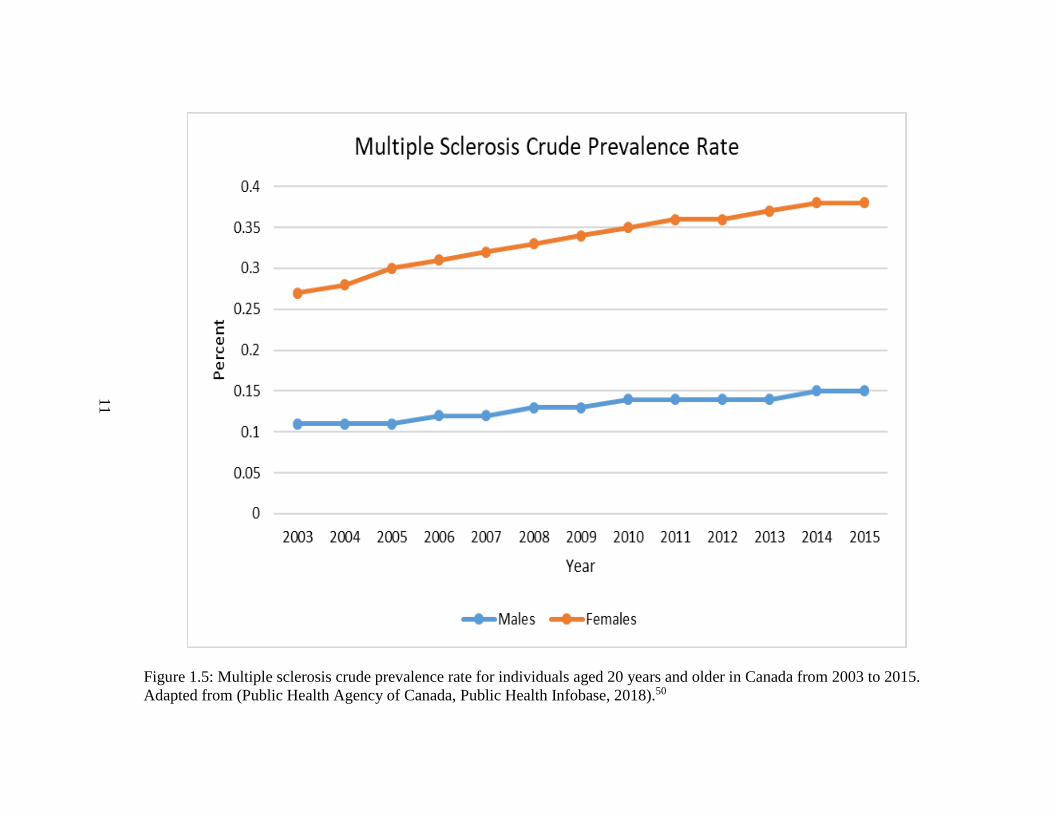
The crude prevalence rate was steady from 2003 to 2012 for males and females. The crude
prevalence was in the range of 2 to 3 per 1,000 for females and for males the prevalence was
around 1 per 1,000 (Figure 1.5).
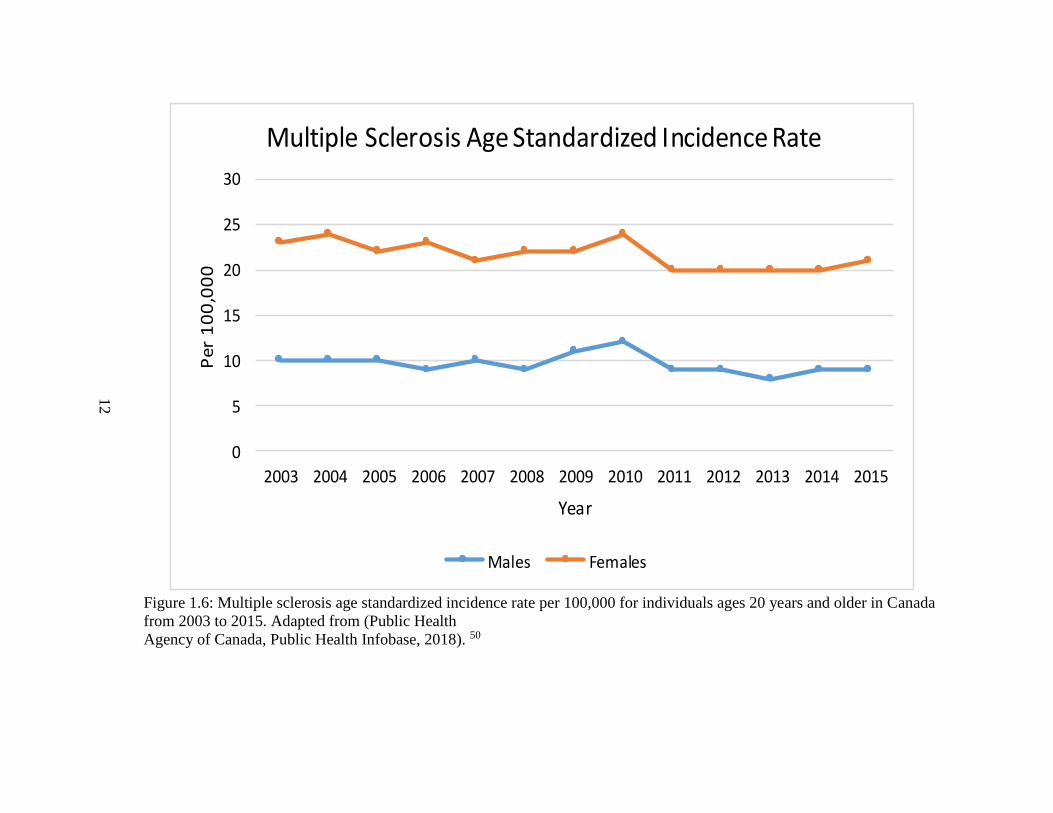
The age standardized incidence rates per 100,000 for individuals 20 years of age and older are
shown below in Figure 1.6. Throughout the years the age standardized incidence rates were
greater in females as opposed to males with a rate of approximately 20 to 30 per 100,000.50
These rates were steady from 2003 to 2012. However for males the rates were approximately 10
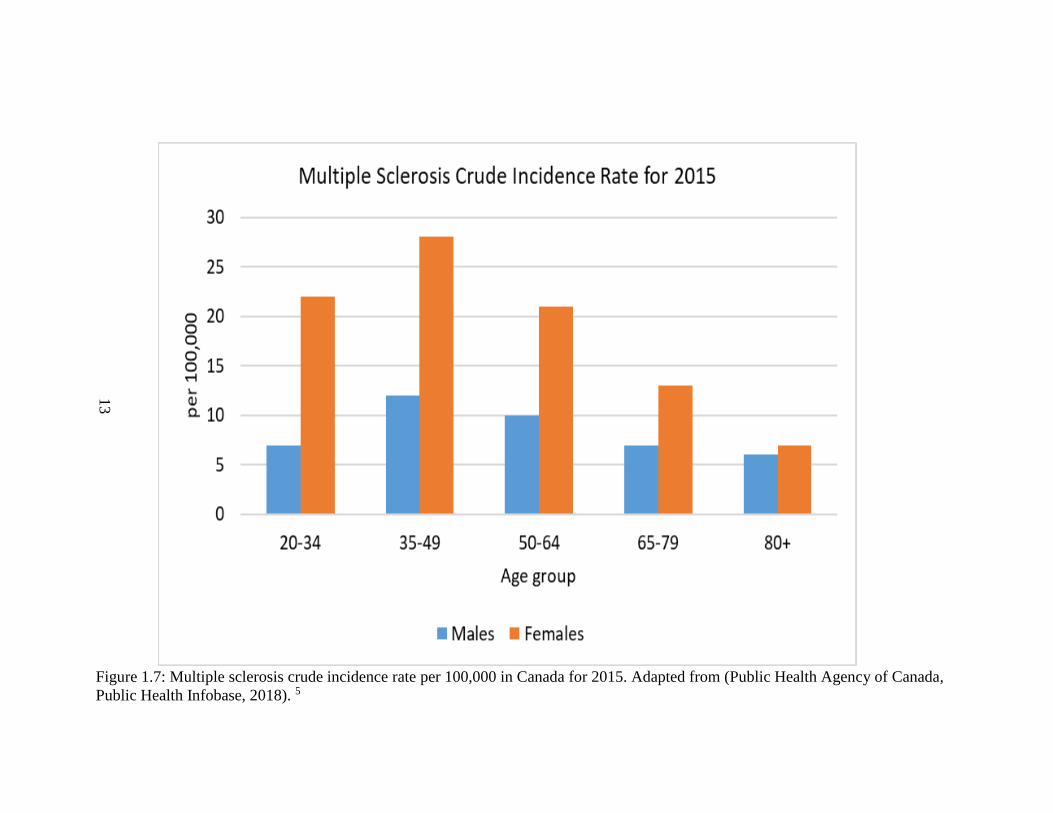
per 100,000 from 2003 to 2012.50 The crude incidence rates of MS varied between age groups
and sex; see figure 1.7. Individuals between the ages of 35 to 49 had the highest crude incidence

10
rate of MS per 100,000 people in 2015.50 A study done on timing of birth and risk of multiple
sclerosis found that in Canada fewer patients with MS were born in November compared with
controls.51 This was confirmed in a British dataset where there were more people with MS who
were born in May.51 One of the explanations for this association is that the seasons may affect
with the development of the central nervous system and immune system. Maternal level of
vitamin D could be correlated to increased births of MS in certain months of the years.51
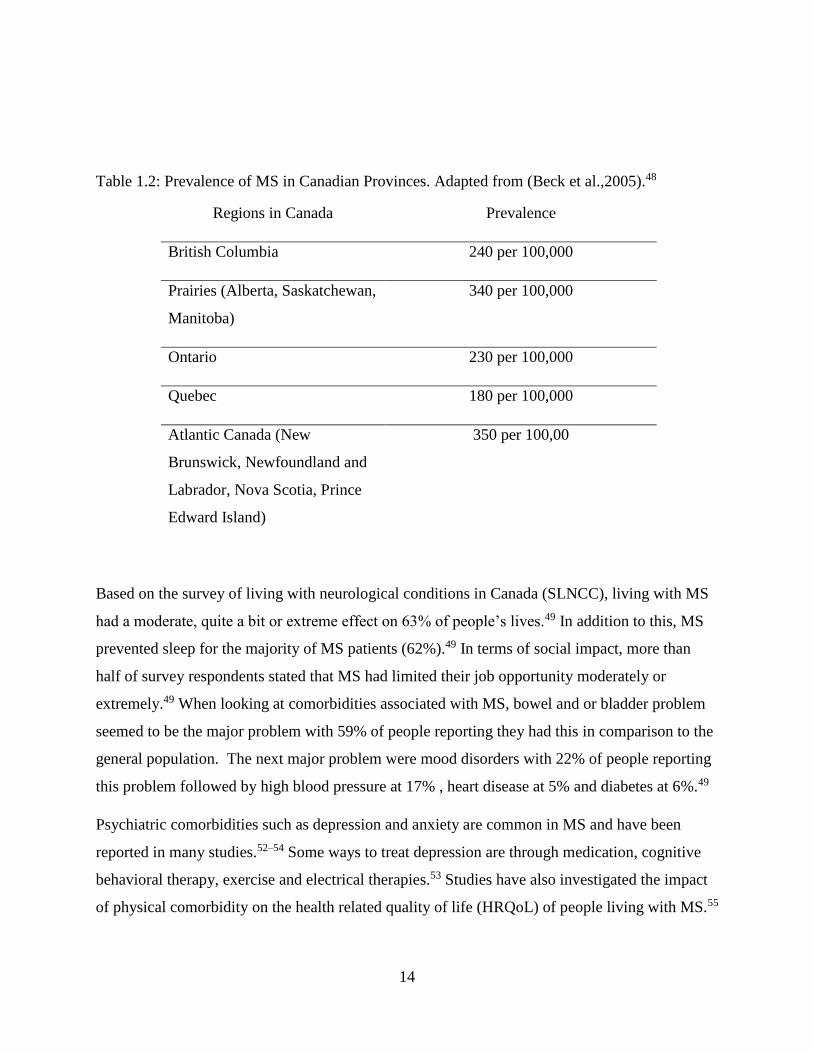
Regional variation of MS prevalence in Canada was also identified (Table 1.2).48 One study has
pointed out that the areas of the major cities in the prairies being located further north than in the
other regions could be a possible explanation for the increased prevalence.48
11
Figure 1.5: Multiple sclerosis crude prevalence rate for individuals aged 20 years and older in Canada from 2003 to 2015.
Adapted from (Public Health Agency of Canada, Public Health Infobase, 2018).50
12
Figure 1.6: Multiple sclerosis age standardized incidence rate per 100,000 for individuals ages 20 years and older in Canada
from 2003 to 2015. Adapted from (Public Health
Agency of Canada, Public Health Infobase, 2018). 50
0
5
10
15
20
25
30
2003 2004 2005 2006 2007 2008 2009 2010 2011 2012 2013 2014 2015
Per
10
0,0
00
Year
Multiple Sclerosis Age Standardized Incidence Rate
Males Females
13
Figure 1.7: Multiple sclerosis crude incidence rate per 100,000 in Canada for 2015. Adapted from (Public Health Agency of Canada,
Public Health Infobase, 2018). 5
14
Table 1.2: Prevalence of MS in Canadian Provinces. Adapted from (Beck et al.,2005).48
Regions in Canada Prevalence
British Columbia 240 per 100,000
Prairies (Alberta, Saskatchewan,
Manitoba)
340 per 100,000
Ontario 230 per 100,000
Quebec 180 per 100,000
Atlantic Canada (New
Brunswick, Newfoundland and
Labrador, Nova Scotia, Prince
Edward Island)
350 per 100,00
Based on the survey of living with neurological conditions in Canada (SLNCC), living with MS
had a moderate, quite a bit or extreme effect on 63% of people’s lives.49 In addition to this, MS
prevented sleep for the majority of MS patients (62%).49 In terms of social impact, more than
half of survey respondents stated that MS had limited their job opportunity moderately or
extremely.49 When looking at comorbidities associated with MS, bowel and or bladder problem
seemed to be the major problem with 59% of people reporting they had this in comparison to the
general population. The next major problem were mood disorders with 22% of people reporting
this problem followed by high blood pressure at 17% , heart disease at 5% and diabetes at 6%.49
Psychiatric comorbidities such as depression and anxiety are common in MS and have been
reported in many studies.52–54 Some ways to treat depression are through medication, cognitive
behavioral therapy, exercise and electrical therapies.53 Studies have also investigated the impact
of physical comorbidity on the health related quality of life (HRQoL) of people living with MS.55

15
It was found that increased disability, depression and anxiety symptoms, fatigue and physical
comorbidity were associated with decreased HRQol.55
In terms of treatment for MS, 82.5% stated they received treatment while 17.5% didn’t. The
majority of patients (83.7%) received medications such as injections, infusions and pills. 48.5%
of patients stated they used rehabilitation therapy, 27% used counselling or psychotherapy
services, 25.3% used complementary or alternative medications, 15.6% used urinary
catheterization and 10.3% used venous angioplasty/liberation therapy procedures.49
Managing MS involves many health care providers along with tests which are costly. In a cross
sectional analysis of 669 adults with MS who were enrolled in a province wide observational
study between 2011 and 2013 found that over the two years of follow-up, there were 150
hospitalizations which involved 99 patients and 11,213 outpatients visits which involved 637
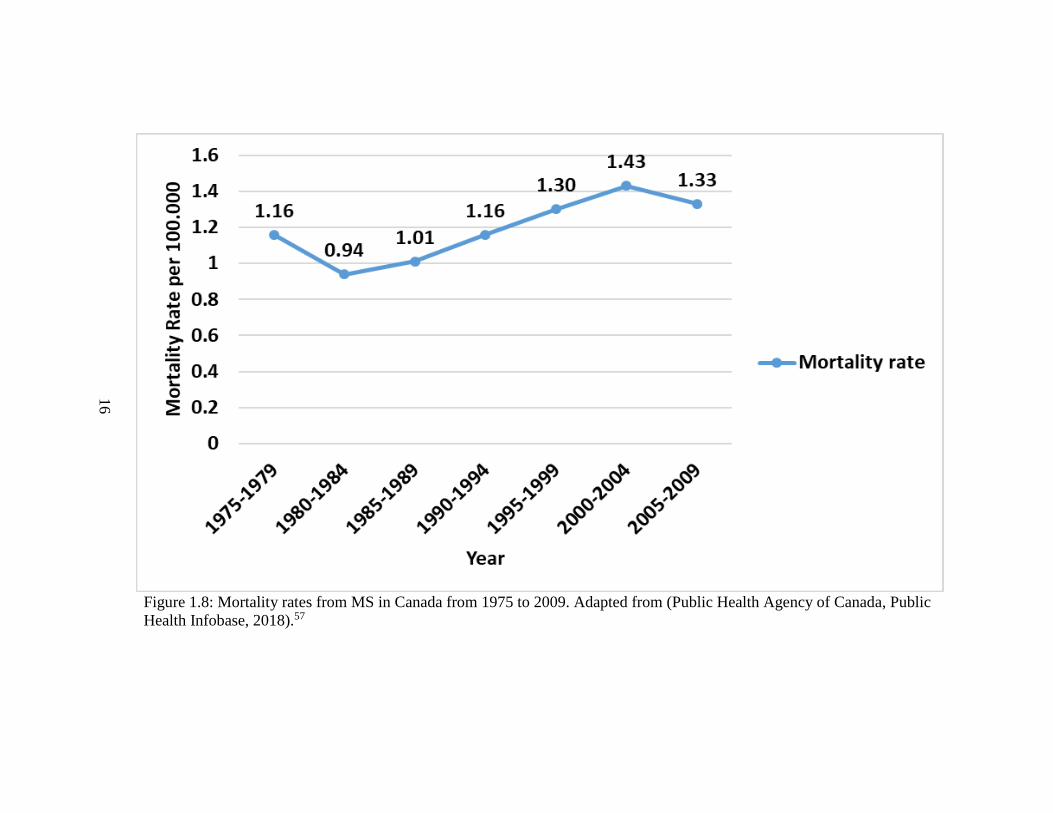
patients.56 In addition to this, individuals with MS are living a long period of time with the
illness which reduces the quality of life. Based on the study done on MS mortality rates in
Canada from 1975-2009, it was found that the highest mortality rates were after 2000 (Figure 1-
6).57 In 2013, the total number of deaths were 252,338 in Canada of which 521 deaths were due
to MS.49
A study on the relative mortality and survival in MS based on British Columbia MS registry
from 1980 to 2007 found that the median survival age was 78.6 years for women and 74.3 for
men.58 The survival was long for relapsing onset (R-MS) with an age of 49.7 years than for
primary progressive MS (PPMS) which had a survival age of 32.5 years.58 The reduced survival
time for people with PPMS could be due to the delays that occur for diagnosis.59 The MS
survival times were considered long for this study, however in comparison to the general
population the risk of death was still considered greater.58
16
Figure 1.8: Mortality rates from MS in Canada from 1975 to 2009. Adapted from (Public Health Agency of Canada, Public
Health Infobase, 2018).57
17
1.8 References
1. Goldenberg MM. Multiple sclerosis review. Pharm Ther. 2012;37(3):175-184.
2. Ebers GC, Wing W, Radcliff J, Ox O. Environmental factors and multiple sclerosis.
Lancet Neurol. 2008;7(3):268-277.
3. Alonso A, Hernán MA, Herna MA. Temporal trends in the incidence of multiple sclerosis.
Neurology. 2008;71(2):129-135. doi:10.1212/01.wnl.0000316802.35974.34
4. World Health Organization. Atlas: Multiple Sclerosis Resources in the World.; 2008.
doi:ISBN 978 92 4 156375 8
5. Yadav V, Shinto L, Bourdette D. Complementary and alternative medicine for the
treatment of multiple sclerosis. Expert Rev Clin Immunol. 2010;6(3):381-395.
https://www.cihi.ca/en/types-of-care/specialized-services/multiple-sclerosis. Accessed
April 16, 2016.
6. Rotstein DL, Chen H, Wilton AS, et al. Temporal trends in multiple sclerosis prevalence
and incidence in a large population. Neurology. 2018;90(16):e1435-e1441.
doi:10.1212/WNL.0000000000005331
7. Amankwah N, Marrie RA, Bancej C, et al. Multiple sclerosis in Canada 2011 to 2031:
results of a microsimulation modelling study of epidemiological and economic impacts.
Heal Promot chronic Dis Prev Canada Res policy Pract. 2017;37(2):37-48.
doi:10.24095/hpcdp.37.2.02
8. Marrie RA. Environmental risk factors in multiple sclerosis aetiology. Lancet Neurol.
2004;3(December):709-718.
9. Ascherio A, Munger KL. Environmental risk factors for multiple sclerosis . Part I : The
role of infection. Ann Neurol. 2007;61(4):288-299. doi:10.1002/ana.21117

18
10. Ascherio A, Munger KL. Environmental risk factors for multiple sclerosis . Part II :
Noninfectious factors. Ann Neurol Off J Am Neurol Assoc Child Neurol Soc.
2007;61(6):504-513. doi:10.1002/ana.21141
11. Scalfari A, Knappertz V, Cutter G, Goodin DS, Ashton R, Ebers GC. Mortality in patients
with multiple sclerosis. Neurology. 2013;81(2):184-192.
doi:10.1212/WNL.0b013e31829a3388
12. Rolak LA. Multiple sclerosis: it’s not the disease you thought it was. Clin Med Res.
2003;1(1):57-60.
13. Types. MS Society of Canada. https://mssociety.ca/about-ms/types. Published 2018.
Accessed September 22, 2018.
14. McDonald WI et al. Recommended diagnostic criteria for multiple sclerosis: guidelines
from the International Panel on the diagnosis of multiple sclerosis. Ann Neurol.
2001;50(1):121-127. http://www.ncbi.nlm.nih.gov/pubmed/11456302.
15. Sawcer S, Franklin RJ, Ban M. Multiple sclerosis genetics. Mult Scler. 2018;24(1):75-79.
doi:10.1177/1352458517737371
16. Willer CJ, Dyment DA, Risch NJ, Sadovnick AD, Ebers GC, Canadian Collaborative
Study Group TCCS. Twin concordance and sibling recurrence rates in multiple sclerosis.
Proc Natl Acad Sci U S A. 2003;100(22):12877-12882. doi:10.1073/pnas.1932604100
17. Sadovnick AD, Ebers GC, Dyment DA, Risch NJ. Evidence for genetic basis of multiple
sclerosis. Lancet. 1996;347(9017):1728-1730. doi:10.1016/S0140-6736(96)90807-7
18. Dyment DA, Ebers GC, Sadovnick AD. Review Genetics of multiple sclerosis. Lancet
Neurol. 2004;3(2):104-110.
19. Hollenbach JA, Oksenberg JR. The immunogenetics of multiple sclerosis: A
comprehensive review. J Autoimmun. 2015;64:13-25.
20. Schmidt H, Williamson D, Ashley-Koch A. HLA-DR15 haplotype and multiple sclerosis:
19
A HuGE review. Am J Epidemiol. 2007;165(10):1097-1109. doi:10.1093/aje/kwk118
21. Luomala M, Elovaara I, Ukkonen M, Koivula T. The combination of DR53 protects. J
Neurol. 2001;56(3):383-385.
22. Ramagopalan S V., Dobson R, Meier UC, Giovannoni G. Multiple sclerosis: risk factors,
prodromes, and potential causal pathways. Lancet Neurol. 2010;9(7):727-739.
doi:10.1016/S1474-4422(10)70094-6
23. Ramagopalan S V., Dobson R, Meier UC, Giovannoni G. Multiple sclerosis: risk factors,
prodromes, and potential causal pathways. Lancet Neurol. 2010;9(7):727-739.
doi:10.1016/S1474-4422(10)70094-6
24. Guan Y, Jakimovski D, Ramanathan M, Weinstock-guttman B, Zivadinov R. The role of
Epstein-Barr virus in multiple sclerosis : from molecular pathophysiology to in vivo
imaging. 2018. doi:10.4103/1673-5374.245462
25. Wingerchuk DM. Smoking: Effects on multiple sclerosis susceptibility and disease
progression. Ther Adv Neurol Disord. 2012;5(1):13-22. doi:10.1177/1756285611425694
26. Hernán MA, Jick SS, Logroscino G, Olek MJ, Ascherio A, Jick H. Cigarette smoking and
the progression of multiple sclerosis. Brain. 2005;128(6):1461-1465.
doi:10.1093/brain/awh471
27. Hedström AK, Hillert J, Olsson T, Alfredsson L. Smoking and multiple sclerosis
susceptibility. Eur J Epidemiol. 2013;28(11):867-874. doi:10.1007/s10654-013-9853-4
28. Sundström P, Nyström L, Hallmans G. Smoke exposure increases the risk for multiple
sclerosis. Eur J Neurol. 2008;15(6):579-583. doi:10.1111/j.1468-1331.2008.02122.x
29. Ascherio A, Munger KL, Simon KC. Vitamin D and multiple sclerosis. Lancet Neurol.
2010;9(6):599-612. doi:10.1016/S1474-4422(10)70086-7
30. van der Mei IA, Ponsonby AL, Dwyer T, et al. Past exposure to sun, skin phenotype, and
risk of multiple sclerosis: case-control study. Bmj. 2003;327(7410):316.

20
31. Breuer J, Loser K, Mykicki N, Wiendl H, Schwab N. Does the environment in fl uence
multiple sclerosis pathogenesis via UVB light and / or induction of vitamin D ? J
Neuroimmunol. 2019;329(May 2018):1-8. doi:10.1016/j.jneuroim.2018.05.006
32. Medications. MS Society of Canada. https://mssociety.ca/managing-
ms/treatments/medications. Published 2016. Accessed September 21, 2016.
33. Chronic cerebrospinal venous insufficiency (CCSVI). Multiple Sclerosis Society of
Canada. https://mssociety.ca/hot-topics/chronic-cerebrospinal-venous-insufficiency-ccsvi.
Published 2017. Accessed September 7, 2017.
34. Dore-duffy P, Trapp B, Khan O, Filippi M, Freedman MS. Chronic cerebrospinal venous
insufficiency and multiple sclerosis. Ann Neurol. 2010;67(3):286-290.
doi:10.1002/ana.22001
35. Zamboni P, Galeotti R, Weinstock-guttman B, Kennedy C, Salvi F, Zivadinov R. Venous
angioplasty in patients with multiple sclerosis: results of a pilot study. Eur J Vasc
Endovasc Surg. 2012;43(1):116-122. doi:10.1016/j.ejvs.2011.03.035
36. Zamboni P, Tesio L, Galimberti S, et al. Efficacy and Safety of Extracranial Vein
Angioplasty in Multiple Sclerosis. JAMA Neurol. 2017;75(1):35-43.
doi:10.1001/jamaneurol.2017.3825
37. Complementary and alternative medicines. National Multiple Sclerosis Society.
http://www.nationalmssociety.org/Treating-MS/Complementary-Alternative-Medicines.
Published 2018. Accessed February 12, 2017.
38. Garcia AMC, Veneroso CE, Soares DD, Lima AS, Correia MITD. Effect of a physical
exercise program on the functional capacity of liver transplant patients. Transplant Proc.
2014;46(6):1807-1808. doi:10.1016/j.transproceed.2014.05.023
39. Kerling A, Keweloh K, Tegtbur U, et al. Effects of a short physical exercise intervention
on patients with multiple sclerosis (MS). Int J Mol Sci. 2015;16(7):15761-15775.
doi:10.3390/ijms160715761
21
40. Olsen SA. A review of complementary and alternative medicine (CAM) by people with
multiple sclerosis. Occup Ther Int. 2009;16(1):57-70. doi:10.1002/oti
41. Pearson M, Dieberg G, Smart N. Exercise as a Therapy for Improvement of Walking
Ability in Adults With Multiple Sclerosis: A Meta-Analysis. Arch Phys Med Rehabil.
2015;96(7):1339-1348. doi:10.1016/j.apmr.2015.02.011
42. Senders A, Wahbeh H, Spain R, Shinto L. Mind-body medicine for multiple sclerosis: A
systematic review. Autoimmune Dis. 2012;1(1). doi:10.1155/2012/567324
43. Oken BS, Kishiyama S, Zajdel D, et al. Randomized controlled trial of yoga and exercise
in multiple sclerosis. Neurology. 2004;62(11):2058-2064.
doi:10.1212/01.WNL.0000129534.88602.5C
44. Salgado BC, Jones M, Ilgun S, McCord G, Loper-Powers M, van Houten P. Effects of a 4-
month Ananda Yoga program on physical and mental health outcomes for persons with
multiple sclerosis. Int J Yoga Therap. 2013;(23):27-38.
http://www.scopus.com/inward/record.url?eid=2-s2.0-
84902399739&partnerID=tZOtx3y1.
45. Negahban H, Rezaie S, Goharpey S. Massage therapy and exercise therapy in patients
with multiple sclerosis: a randomized controlled pilot study. Clin Rehabil.
2013;27(12):1126-1136. doi:10.1177/0269215513491586
46. Karampampa K, Gustavsson A, Miltenburger C, Kindundu CM, Selchen DH. Treatment
experience, burden, and unmet needs (Tribune) in multiple sclerosis study: The costs and
utilities of MS patients in Canada. J Popul Ther Clin Pharmacol. 2012;19(1):11-25.
doi:10.3111/13696998.2013.807267
47. Grima DT, Torrance GW, Francis G, Rice G, Rosner AJ, Lafortune L. Cost and health
related quality of life consequences of multiple sclerosis. Mult Scler. 2000;6(2):91-98.
48. Beck CA, Metz LM, Svenson LW, Patten SB. Regional variation of multiple sclerosis
prevalence in Canada. Mult Scler. 2005;11:516-519.
22
49. Gilmour H, Ramage-Morin PL, Wong SL. Multiple sclerosis: Prevalence and impact.
Heal Reports. 2018;29(1):3-8. doi:no.82-003-X
50. Public health infobase : Canadian chronic disease surveillance system (CCDSS), CCDP,
PHAC. Public Health Agency of Canada. https://infobase.phac-aspc.gc.ca/CCDSS-
SCSMC/data-
tool/?l=eng&DDLV=CDSMS&DDLM=ASIR&sexB=B&yrB=2012&=10&VIEW=2.
Published 2018. Accessed September 18, 2018.
51. Willer CJ. Timing of birth and risk of multiple sclerosis: population based study. Bmj.
2005;330(7483):120-0. doi:10.1136/bmj.38301.686030.63
52. Marrie RA, Reingold S, Cohen J, et al. The incidence and prevalence of psychiatric
disorders in multiple sclerosis: A systematic review. Mult Scler J. 2015;21(3):305-317.
doi:10.1177/1352458514564487
53. Feinstein A, Magalhaes S, Richard J-F, Audet B, Moore C. The link between multiple
sclerosis and depression. Nat Rev Neurol. 2014;10(9):507-517.
doi:10.1038/nrneurol.2014.139
54. Marrie R, Horwitz R, Cutter G, Tyry T, Campagnolo D, Vollmer T. The burden of mental
comorbidity in multiple sclerosis: frequent, underdiagnosed, and undertreated. Mult Scler.
2009;15(3):385-392. doi:10.1177/1352458508099477
55. Berrigan LI, Fisk JD, Patten SB, et al. Health-related quality of life in multiple sclerosis:
Direct and indirect effects of comorbidity. Neurology. 2016;86(15):1417-1424.
doi:10.1212/WNL.0000000000002564
56. Metz L, Greenfield J, Marrie R-A, et al. Healthcare Resource Utilization and Costs of
Multiple Sclerosis in Canada by Disability (P3.405). Neurology. 2017;88(16 Supplement).
http://n.neurology.org/content/88/16_Supplement/P3.405.abstract.
57. Warren SA, Janzen W, Warren KG, Svenson LW, Schopflocher DP. Multiple Sclerosis
Mortality Rates in Canada, 1975-2009. Can J Neurol Sci. 2015;43(1):134-141.
doi:10.1017/cjn.2015.236
23
58. Kingwell E, Van Der Kop M, Zhao Y, et al. Relative mortality and survival in multiple
sclerosis: Findings from British Columbia, Canada. J Neurol Neurosurg Psychiatry.
2012;83(1):61-66. doi:10.1136/jnnp-2011-300616
59. Kingwell E, Leung AL, Roger E, Duquette P, Rieckmann P, Tremlett H. Factors
associated with delay to medical recognition in two Canadian multiple sclerosis cohorts. J
Neurol Sci. 2010;292(1-2):57-62. doi:10.1016/j.jns.2010.02.007

24
CHAPTER 2: OBJECTIVES OF THIS RESEARCH
2.1 Rationale for this Research
The purpose of this research is to explore at a population level the gaps in MS research in terms of
prevention of risk factors such as second hand smoking and to explore factors associated with
medication use and exercise uptake. In addition, this research explores the psychosocial factors
associated with MS and how these factors contribute to the pain experienced by MS patients.
Although there has been extensive MS research exploring the risk factors of the disease, not much
of the research has examined the issues at a population level.
2.2 Context of this Research
This research examines areas of MS from risk factors, through symptoms to treatment options
and their impact on patients’ well-being. The four areas of research concern: 1) the general
population’s knowledge about a specific risk factor for MS (second hand smoking), 2) predictors
of pain in MS patients, 3) factors associated with medication adherence for MS, and 4) types of
complementary treatment for MS and their effect on the health and well-being of MS patients.
This research will help improve our knowledge of MS and its treatment. Hopefully the findings
will inform policies and programs that are created to provide better patient care.
Chapter 2 gives an overview of multiple sclerosis in Canada in terms of rates of MS throughout
the years, rates of MS based on provinces and common comorbidities associated with MS.
Chapter 3 investigates Canadian data on the predictors associated with people’s level of
agreement on whether second hand smoking is a risk factor for MS. The data on smoking was
obtained from the Health Canada: Smoking Survey (2004-2005). The analysis also examined
25
whether their perception of whether second hand smoke exposure could lead to MS development
varies depending on the province in which they live, smoking levels in those provinces and other
characteristics of their immediate social environment. A multilevel mixed effects logistic
regression model will be created and odds ratios will be calculated to assess whether individual
level and area level factors are associated with odds of people agreeing to second hand smoke
exposure leading to development of MS.
Chapter 4 explores aspects of pain, a very common symptom of MS. The main question
examined is, “does a lack of support from family or friends have an interaction effect on a lack
of sleep and mental health problems and further whether this is associated with reported pain
among individuals with MS?” The data examined is from the national Canadian Survey of
Living with Neurological Conditions. Multivariate logistic regression is used.
The next two chapters explore aspects of the treatments for MS. Chapter 5 examines the
predictors of medication use in people living with MS. Data from the national Survey of Living
with Neurological Conditions in Canada (SLNCC) is again used and a multivariate logistic
regression analysis was conducted.
Chapter 6 is a meta-analysis of a variety of complementary treatment modalities such as exercise
types, yoga and physical therapy on their impact on the physical, mental and social health of
people living with MS. The final chapter summarizes our findings and discusses potential
avenues for further research and the policies and programs to provide better treatment for MS
patients.
2.3 Study Design
This thesis uses two general types of study designs. Cross sectional survey designs are used in
chapters 3, 4 and 5 and a systematic review with meta-analysis is used in chapter 6. Cross
sectional studies are more advantageous over other study designs because it is relatively
inexpensive, many outcomes and risk factors can be assessed and it takes less time to carry out.1
The disadvantage is that measurement occurs only at one point in time therefore causality cannot
be inferred.
26
Meta-analysis combines the results of multiple studies which allows results to be generalized to a
larger population.2 However the disadvantages of this is that several small studies cannot
replicate the result of a single large study and a meta-analysis cannot correct for biases which
may have occurred in the original studies.2
2.4 Data Sources
The data examined in Chapters 3, 4, 5 are from large scale national Canadian surveys. In Chapter
3 the analysis is from the 2005 Health Canada-Smoking survey. The survey conducted by Health
Canada collected information about the Canadian general public which included smokers and
non-smokers in the provinces of Quebec, Ontario, Saskatchewan, Newfoundland and British
Columbia. The final sample consisted of 1,404 people in Quebec, 1,443 people in Ontario, 1,413
people in Saskatchewan, 1,442 people in Newfoundland and 1,468 people in British Columbia.3,4
The surveys measured knowledge attitudes and behaviours of the population of both smokers
and non-smokers in each of the provinces.
The Survey of Living with Neurological Conditions in Canada (2011) was used for the analysis
in chapters 4 & 5.5 This survey is a cross sectional survey that was linked to the Canadian
Community Health Survey (CCHS).6 The CCHS collects information which is related to the
health status, health care utilization and health determinants for the Canadian population. For 2
years (2010 and 2011), the CCHS collected information on a set of 18 neurological conditions
and participants who had one of these conditions were recruited to participate in the SLNCC.
The SLNCC sampled the population of household residents who were 15 years of age and older
in one of Canada’s 10 provinces. The final sample consisted of 8,200 people with neurological
conditions with a response rate of 81.6%.5
For the meta-analysis in Chapter 6, articles from 1990 to 2017 (27 years) were collected from a
database search from PubMed, Medline and Scopus using specific search strategies with detailed
inclusion and exclusion criteria applied to screen the articles that are to be selected for inclusion
in the systematic review and meta-analysis.

27
2.5 Statistical Analysis
This thesis uses a variety of statistical analyses depending on the nature of the question being
examined. Descriptive analysis is used to explore the demographic characteristics of the
population and samples surveyed. Multilevel mixed effects logistic regression analysis (Chapter
3) is used for binary outcomes as well as to explore the area level effect on the outcome.
Multivariate logistic regression (Chapter 4 and 5) will be used for binary outcomes in order to
determine odds ratios.
For chapters 4 and 5 where SLNCC data sets were used, replicated sampling weights and
bootstrapped variance estimation were used as recommended by Statistics Canada in order to
take into account the survey design 5 A set of (n=500) replicate weights were used in order to
account for non-responses. The bootstrapping sampling weights used in the analysis were created
for SLNCC by Statistics Canada. For the SLNCC linked data set, the bootstrap replicates are the
sub samples that were drawn and used to estimate the variance of the CCHS estimates.5 In order
to take into account the SLNCC sample design, each of the CCHS bootstrap replicates were
adjusted. 5
For the meta-analysis (Chapter 6) Cohen’s d which is the mean difference is computed for
physical health scores, mental health scores and social health scores.7 The standard mean
difference will be calculated based on the mean difference between the treatment and control
group divided by the pooled standard deviation.7
28
2.6 References
1. Levin KA. Study design III: Cross-sectional studies. Evid Based Dent. 2006;7(1):24-25.
doi:10.1038/sj.ebd.6400375
2. Ab H. Meta-analysis in medical research. Hippokratia. 2010;14(1):29-37.
3. EKOS. Smoking in Public Places: A Survey of Residents of Newfoundland and Labrador
and British Columbia.; 2005. http://www.queensu.ca/cora/_files/POR-04-95.pdf.
Accessed January 13, 2019.
4. Health Canada. Smoking In Public Places: Quebec, Ontario and Saskatchewan.; 2005.
http://www.environics.net. Accessed January 13, 2019.
5. Survey on living with neurological conditions in Canada (SLNCC)-2011. Statistics
Canada.
http://www23.statcan.gc.ca/imdb/p2SV.pl?Function=getSurvey&SDDS=5182&Item_Id=
845. Published 2011. Accessed January 13, 2017.
6. Canadian community health survey annual component (CCHS)-2010. Statistics Canada.
http://www23.statcan.gc.ca.cyber.usask.ca/imdb/p2SV.pl?Function=getSurvey&Id=81424
. Published 2010. Accessed January 27, 2019.
7. Cohen J. Statistical Power Analysis for the Behavioral Sciences. 2nd ed. NJ; 1988.
https://books.google.ca/books?id=cIJH0lR33bgC&printsec=frontcover&source=gbs_ge_s
ummary_r&cad=0#v=onepage&q&f=false. Accessed January 21, 2017.
29
CHAPTER 3: PREDICTORS OF PEOPLE’S PERCEPTIONS OF SECOND HAND
SMOKE EXPOSURE AS A RISK FACTOR FOR MULTIPLE SCLEROSIS
Abstract
Objective: There are many health problems associated with exposure to second hand smoke
exposure. Being exposed to second hand smoking earlier in childhood may cause development of
MS. The primary objective of this study was to examine the predictors associated with people’s
perception on second hand smoke exposure being a risk factor for MS.
Methods: The data set was drawn from the Health Canada: Smoking Survey conducted in 2004
and 2005 by Environics Research Group in partnership with Health Canada to survey the public
in the province of British Columbia (N=1,468), Newfoundland (N=1,442), Quebec (N=1,404),
Ontario (N=1,443) and Saskatchewan (N=1,413). A multilevel mixed effects logistic regression
model analysis was carried out in order to determine whether people’s perceptions of second
hand smoking as a risk factor for MS varied based on the province of residence.
Results: Age, sex, having a household member who smoked inside their home, if respondents
were bothered by second hand smoke exposure and smoking status were associated with
increased odds of people agreeing to second hand smoke exposure being a risk factor for MS
development. In addition to this the province of residence was associated with survey
respondents agreeing or disagreeing to whether second hand smoke exposure is associated with
MS development.
Conclusion: The study results could guide in the development of stop second hand smoking
campaigns on social media, TV and bus stop shelters. This could help raise awareness about the
risk of second hand smoking and its association on the risk of development of MS.

30
3.1 Introduction
Second hand smoke exposure is detrimental to health since it leads to ischaemic heart disease,
lower respiratory infections, asthma and lung cancer.1 There are many environmental factors that
are associated with multiple sclerosis (MS) development and exposure to cigarette smoke is one
of them.2 However people’s perceptions about second hand smoke exposure on MS development
is an understudied area.
Recent studies have reported the harmful effects of second hand smoke exposure on
development of MS among children as well as adults.3–5 Children who had parents who smoked
were a greater risk of having a first episode of MS RR=2.12 (95% CI 1.43 to 3.15).5 Hedstrom et
al. 2011 assessed the effect of passive smoking on the risk of MS and found that individuals
who have never smoked were at a 1.3 times greater odds 95% CI (1.1-1.6) of developing MS if
they were exposed to passive smoking.3 Passive smoking as a risk factor for MS is a fairly new
topic that hasn’t received much attention. Therefore not many people are aware of the impact
that second smoke exposure has on MS. Many smoking campaigns inform people about smoking
and risk of lung cancer and cardiovascular disease but fail to talk about its impact on MS
development.
In a meta-analysis study conducted by Zhang et al.2016 on risk of smoking on MS, they found
that along with smoking being a risk factor for MS development, passive smoke exposure also
increased the risk of developing MS as opposed to individuals who were unexposed.6 Some
studies have stated that that a person’s genetic background also plays a role in whether passive
smoke exposure will result in MS development later on in life. Individuals who have a special
class II allele HLA-DRB1*15 were 3 times more likely to develop MS as opposed to individuals
who don’t have the allele.7–9
31
Hedström et al. (2014) explored the interaction of passive smoking and HLA genotype and found
that compared to non-smokers who did not have the two genetic risk factors (HLA-DRB1*15
and HLA-A*02) individuals who had the two risk factors and who were not exposed to passive
smoking were OR=4.5 (95% CI 3.3 to 6.1) times more likely to develop MS.10 However
individuals who had the two genetic risk factors and who were exposed to passive smoking were
OR=7.7 (95% CI 5.5 to 10.8) times more likely to develop MS.10 Thus indicating that
development of MS is associated with genetic factors and could be influenced by exposure to
passive smoking.10 Apparent in these studies is that both environment and genetics plays a role in
MS development.
MS is a rare condition, not many people will be aware of the condition or the risk factors
associated with MS such as passive smoking. If people are not aware of the risk factor then
prevention is difficult. Several studies have been conducted on demographic factors of people’s
perception of second hand smoke exposure in relation to lung cancer or chronic obstructive
pulmonary disease. However studies on exploring people’s perception of second hand smoke
exposure on MS is rare. It is important to evaluate population knowledge on MS so as to gain a
better understanding on ways to educate people. The objective of this research is to determine the
demographic, socioeconomic and personal predictors associated with people’s perception on
whether they think that second hand smoking is a risk factor for MS. As a secondary objective,
whether this perception varies based on the province of residence will also be examined in order
to find out if there is a macro level effect. The model for this objective is shown in Figure 3.1.

32
Figure 3. 1: Model for predictors associated with people’s perceptions of whether second hand
smoke exposure is associated with MS.
33
3.2 Methods
3.2.1 Data Source
The data set was drawn from the Health Canada: Smoking Survey conducted in 2004 and 2005
by Environics Research Group in partnership with Health Canada to survey the public in the
province of British Columbia (N=1,468), Newfoundland (N=1,442), Quebec (N=1,404), Ontario
(N=1,443) and Saskatchewan (N=1,413) on smoking.11,12 This data file is a public use file.
Random digit dial sampling process was used to select people in each province. The survey was
conducted to measures the knowledge, attitudes and behaviors of the population towards
smoking and second hand smoking in public places. Only individuals who were 18 years of age
and older were included in the analysis.
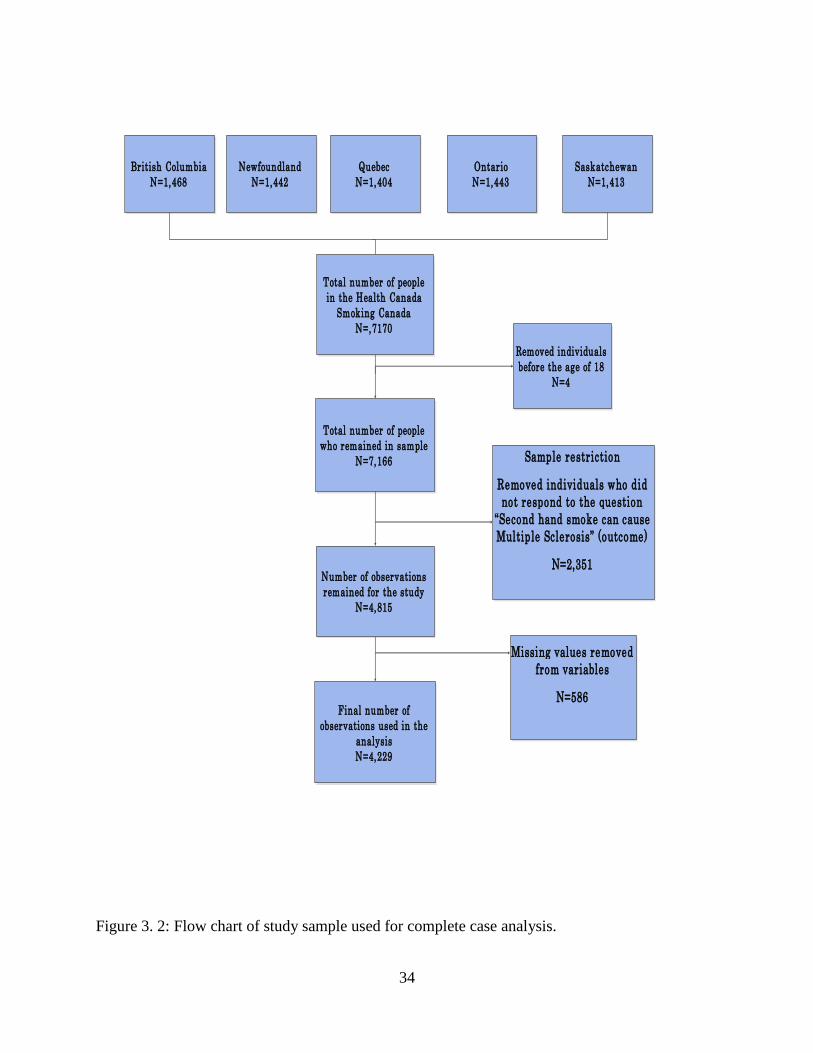
3.2.2 Study Sample
There was a total of 7,170 respondents in the initial Health Canada Smoking survey. The study
sample was restricted to individuals 18 years of age and older since this is the legal age of
smoking. After age restriction was applied, there were 7,166 people respondents who remained.
The sample was restricted to individuals who answered the question to whether second hand
smoke can cause MS (N=4,815). After missing values were removed, 4,229 observations
remained for the analysis. Figure 3.2 shows the flowchart of study sample.
34
Figure 3. 2: Flow chart of study sample used for complete case analysis.
British Columbia
N=1,468
Newfoundland
N=1,442
Quebec
N=1,404
Ontario
N=1,443
Saskatchewan
N=1,413
Total number of people
in the Health Canada
Smoking Canada
N=,7170
Total number of people
who remained in sample
N=7,166
Number of observations
remained for the study
N=4,815
Final number of
observations used in the
analysis
N=4,229
Removed individuals
before the age of 18
N=4
Sample restriction
Removed individuals who did
not respond to the question
“Second hand smoke can cause
Multiple Sclerosis” (outcome)
N=2,351
Missing values removed
from variables
N=586

35
3.2.3 Variables assessed
Survey respondents were asked whether they agree that second hand smoking was a risk factor
for MS. Individuals were asked to rate their agreement and had 4 categories to choose from
(strongly agree, somewhat agree, somewhat disagree or strongly disagree). In this analysis
individuals who replied strongly agree or somewhat agree were classified as “1=Yes” and those
who replied as somewhat disagree or strongly disagree were categorized “0=No”. This was the
dependent variable of interest.
The factors that were included in the analysis were sex, age, marital status, education, number of
people living in the household, whether other members of the household smoked in the house, if
they were bothered by second hand smoke, if they had children under the age of 18, the
frequency of breathing in second hand smoke and smoking restrictions in either workplace,
restaurant or shopping malls. The predictors used for the analysis are shown in Table 3.1.
3.3 Analysis
A two level multilevel mixed effects logistic regression model analysis was carried out in order
to determine whether people’s perceptions of second hand smoking as a risk factor for MS varied
based on the province of residence. Two approaches were used to build the final models and then
compared to see which procedure gave better results. A complete case analysis was conducted in
which only variables with complete values were used in the model and missing values were
removed. Unadjusted and adjusted odds ratios with 95% CIs with p-values were computed.
Univariate analysis was conducted using a (p <0.20). Manual backward selection was used to
build the multivariable model based on (p<0.05). Confounders were tested in the final model and
were retained if the addition of that variable changed the coefficients of the other variables by
more than 20%. Interactions were assessed and added to the model if they were significant at
(p<0.05). Akaike’s information criterion (AIC) was used to compare fit of models. The
effectiveness of the final model was assessed using receiver-operating characteristics (ROC) and
plots of standardized residuals. The analysis was performed using STATA IC 15.13

36
As a secondary analysis, imputation was carried out in order to take into account bias, loss of
power and precision that could be associated with missing values. The pattern of missingness
was assessed. Based on the pattern of missingness for each variable, multiple imputation by
chained equation was chosen. The method by Rubin et al. 1987 was used for the imputation
procedure.14 Univariate analysis was conducted using a (p <0.20). Manual backward selection
was used to build the multivariable model based on (p<0.05). Confounders and interaction terms
were tested in the models and results were reported as ORs with 95% confidence intervals.
Akaike’s information criterion (AIC) was used to compare fit of models. The effectiveness of the
final model was assessed using receiver-operating characteristics (ROC). Both models based on
complete case analysis and imputation were compared to find the best model for the data.
3.4 Results
3.4.1 Results based on complete case analysis
The final sample consisted of 4,229 observations. Based on the descriptive statistics, there were
1,639 individuals who agreed that second hand smoking causes multiple sclerosis (MS) and
2,590 individuals who disagreed to second hand smoking causing MS. Figure 3-3 shows the
number of respondents based on province of residence. Ontario and Saskatchewan had higher
levels of responses. In terms of smoking status 60% were smokers and 40% were nonsmokers.
When comparing across provinces, Newfoundland had the highest rate of people agreeing (49%)
to second hand smoke exposure causing MS, while Quebec had the lowest percentage of people
agreeing (33%) (Figure 3-4). Univariate analysis indicated that all predictors were significant
with the dependent variable which are shown in Table 3-1. Based on the multivariate analysis
sex, age, education, if members of household smoked inside home, if respondent was bothered
by second hand smoke, their smoking status and the interaction between sex and smoking status
was significant.

37
Figure 3. 3: Number of respondents by province.
Figure 3.4:The percentage of respondents who agreed or disagreed to second hand smoke
exposure being a risk factor for MS development out of 4,229 observations.
Newfoundland
BritishColumbia
Quebec OntarioSaskatchewa
n
disagree % 51 66 67 60 62
agree % 49 34 33 40 38
51
66 67
60 62
49
34 33
40 38
0
10
20
30
40
50
60
70
80
Per
cen
tage
of
Peo
ple
Percentage of respondents who agreed or disagreed to whether second hand smoke exposure is risk factor for MS development
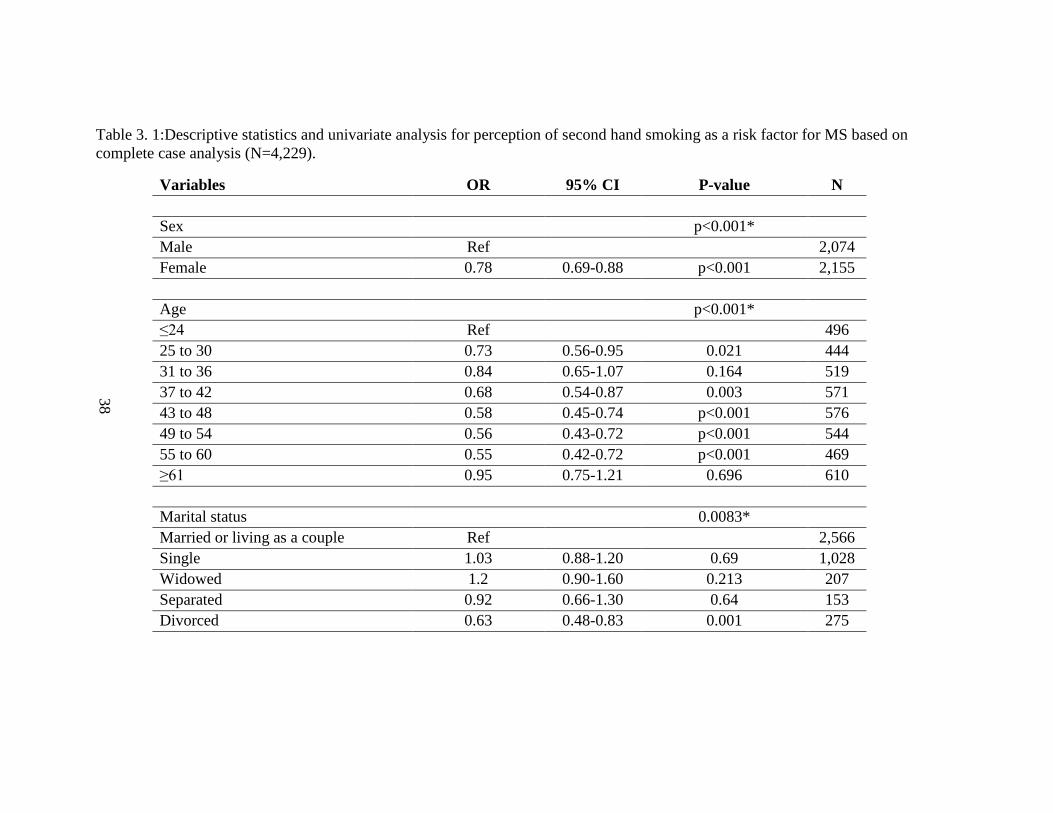
38
Table 3. 1:Descriptive statistics and univariate analysis for perception of second hand smoking as a risk factor for MS based on
complete case analysis (N=4,229).
Variables OR 95% CI P-value N
Sex
p<0.001*
Male Ref
2,074
Female 0.78 0.69-0.88 p<0.001 2,155
Age
p<0.001*
≤24 Ref
496
25 to 30 0.73 0.56-0.95 0.021 444
31 to 36 0.84 0.65-1.07 0.164 519
37 to 42 0.68 0.54-0.87 0.003 571
43 to 48 0.58 0.45-0.74 p<0.001 576
49 to 54 0.56 0.43-0.72 p<0.001 544
55 to 60 0.55 0.42-0.72 p<0.001 469
≥61 0.95 0.75-1.21 0.696 610
Marital status
0.0083*
Married or living as a couple Ref
2,566
Single 1.03 0.88-1.20 0.69 1,028
Widowed 1.2 0.90-1.60 0.213 207
Separated 0.92 0.66-1.30 0.64 153
Divorced 0.63 0.48-0.83 0.001 275

39
Variables OR 95% CI P-value N
Education
p<0.001*
Less than high school degree Ref
727
High school degree 0.63 0.51-0.77 p<0.001 915
More than high school but less than
university
0.54 0.45-0.64 p<0.001 1,716
University degree or greater 0.45 0.37-0.56 p<0.001 871
Number of people living in household 0.0002*
Less than 2 people Ref
2,199
Greater than 3 people 1.27 1.12-1.43 p<0.001 2,030
Do other members of your household smoke inside your home? p<0.001*
Yes 0.67 0.58-0.78 p<0.001 1,076
No Ref
3,153
Bothered by second hand smoke
p<0.001*
Very much Ref
1,263
Somewhat 0.56 0.47-0.66 p<0.001 1,151
Not very much/not at all 0.31 0.27-0.36 p<0.001 1,815
Smoking status
p<0.001*
Smoker Ref
2,551
Non-smoker 1.95 1.72-2.21 p<0.001 1,678
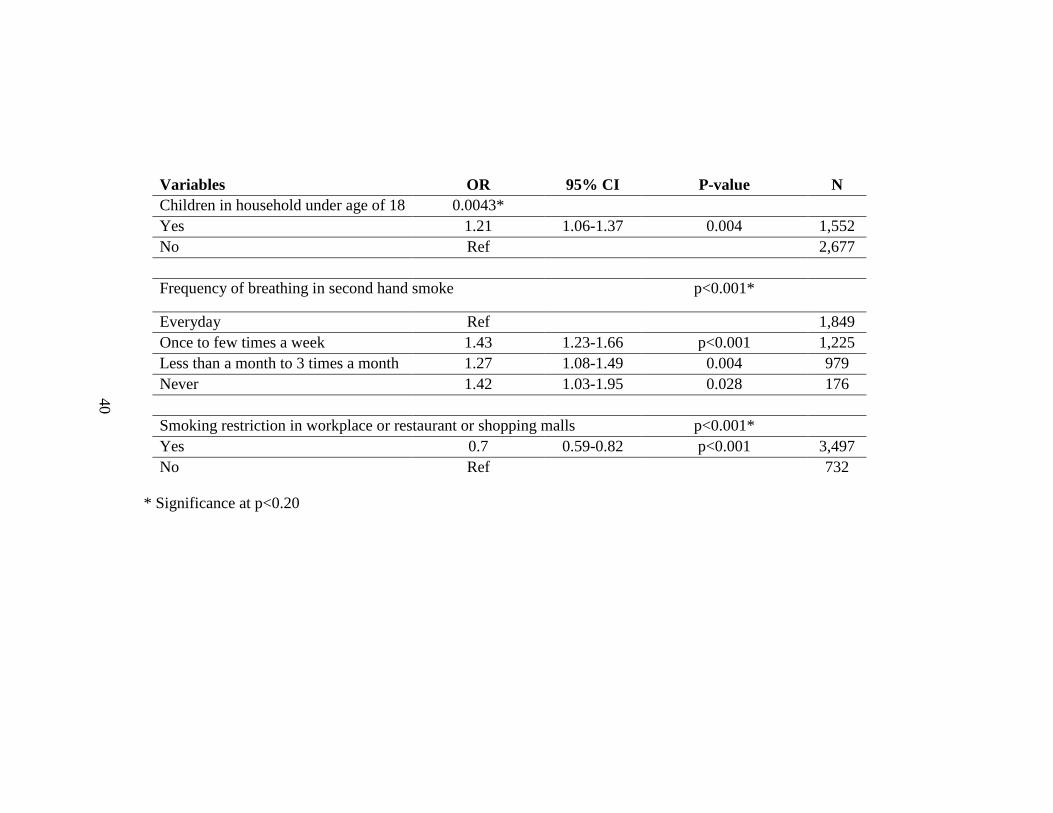
40
Variables OR 95% CI P-value N
Children in household under age of 18 0.0043*
Yes 1.21 1.06-1.37 0.004 1,552
No Ref 2,677
Frequency of breathing in second hand smoke p<0.001*
Everyday Ref
1,849
Once to few times a week 1.43 1.23-1.66 p<0.001 1,225
Less than a month to 3 times a month 1.27 1.08-1.49 0.004 979
Never 1.42 1.03-1.95 0.028 176
Smoking restriction in workplace or restaurant or shopping malls p<0.001*
Yes 0.7 0.59-0.82 p<0.001 3,497
No Ref
732
* Significance at p<0.20
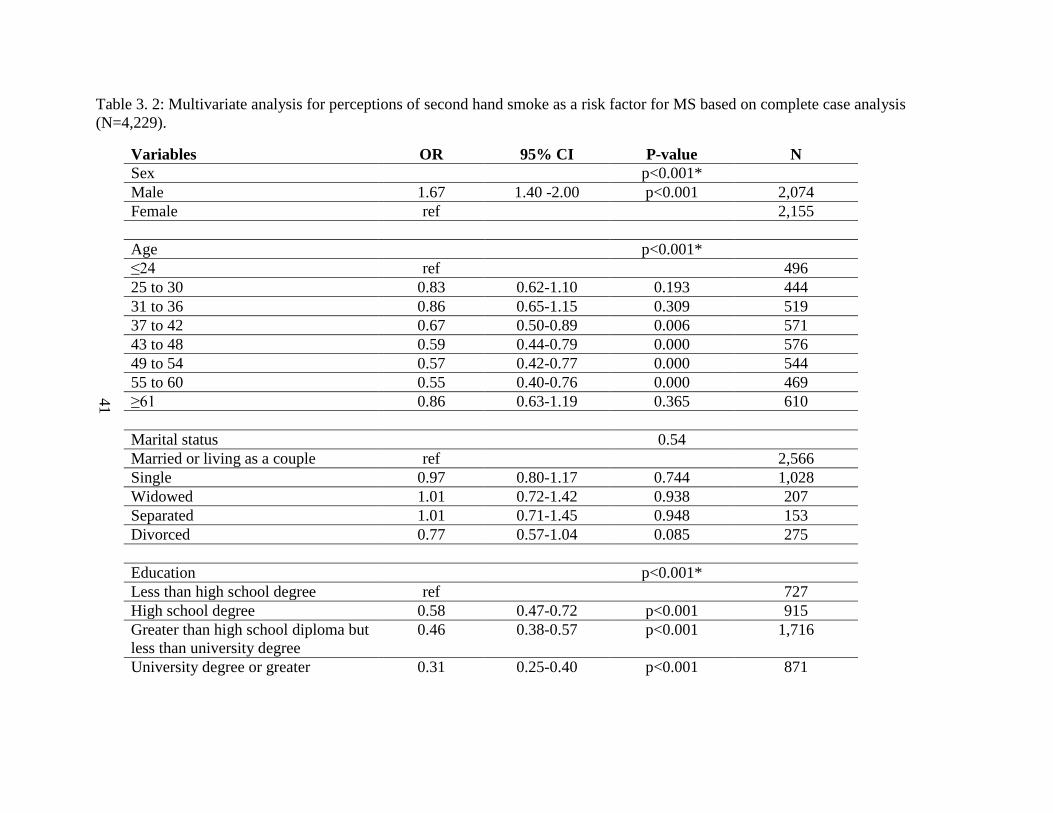
41
Table 3. 2: Multivariate analysis for perceptions of second hand smoke as a risk factor for MS based on complete case analysis
(N=4,229).
Variables OR 95% CI P-value N
Sex
p<0.001*
Male 1.67 1.40 -2.00 p<0.001 2,074
Female ref
2,155
Age
p<0.001*
≤24 ref
496
25 to 30 0.83 0.62-1.10 0.193 444
31 to 36 0.86 0.65-1.15 0.309 519
37 to 42 0.67 0.50-0.89 0.006 571
43 to 48 0.59 0.44-0.79 0.000 576
49 to 54 0.57 0.42-0.77 0.000 544
55 to 60 0.55 0.40-0.76 0.000 469
≥61 0.86 0.63-1.19 0.365 610
Marital status
0.54
Married or living as a couple ref
2,566
Single 0.97 0.80-1.17 0.744 1,028
Widowed 1.01 0.72-1.42 0.938 207
Separated 1.01 0.71-1.45 0.948 153
Divorced 0.77 0.57-1.04 0.085 275
Education
p<0.001*
Less than high school degree ref
727
High school degree 0.58 0.47-0.72 p<0.001 915
Greater than high school diploma but
less than university degree
0.46 0.38-0.57 p<0.001 1,716
University degree or greater 0.31 0.25-0.40 p<0.001 871

42
Variables OR 95% CI P-value N
Number of people living in
household including themselves
0.10
Less than 2 people ref
2,199
Greater than 3 people 1.17 0.97-1.41 0.097
Do other members of your household
smoke inside your home?
0.03*
Yes ref
1,076
No 1.22 1.02-1.45 0.029 3,153
Bothered by second hand smoke p<0.001
Very much 3.27 2.69-3.97 p<0.001 1,263
Somewhat 1.80 1.52-2.14 p<0.001 1,151
Not very much/not at all ref
1,815
Smoking status
p<0.001*
Smoker ref
2,551
Non smoker 1.50 1.20-1.87 0.000 1,678
Children in household under age of
18
0.45
Yes 1.08 0.88-1.32 0.450 1,552
No
2,677
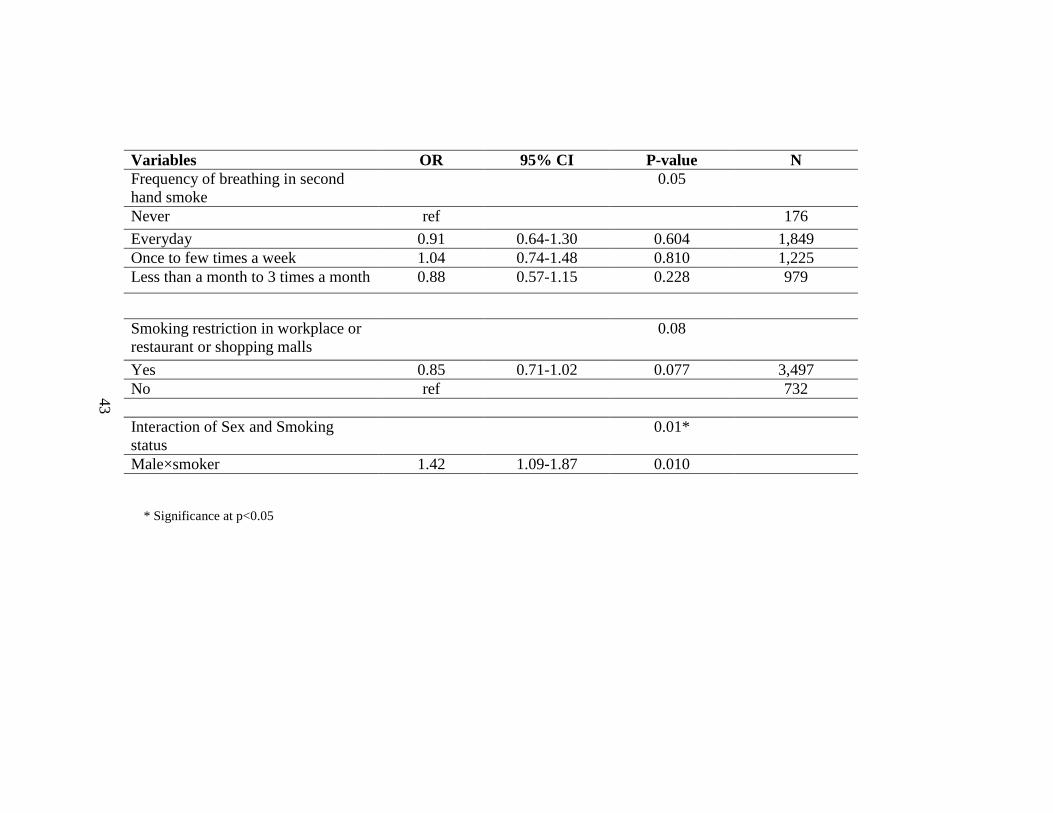
43
Variables OR 95% CI P-value N
Frequency of breathing in second
hand smoke
0.05
Never ref 176
Everyday 0.91 0.64-1.30 0.604 1,849
Once to few times a week 1.04 0.74-1.48 0.810 1,225
Less than a month to 3 times a month 0.88 0.57-1.15 0.228 979
Smoking restriction in workplace or
restaurant or shopping malls
0.08
Yes 0.85 0.71-1.02 0.077 3,497
No ref
732
Interaction of Sex and Smoking
status
0.01*
Male×smoker 1.42 1.09-1.87 0.010
* Significance at p<0.05
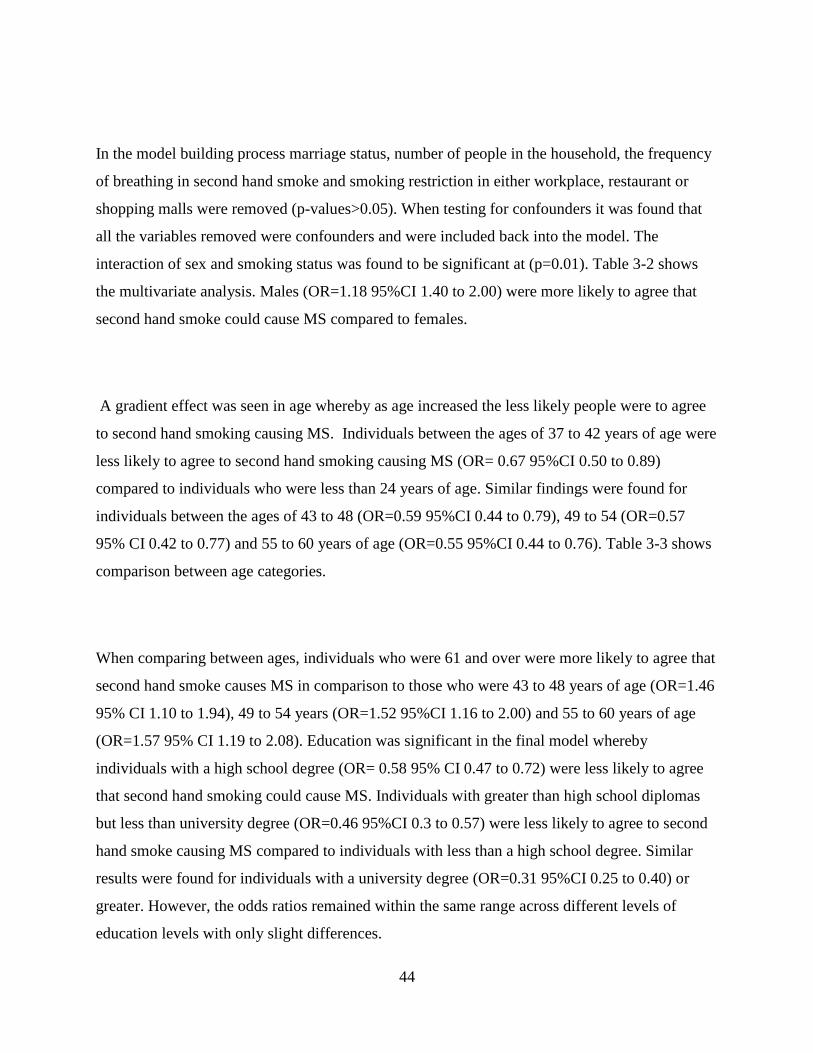
44
In the model building process marriage status, number of people in the household, the frequency
of breathing in second hand smoke and smoking restriction in either workplace, restaurant or
shopping malls were removed (p-values>0.05). When testing for confounders it was found that
all the variables removed were confounders and were included back into the model. The
interaction of sex and smoking status was found to be significant at (p=0.01). Table 3-2 shows
the multivariate analysis. Males (OR=1.18 95%CI 1.40 to 2.00) were more likely to agree that
second hand smoke could cause MS compared to females.
A gradient effect was seen in age whereby as age increased the less likely people were to agree
to second hand smoking causing MS. Individuals between the ages of 37 to 42 years of age were
less likely to agree to second hand smoking causing MS (OR= 0.67 95%CI 0.50 to 0.89)
compared to individuals who were less than 24 years of age. Similar findings were found for
individuals between the ages of 43 to 48 (OR=0.59 95%CI 0.44 to 0.79), 49 to 54 (OR=0.57
95% CI 0.42 to 0.77) and 55 to 60 years of age (OR=0.55 95%CI 0.44 to 0.76). Table 3-3 shows
comparison between age categories.
When comparing between ages, individuals who were 61 and over were more likely to agree that
second hand smoke causes MS in comparison to those who were 43 to 48 years of age (OR=1.46
95% CI 1.10 to 1.94), 49 to 54 years (OR=1.52 95%CI 1.16 to 2.00) and 55 to 60 years of age
(OR=1.57 95% CI 1.19 to 2.08). Education was significant in the final model whereby
individuals with a high school degree (OR= 0.58 95% CI 0.47 to 0.72) were less likely to agree
that second hand smoking could cause MS. Individuals with greater than high school diplomas
but less than university degree (OR=0.46 95%CI 0.3 to 0.57) were less likely to agree to second
hand smoke causing MS compared to individuals with less than a high school degree. Similar
results were found for individuals with a university degree (OR=0.31 95%CI 0.25 to 0.40) or
greater. However, the odds ratios remained within the same range across different levels of
education levels with only slight differences.

45
Having household members who smoke inside their home was also associated with whether or
not people think that second hand smoke could cause MS. Individuals who had no household
members who smoked in their home were more (OR=1.22 95%CI 1.02 to 1.45) likely to agree
that second hand smoke could cause MS. The level that people felt bothered by second hand
smoking was also associated with whether or not they felt that second hand smoking could cause
MS.
Individuals who were very much bothered by second hand smoke were more (OR=3.27 95% CI
2.69 to 3.97) likely to agree that second hand smoke could cause MS compared to those who
were not very much bothered or who were bothered not at all. Similar results were found for
individuals who were somewhat bothered by second hand smoke (OR= 1.80 95%CI 1.52 to
2.14). Smoking status was also found to be significant in the model. Non-smokers were more
(OR=1.50 95%CI 1.20 to 1.87) likely to agree that second hand smoke leads to MS compared to
smokers.
The interaction of sex and smoking status was significant in the final model. Male smokers were
more (OR=1.42 95%CI 1.09 to 1.87) likely to agree that second hand smoke causes MS. When
comparing interaction terms, it was found that female non-smokers were more (OR=1.50 95%CI
1.20 to 1.87) likely to agree that that second hand smoke causes MS compared to female
smokers. Significance was also found when comparing female smokers to male smokers
(OR=0.60 95% CI 0.50 to 0.71) as well as between female smokers and male non-smokers but to
a lesser extent (OR= 0.57 95% CI 0.45 to 0.71).
The interactions in the model are depicted in Figure 3-5. Non-smoking females had a higher
probability of agreeing to second hand smoke exposure leading to MS development compared to
female non-smokers. Male smokers had a higher probability of agreeing that second hand smoke
exposure leads to MS development compared to female smokers. Figure 3-6 shows that as age
increased the probability of agreement to second hand smoke exposure decreased. Figure 3-7
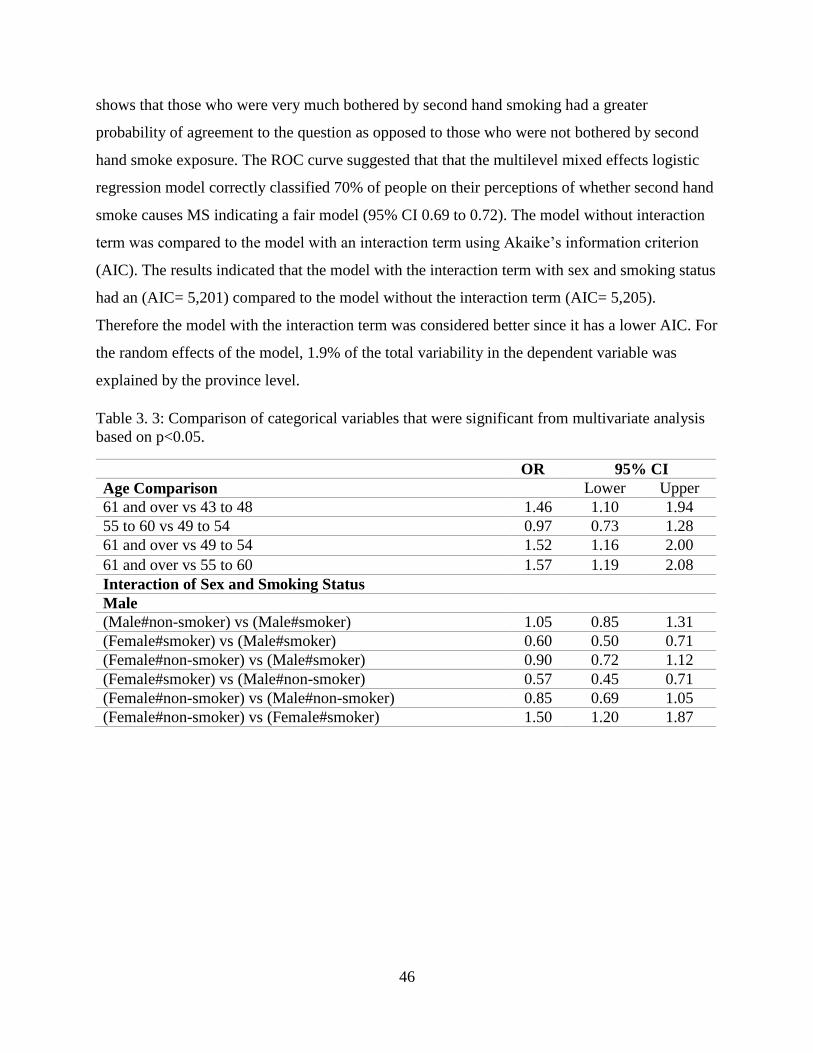
46
shows that those who were very much bothered by second hand smoking had a greater
probability of agreement to the question as opposed to those who were not bothered by second
hand smoke exposure. The ROC curve suggested that that the multilevel mixed effects logistic
regression model correctly classified 70% of people on their perceptions of whether second hand
smoke causes MS indicating a fair model (95% CI 0.69 to 0.72). The model without interaction
term was compared to the model with an interaction term using Akaike’s information criterion
(AIC). The results indicated that the model with the interaction term with sex and smoking status
had an (AIC= 5,201) compared to the model without the interaction term (AIC= 5,205).
Therefore the model with the interaction term was considered better since it has a lower AIC. For
the random effects of the model, 1.9% of the total variability in the dependent variable was
explained by the province level.
Table 3. 3: Comparison of categorical variables that were significant from multivariate analysis
based on p<0.05.
OR 95% CI
Age Comparison Lower Upper
61 and over vs 43 to 48 1.46 1.10 1.94
55 to 60 vs 49 to 54 0.97 0.73 1.28
61 and over vs 49 to 54 1.52 1.16 2.00
61 and over vs 55 to 60 1.57 1.19 2.08
Interaction of Sex and Smoking Status
Male
(Male#non-smoker) vs (Male#smoker) 1.05 0.85 1.31
(Female#smoker) vs (Male#smoker) 0.60 0.50 0.71
(Female#non-smoker) vs (Male#smoker) 0.90 0.72 1.12
(Female#smoker) vs (Male#non-smoker) 0.57 0.45 0.71
(Female#non-smoker) vs (Male#non-smoker) 0.85 0.69 1.05
(Female#non-smoker) vs (Female#smoker) 1.50 1.20 1.87
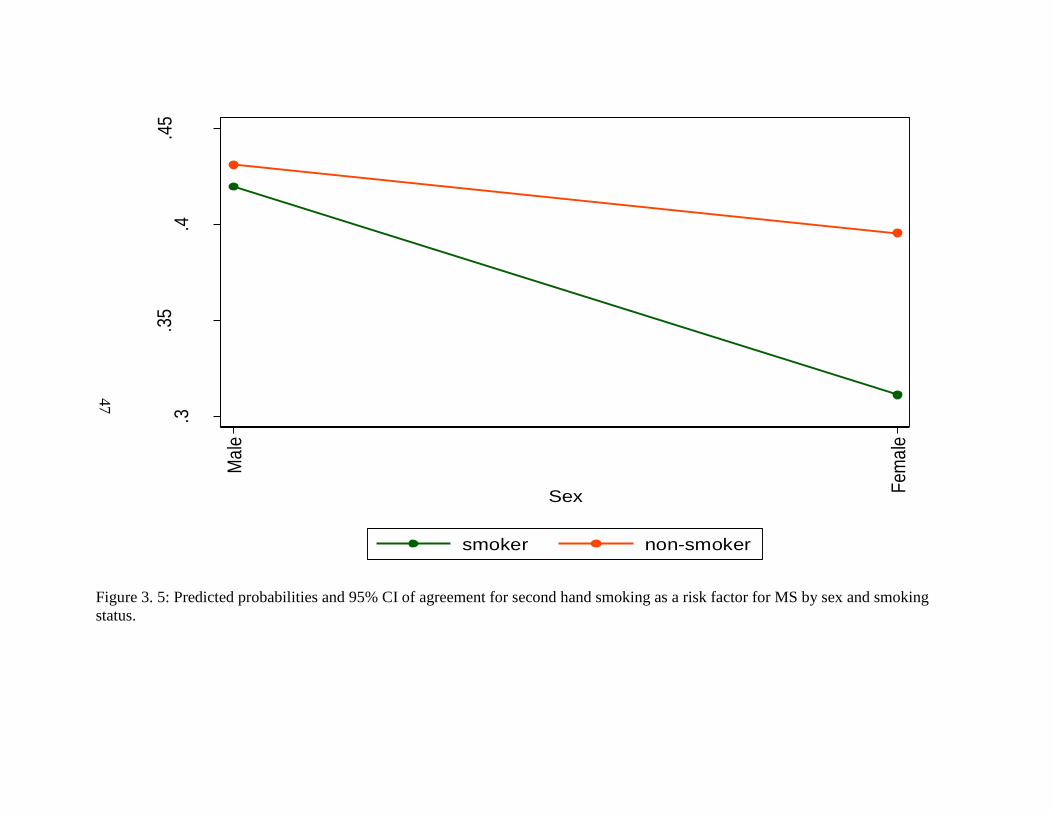
47
Figure 3. 5: Predicted probabilities and 95% CI of agreement for second hand smoking as a risk factor for MS by sex and smoking
status.
.3.3
5.4
.45
95%
CI P
rob
abili
ty o
f agr
eem
ent t
o se
con
d h
and
smo
king
as
a ri
sk fa
ctor
for
MS
Ma
le
Fem
ale
Sex
smoker non-smoker

48
Figure 3. 6: Predicted probabilities and 95% CI of agreement for second hand smoking as a risk factor for MS by age.
.25
.3.3
5.4
.45
.5.5
5
95%
CI P
rob
ab
ility
of a
gre
em
en
t to
seco
nd h
an
d s
mo
king
as
a r
isk
fact
or
for
MS
<=24
25 to 30
31 to 36
37 to 42
43 to 48
49 to 54
55 to 60
61 and over
Age
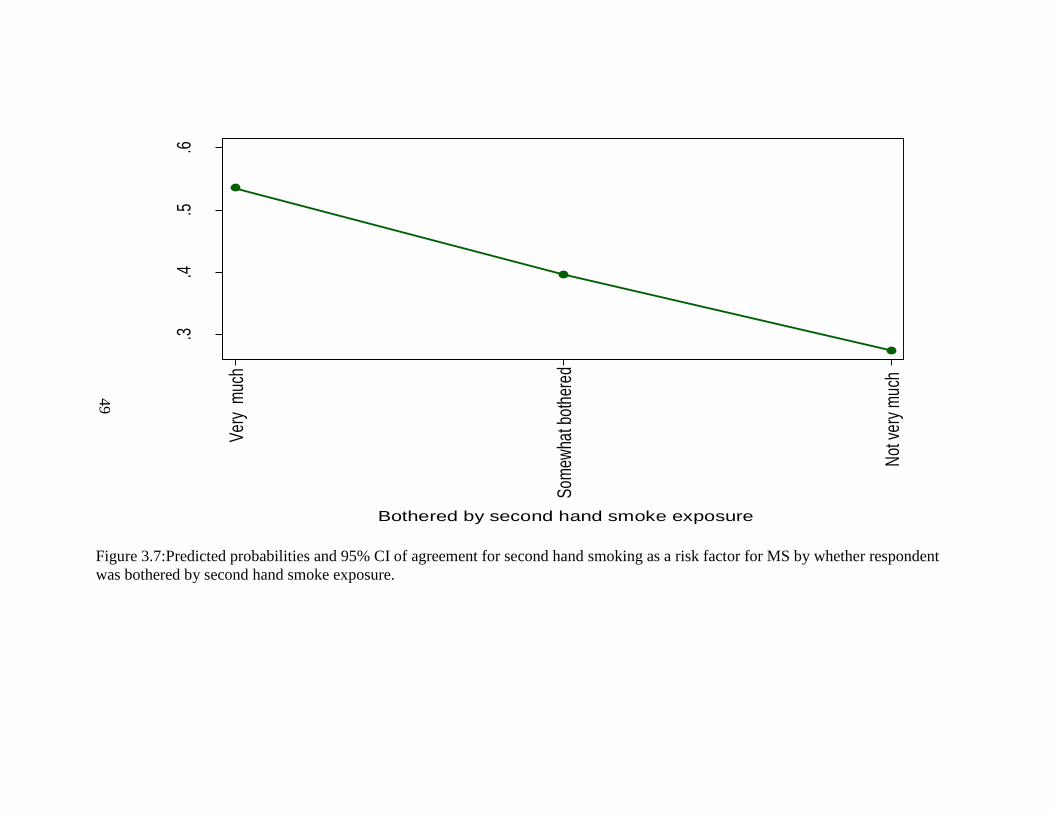
49
Figure 3.7:Predicted probabilities and 95% CI of agreement for second hand smoking as a risk factor for MS by whether respondent
was bothered by second hand smoke exposure.
.3.4
.5.6
95%
CI P
roba
bilit
y of
agr
eem
ent t
o se
cond
han
d sm
okin
g as
a ri
sk fa
cto
for M
S
Ver
y m
uch
Som
ewha
t bot
here
d
Not
ver
y m
uch
Bothered by second hand smoke exposure
50
3.4.2 Results based on Multiple Imputation
The results based on the multiple imputation procedure was similar to the results from the
complete cases analysis output (table 3-4 and table 3-5). All of the variables which were
screened in the univariate analysis were significant and were included in the multivariate
analysis model building process. Table 3-4 shows the output for the univariate analysis based on
multiple imputation procedures. In the model building process, number of people living in the
household, marital status, whether members of the household smoked, whether there were
children in the household younger than 18 years of age, the frequency of breathing in second
hand smoke and smoking status were removed based on a p-value of 0.05, however all were
included back into the model due to the variables being confounders.
Based on the comparison between models, the model based on complete case analysis explained
a larger portion of the total variance (1.9%) in people’s responses to the question on second hand
smoke exposure than the model based on imputation procedures (1.3%). Based on the results of
the ROC analysis, the final model based on complete cases analysis correctly classified 70% of
people on their perception of second hand smoke exposure, however the model based on the
imputation procedures correctly classified 65% of people on their perceptions of second hand
smoke exposure. The AIC was 7,832 for the multiple imputation model, which is larger
compared to the model with complete case analysis AIC= 5,201. After comparison of the models
and fit of the data, the model based on complete case analysis was better compared to the model
based on the imputation procedures.

51
Table 3.4:Descriptive statistics and univariate analysis for perception of second hand smoking as
a risk factor for MS based on multiple imputations (N=7,166).
Variables OR 95% CI P-value
Sex p<0.001*
Male Ref
Female 0.75 0.69-0.88 p<0.001
Age p<0.001*
≤24 Ref
25 to 30 0.70 0.56-0.89 0.003
31 to 36 0.70 0.57-0.88 0.002
37 to 42 0.57 0.46-0.70 p<0.001
43 to 48 0.47 0.38-0.58 p<0.001
49 to 54 0.46 0.37-0.57 p<0.001
55 to 60 0.46 0.36-0.57 p<0.001
≥61 0.57 0.47-0.69 p<0.001
Marital status p<0.001*
Married or living as a couple Ref
Single 1.17 1.03-1.33 0.017
Widowed 0.85 0.68-1.07 0.179
Separated 0.96 0.71-1.29 0.777
Divorced 0.62 0.49-0.79 p<0.001
Education p<0.001*
Less than high school degree Ref
High school degree 0.73 0.62-0.86 p<0.001
More than high school but less than university 0.61 0.53-0.71 p<0.001
University degree or greater 0.48 0.40-0.57 p<0.001
Number of people living in household p<0.001*
Less than 2 people Ref
Greater than 3 people 1.26 1.13-1.40 p<0.001
Do other members of your household smoke inside your home? 0.054
Yes 0.88 0.77-1.00 0.054
No Ref
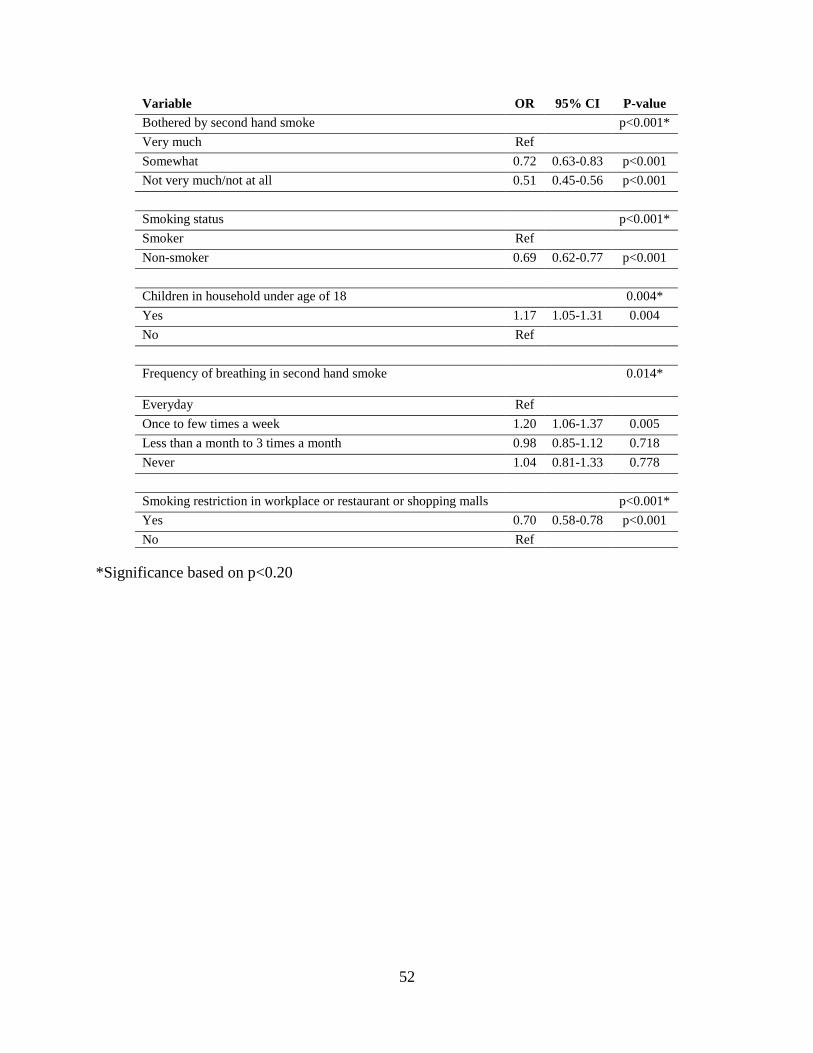
52
*Significance based on p<0.20
Variable OR 95% CI P-value
Bothered by second hand smoke p<0.001*
Very much Ref
Somewhat 0.72 0.63-0.83 p<0.001
Not very much/not at all 0.51 0.45-0.56 p<0.001
Smoking status p<0.001*
Smoker Ref
Non-smoker 0.69 0.62-0.77 p<0.001
Children in household under age of 18 0.004*
Yes 1.17 1.05-1.31 0.004
No Ref
Frequency of breathing in second hand smoke 0.014*
Everyday Ref
Once to few times a week 1.20 1.06-1.37 0.005
Less than a month to 3 times a month 0.98 0.85-1.12 0.718
Never 1.04 0.81-1.33 0.778
Smoking restriction in workplace or restaurant or shopping malls p<0.001*
Yes 0.70 0.58-0.78 p<0.001
No Ref

53
Table 3. 5:Multivariate analysis for perceptions of second hand smoke as a risk factor for MS
based on multiple imputation.
Variables OR 95% CI P-value
Sex
p<0.001*
Male 1.57 1.34-1.83 p<0.001
Female ref
Age
p<0.001*
≤24 ref
25 to 30 0.80 0.63-1.03 0.08
31 to 36 0.76 0.60-0.97 0.029
37 to 42 0.60 0.47-0.76 p<0.001
43 to 48 0.48 0.38-0.61 p<0.001
49 to 54 0.47 0.37-0.61 p<0.001
55 to 60 0.47 0.36-0.62 p<0.001
≥61 0.53 0.41-0.69 p<0.001
Marital status
0.30
Married or living as a couple ref
Single 1.00 0.86-1.17 0.98
Widowed 0.89 0.69-1.16 0.39
Separated 1.06 0.78-1.44 0.73
Divorced 0.78 0.60-0.99 0.045
Education
p<0.001*
Less than high school degree ref
High school degree 0.66 0.56-0.79 p<0.001
Greater than high school diploma but less
than university degree
0.53 0.45-0.62 p<0.001
University degree or greater 0.38 0.32-0.46 p<0.001
Number of people living in household
including themselves
0.28
Less than 2 people ref
Greater than 3 people 1.09 0.93-1.27 0.28
Do other members of your household smoke
inside your home?
0.81
Yes ref
No 1.02 0.8-1.18 0.81

54
Variable OR 95% CI P-value
Bothered by second hand smoke p<0.001*
Very much 2.05 1.75-2.41 p<0.001
Somewhat 1.46 1.26-1.69 p<0.001
Not very much/not at all ref
Smoking status
0.0003*
Smoker ref
Non smoker 1.40 1.16-1.67 p<0.001
Children in household under age of 18
0.62
Yes 1.04 0.88-1.32 0.62
No ref
Frequency of breathing in second hand
smoke
0.061
Never ref
Everyday 0.96 0.73-1.27 0.793
Once to few times a week 1.07 0.82-1.40 0.619
Less than a month to 3 times a month 0.87 0.67-1.14 0.312
Smoking restriction in workplace or
restaurant or shopping malls
0.0004*
Yes 0.77 0.67-0.89 p<0.001
No ref
Interaction of Sex and Smoking status
0.037*
Male×smoker 0.79 0.63-0.94 0.037
*Significance at p<0.05

55
3.5 Discussion
The main objective of this study was to determine the demographic, socioeconomic and personal
predictors associated with people’s level of agreement to whether they think that second hand
smoking is a risk factor for MS. Based on the results of this research it was evident that
demographic factors were associated with people’s perceptions of whether second hand smoking
is a risk factor for MS. As a secondary objective we explored whether this perception varied
based on the province of residence to find out if there is a macro level effect. The complete case
analysis indicated that 1.9% of the variability in responses in the dependent variable was
explained by province in which the person resided. One of the reasons for this variability could
be due to taxes on cigarettes and the tax hike that occurred in certain provinces over the years.15
Another reason for this variability could be due to effects of stop-smoking campaigns in the
provinces and the frequency in which messages about the harms of second hand smoking are
shown in advertisements.
In this study, 39% of people agreed that second hand smoke causes MS while 61% of people
disagreed to second hand smoke causing MS. The low prevalence of people in Canada who
agree to second hand smoke being a risk factor for MS development shows the lack of awareness
of MS risk factor. Males were more likely to agree that second hand smoke causes MS in
comparison to females. The prevalence of smoking among males globally is 4.4 times greater in
comparison to females.16 However an interaction effect was seen whereby male non-smokers
were more likely to agree that passive smoke exposure causes MS as opposed to male smokers.
Similar interaction effect was found for female non-smokers compared to female smokers.
Therefore smoking status plays a role in people’s perceptions since smokers were more likely to
disagree to harmful effects of passive smoking as oppose to non-smokers.
56
Having household members who did not smoke was associated with greater odds of people
agreeing that passive smoking is dangerous. This finding was similar to a study conducted in
Oregon whereby households with non-smokers or with at least one smokers, fully banning
household smoking was associated with a greater awareness of the harms of smoke exposure.17
This shows the importance of banning smoking in households and it’s impact on people’s
perceptions.
Age was a contributing factor in opinions for second hand smoke and MS development in that
older individuals were more likely to agree that second hand smoke causes MS as opposed to
younger people when looking at comparisons between age categories. A study done on the
prevalence of passive smoking found that a higher prevalence of passive smoking was evident in
the older population as opposed to the younger population.18 This suggests that older individuals
may have experience with the harms of second hand smoke exposure and may be aware of the
harms associated with it as opposed to the younger generation. With age comes more life
experiences in terms of having friends or family members who have gone through problems with
MS. Therefore they would have a better understanding of risk factors of primary and secondary
smoking and its effect on health. In addition to this older individuals may be more inclined to
quit smoking or reduce the harms of passive exposure based on advice received from clinicians
so that they can improve their quality of life.19
Individuals who had greater levels of education such as high school degree or greater were less
likely to agree to second hand smoke exposure being a risk factor for MS. These findings were
consistent with a study that investigated the sociodemographic characteristics and second hand
smoke exposure among women.20 In this study it was found that that women who had lower
levels of education were more likely to be exposed to second hand smoke exposure.20 The
findings from this study suggest that having higher levels of education doesn’t necessarily mean
that a person has more awareness and that perception of risk factors may be due to personal
experiences.
57
This study had many strengths. This was the first multilevel study that assessed people’s
knowledge on whether they think that second hand smoking is a risk factor for MS development.
Secondly the model correctly classified 70% of people on their perceptions of whether second
hand smoke causes MS indicating a good model fit. The sample used was representative of the
Canadian population since the major provinces were surveyed. Some of the limitations of this
study is response bias. Survey respondents may assume that second hand smoke exposure may
causes MS because of the way in which the question was asked and might answer in a desirable
manner. Non-response bias is also present in this survey due to the high number of missing
observations. Since this was a cross sectional study, a cause and effect relationship cannot be
assumed. Another limitation was the high number of smokers in the survey which could have
biased the results of the study, since smokers are more likely to disagree that smoking is
detrimental to health, they would be more inclined to disagree to the question of whether second
hand smoke exposure could increase risk of MS.
Limitations also exist with regards to the survey question. Since only one survey question was
asked and it didn’t have a definition of what MS was, there could be problems with people
understanding the health condition before answering the question. Another limitation is that the
survey is more than 10 years old, the knowledge of second hand smoking has increased and the
levels of smoking in the general population has declined, therefore the results of this study and
the recommendations made may differ in today’s population. In addition to this, the survey was
conducted through telephone interviews which may lead to higher number of non-responses if
individuals are not available during the time the call was placed.
Public health awareness about the risks of second hand smoke exposure is needed. There have
been two studies that have shown the impact of second hand smoke exposure and how it
increases the risk of developing MS among children and adults.3,5 In order to reduce the exposure
in public places, legislative bans need to be more restrictive in terms of specifying where people
can’t smoke.

58
Public smoking bans in Canada has been effective in reducing the prevalence of smoking and
have been effective in reducing rates of illnesses such as acute myocardial infection in
Saskatoon.21–23 However, in terms of MS, not many people are aware that second hand smoke
exposure can trigger relapses in MS, therefore patient and public education is important. One
way to educate people about second hand smoking and MS is through advertisements on
television or on buses.
Advertisements about the harms of cigarette smoking and it’s effect on lung cancer or on alcohol
use and impaired driving have been effective in raising awareness in these two areas and can also
be effective for diseases such as MS.24,25 Creating stop smoking campaigns which includes
messages about harmful effects of second hand smoking and it effects on neurological conditions
such as MS would also be effective in reducing smoking and second hand smoking.
Patient and family education about the risk factors for MS is important so they can be better
informed as to what triggers to avoid. Since second hand smoke exposure could be avoided,
physicians should communicate to caregivers about risk factors and give out educational
materials such as pamphlets or books about MS. A study on the effect of a website that provides
in depth information about beta interferon therapy found it to be useful for many patients.26
Websites such as this could show information regarding risk factors such as second hand smoke
exposure and its effect on MS. Another study by Kopke et al. (2014) found that patients who
were in the educational program showed more risk knowledge which was beneficial for
immunotherapy uptake. Educational programs on second hand smoke exposure and its impact on
people living with MS could be beneficial to the public.27

59
Since sociodemographic factors were associated with people’s perceptions about second hand
smoke exposure and MS, educational programs that raise awareness on this topic need to be
created. In addition to this stop smoking campaigns need to incorporate messages about the
various health problems that second hand smoke exposure could cause in children as well as in
adults. Lung cancer, chronic obstructive pulmonary disease and heart disease are the main
problems which are normally advertised as health problems associated with second hand
smoking, other illness such as MS are left out and should be incorporated into stop smoking
campaign messages.
60
3.7 References
1. Öberg M, Jaakkola MS, Woodward A, Peruga A, Prüss-ustün A. Worldwide burden of
disease from exposure to second-hand smoke : a retrospective analysis of data from 192
countries. Lancet. 2011;377(9760):139-146. doi:10.1016/S0140-6736(10)61388-8
2. Stroup T. Multiple Sclerosis and Smoking.; 2015.
http://www.nationalmssociety.org/NationalMSSociety/media/MSNationalFiles/Research/
Stroup_T_Smoking_and_MS_20151110.pdf.
3. Hedström AK, Bäärnhielm M, Olsson T, Alfredsson L. Exposure to environmental
tobacco smoke is associated with increased risk for multiple sclerosis. Mult Scler J.
2011;17(7):788-793. doi:10.1177/1352458511399610
4. Sundström P, Nyström L, Hallmans G. Smoke exposure increases the risk for multiple
sclerosis. Eur J Neurol. 2008;15(6):579-583. doi:10.1111/j.1468-1331.2008.02122.x
5. Mikaeloff Y, Caridade G, Tardieu M, Suissa S. Parental smoking at home and the risk of
childhood-onset multiple sclerosis in children. Brain. 2007;130(10):2589-2595.
doi:10.1093/brain/awm198
6. Zhang T, MD P, Tremlett H, et al. Examining the effects of comorbidities on disease-
modifying therapy use in multiple sclerosis. Neurology. 2016;86(14):1287-1295.
http://ovidsp.ovid.com/ovidweb.cgi?T=JS&PAGE=reference&D=ovftq&NEWS=N&AN
=00006114-201604050-00006.
7. Lincoln MR, Montpetit A, Cader MZ, et al. A predominant role for the HLA class II
region in the association of the MHC region with multiple sclerosis. Nat Genet.
2005;37(10):1108-1112. doi:10.1038/ng1647
8. Brynedal B, Duvefelt K, Jonasdottir G, et al. HLA-A confers an HLA-DRB1 independent
influence on the risk of multiple sclerosis. PLoS One. 2007;2(7):1-5.
doi:10.1371/journal.pone.0000664
9. Sawcer S, Hellenthal G, Pirinen M, et al. Genetic risk and a primary role for cell-mediated
61
immune mechanisms in multiple sclerosis. Nature. 2012;476(7359):214-219.
doi:10.1038/nature10251.Genetic
10. Hedström AK, Bomfim IL, Barcellos LF, et al. Interaction between passive smoking and
two HLA genes with regard to multiple sclerosis risk. Int J Epidemiol. 2014;43(6):1791-
1798. doi:10.1093/ije/dyu195
11. EKOS. Smoking in Public Places: A Survey of Residents of Newfoundland and Labrador
and British Columbia.; 2005. http://www.queensu.ca/cora/_files/POR-04-95.pdf.
Accessed January 13, 2019.
12. Health Canada. Smoking In Public Places: Quebec, Ontario and Saskatchewan.; 2005.
http://www.environics.net. Accessed January 13, 2019.
13. StataCorp. Stata statistical software: Release 15. 2015.
14. Rubin DB. Multiple Imputation for Nonresponse in Surveys. Wiley-Interscience; 2004.
https://books.google.ca/books?hl=en&lr=&id=bQBtw6rx_mUC&oi=fnd&pg=PR24&dq=
Rubin,+D.+B.+1987.+Multiple+Imputation+for+Nonresponse+in+Surveys.+New+York:+
Wiley.&ots=8OrNbL3_bS&sig=GgqMqkGbIhyY0i10YycoSDG4qCM#v=onepage&q=R
ubin%2C D. B. 1987. Multiple Imputati. Accessed January 26, 2019.
15. Ort DL, Perry DB. Provincial Budget Roundup, 2003. Can Tax J. 2003;51(3):1159-1199.
http://myaccess.library.utoronto.ca/login?url=http://search.proquest.com/docview/562714
93?accountid=14771 http://bf4dv7zn3u.search.serialssolutions.com/?ctx_ver=Z39.88-
2004&ctx_enc=info:ofi/enc:UTF-
8&rfr_id=info:sid/ProQ:econlitshell&rft_val_fmt=info:of.
16. WHO. Gender, Health, Tobabcco and Equity.; 2011.
https://www.who.int/tobacco/publications/gender/gender_tobacco_2010.pdf?ua=1.
17. Pizacani BA, Martin DP, Stark MJ, Koepsell TD, Thompson B, Diehr P. Household
smoking bans: Which households have them and do they work? Prev Med (Baltim).
2003;36(1):99-107. doi:10.1006/pmed.2002.1123

62
18. Yang S, Wu L, Zhang D, et al. Prevalence of passive smoking in the community
population aged 15 years and older in China: a systematic review and meta-analysis. BMJ
Open. 2016;6(4):e009847. doi:10.1136/bmjopen-2015-009847
19. Shadel WG, Elliott MN, Haas AC, et al. Clinician advice to quit smoking among seniors.
Prev Med (Baltim). 2015;70:83-89. doi:10.1016/j.ypmed.2014.11.020
20. Baheiraei A, Ghafoori F, Nedjat S, Foroushani AR. Sociodemographic characteristics and
secondhand smoke exposure among women. Tanaffos. 2013;12(2):41-47.
21. Government of Ontario. Smoke-Free Ontario | Ontario.ca.
https://www.ontario.ca/page/smoke-free-ontario. Published 2018. Accessed September 24,
2018.
22. Lemstra M, Neudorf C, Opondo J. Implications of a public smoking ban. Can J Public
Heal. 2008;99(1):62-65. doi:10.2307/41995035
23. Naiman A, Glazier R, Moineddin R. Is there an impact of public smoking bans on self-
reported smoking status and exposure to secondhand smoke? Do smoking bans decrease
exposure? BMC Public Health. 2011;11(1):146. doi:10.1186/1471-2458-11-146
24. McVey D, Stapleton J. Can anti-smoking television advertising affect smoking behaviour?
Controlled trial of the health education authority for England’s anti-smoking TV
campaign. Tob Control. 2000;9(3):273-282. doi:10.1136/tc.9.3.273
25. Hyland A, Wakefield M, Higbee C, Szczypka G, Cummings KM. Anti-tobacco television
advertising and indicators of smoking cessation in adults: A cohort study. Health Educ
Res. 2006;21(2):296-302. doi:10.1093/her/cyl048
26. Colombo C, Filippini G, Synnot A, et al. Development and assessment of a website
presenting evidence-based information for people with multiple sclerosis: The IN-DEEP
project. BMC Neurol. 2016;16(1):1-9. doi:10.1186/s12883-016-0552-0

63
27. Köpke S, Kern S, Ziemssen T, et al. Evidence-based patient information programme in
early multiple sclerosis: A randomised controlled trial. J Neurol Neurosurg Psychiatry.
2014;85(4):411-418. doi:10.1136/jnnp-2013-306441

64
CHAPTER 4: PSYCHOSOCIAL FACTORS ASSOCIATED WITH PAIN IN PEOPLE
WITH MS
Abstract
Objective: Pain is a common problem in MS. Risk factors associated with pain may include
individual’s cognitive thinking process, emotional and behavioural response to pain and amount
of social support. The primary objective of this study was to determine the association between
amount of social support and its association with odds of pain among individuals with MS.
Methods: The Survey on Living with Neurological Conditions in Canada (SLNCC) 2011-2012
linked to the Canadian Community Health Survey (CCHS) 2010-2011 was used to carry out a
logistic regression model for this analysis. The factors that were assessed were psychological
factors, problems with sleeping, self-perceived general health, self-perceived level of stress ,
number of years living with MS, as well as social factors (someone to confide/talk to, someone
to do something enjoyable, someone to take you to the doctor and someone to help you in an
emergency). The outcome variable was presence of pain.
Results: The amount of social support was found to be significant in that individuals who had 3
or less types of social support were 3.02 times more likely (95% CI 1.06 to 8.59) to be in pain as
opposed to individuals who had 4 types of support.
Conclusion: The results indicate that caregivers may not be available to help with all type of
activities, therefore home care services are very important. Reducing cost of home care services
would be beneficial for people living with MS.
65
4.1 Introduction
Pain is a common problem in people living with MS.1 The prevalence of pain in MS patients is
50%, and 75% of patients report having pain within one month of their assessment.2 The
presence of pain among patients with MS is associated with increasing age, the longer duration
of their illness, depression and increased functional impairment and fatigue.3 Pain causes
changes to occur in the central nervous system (CNS) and affects the emotional processing area
of the brain.4 When there is damage to the peripheral or CNS, neuropathic pain occurs. Pain
caused by MS can be explained by cognitive behavioural model which suggests that there are
both disease and non-disease factors that trigger pain.5
In MS, pain may be headaches, back pain, neuropathic pain and or spasms.6 Non-disease factors
associated with pain include the individual’s cognitive thinking process, emotional and
behavioural response to pain and amount of social support. Biopsychosocial model of pain
recognizes that psychological, social and environmental factors play a role in pain.7 Figure 4.1
shows the biopsychosocial model of pain. Earlier models of pain looked at the role of social
support and emphasized the importance of a transactional model where pain causes a problem
and it effects mood or behaviour which then leads to more support from others.8 However this
model now has been further explored and scientists believe that physical pain is connected to
social psychological pain.8
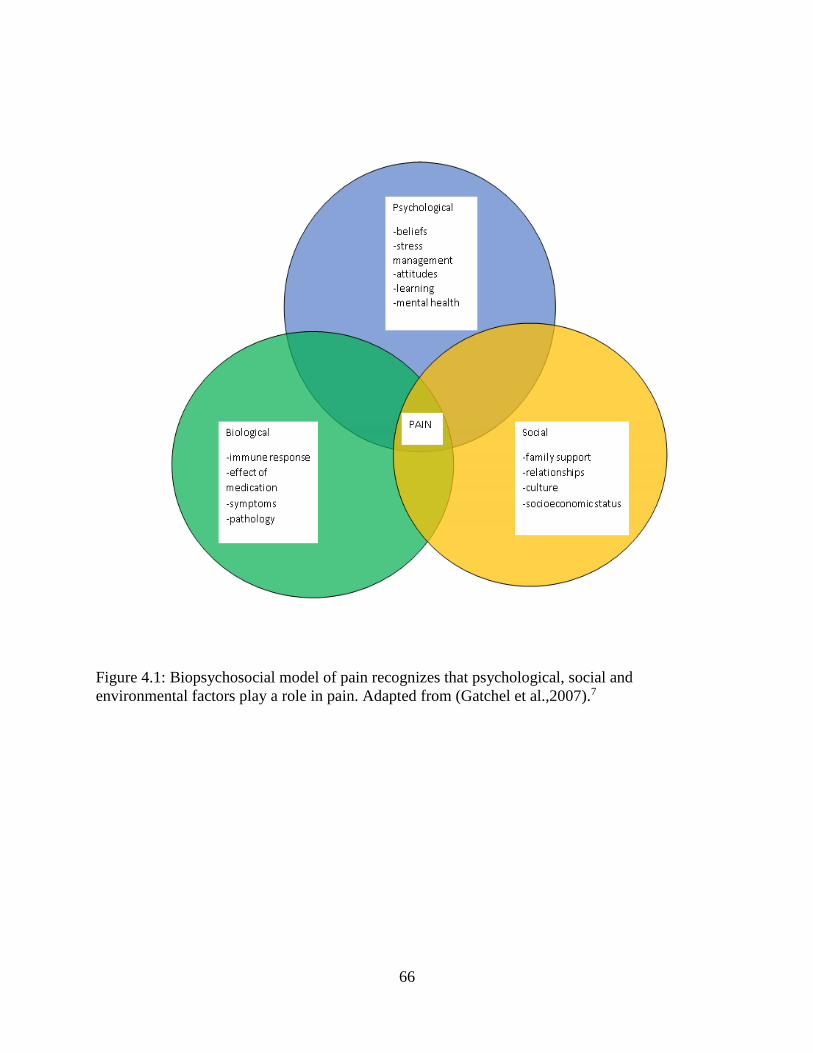
66
Figure 4.1: Biopsychosocial model of pain recognizes that psychological, social and
environmental factors play a role in pain. Adapted from (Gatchel et al.,2007).7
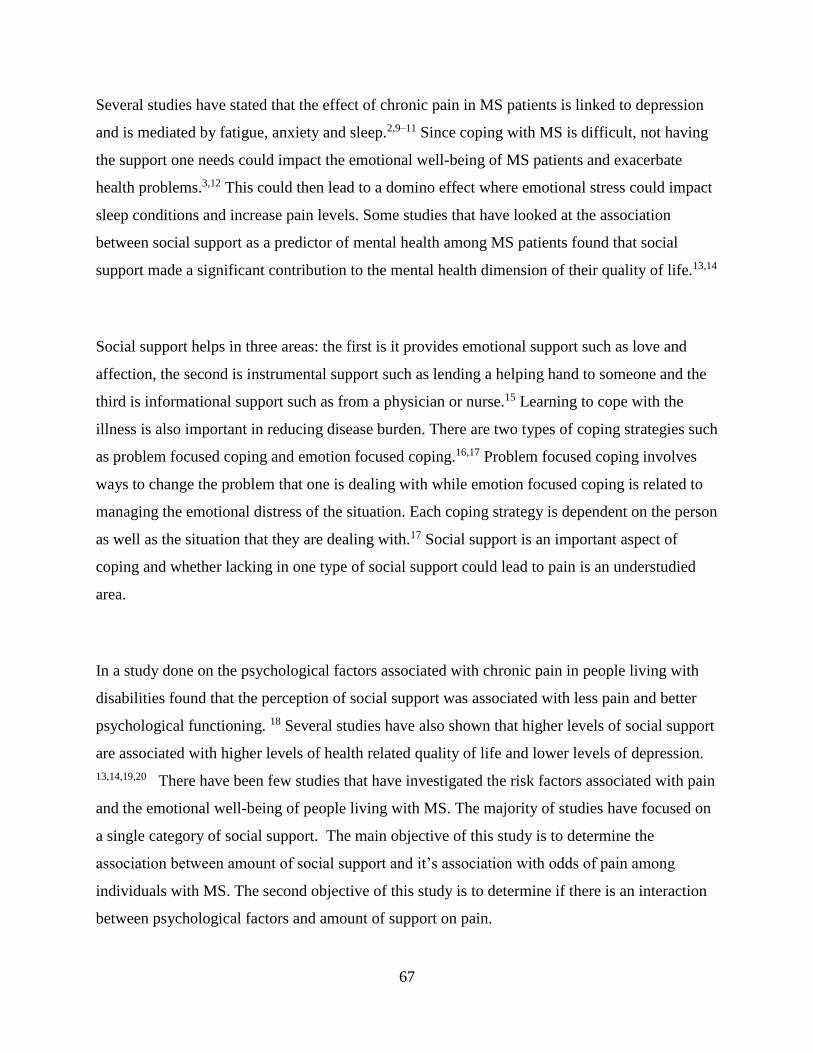
67
Several studies have stated that the effect of chronic pain in MS patients is linked to depression
and is mediated by fatigue, anxiety and sleep.2,9–11 Since coping with MS is difficult, not having
the support one needs could impact the emotional well-being of MS patients and exacerbate
health problems.3,12 This could then lead to a domino effect where emotional stress could impact
sleep conditions and increase pain levels. Some studies that have looked at the association
between social support as a predictor of mental health among MS patients found that social
support made a significant contribution to the mental health dimension of their quality of life.13,14
Social support helps in three areas: the first is it provides emotional support such as love and
affection, the second is instrumental support such as lending a helping hand to someone and the
third is informational support such as from a physician or nurse.15 Learning to cope with the
illness is also important in reducing disease burden. There are two types of coping strategies such
as problem focused coping and emotion focused coping.16,17 Problem focused coping involves
ways to change the problem that one is dealing with while emotion focused coping is related to
managing the emotional distress of the situation. Each coping strategy is dependent on the person
as well as the situation that they are dealing with.17 Social support is an important aspect of
coping and whether lacking in one type of social support could lead to pain is an understudied
area.
In a study done on the psychological factors associated with chronic pain in people living with
disabilities found that the perception of social support was associated with less pain and better
psychological functioning. 18 Several studies have also shown that higher levels of social support
are associated with higher levels of health related quality of life and lower levels of depression.
13,14,19,20 There have been few studies that have investigated the risk factors associated with pain
and the emotional well-being of people living with MS. The majority of studies have focused on
a single category of social support. The main objective of this study is to determine the
association between amount of social support and it’s association with odds of pain among
individuals with MS. The second objective of this study is to determine if there is an interaction
between psychological factors and amount of support on pain.
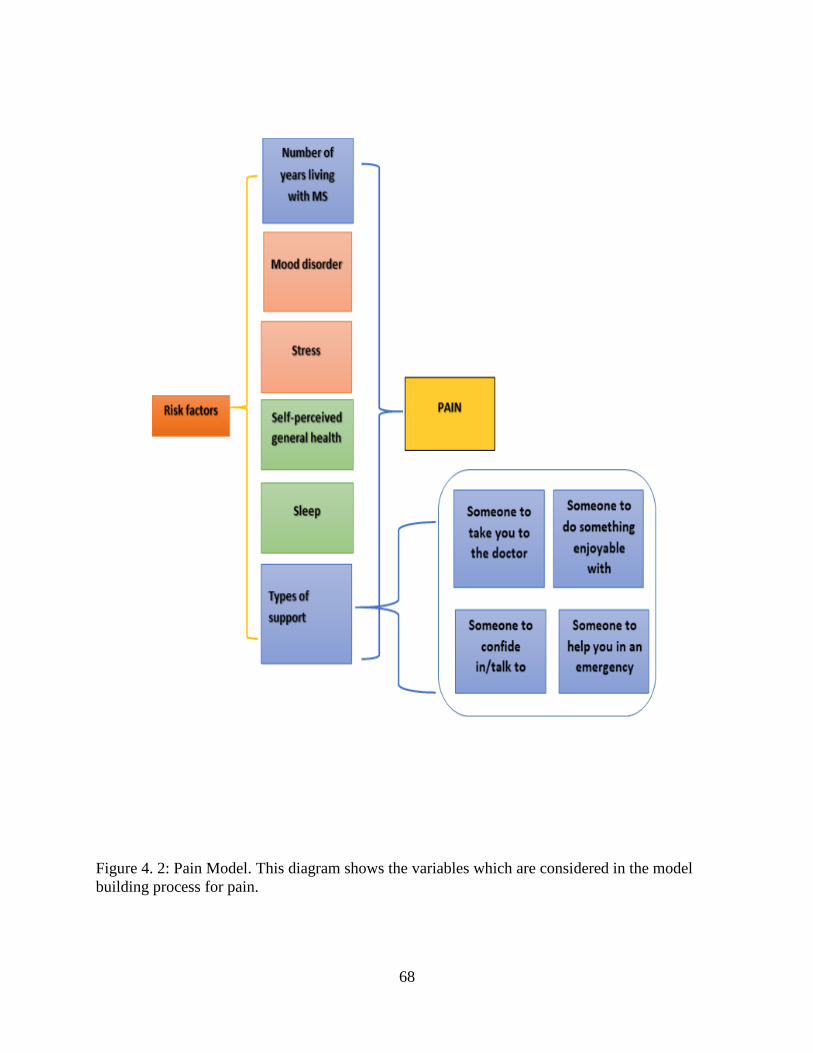
68
Figure 4. 2: Pain Model. This diagram shows the variables which are considered in the model
building process for pain.

69
4.2 Methods
4.2.1 Data Source
The Survey on Living with Neurological Conditions in Canada (SLNCC) 2011-2012 linked to
the Canadian Community Health Survey (CCHS) 2010-2011 was used for this analysis.21 The
SLNCC is a cross sectional survey that collected information on Canadian’s experiences of
living with chronic neurological conditions.21 There were 18 neurological conditions which were
included in the 2010 and 2011 Canadian Community Health Surveys.21 The sample surveyed for
the SLNCC survey were drawn from all CCHS respondents and household members who were
15 years of age and older living in the provinces being surveyed and who had one of the 18
neurological conditions.21
4.2.2 Variables assessed
Individuals 15 years and older were used in the analysis. The factors that were assessed were
psychological factor (mood disorder such as depression, bipolar disorder, mania or dysthymia),
problems with sleeping, self-perceived general health (poor or fair health, good, very
good/excellent health), self-perceived level of stress (not at all or not very stressful, a bit
stressful, quite a bit to extremely stressful), number of years living with MS (less than 10 years,
11 to 21 years, greater than 22 years), as well as social factors (someone to confide/talk to,
someone to do something enjoyable, someone to take you to the doctor and someone to help you
in an emergency).
There were 4 types of support questions asked following the prompt “people sometimes look to
others for companionship, assistance or other types of support”, “how often is each of the
following kinds of support available to you if you need it?”.21 Following this statement, the
respondent was asked 4 questions“…someone to confide in or talk to about yourself or your
problems?”, the second question was “….someone to do something enjoyable with?”, the third
was “…someone to take you to the doctor if you needed it?” and the fourth was “…someone to
turn to help in an emergency?” the responses were “none of the time, a little of the time, some of
the time, most of the time and all of the time”.21

70
The outcomes were recoded as “none”, “little/some”, “most/all” in order to have enough number
of observations in each category.21 These 4 questions and the responses were combined together
to create one support variable (someone to confide/talk to, someone to do something enjoyable,
someone to take you to the doctor and someone to help you in an emergency) and categorized as
either having less than 4 types of support or the second category being having all 4 types of
support. The outcome variable was pain health status for which there were 5 categories (no pain
or discomfort, pain prevents no activities, pain prevents a few activities, pain prevents some
activities and pain prevent most activities). These categories were collapsed to either presence or
absence of pain.
4.3 Analysis
In order to take into account the survey design, replicate sampling weights along with
bootstrapped variance estimation were used which were recommended by Statistics Canada.22 A
set of (n=500) replicate weights were used in order to account for population estimates and non-
responses. For the SLNCC linked data set, the bootstrap replicates are the sub samples which
were drawn in order to estimate the variance of the CCHS estimates. All analyses was conducted
at the Research Data Centre at the University of Saskatchewan using STATA IC 15.23 Figure 4.2
shows the model for this analysis.
Univariate analysis using a p-value of 0.20 was used as a cut point for the entry of a variable for
multivariate analysis. A logistic regression model was built using the backward method based on
a p-value of 0.05. Variables that were not included in the model were tested as confounders
based on whether the addition of the variable changed the other estimates in the model by more
than 20%. Receiver operating curve and the goodness of fitness test was to determine model fit.
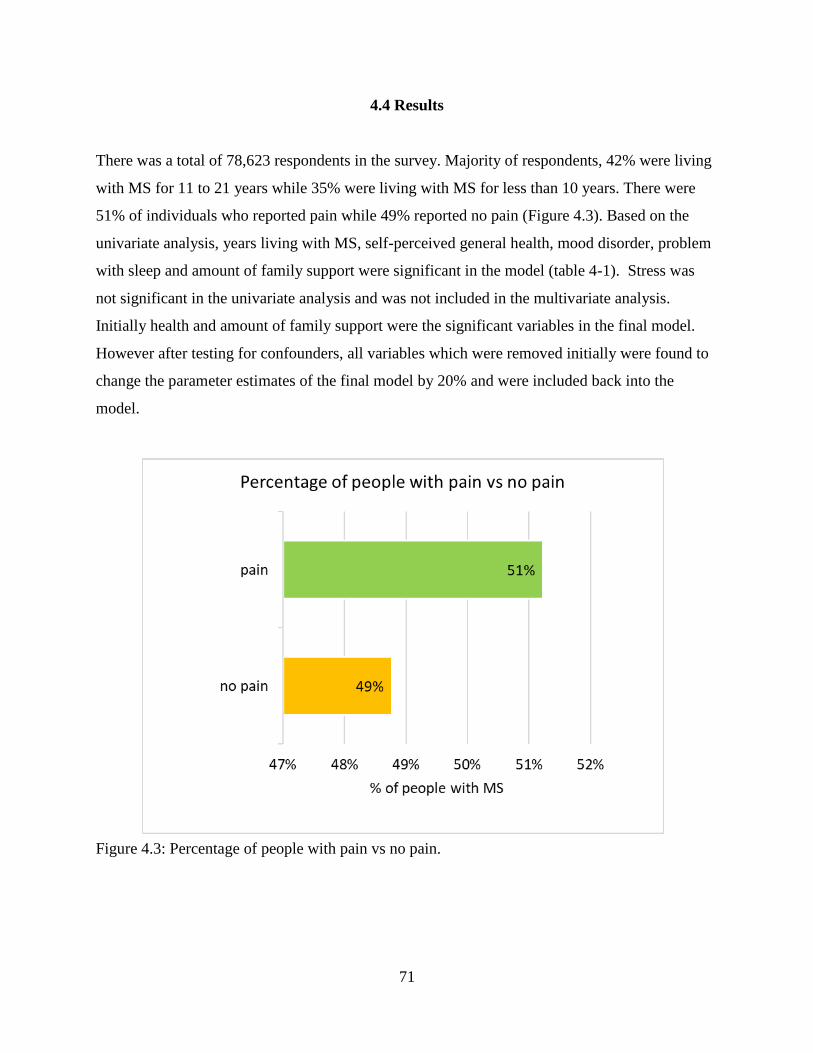
71
4.4 Results
There was a total of 78,623 respondents in the survey. Majority of respondents, 42% were living
with MS for 11 to 21 years while 35% were living with MS for less than 10 years. There were
51% of individuals who reported pain while 49% reported no pain (Figure 4.3). Based on the
univariate analysis, years living with MS, self-perceived general health, mood disorder, problem
with sleep and amount of family support were significant in the model (table 4-1). Stress was
not significant in the univariate analysis and was not included in the multivariate analysis.
Initially health and amount of family support were the significant variables in the final model.
However after testing for confounders, all variables which were removed initially were found to
change the parameter estimates of the final model by 20% and were included back into the
model.
Figure 4.3: Percentage of people with pain vs no pain.
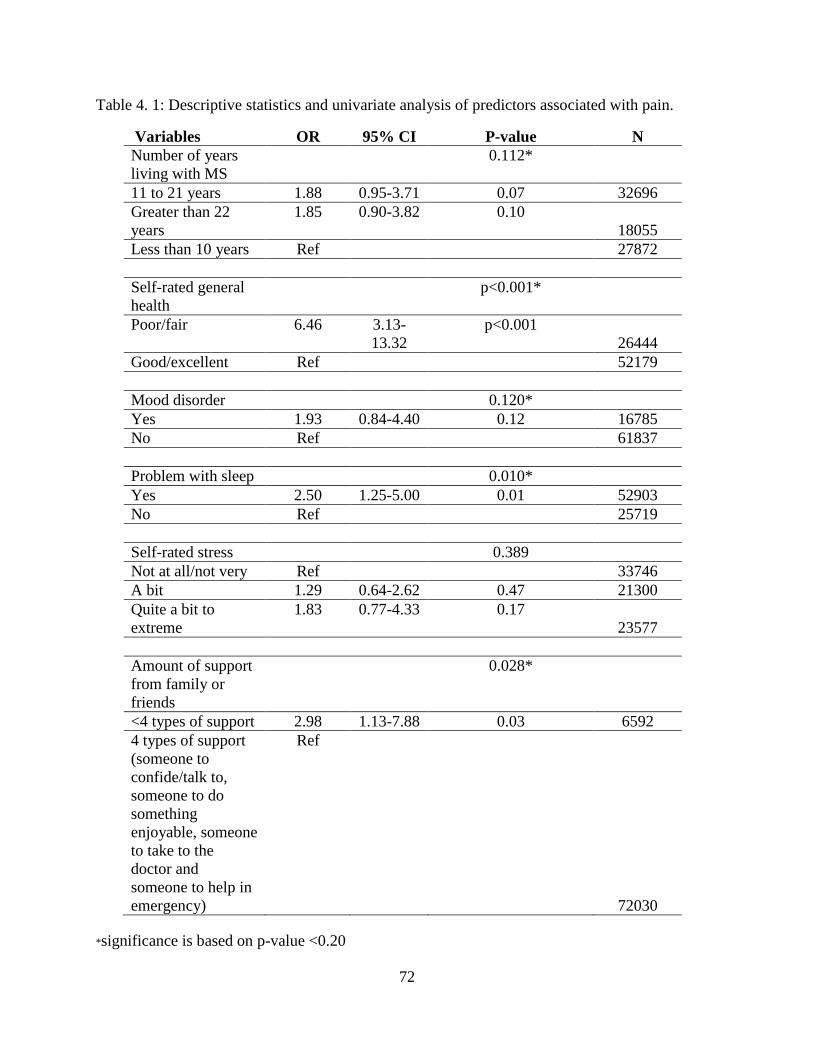
72
Table 4. 1: Descriptive statistics and univariate analysis of predictors associated with pain.
Variables OR 95% CI P-value N
Number of years
living with MS
0.112*
11 to 21 years 1.88 0.95-3.71 0.07 32696
Greater than 22
years
1.85 0.90-3.82 0.10
18055
Less than 10 years Ref 27872
Self-rated general
health
p<0.001*
Poor/fair 6.46 3.13-
13.32
p<0.001
26444
Good/excellent Ref 52179
Mood disorder 0.120*
Yes 1.93 0.84-4.40 0.12 16785
No Ref 61837
Problem with sleep 0.010*
Yes 2.50 1.25-5.00 0.01 52903
No Ref 25719
Self-rated stress 0.389
Not at all/not very Ref 33746
A bit 1.29 0.64-2.62 0.47 21300
Quite a bit to
extreme
1.83 0.77-4.33 0.17
23577
Amount of support
from family or
friends
0.028*
<4 types of support 2.98 1.13-7.88 0.03 6592
4 types of support
(someone to
confide/talk to,
someone to do
something
enjoyable, someone
to take to the
doctor and
someone to help in
emergency)
Ref
72030
*significance is based on p-value <0.20
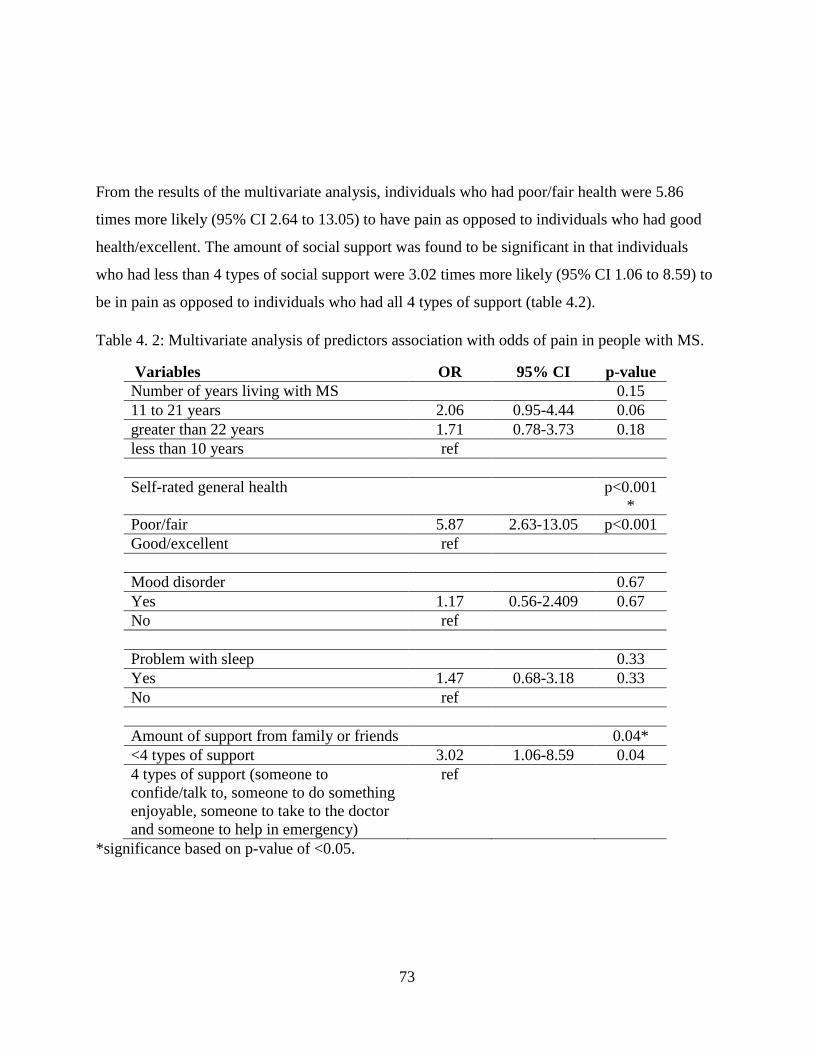
73
From the results of the multivariate analysis, individuals who had poor/fair health were 5.86
times more likely (95% CI 2.64 to 13.05) to have pain as opposed to individuals who had good
health/excellent. The amount of social support was found to be significant in that individuals
who had less than 4 types of social support were 3.02 times more likely (95% CI 1.06 to 8.59) to
be in pain as opposed to individuals who had all 4 types of support (table 4.2).
Table 4. 2: Multivariate analysis of predictors association with odds of pain in people with MS.
Variables OR 95% CI p-value
Number of years living with MS
0.15
11 to 21 years 2.06 0.95-4.44 0.06
greater than 22 years 1.71 0.78-3.73 0.18
less than 10 years ref
Self-rated general health
p<0.001
*
Poor/fair 5.87 2.63-13.05 p<0.001
Good/excellent ref
Mood disorder
0.67
Yes 1.17 0.56-2.409 0.67
No ref
Problem with sleep
0.33
Yes 1.47 0.68-3.18 0.33
No ref
Amount of support from family or friends
0.04*
<4 types of support 3.02 1.06-8.59 0.04
4 types of support (someone to
confide/talk to, someone to do something
enjoyable, someone to take to the doctor
and someone to help in emergency)
ref
*significance based on p-value of <0.05.

74
Interactions were tested between mood disorder and family support and between health condition
and family support. Based on the univariate analysis, both interactions were found to be
significant. However when included in the multivariate analysis there were not found to be
significant. Therefore both interactions were not included in the final model. Table 4.2 shows the
results of the final model. The area under the curve gave a value of 0.75 which indicated that this
model was a good model and the goodness of fit test indicated a value of 0.94 which indicated
that the model was significant.
4.5 Discussion
The results of the study indicate that all types of social support are needed for managing pain in
MS patients. Lacking in one types of support increases the odds of pain among individual’s with
MS. Therefore having someone to talk to about problems that they may have, having someone to
do something enjoyable with allow for a sense of belonging. One study on coping and
psychological adjustment among people with MS found that people with MS were less likely to
seek out social support.24 In another study done on investigating the needs of people with MS
found that socio-environmental support such as household adaptation, better transport and
rehousing was the category that was most frequently suggested.25
Many people with MS who are in the later stages of MS cannot carry out activities of daily living
need support from their family or friends, therefore the burden of caregivers is increased as
disability progresses. This becomes a problem because the caregivers usually tend to be the
spouse of the person with MS and all activities such as bathing or moving the person from
wheelchair to bed cannot be carried out by a spouse. Therefore the person with MS may lack the
support they need if they are financially unstable to hire help from an organization. In a study
done by Akku (2010) on caregivers and their level of stress in taking care of someone with MS
found that the major predictors of feeling overburdened were feeling hopelessness, conflicts in
decision making, not having enough time for leisure activities and social isolation.26 In addition
to this, some people with MS may have loss of mobility which increases pain when carrying out
even the simplest of tasks. Therefore lacking in one type of support would increase pain.
75
A study that examined the impact of walking impairment in people with MS found that among
the 1011 people with MS, 41% reported having difficulty walking, with 70% stating that walking
was one of the most difficult aspect of having MS and 74% stated that it disrupted their activities
of daily living.27 In addition to this, 39% of people with MS stated that they never or rarely
discussed the problem they have about difficulty with walking to their family doctor.27
However not all caregivers will seek the support they need. In a study done on caregivers of
people with MS experience of support found that some caregivers tend to reject support from
other family members or friends because they did not want to face the reality that someone they
love had MS.28 In other cases, rejecting help was also associated with wanting more control of
the situation.28 Other reasons for not asking for help was the caregivers thought that no one knew
the care recipient well enough to take care of them and though it was their responsibility to do it
themselves.28 Some caregivers were not satisfied with the support services since it did not meet
the needs of the care recipient.28
It is important for caregivers to seek support when needed and talk to their doctors about getting
the proper services. Having support workers, visiting nurses, home maintenance services,
workplace or vehicle modification can improve quality of life of both the person living with MS
as well as their caregiver.29 The results of the study also indicate that having poor health is
associated with increased odds of pain among individuals with MS. MS is a condition that occurs
with other conditions such as migraine headaches, back pain, depression, spasms etc. Therefore
those who have MS may be in more pain because of these conditions and may have been
overlooked in the diagnosis or they may not seek help for their conditions.
A similar study done on self-rated health and association with pain have found similar results.30
Other studies have pointed to self-efficacy as a predictor for self-rated health.31 Self-efficacy is

76
the ability of someone to adjust to the condition they have which would allow them to cope more
effectively.31 It is linked to self-esteem and how much control a person has.31 There are 4 ways
to improve self-efficacy: 1) experience of accomplishing a behaviour; 2) vicarious learning or
modelling the behaviour; 3) through encouragement or support from others; and 4) through
physiological arousal such as anxiety which is connected to the behaviour.31 Other studies have
also showed that self-efficacy is a significant predictor of self-reported physical, cognitive and
social functioning in MS.32
The strength of this study is that an association between lack of support for people living with
MS and pain outcomes were determined, in addition to this, the study highlights the importance
of having support in helping patients with MS and the need for more affordable home care
services for people living with MS. One of the limitations of this study was that the type of MS
was not available as a variable which could have helped in determining whether pain levels
varied based on type of MS.
The support variable question which was asked did not specify whether it was informal or formal
support, however it can be assumed that the question is asking about informal support (from
family or friends) since the question prompt was “people sometimes look to others for
companionship, assistance or other types of support”.21 However since the questions was not
specific and didn’t given examples of the type of support, respondents may have answered based
on formal support (organizations, agencies) they received.
The role of caregivers is important to the well-being of people living with MS. Therefore it is
important that they get the help they need in order to reduce burnout. The results of this research
will inform clinicians about the importance of caregiver support and how to help their patients
seek out quality services that can help them with their needs. An example of resources that
clinicians can give to caregivers is caregiver educational materials. The MS society of Canada
77
has an information and resource page on their website which provide webinars to caregivers,
peer support group and caregiver guides.33
The MS society of Canada also has resources to help with respite services which provide primary
caregivers a break from their duties by providing them with a personal care worker to come in
and help the patient.29 In addition to this self-efficacy is important when overcoming many
illnesses and people with MS should seek help if they cannot cope with their illness. The results
of this study will also inform health care organizations on ways to improve home care services
for people with MS especially in lower income neighbourhoods or on reserves.

78
4.6 References
1. Ziemssen T. Symptom management in patients with multiple sclerosis. J Neurol Sci.
2011;311 Suppl(SUPPL. 1):S48-52. doi:10.1016/S0022-510X(11)70009-0
2. O’Connor AB, Schwid SR, Herrmann DN, Markman JD, Dworkin RH. Pain associated
with multiple sclerosis: Systematic review and proposed classification. Pain.
2008;137(1):96-111. doi:10.1016/j.pain.2007.08.024
3. Hadjimichael O, Kerns RD, Rizzo MA, Cutter G, Vollmer T. Persistent pain and
uncomfortable sensations in persons with multiple sclerosis. Pain. 2007;127(1-2):35-41.
doi:10.1016/j.pain.2006.07.015
4. Borsook D. Neurological diseases and pain. J Neurol. 2012;135(2):320-344.
doi:10.1093/brain/awr271
5. Harrison AM, McCracken LM, Bogosian A, Moss-Morris R. Towards a better
understanding of MS pain: A systematic review of potentially modifiable psychosocial
factors. J Psychosom Res. 2015;78(1):12-24. doi:10.1016/j.jpsychores.2014.07.008
6. Drulovic J, Basic-Kes V, Grgic S, et al. The Prevalence of Pain in Adults with Multiple
Sclerosis: A Multicenter Cross-Sectional Survey. Pain Med. 2015;16(8):1597-1602.
doi:10.1111/pme.12731
7. Gatchel RJ, Peng YB, Peters ML, Fuchs PN, Turk DC. The Biopsychosocial Approach to
Chronic Pain: Scientific Advances and Future Directions. Psychol Bull. 2007;133(4):581-
624. doi:10.1037/0033-2909.133.4.581
8. Sturgeon JA, Zautra AJ. Social pain and physical pain: shared paths to resilience. Pain
Manag. 2016;6(1):63-74. doi:10.2217/pmt.15.56
9. Day MA, Ehde DM, Charles Ward L, et al. An empirical investigation of a
biopsychosocial model of pain in multiple sclerosis. Clin J Pain. 2016;32(2):155-163.
doi:10.1097/AJP.0000000000000240
79
10. Truini A, Galeotti F, La Cesa S, et al. Mechanisms of pain in multiple sclerosis: A
combined clinical and neurophysiological study. Pain. 2012;153(10):2048-2054.
doi:10.1016/j.pain.2012.05.024
11. Amtmann D, Askew RL, Kim J, et al. Pain Affects Depression Through Anxiety, Fatigue,
and Sleep in Multiple Sclerosis. Rehabil Psychol. 2015;60(1):81-90.
doi:10.1037/rep0000027
12. Kalia L V, Connor PWO. Severity of chronic pain and its relationship to quality of life in
multiple sclerosis. Mult Scler J. 2005;11(3):322-327.
13. Schwartz C, Frohner R. Contribution of demographic, medical, and social support
variables in predicting the mental health dimension of quality of life among people with
multiple sclerosis. Health Soc Work. 2005;30(3):203-2012.
14. Krokavcova M, JP van D, Nagyova I, et al. Social support as a predictor of perceived
health status in patients with multiple sclerosis. Patient Educ Couns. 2008;73(1):159-165.
http://ezproxy.stir.ac.uk/login?url=http://search.ebscohost.com/login.aspx?direct=true&db
=ccm&AN=105559345&site=ehost-live.
15. Zimet G, Dahlem N, Zimet S, Farley G. The multidimensional scale of perceived social
support. J Pers Assess. 1988;52(1):30-41. doi:10.1207/s15327752jpa5201
16. Lazarus RS. Emotions and interpersonal relationships: Toward a person-centered
conceptualization of emotions and coping. J Pers. 2006;74(1):9-46.
doi:10.1016/j.surfcoat.2016.08.090
17. Baker JP, Berenbaum H. Emotional approach and problem-focused coping: A comparison
of potentially adaptive strategies. Cogn Emot. 2007;21(1):95-118.
doi:10.1080/02699930600562276
18. Jensen MP, Moore MR, Bockow TB, Ehde DM, Engel JM. Psychosocial factors and
adjustment to chronic pain in persons with physical disabilities: A systematic review. Arch
Phys Med Rehabil. 2011;92(1):146-160. doi:10.1016/j.apmr.2010.09.021
80
19. Ryan KA, Rapport LJ, Sherman TE, Hanks RA, Lisak R, Khan O. Predictors of subjective
well-being among individuals with multiple sclerosis. Clin Neuropsychol. 2007;21(2):239-
262. doi:10.1080/13854040600582460
20. Costa D, Sá MJ, Calheiros JM. The effect of social support on the symptoms of depression
experienced by Portuguese patients with multiple sclerosis. Rev Neurol. 2011;53(8):457-
462. doi:10.1590/S0004-282X2012000200007
21. Survey on living with neurological conditions in Canada (SLNCC)-2011. Statistics
Canada.
http://www23.statcan.gc.ca/imdb/p2SV.pl?Function=getSurvey&SDDS=5182&Item_Id=
845. Published 2011. Accessed January 13, 2017.
22. Survey on living with neurological conditions in Canada (SLNCC)-2011. Statistics
Canada.
23. StataCorp. Stata statistical software: Release 15. 2015.
24. McCabe MP, McKern S, McDonald E. Coping and psychological adjustment among
people with multiple sclerosis. J Psychosom Res. 2004;56(3):355-361.
doi:10.1016/S0022-3999(03)00132-6
25. Forbes A, While A, Taylor M. What people with multiple sclerosis perceive to be
important to meeting their needs. J Adv Nurs. 2007;58(1):11-22. doi:10.1111/j.1365-
2648.2007.04219.x
26. Akku Y. Multiple sclerosis patient caregivers: The relationship between their
psychological and social needs and burden levels. Disabil Rehabil. 2011;33(4):326-333.
doi:10.3109/09638288.2010.490866
27. LaRocca NG. Impact of walking impairment in multiple sclerosis: Perspectives of patients
and care partners. Patient. 2011;4(3):189-201. doi:10.2165/11591150-000000000-00000
28. Mckeown LP, Porter-armstrong AP, Baxter GD. Caregivers of people with multiple
sclerosis: experience of support. Mult Scler J. 2004;10(2):219-231.
81
29. Care in the community. MS Society of Canada. https://mssociety.ca/managing-ms/living-
with-ms/ms-care/care-in-the-community. Published 2018. Accessed July 22, 2018.
30. Ehde DM, Gibbons LE, Chwastiak L, Bombardier CH, Sullivan MD, Kraft GH. Chronic
pain in a large community sample of persons with multiple sclerosis. Mult Scler.
2003;9(6):605-611.
31. Riazi A, Thompson A, Hobart J. Self-effcacy predicts self-reported health status in
multiple sclerosis. Mult Scler. 2004;10(1):61-66.
32. Schmitt MM, Goverover Y, Deluca J, Chiaravalloti N. Self-efficacy as a predictor of self-
reported physical, cognitive, and social functioning in multiple sclerosis. Rehabil Psychol.
2014;59(1):27-34. doi:10.1037/a0035288
33. Information and resources. MS Society of Canada. https://mssociety.ca/support-
services/caregivers/information-and-resources. Published 2019. Accessed January 14,
2019.
82
CHAPTER 5: USING COMPLEMENTARY/ALTERNATIVE TREATMENTS (CAMS)
REDUCE ADHERENCE TO MS MEDICATION
Abstract
Objective: Appropriate use of prescribed medications are crucial to preventing relapses from
occurring, however do to the side effects of many medications, many people turn to
complementary and alternative medicine (CAM) treatments. The objective of this study was to
examine the predictors associated with MS medication use. The two categories that were
investigated were various alternative treatments as well as comorbid health conditions.
Methods: The Survey on Living with Neurological Conditions in Canada (SLNCC) 2011 was
used to carry out the analysis. The outcome variable was whether or not the individual used
medication for MS during the course of their illness. Logistic regression model was used to carry
out the analysis.
Results: Individuals who did not take CAMs were more OR=5.44 95% CI (1.37-9.29) likely to
use medication for MS as opposed to those who used CAMs. Having a mood disorder was
associated with greater use of medications for MS while back problems were associated with
lower odds of medication use.
Conclusion: The use of complementary treatment is associated with lower odds of MS
medication use. Efforts should be taken by health care practitioners to inform patients about the
benefits of disease modifying medications and why it should never be substituted with other
treatments.

83
5.1 Introduction
Multiple sclerosis (MS) is a demyelinating diseases of the central nervous system which has no
cure.1,2 However, there are a wide range of disease modifying treatments, primarily medications
that have been effective in slowing down the disease and reducing relapses from occuring.3 The
main drugs are Beta Interferons, Glatiramer Acetate, Mitoxantrone, Natalizumab, and
Fingolimod that can shorten the duration of attacks, decrease the frequency and provide
symptomatic relief.4 In addition, medications can reduce disease progression, lower the number
of emergency department visits and in general improve overall quality of life. Medication use
benefit the patient as well as the clinician, health care system and society as a whole.
The importance of early treatment initiation in MS has been found in many studies.3,5,6 Patients
who had started treatments later in the clinical course of the disease had a greater risk of reaching
a level 4 on the Expanded Disability Status Scale (EDSS) which indicates significant disability.
The hazard ratio was 1.07 (95% CI 1.05 to 1.10).5 Earlier treatments were associated with better
clinical outcomes.5 However one of the main reasons patients stop taking medication is because
medication for MS is not a cure and although it prevents relapses from occurring, patients still
have a wide range of symptoms and side effects such as bladder dysfunction, chronic pain,
cognitive decline as well as mobility problems.7 Disease modifying medications (DMTs) can
help to slow down the progression of the disease but they cannot reverse the lesions that have
already taken place.8
DMTs may need to be stopped if there are serious adverse side effects that are life threatening.6
Some side effects may occur such as with the drug fingolimod which increases the risk of
opportunistic infections in patients and causes low lymphocyte count in peripheral blood.6 In
order to reduce symptoms such as spasticity, antispastics such as baclofen, tizanidine, diazepam
and clonazepam could be used, however there are adverse effects associated with this line of
medication such as postural instability and vertigo.9

84
Up to now there hasn’t been many studies that have been conducted on whether using
complementary/alternative treatments (CAMS), rehabilitation therapy or other conditions impact
medication adherence in positive or negative way. Due to adverse side effects of medication use
people often turn to complementary/alternative medicine treatments (CAMS) such as natural
health products, herbs, homeopathic medicine, vitamins, acupuncture or exercise.10 Another type
of auxiliary treatment is rehabilitation which is an understudied area whereby rehabilitation helps
with walking or balance but whether rehabilitation impacts MS medication use has yet to be
explored. Rehabilitation interventions has been considered beneficial in the earlier phases of MS.
It is used to reduce symptoms and help improve the quality of life of people with MS.9 The most
important aspect of rehabilitation is that patients can have various types of difficulties from
physical, behavioural or cognitive but rehabilitation programs can help the patient by altering the
treatment regimen in order to better serve the needs of the patient.9
Having one or more conditions may also affect whether or not individuals take medication for
MS. Chronic diseases may co-exist together because of chance or patients may be diagnosed
with another disease because of frequent use of health care services.11,12 In other cases, diseases
may co-exist together because of genetic susceptibility to immune disorders, environmental
factors and independent factors such as age, obesity and diet.11,12 Diseases may co-exist together
because they are a product of another undiagnosed disease.11 Psychiatric illnesses may influence
medication use or may hinder it but studies are lacking in this area. Some studies have shown
that psychiatric disorders such as depression and anxiety are common among individuals with
MS.13–15
Cognitive behavioural therapy has been shown to help patients cope with MS and improve
overall quality of life. Majority of CBT’s focus on treating depression, however whether it
reduces disease progression has yet to be studied. Other areas include mindfulness based
interventions which were found to be effective in helping patients be aware of present
experiences and reduce emotional distress.16 A review on mindfulness based interventions found
85
that stress could lead to disease progression for MS patients and that mindfulness could be used
to accept the presence of the disease and to look for a better outcome on life.16
There are a vast number of social behavioural models that have been found to be effective in
helping patients adhere to medications.17 Models such as the health belief model, information
motivation behavioural (IMB) skills model, situated IMB model of care Imitation and
maintenance, social cognitive theory, self-regulations theory, theory of planned behaviour,
protective motivation theory, trans theoretical model, chronic care model, self-management
theory, Anderson behavioural model and ecological/socio-ecological framework/ model has been
found to be effective for helping patients to change their behaviour.17
For example the health belief model is commonly used to change ones behaviour with regards to
compliance to medications. One of the main features of this model is that the patient has the
choice and are able to decide what is best for their health.18 It is dependent on whether the patient
thinks that they are at a risk for an illness, whether they think the health condition has
consequences, whether there is a course of action for the illness and whether the benefits of
taking the action outweigh the costs.18 There are six main concepts to the model which are
perceived susceptibility, perceived severity, perceived benefits, perceived barriers, cues to action
and self-efficacy.18
In a study done by Kamran et al. (2014) to determine whether the health behaviour model was
effective in helping patients adherence to hypertension medication, it was found that adhering to
medication was low because patients perceived susceptibility, perceived severity and perceived
benefits were inadequate and they had poor lifestyle factors.18 Therefore it was concluded that
patients perceptions of medications needed to be improve and that proper education was
important.18 The results of the study indicated that based on the health behaviour model when
pieces of the model are missing, the model isn’t effective in changing the persons behaviour.
Therefore an effective approach for behaviour change that takes into account the social and
behavioural factors of the patient need to be determined for effective behaviour modification to

86
take place. The main objective of this study was to examine the individual level predictors such
as having chronic conditions has an effect on medication use as well as whether types of CAMs
and auxiliary treatments were associated with medication use in people who have MS.
5.2 Methods
5.2.1 Data Source
The Survey on Living with Neurological Conditions (SLNCC) was used to perform the analysis.
The SLNCC was linked to the Canadian Community Health Survey (CCHS).19 The SLNCC is a
cross sectional survey that collected information on Canadian’s experiences with chronic
neurological conditions. This survey is a cross-sectional survey of a set of 18 neurological
conditions. The sample for the SLNCC survey was drawn from the CCHS respondents and
household members who were aged 15 years of age and older.19 These respondents had to have
at least one of the following 18 neurological conditions listed. 19 Only individuals who had MS
were included in the study (N=267). As recommended by Statistics Canada, in order to take into
account the survey design, replicate sampling weights and bootstrapped variance estimation were
used in the analysis.19 A set of (n=500) replicate weights were used in order to account for non-
responses. For the SLNCC linked data set, the bootstrap replicates are the sub samples that were
drawn and used to estimate the variance of the CCHS estimates.20
5.2.2 Variables assessed
Demographic factors such as age, sex, income and education were assessed. Age was categorized
as 22 to 30 years, 31-40, 41-50 and greater than 51 years. Income was categorized as 5,000-
39,999, 40,000-59, 9999, 60,000-89, 9999 and 90,000 and greater. Education was categorized as
less than secondary school, secondary school or grater and some post-secondary school or
greater. The type of treatment were assessed in the model were complementary/alternative
medical treatments, rehabilitation therapy and counselling/psychotherapy. Mood disorder was

87
examined as the psychological factor in the model. Individuals were asked whether they had
mood disorder or anxiety disorder for which there were 2 responses either yes or no.
Other chronic conditions that were tested for were back problems, arthritis, heart disease and
blood pressure and the responses were either “yes” or “no”. The age of first diagnosis of MS was
also used in the screening process and was categorized as 31 to 40, 41 to 50 and greater than 51
years of age. The outcome variable was whether or not the individual with MS had taken
medication to treat their MS with a binary response of “1= yes” and “0=no”.
5.3 Analysis
A logistic regression model analysis was carried out for this study in order to determine whether
each of the predictors were associated with medication use. These predictors were selected based
on previous theories on this topic. Figure 5-1 shows the hypothetical model for the analysis.
Unadjusted and adjusted odds ratios with 95% CIs with p-values were computed. Univariate
analysis was conducted using a (p <0.20). Manual backward selection was used to build the
multivariable model based on (p<0.05). A complete case analysis was conducted in which only
variables with complete values were used in the model and missing values were removed.
Cofounders were tested in the final model and were retained if the addition of that variable
changed the coefficients of the other variables by more than 20%. All possible interactions were
assessed and added to the model if they were significant at (p<0.05). The effectiveness of the
final model was assessed using receiver-operating characteristics (ROC). The analysis was
performed using STAT IC 15.
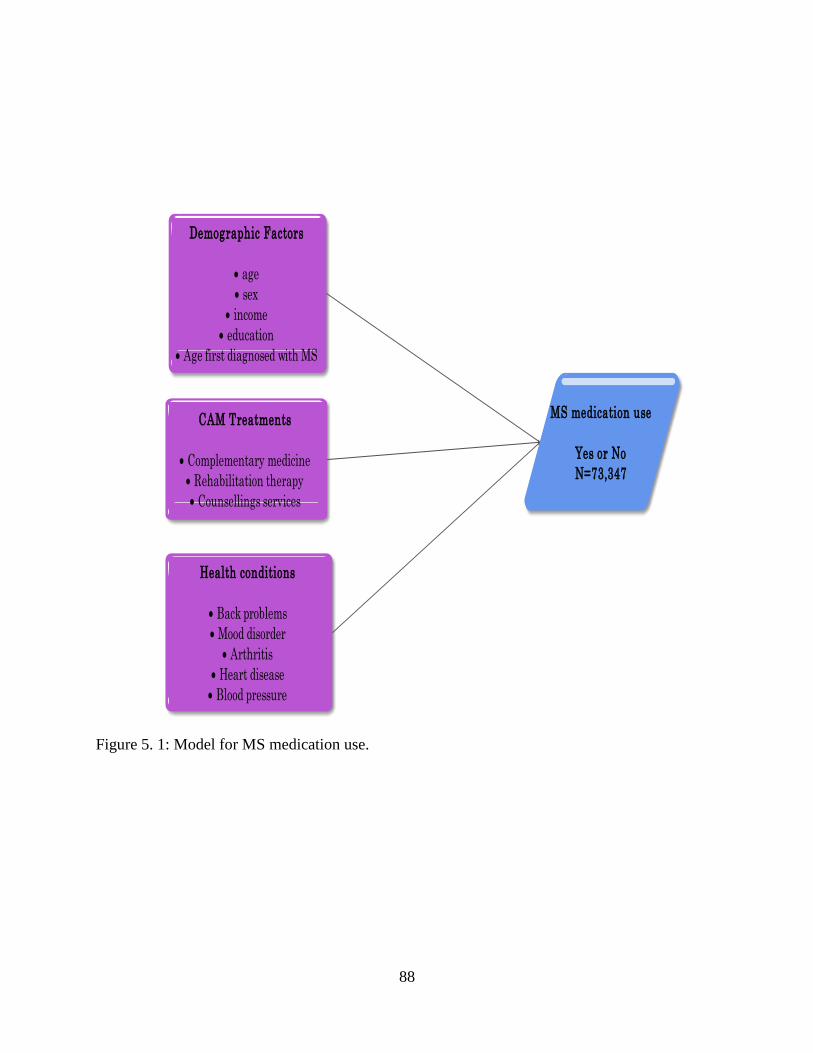
88
Figure 5. 1: Model for MS medication use.
Demographic Factors
age
sex
income
education
Age first diagnosed with MS
CAM Treatments
Complementary medicine
Rehabilitation therapy
Counsellings services
Health conditions
Back problems
Mood disorder
Arthritis
Heart disease
Blood pressure
MS medication use
Yes or No
N=73,347

89
5.4 Results
There were 306 individuals diagnosed with MS in the Survey of Living with Neurological
Conditions in Canada (SLNCC) 2011 and of those 267 were included in the analysis. The final
sample consisted of 73,347 weighted observations. There were 49,770 individuals who used
medication to treat MS and 23,577 individuals who didn’t use medication. Based on the
weighted percentage, 50% of individuals with MS were those who were 51 years of age and
older, 33% were those who were 41-50 years of age, 12% were those 31-40 years of age and 5%
were 22-30 years of age. 75% of individuals with MS were females while 25% were males.
Figure 5-2 shows the age categories. Figure 5.2 shows the age categories. Based on Figure 5.3
the majority of respondents were in the lower income bracket of 5,000 to 39,999. In terms of
education, the majority of respondents had some postsecondary education or more, however
education was not significant not having an impact on whether a person used medication for MS
(Figure 5.4). In the final model age and sex were controlled for. Although
counselling/psychotherapy services and rehabilitation were not significant in the univariate
analysis, they were tested for in the final multivariate analysis based on (p<0.05).

90
Figure 5. 2: Number of people living with MS based on age categories.
Figure 5. 3: Percentage of people living with MS based on income categories.

91
Figure 5. 4: Education level of respondents with MS.
Based on the univariate analysis (see table 5.1), individuals who had an income of 60,000 to
89,999 were more likely to take medications as opposed to those who had an income of 5,000 to
39,999 OR=5.63 95%CI (1.50-21.2). Individuals who had back problems as a co-morbid
conditions with MS were less likely to take medication as opposed to those without back
problems OR=0.38 95% CI (0.15-0.98). Individuals who had a mood disorder were more likely
to take medication for MS as opposed to those who didn’t have a mood disorder OR=5.39
95%CI (1.60-18.17).

92
Table 5.1: Univariate analysis for predictors associated with medication usage.
Variables Odds Ratio P-value 95% CI N percentage
Age
0.80
22-30 ref 3540 5
31-40 2.96 0.41 0.23-38.7 9018 12
41-50 3.21 0.33 0.31-33.1 24455 33
greater 51 2.65 0.36 0.33-21.5 36335 50
Sex
0.20
Female 1.97 0.20 0.693-5.61 55361 75
Male ref
17986 25
Income
0.07*
5,000 to 39,999 ref
30133 41
40,000-59,999 1.17 0.76 0.43-3.23 12658 17
60,000-89,999 5.63 0.01 1.50-21.2 13302 18
90,000 or greater 1.90 0.33 0.52-6.99 17255 24
Education
0.95
Less than secondary school ref
7269 10
Secondary school graduate 0.81 0.79 0.163-4.01 14134 19
Some post-secondary education or greater 0.81 0.75 0.214-3.03 51944 71
Back problems
0.04*
Yes 0.38 0.05 0.146-0.98 16905 23
No ref 56442 77

93
Variables Odds Ratio P-value 95% CI N percentage
Mood disorder
0.01*
yes 5.39 0.01 1.60-18.17 12155 17
no ref 61192 83
Arthritis
0.23
Yes 0.52 0.23 0.17-1.51 15286 21
No ref 58062 79
Heart disease 0.91
Yes 1.09 0.91 0.25-4.70 3226 4
No ref 70122 96
Blood pressure
0.94
Yes 0.97 0.94 0.42-2.24 14888 20
No ref
58460 80
Complementary medicine
0.08*
Yes 0.40 0.08 0.15-1.12 15405 21
No ref 57942 79
Counselling services
0.20
Yes 2.74 0.20 0.58-12.9 15966 22
No ref
57381 78

94
Variables Odds Ratio P-value 95% CI N percentage
Rehabilitation therapy 0.25
Yes 1.86 0.25 0.65-5.34 28013 38
No ref 45335 62
Age first diagnosed with MS
0.23
<31 ref 21839 30
31 to 40 1.70 0.37 0.53-5.40 26811 37
41 to 50 2.02 0.28 0.56-7.28 16497 22
Greater than 51 0.58 0.35 0.18-1.84 8201 11
* shows significance at p-value of <0.20
Numbers were rounded either up or down due to weights and bootstrapping procedures.

95
Based on the multivariate analysis and cross comparison chart (see table 5-2 and 5-3) individuals
who did not take complementary medicine treatment were more likely to take MS medication as
opposed to those who used complementary/alternative medicine treatment OR=5.44 95% CI
(1.37 -9.29). Individuals with a mood disorder were more likely to take MS medication as
opposed to those who did not have a mood disorder OR=5.5 95% CI (1.18-25.7). Individuals
with MS who had back problems were less likely to take MS medication than those who did not
have back problems OR=0.32 95%CI (0.11-0.95). Interactions were not found to be significant
and were not included in the final model. In the model diagnostics, the ROC curve showed that
the logistic regression model correctly classified 75% of people who used MS medication
indicating that the multivariate model was a good one. The goodness of fit statistics which shows
whether the observed and expected observations for the final model are good fit gave a value of
0.23 indicating good model fit.

96
Table 5. 2: Multivariate analysis of predictors associated with medication usage.
Variables Odds Ratio 95 % CI P-value
Age 0.745
22-30 ref
31-40 0.95 0.06-15.26 0.97
41-50 2.22 0.21-23.29 0.51
Greater than 51 2.15 0.25-18.28 0.45
Sex 0.098
Male ref
Female 2.65 0.84 - 8.14 0.96
Income 0.06
Less than 39,999 (<5,000 to 39,999) ref
40,000-59,999 1.32 0.30-5.89 0.71
60,000-89,999 7.72 1.37-43.6 0.02
90,000 or greater 4.03 1.15-14.1 0.03
Health conditions
Back problems, excluding scoliosis, fibromyalgia and arthritis 0.04*
Yes 0.32 0.11-0.95 0.04
No ref
Mood disorder 0.03*
Yes 5.49 1.18-25.7 0.03
No ref
Types of alternative medicine Complementary/alternative medicine 0.016*
Yes 0.18 0.05 - 0.73 0.02
No ref
Rehabilitation therapy 0.099
Yes 3.17 0.80-12.51 0.09
No ref
Counselling or Psychotherapy services 0.42
Yes 2.05 0.35-11.95 0.42
No ref
* shows significance at p-value of <0.05
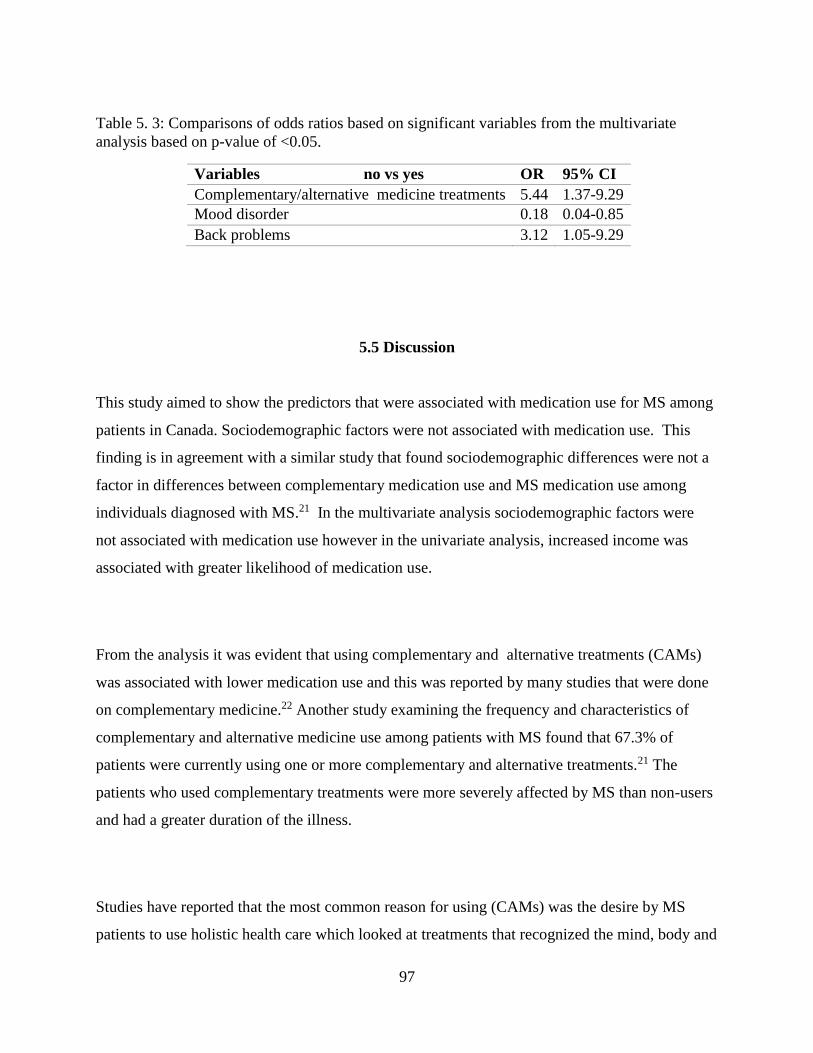
97
Table 5. 3: Comparisons of odds ratios based on significant variables from the multivariate
analysis based on p-value of <0.05.
Variables no vs yes OR 95% CI
Complementary/alternative medicine treatments 5.44 1.37-9.29
Mood disorder 0.18 0.04-0.85
Back problems 3.12 1.05-9.29
5.5 Discussion
This study aimed to show the predictors that were associated with medication use for MS among
patients in Canada. Sociodemographic factors were not associated with medication use. This
finding is in agreement with a similar study that found sociodemographic differences were not a
factor in differences between complementary medication use and MS medication use among
individuals diagnosed with MS.21 In the multivariate analysis sociodemographic factors were
not associated with medication use however in the univariate analysis, increased income was
associated with greater likelihood of medication use.
From the analysis it was evident that using complementary and alternative treatments (CAMs)
was associated with lower medication use and this was reported by many studies that were done
on complementary medicine.22 Another study examining the frequency and characteristics of
complementary and alternative medicine use among patients with MS found that 67.3% of
patients were currently using one or more complementary and alternative treatments.21 The
patients who used complementary treatments were more severely affected by MS than non-users
and had a greater duration of the illness.
Studies have reported that the most common reason for using (CAMs) was the desire by MS
patients to use holistic health care which looked at treatments that recognized the mind, body and
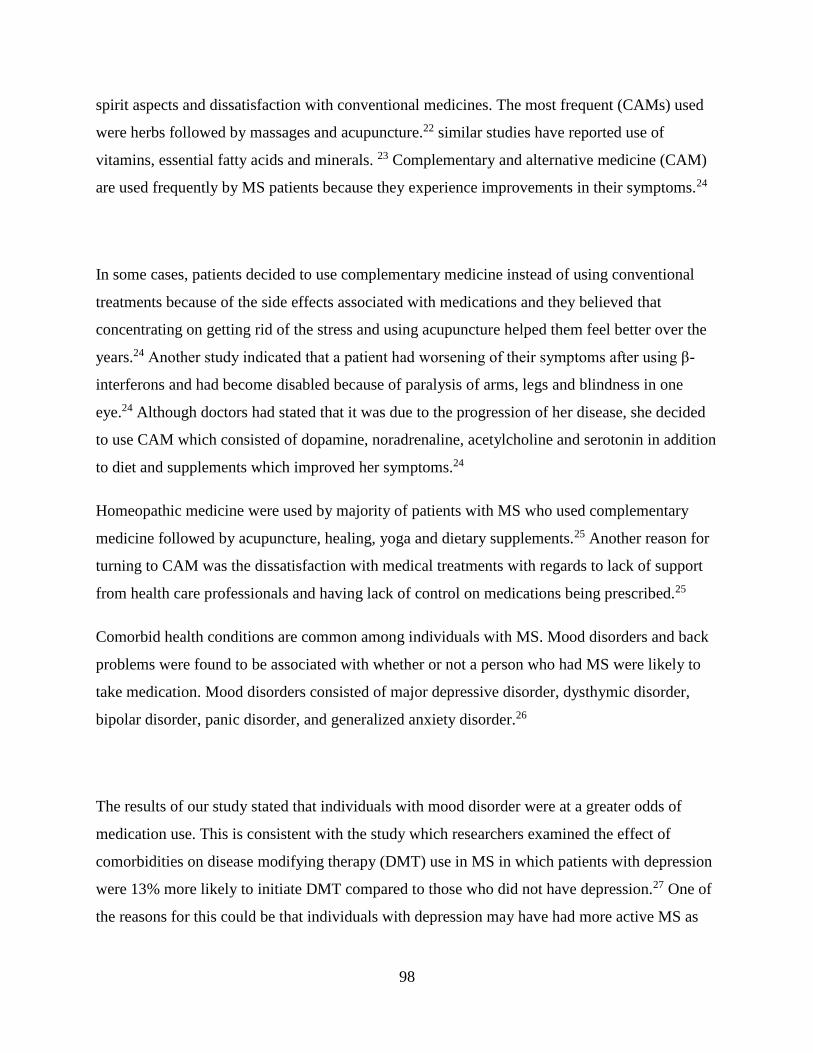
98
spirit aspects and dissatisfaction with conventional medicines. The most frequent (CAMs) used
were herbs followed by massages and acupuncture.22 similar studies have reported use of
vitamins, essential fatty acids and minerals. 23 Complementary and alternative medicine (CAM)
are used frequently by MS patients because they experience improvements in their symptoms.24
In some cases, patients decided to use complementary medicine instead of using conventional
treatments because of the side effects associated with medications and they believed that
concentrating on getting rid of the stress and using acupuncture helped them feel better over the
years.24 Another study indicated that a patient had worsening of their symptoms after using β-
interferons and had become disabled because of paralysis of arms, legs and blindness in one
eye.24 Although doctors had stated that it was due to the progression of her disease, she decided
to use CAM which consisted of dopamine, noradrenaline, acetylcholine and serotonin in addition
to diet and supplements which improved her symptoms.24
Homeopathic medicine were used by majority of patients with MS who used complementary
medicine followed by acupuncture, healing, yoga and dietary supplements.25 Another reason for
turning to CAM was the dissatisfaction with medical treatments with regards to lack of support
from health care professionals and having lack of control on medications being prescribed.25
Comorbid health conditions are common among individuals with MS. Mood disorders and back
problems were found to be associated with whether or not a person who had MS were likely to
take medication. Mood disorders consisted of major depressive disorder, dysthymic disorder,
bipolar disorder, panic disorder, and generalized anxiety disorder.26
The results of our study stated that individuals with mood disorder were at a greater odds of
medication use. This is consistent with the study which researchers examined the effect of
comorbidities on disease modifying therapy (DMT) use in MS in which patients with depression
were 13% more likely to initiate DMT compared to those who did not have depression.27 One of
the reasons for this could be that individuals with depression may have had more active MS as
99
opposed to those did not have depression and this could be a reason for initiating DMT
treatment.28
Depression has also been correlated with fatigue caused by MS.29,30 Fatigue is a problem that has
been overlooked over the years but new studies indicate that 50-90% of patients report fatigue as
one of the symptoms of MS and affects many aspects of the person’s life.31 The lifetime
prevalence of depression in MS patients is 50%.32 Therefore physicians prescribe Modafinil
which is a type of medication that is used to promote wakefulness and reduce fatigue.29 This
could be one of the reasons for the increase use of MS medication use among individuals who
have mood disorder since Modafinil could be one of the prescribed medications along with first
line medications for MS. Patients who have both MS and mood disorder may be more inclined to
take their medication in order to reduce their fatigue which they may believe is the cause of their
mood disorder. Psychiatric onset in MS and whether early signs of psychiatric illness could help
with diagnosing patients as having MS has also been studied. It has been suggested that
psychiatric episodes may occur before MS onset.33 This could be an explanation for why patients
who have mood disorder are more likely to use medications.
Back problems are a common problem in patients with MS due to painful spasms. In order to
reduce painful spasms caused by MS, patients turn to massage therapy or acupuncture. Our study
indicated that those with back problems had a lower adherence to MS medication than those
without back pain. One of the reasons for this is that disease modifying medications for MS
don’t target pain. Therefore patients turn to CAM in order to help relieve the symptoms. In a
study done on why patients use CAM, it was found that CAM helped them relax, reduced tension
and reduced pain in addition to improving overall quality of life.34 Another study indicated that
pain is managed poorly in the treatment course of MS and many patients have turned to opioid
medication, benzodiazepines, massage therapy, marijuana and hypnosis treatments.35

100
One of the problems with adhering to medication is that when many medications are prescribed,
the patient may find it difficult to manage them all. One example of an effective model is the
health behaviour model. However the effectiveness is not based on the model that one chooses,
but is based on tailoring the model to suit the person’s needs based on the type of illness they
have, operationalize the factors such that the factors that motivate the person are identified and
then to use the model based on these changes.17 In a study done by Kaluer et al. (2008) on
compliance, adherence and the treatment of MS, researchers state that a comprehensive model of
treatment adherence should integrate patient, therapist, illness, treatments factors as well as the
external factors from the social environment. Therefore interventions needs to be tailored to the
specific deficits of the patient. The main goal for interventions is to encourage the patient to take
responsibility for their treatment which is self-commitment to change.36 Having good
communication between the patient and health care providers is important for better progress in
treatment.
This study had several strengths. This is the first study that examined the association associated
with medication use and assessed different type of treatments such as CAMs as a risk factor. The
study highlights the problems that many individuals with MS face which is desperation to find a
treatment that works regardless of safety. It provides awareness to primary care providers about
CAM use by patients so that they can direct patients to counselling services that can help patients
cope with MS. The limitation of this study is that it was a cross sectional survey, therefore a
cause and effect relationship cannot be determined. Since the variables for medication and
complementary and alternative medicine did not have specific types of medications used, it was
difficult to state what specifically each respondent used and how it affected their overall health.
The results of this research indicate that individuals who did not use complementary treatment
were more likely to adhere to medication. Having other health conditions such as back problem
and mood disorder were associated with medication use.

101
It is important to create targeted medication education programs for patients in order to help
them understand the advantages and disadvantages of medication use as well as the potential
harms of complementary treatments use alone without medication. Health care professionals
should also look at comorbidities that patients with MS have so that drug interactions don’t take
place with prescribed medication and patients can have tailored treatment for their specific
conditions.

102
5.6 References
1. Leary SM, Porter B, Thompson AJ. Multiple sclerosis: diagnosis and the management of
acute relapses. Postgr Med J. 2005;81(955):302-308. doi:10.1136/pgmj.2004.029413
2. Alonso A, Hernán MA, Herna MA. Temporal trends in the incidence of multiple sclerosis.
Neurology. 2008;71(2):129-135. doi:10.1212/01.wnl.0000316802.35974.34
3. Goldenberg MM. Multiple sclerosis review. Pharm Ther. 2012;37(3):175-184.
4. Torkildsen O, Myhr KM, Bø L. Disease-modifying treatments for multiple sclerosis - a
review of approved medications. Eur J Neurol. 2016;23:18-27. doi:10.1111/ene.12883
5. Kavaliunas A, Manouchehrinia A, Stawiarz L, et al. Importance of early treatment
initiation in the clinical course of multiple sclerosis. Mult Scler J. 2017;23(9):1233-1240.
doi:10.1177/1352458516675039
6. Gajofatto A, Benedetti MD. Treatment strategies for multiple sclerosis: When to start,
when to change, when to stop? World J Clin Cases. 2015;3(7):545.
doi:10.12998/wjcc.v3.i7.545
7. Patti F. Optimizing the benefit of multiple sclerosis therapy: The importance of treatment
adherence. Patient Prefer Adherence. 2010;4:1-9. doi:10.2147/PPA.S8230
8. Freedman MS. Long-term follow-up of clinical trials of multiple sclerosis therapies.
Neurology. 2011;76(1 SUPPL. 1):S26-S34. doi:10.1212/WNL.0b013e318205051d
9. Beer S, Khan F, Kesselring J. Rehabilitation interventions in multiple sclerosis: an
overview. J Neurol. 2012;259(9):1994-2008. doi:10.1007/s00415-012-6577-4
10. Complementary and alternative medicines. National Multiple Sclerosis Society.
http://www.nationalmssociety.org/Treating-MS/Complementary-Alternative-Medicines.
Published 2018. Accessed February 12, 2017.
11. Marrie RA, Horwitz RI. Emerging effects of comorbidities on multiple sclerosis. Lancet

103
Neurol. 2010;9(8):820-828. doi:10.1016/S1474-4422(10)70135-6
12. Valderas JM, Sibbald B, Salisbury C. Defining Comorbidity: Implications for
understanding health and health services. Ann Fam Med. 2009;7(4):357-363.
doi:10.1370/afm.983.Martin
13. Marrie R, Horwitz R, Cutter G, Tyry T, Campagnolo D, Vollmer T. The burden of mental
comorbidity in multiple sclerosis: frequent, underdiagnosed, and undertreated. Mult Scler.
2009;15(3):385-392. doi:10.1177/1352458508099477
14. Feinstein A. An examination of suicidal intent in patients with multiple sclerosis.
Neurology. 2002;59(5):674-678. doi:10.1212/WNL.59.5.674
15. Burns MN, Siddique J, Fokuo JK, Mohr DC. Comorbid anxiety disorders and treatment of
depression in people with multiple sclerosis. Rehabil Psychol. 2010;55(3):255-262.
doi:10.1037/a0020492
16. Muñoz San José A, Oreja-Guevara C, Cebolla Lorenzo S, Carrillo Notario L, Rodríguez
Vega B, Bayón Pérez C. Psychotherapeutic and psychosocial interventions for managing
stress in multiple sclerosis: The contribution of mindfulness-based interventions. Neurol
(English Ed. 2016;31(2):113-120. doi:10.1016/j.nrleng.2015.07.003
17. Amico KR, Mugavero M, Krousel-Wood MA, Bosworth HB, Merlin JS. Advantages to
Using Social-Behavioral Models of Medication Adherence in Research and Practice. J
Gen Intern Med. 2018;33(2):207-215. doi:10.1007/s11606-017-4197-5
18. Kamran A, Ahari SS, Biria M, Malpour A, Heydari H. Determinants of patient ’s
adherence to hypertension medications : Application of health belief model among rural
patients. Ann Med Health Sci Res. 2014;4(6):922-927.
19. Survey on living with neurological conditions in Canada (SLNCC)-2011. Statistics
Canada.
http://www23.statcan.gc.ca/imdb/p2SV.pl?Function=getSurvey&SDDS=5182&Item_Id=
845. Published 2011. Accessed January 13, 2017.
20. Surveys and statistical programs: Survey on living with neurological conditions in canada
(SLNCC). STATISTICAL METHODS IN MEDICAL RESEARCH.

104
http://www23.statcan.gc.ca/imdb/p2SV.pl?Function=getSurvey&SDDS=5182&Item_Id=
845. Published 2011. Accessed January 13, 2019.
21. Apel A, Greim B, König N, Zettl UK. Frequency of current utilisation of complementary
and alternative medicine by patients with multiple sclerosis. J Neurol. 2006;253(10):1331-
1336. doi:10.1007/s00415-006-0217-9
22. Nayak S, Matheis RJ, Schoenberger NE. Use of unconventional therapies by individuals
with multiple sclerosis. Clin Rehabil. 2003;17(2):181-191.
23. Leong EM, Semple SJ, Angley M, Siebert W, Petkov J, Mckinnon RA. Complementary
and alternative medicines and dietary interventions in multiple sclerosis : What is being
used in South Australia and why? Complement Ther Med. 2009;17(4):216-223.
doi:10.1016/j.ctim.2009.03.001
24. Salamonsen A, Launsø L, Kruse TE, Eriksen SH. Understanding unexpected courses of
multiple sclerosis among patients using complementary and alternative medicine: A travel
from recipient to explorer. Int J Qual Stud Health Well-being. 2010;5(2):1-19.
doi:10.3402/qhw.v5i2.5032
25. Hussain-Gambles M, Tovey P. The experience of complementary alternative medicine use
among people with multiple sclerosis. Complement Health Pract Rev. 2004;9(1):21-30.
doi:10.1177/1076167503252948
26. Minden SL. Mood disorders in multiple sclerosis : diagnosis and treatment. J Neurovirol.
2000;6(2):160-167.
27. Zhang T, MD P, Tremlett H, et al. Examining the effects of comorbidities on disease-
modifying therapy use in multiple sclerosis. Neurology. 2016;86(14):1287-1295.
28. Zabad, R.K., Patten, S.B. Metz L. The association of depression with disease course in
multiple sclerosis. Neurology. 2005;64(2):359-360.
29. Zifko UA, Rupp M, Schwarz S, Zipko HT, Maida EM. Modafinil in treatment of fatigue
in multiple sclerosis: Results of an open-label study. J Neurol. 2002;249(8):983-987.
doi:10.1007/s00415-002-0765-6

105
30. Bakshi R. Fatigue associated with multiple sclerosis: diagnosis, impact and management.
Mult Scler. 2003;9(3):219-227. doi:10.1191/1352458503ms904oa
31. Pittion-Vouyovitch S, Debouverie M, Guillemin F, Vandenberghe N, Anxionnat R,
Vespignani H. Fatigue in multiple sclerosis is related to disability, depression and quality
of life. J Neurol Sci. 2006;243(1-2):39-45. doi:10.1016/j.jns.2005.11.025
32. Siegert RJ, Abernethy DA. Depression in multiple sclerosis : a review. 2005:469-475.
doi:10.1136/jnnp.2004.054635
33. Chalah MA, Ayache SS. Psychiatric event in multiple sclerosis: Could it be the tip of the
iceberg? Rev Bras Psiquiatr. 2017;39(4):365-368. doi:10.1590/1516-4446-2016-2105
34. Esmonde L, Long AF. Complementary therapy use by persons with multiple sclerosis:
Benefits and research priorities. Complement Ther Clin Pract. 2008;14(3):176-184.
doi:10.1016/j.ctcp.2008.03.001
35. Ehde DM, Alschuler KN, Osborne TL, Hanley MA, Jensen MP, Kraft GH. Utilization and
patients’ perceptions of the effectiveness of pain treatments in multiple sclerosis: A cross-
sectional survey. Disabil Health J. 2015;8(3):452-456. doi:10.1016/j.dhjo.2015.03.001
36. Klauer T, Zettl UK. Compliance , adherence, and the treatment of multiple sclerosis. J
Neurol. 2008;255(6):87-92. doi:10.1007/s00415-008-6016-8
106
CHAPTER 6: THE EFFECT OF EXERCISE, YOGA AND PHYSICAL THERAPY ON
THE QUALITY OF LIFE OF PEOPLE WITH MULTIPLE SCLEROSIS: SYSTEMATIC
REVIEW AND META-ANALYSIS.
Article reproduced with permission. Published on-line as: Alphonsus, K. B., Su, Y., & D’Arcy,
C. (2019). The effect of exercise, yoga and physiotherapy on the quality of life of people with
multiple sclerosis: Systematic review and meta-analysis. Complementary Therapies in
Medicine, 43, 188-195.
https://www-sciencedirect-
com.cyber.usask.ca/science/article/pii/S0965229918310021?dgcid=author
I contributed to the entire study design, data collection, quality assessment, data analysis, data
interpretation and manuscript writing. This chapter includes total standard mean difference of
combined intervention scores which were excluded in the published study.
Abstract
Objectives: People living with MS have a poor quality of life (QOL) because of the symptoms
caused by the disease and there are various types of treatments to manage the symptoms aside
from medication.
Methods: A systematic review with meta-analysis was conducted using PubMed Medline and
Scopus from 1990 to 2017. Standard mean differences were computed.
Results: Eighteen studies met the inclusion criteria for this meta-analysis. Aerobic exercise was
effective in improving satisfaction with physical functioning, d=0.35 (95% CI=0.08 to 0.62),
mental functioning d=0.42 (95% CI=0.11 to 0.72), and social functioning d=0.42 (95% CI=0.15
to 0.69). Physiotherapy was also found to be effective for physical functioning d =0.50 (95% CI
0.19 to 0.80), mental functioning d =0.44 (95% CI 0.14 to 0.75) and social functioning d =0.60
(95% CI 0.21 to 0.90).
Conclusion: These findings suggest that aerobic exercise and physiotherapy improves the
satisfaction of MS patients with their physical, mental/emotional and social role functioning
strengthening the need for this kind of complementary treatment to include as normal practice in
the treatment of MS.

107
6.1 Quality of Life and MS
Multiple sclerosis (MS) is a chronic autoimmune disease.1 This disease affects the myelinated
axons in the central nervous system leading to neurological deterioration over time.1 MS is more
common among individuals of Northern European descent.2 It is usually diagnosed between the
ages of 20 to 50 years of age.3 The disease causes a wide variety of symptoms including muscle
weakness, fatigue, ataxia, impaired speech, vision impairment, cognitive dysfunction and
paralysis.4
Individuals with MS have consistently been shown to have lower quality of life (QOL) scores.5
Improving the quality of life of MS patients has been recognized as important in secondary
prevention of MS.6–8 Quality of life (QOL) scales ensure the satisfaction of individuals with their
physical, mental and social wellbeing. Health related QOL is based on the perspectives of the
individual and how they feel in the various areas of their life such as their physical, mental and
social health and is usually measured using a variety of questionnaires.8
Exercise training in general has been recognized as a useful intervention to alleviate some of the
symptoms of MS.9–14 Endurance training, resistance training and combination of both15 are the
main categories of exercise that have been investigated for their effectiveness with respect to MS
in experimental studies. Meta-analysis studies that have investigated the possible association
between exercise and quality of life among individuals with MS have focused on an overall
quality of life score as opposed to investigating the different types of exercise methods and their
impact on the various domains of quality of life.4,16,17
Yoga, a form of flexibility exercise that involves spiritual practice, breathing exercises and
meditation has been used as a therapeutic method. It has been shown to help relieve stress and
anxiety among individuals with neuropsychiatric disorders, however the impact of it among
108
individuals with MS has not been systematically investigated across quality of life domains.18
Esmonde and Long AF (2008) state that yoga is among the six most effective complementary
therapies for managing MS patient’s symptoms. It has its therapeutic effects on QOL by improving
many of MS symptoms, including weakness, fatigue, mental impairments and helps reduce
persistent pain, reduce stress and help in reducing the symptoms of cancer and prevention of
cardiovascular disease19–22 The different types of movements involved in yoga may improve
quality of life by relieving spasticity, cognitive impairment and mental stress as well as increasing
physical and motor functions.23
Physiotherapy interventions includes various types such as education, consultation, therapeutic
exercise, and cardiorespiratory techniques.24 Physiotherapy has been known to help in recovering
from MS such as in balance and gait and for improving walking dysfunction in persons with MS.25
It has also been used to help with urinary incontinence which is a common symptom of people
living with MS.26 However besides helping in balance and gait as well as in urinary incontinence,
not much research has been done on the benefits of physiotherapy on individual domains of quality
of life and whether there are more benefits to the mental and social domains.
Although systematic reviews on interventions to alleviate symptoms of MS has been conducted,
the comparative effectiveness of various types of interventions have not been systematically
assessed nor have studies that have looked at the impact of these intervention on specific
domains of quality of life been systematically investigated. What this review adds new to the
literature in an investigation on the comparative effectiveness of various types of interventions
such as aerobic exercise, anaerobic exercise, mixed exercise, yoga and physiotherapy on the
overall quality of life of individuals diagnosed with MS as well as looking at their specific effect
on MS patients’ physical, mental, and social quality of life domains.
109
6.2 Methods
6.2.1 Data sources and searches
We performed a comprehensive search using the databases PubMed/ Medline and Scopus using
key words” multiple sclerosis" AND "exercise “OR "physical activity" OR "physical therapy
“OR "aerobic" OR "anaerobic" OR "strength" OR "flexibility" OR "yoga" AND "quality of
life" from 1990 to 2017. We started from 1990 in order to get the maximum number of citations
possible for this study. The inclusion criteria were: 1) study must have either a randomized
control design, pre-test post-test design, quasi experimental design or cross over design 2) should
be testing the effectiveness of either exercise, physiotherapy or yoga interventions, and 3) should
have a standard recognized QOL outcome measure including specific measures of the
subdomains physical functioning, mental/emotional functioning and social role functioning
domains.
Three researchers KA, YS and CD were involved with title and abstract screening and
differences were resolved through discussions. Articles that had comparisons between a
complementary therapy and control where the control had an exercise component were included
in the meta-analysis as a separate study. Thus a single study could have 2 types of treatment. We
excluded articles that did not have a measures of quality of life domains or those that did not
have cases and controls. Systematic reviews, literature reviews, meta-analysis and case studies
were also excluded. PRISMA and Meta-analysis of Observations Studies in Epidemiology
(MOOSE) guidelines were adhered to.27,28 The modified Pedro scale was used to assess study
quality.
110
6.2.2 Effect sizes and statistical analysis
Quality of life was categorized into 3 categories: a) physical, b) mental and c) social health.
Articles that did not have these components were not included in the meta-analysis. For each
quality of life category, pooled standard mean differences were calculated as well as mean
differences based on the type of exercise or therapy such as aerobic, anaerobic, flexibility, mix of
aerobic and anaerobic, yoga or physiotherapy. We computed standard mean difference using
Cohen’s d for physical, mental and social health scores for each study.29 The standard mean
difference was calculated based on the mean difference between the treatment and control group
divided by the pooled standard deviation. For randomized controlled trials we used the difference
between the treatment and control group and for pre-test post-test studies we used the post-test as
the intervention and used pre-test as the control.
The aggregated or pooled standard mean difference was computed using a random effects
models where heterogeneity was found and weighted using the sample size for each study.
Heterogeneity was evaluated using the DerSimonian and Laird statistics.30 When
heterogeneity was absent a fixed effect model was used. A standard mean difference (SMD) of
0.20 indicated a small effect, SMD of 0.50 indicated a medium effect and an SMD of 0.80 or
greater indicated a large effect.31
In order to assess publication bias, funnel plots and Forest Plot ’s test were used.32 The
assessment of study quality was conducted using the modified Pedro scale which can be found in
Appendix B. Sensitivity analysis was carried out in order to assess the impact of each study on
the overall estimates. This was done by removing each study one at a time and by recalculating
the standard mean difference. Meta-regression was used to assess heterogeneity and study
quality. All analysis was conducted using STATA IC 13.
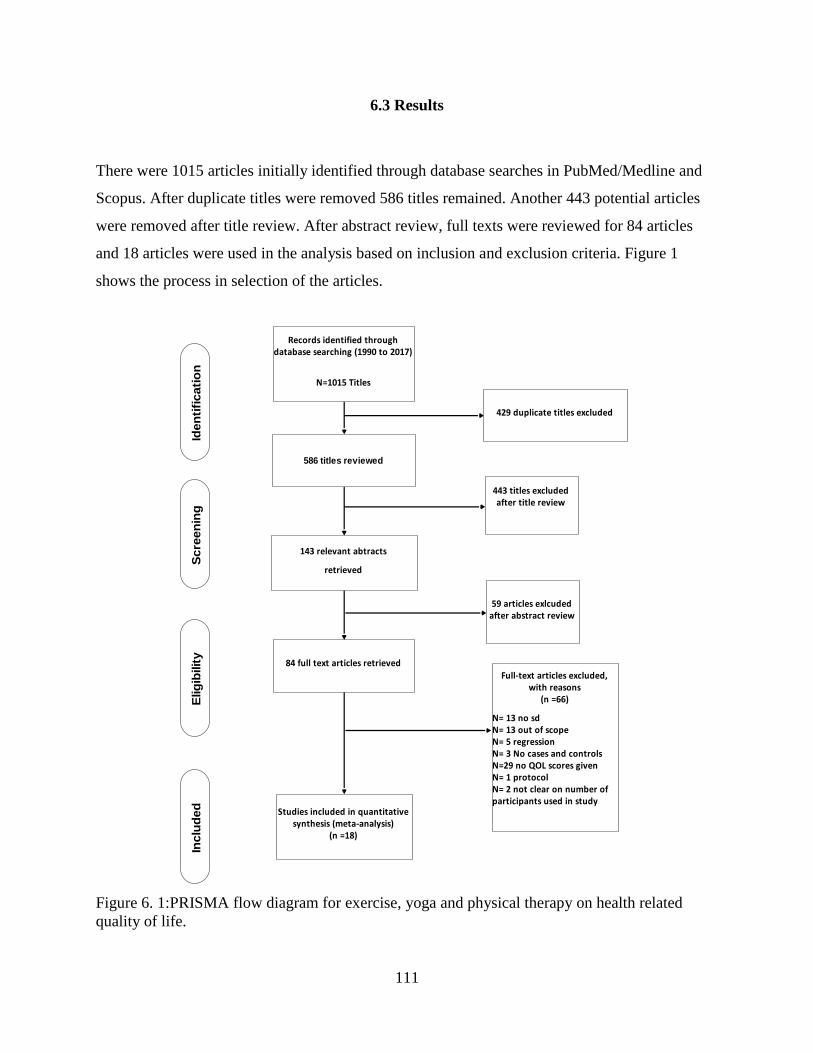
111
6.3 Results
There were 1015 articles initially identified through database searches in PubMed/Medline and
Scopus. After duplicate titles were removed 586 titles remained. Another 443 potential articles
were removed after title review. After abstract review, full texts were reviewed for 84 articles
and 18 articles were used in the analysis based on inclusion and exclusion criteria. Figure 1
shows the process in selection of the articles.
Figure 6. 1:PRISMA flow diagram for exercise, yoga and physical therapy on health related
quality of life.
Records identified through database searching (1990 to 2017)
N=1015 Titles
586 titles reviewed
84 full text articles retrieved
143 relevant abtracts
retrieved
443 titles excluded after title review
59 articles exlcuded after abstract review
Full-text articles excluded, with reasons
(n =66)
N= 13 no sd N= 13 out of scopeN= 5 regression N= 3 No cases and controlsN=29 no QOL scores givenN= 1 protocolN= 2 not clear on number of participants used in study
Studies included in quantitative synthesis (meta-analysis)
(n =18)
Iden
tifi
cati
on
Scre
en
ing
Elig
ibilit
yIn
clu
ded
429 duplicate titles excluded
112
Table 6.1 shows the characteristics of the studies that were included in the meta-analysis. There
were 4 different types of quantitative measures of quality of life: Medical Outcomes Survey
Short Form-36, Multiple Sclerosis Quality of Life-54 Questionnaire (MSQOL-54), Multiple
Sclerosis Quality of Life Inventory (MSQLI), Multiple Sclerosis Impact Scale-29 (MSIS-29) and
World Health Organization Quality of Life BREF (WHOQOL-BREF). The majority of studies
included in the analysis were carried out in USA and Australia with the common instrument used
for the analysis being SF-36 and MSQOL-54.
In total there were 828 participants in the study. The majority of study designs used randomized
controlled trials with some being pretest post-test and others being cross over design. Based on
the modified Pedro scale, the majority of the studies ranges from 5 out of 9 to 8 out of 9 on the
scale indicating good study quality. Appendix A shows assessment of studies based on the
modified Pedro scale.

113
Table 6.1: Description of studies that were included in the meta-analysis.
Author, Study
year
Country N Study
design
Instrument
Used
Participants and
age
Type of
MS
Main findings
1 Ahmadi et al.
2010
Iran 10 RCT Multiple
Sclerosis
Quality of
Life–54
questionnaire
(MSQOL-54)
Women with a
mean age of
36.75 years
Participant
s with MS
Significant
improvements
shown on the
physical function
and physical health
MSQOL-54 scores.
Treadmill training
improved balance
and walking
capacity, fatigue and
quality of life
(QOL) in people
with mild to
moderate MS.
2 Cakit et al.
2010
Turkey 23 RCT Medical
Outcomes
Survey Short
Form-36 (SF-
36)
Men and women
between age of 25
and 62 years of
age.
Participant
s with MS
Significant
improvements
shown on the
physical function
and role physical
functioning on the
SF-36 scale. Cakit et al.
2010
Turkey 19 RCT Medical
Outcomes
Survey Short
Form-36 (SF-
36)
Men and women
between age of 25
and 62 years of
age.
Participant
s with MS
Significant
improvements
shown on the
physical function
SF-36 scale.
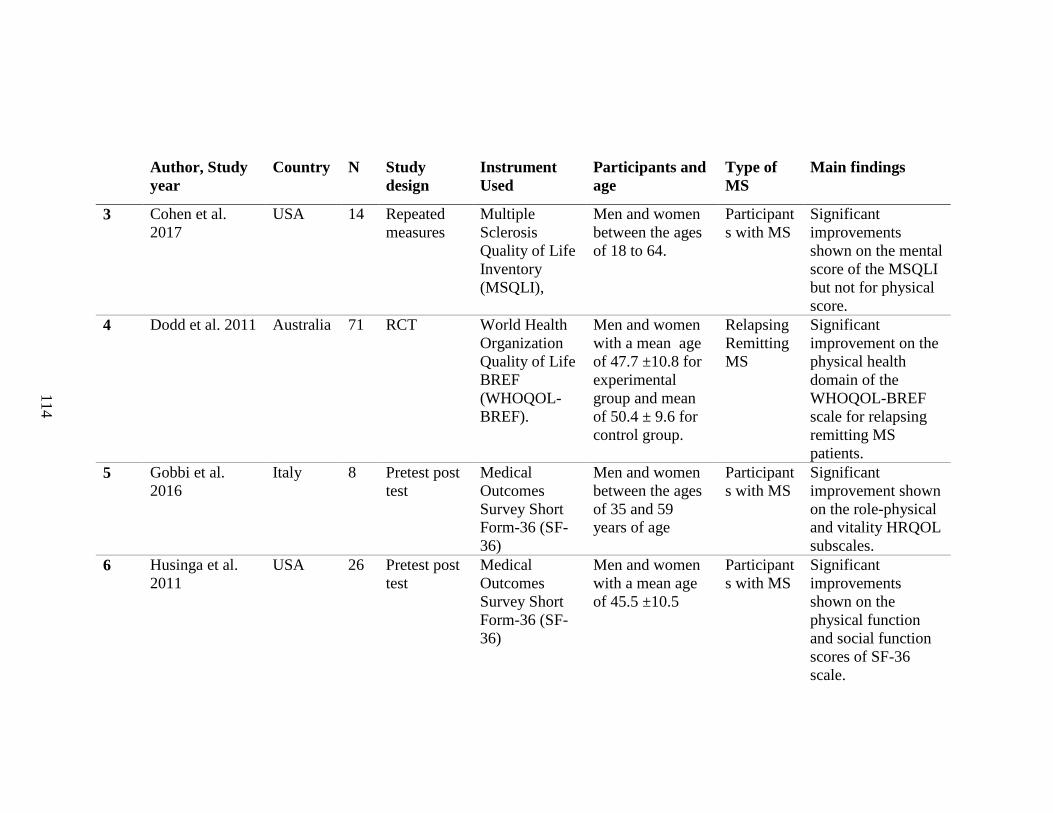
114
Author, Study
year
Country N Study
design
Instrument
Used
Participants and
age
Type of
MS
Main findings
3 Cohen et al.
2017
USA 14 Repeated
measures
Multiple
Sclerosis
Quality of Life
Inventory
(MSQLI),
Men and women
between the ages
of 18 to 64.
Participant
s with MS
Significant
improvements
shown on the mental
score of the MSQLI
but not for physical
score.
4 Dodd et al. 2011 Australia 71 RCT World Health
Organization
Quality of Life
BREF
(WHOQOL-
BREF).
Men and women
with a mean age
of 47.7 ±10.8 for
experimental
group and mean
of 50.4 ± 9.6 for
control group.
Relapsing
Remitting
MS
Significant
improvement on the
physical health
domain of the
WHOQOL-BREF
scale for relapsing
remitting MS
patients.
5 Gobbi et al.
2016
Italy 8 Pretest post
test
Medical
Outcomes
Survey Short
Form-36 (SF-
36)
Men and women
between the ages
of 35 and 59
years of age
Participant
s with MS
Significant
improvement shown
on the role-physical
and vitality HRQOL
subscales.
6 Husinga et al.
2011
USA 26 Pretest post
test
Medical
Outcomes
Survey Short
Form-36 (SF-
36)
Men and women
with a mean age
of 45.5 ±10.5
Participant
s with MS
Significant
improvements
shown on the
physical function
and social function
scores of SF-36
scale.
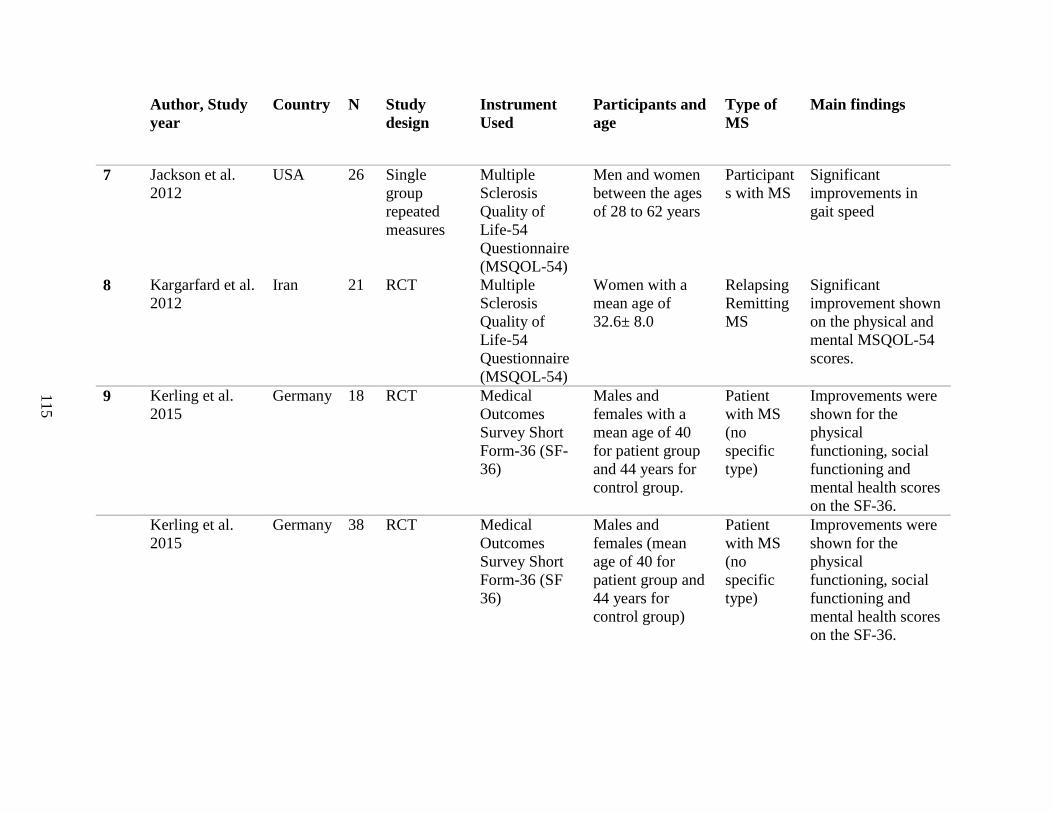
115
Author, Study
year
Country N Study
design
Instrument
Used
Participants and
age
Type of
MS
Main findings
7 Jackson et al.
2012
USA 26 Single
group
repeated
measures
Multiple
Sclerosis
Quality of
Life-54
Questionnaire
(MSQOL-54)
Men and women
between the ages
of 28 to 62 years
Participant
s with MS
Significant
improvements in
gait speed
8 Kargarfard et al.
2012
Iran 21 RCT Multiple
Sclerosis
Quality of
Life-54
Questionnaire
(MSQOL-54)
Women with a
mean age of
32.6± 8.0
Relapsing
Remitting
MS
Significant
improvement shown
on the physical and
mental MSQOL-54
scores.
9 Kerling et al.
2015
Germany 18 RCT Medical
Outcomes
Survey Short
Form-36 (SF-
36)
Males and
females with a
mean age of 40
for patient group
and 44 years for
control group.
Patient
with MS
(no
specific
type)
Improvements were
shown for the
physical
functioning, social
functioning and
mental health scores
on the SF-36. Kerling et al.
2015
Germany 38 RCT Medical
Outcomes
Survey Short
Form-36 (SF
36)
Males and
females (mean
age of 40 for
patient group and
44 years for
control group)
Patient
with MS
(no
specific
type)
Improvements were
shown for the
physical
functioning, social
functioning and
mental health scores
on the SF-36.

116
Author, Study
year
Country N Study
design
Instrument
Used
Participants and
age
Type of
MS
Main findings
10 Mutluay et al.
2008
Turkey 43 RCT Multiple
Sclerosis
Quality of
Life-54
Questionnaire
(MSQOL-54)
Men and women
between the age
of 27-55 years
Relapsing
Remitting
MS or
progressiv
e type
Significant
improvements
noticed in the in
physical scores for
MSQOL-54.
11 Oken et al. 2004 USA 42 RCT Medical
Outcomes
Survey Short
Form-36 (SF-
36)
Men and women
with a mean of
49.8 ± 7.4
Participant
s with MS
Improvement in
fatigue was found
after 6 months of
doing yoga.
Oken et al. 2004 USA 35 RCT Medical
Outcomes
Survey Short
Form-36 (SF-
36)
Men and women
with a mean of
48.8 ± 10.4
Participant
s with MS
Improvement in
fatigue was found
after 6 months of
doing aerobic
exercise.
12 Patti et al. 2002 UK 11
1
RCT Medical
Outcomes
Survey Short
Form-36 (SF
36)
Men and women
with mean age of
45.2 ±12.0 for
treatment and
46.1±6.0 for
control
Primary
and
secondary
progressiv
e MS
Significant
improvements on
physical
functioning, and
mental health
functioning scores
of the SF-36.
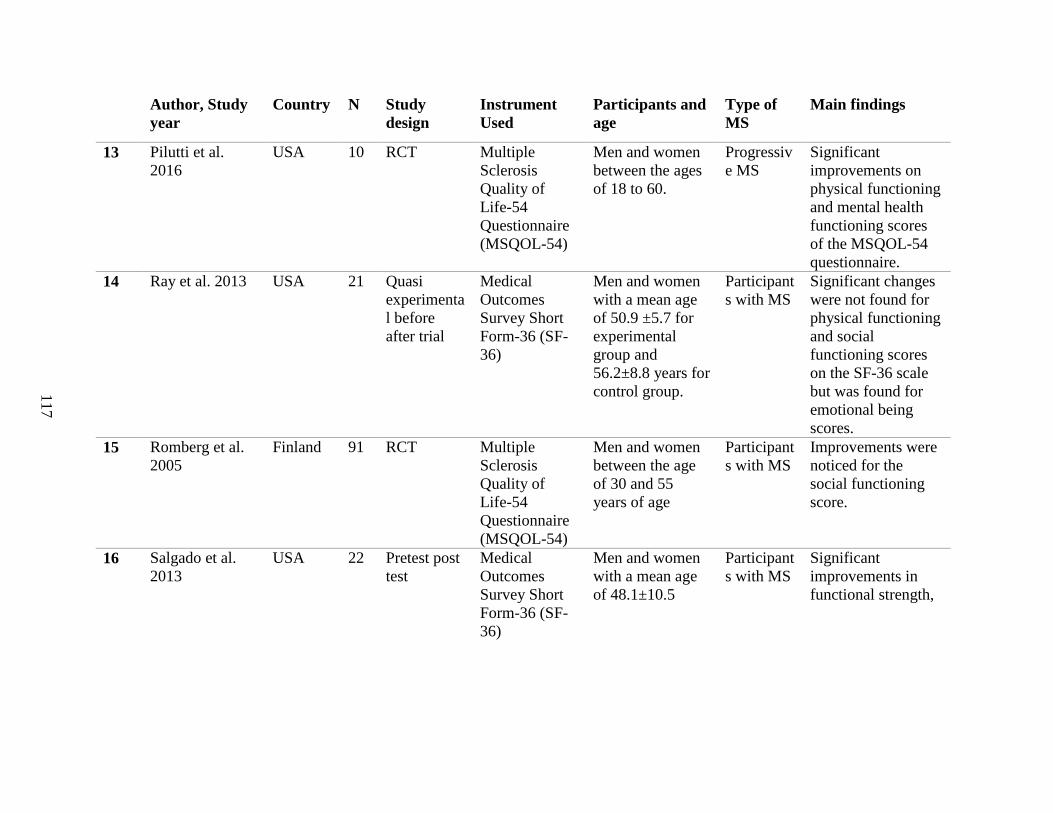
117
Author, Study
year
Country N Study
design
Instrument
Used
Participants and
age
Type of
MS
Main findings
13 Pilutti et al.
2016
USA 10 RCT Multiple
Sclerosis
Quality of
Life-54
Questionnaire
(MSQOL-54)
Men and women
between the ages
of 18 to 60.
Progressiv
e MS
Significant
improvements on
physical functioning
and mental health
functioning scores
of the MSQOL-54
questionnaire.
14 Ray et al. 2013 USA 21 Quasi
experimenta
l before
after trial
Medical
Outcomes
Survey Short
Form-36 (SF-
36)
Men and women
with a mean age
of 50.9 ±5.7 for
experimental
group and
56.2±8.8 years for
control group.
Participant
s with MS
Significant changes
were not found for
physical functioning
and social
functioning scores
on the SF-36 scale
but was found for
emotional being
scores.
15 Romberg et al.
2005
Finland 91 RCT Multiple
Sclerosis
Quality of
Life-54
Questionnaire
(MSQOL-54)
Men and women
between the age
of 30 and 55
years of age
Participant
s with MS
Improvements were
noticed for the
social functioning
score.
16 Salgado et al.
2013
USA 22 Pretest post
test
Medical
Outcomes
Survey Short
Form-36 (SF-
36)
Men and women
with a mean age
of 48.1±10.5
Participant
s with MS
Significant
improvements in
functional strength,
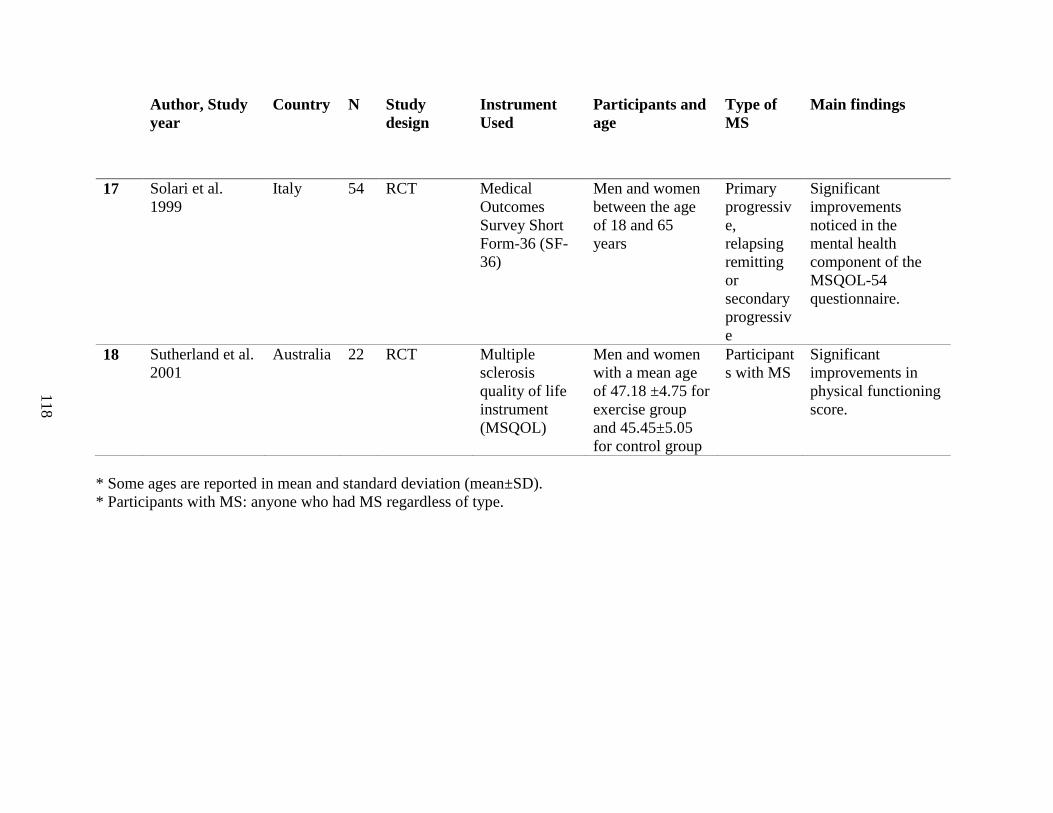
118
Author, Study
year
Country N Study
design
Instrument
Used
Participants and
age
Type of
MS
Main findings
17 Solari et al.
1999
Italy 54 RCT Medical
Outcomes
Survey Short
Form-36 (SF-
36)
Men and women
between the age
of 18 and 65
years
Primary
progressiv
e,
relapsing
remitting
or
secondary
progressiv
e
Significant
improvements
noticed in the
mental health
component of the
MSQOL-54
questionnaire.
18 Sutherland et al.
2001
Australia 22 RCT Multiple
sclerosis
quality of life
instrument
(MSQOL)
Men and women
with a mean age
of 47.18 ±4.75 for
exercise group
and 45.45±5.05
for control group
Participant
s with MS
Significant
improvements in
physical functioning
score.
* Some ages are reported in mean and standard deviation (mean±SD).
* Participants with MS: anyone who had MS regardless of type.

119
6.3.1 The Effect of Aerobic, Anaerobic, Mixed Exercise, Yoga and Physiotherapy on
Physical, Mental and Social Domains of Quality of Life
The pooled analysis of aerobic, anaerobic, mixed exercise, yoga and physiotherapy on the
physical quality of life are shown in Figure 6.2. There were physical (20), mental (16) and
social health (11) articles found and regardless of the type of exercise there was an overall
positive effect of exercise on physical health18,33–51 (d= 0.19, 95% CI=0.06 to 0.32, p=0.004,
=15.2%), mental health18,33–36,39,40,44,47–51 (d= 0.39, 95% CI=0.13 to 0.65, p=0.003, =65.7%)
and social health18,35,36,38,41,44,47,48,50,52 (d= 0.26, 95% CI=0.02 to 0.49, p=0.03, =42.9%). Figure
6.3 shows the forest plot for pooled effects of all complementary therapies on the mental health
quality of life domains. Egger’s test and funnel plot indicated that there was no small study
effect bias for physical, mental health and social health (p=0.18, p=0.06, p=0.99).
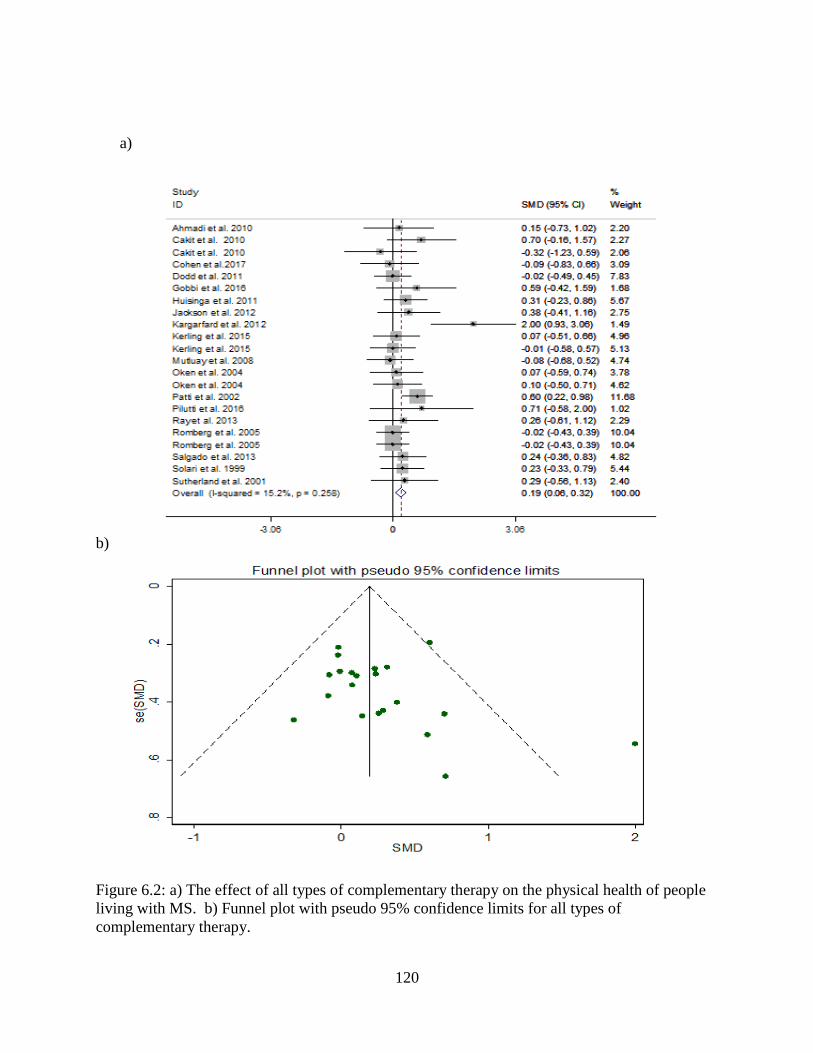
120
a)
b)
Figure 6.2: a) The effect of all types of complementary therapy on the physical health of people
living with MS. b) Funnel plot with pseudo 95% confidence limits for all types of
complementary therapy.

121
a)
b)
Figure 6.3:a) The effect of all types of complementary therapy on the mental health of people
living with MS. b) Funnel plot with pseudo 95% confidence limits for all types of
complementary therapy.
Effect of all types of complementary therapy on the mental quality of life
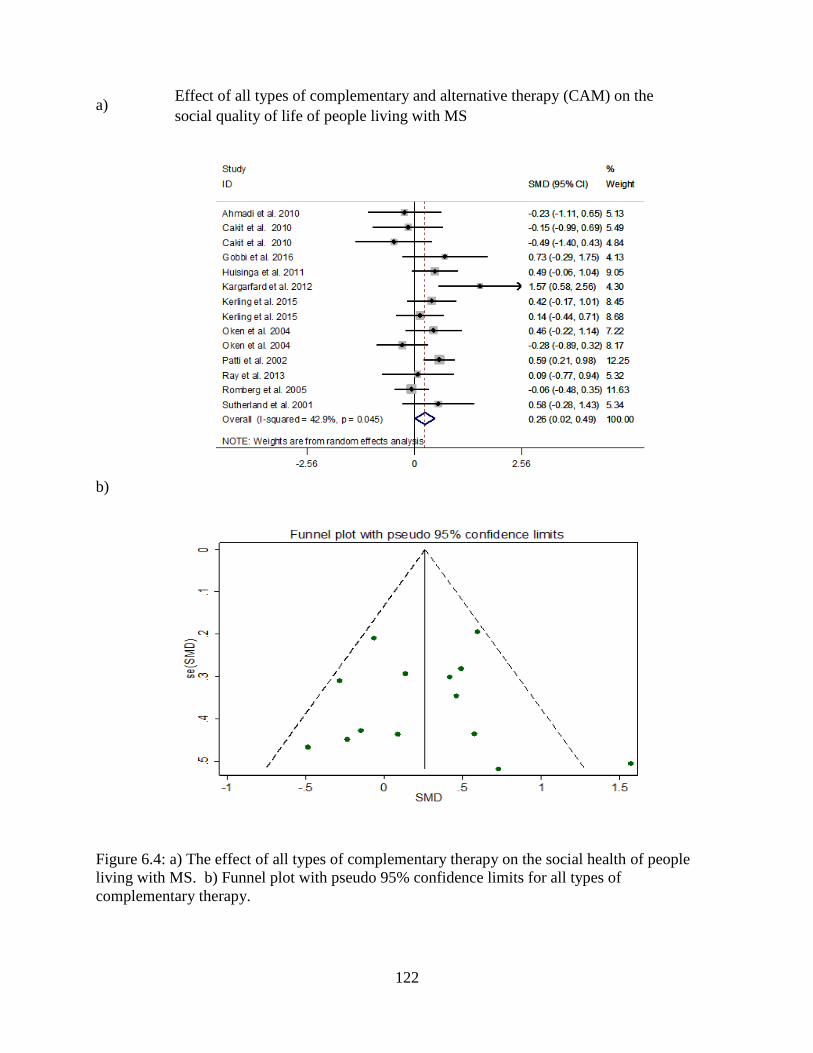
122
a)
b)
Figure 6.4: a) The effect of all types of complementary therapy on the social health of people
living with MS. b) Funnel plot with pseudo 95% confidence limits for all types of
complementary therapy.
Effect of all types of complementary and alternative therapy (CAM) on the
social quality of life of people living with MS
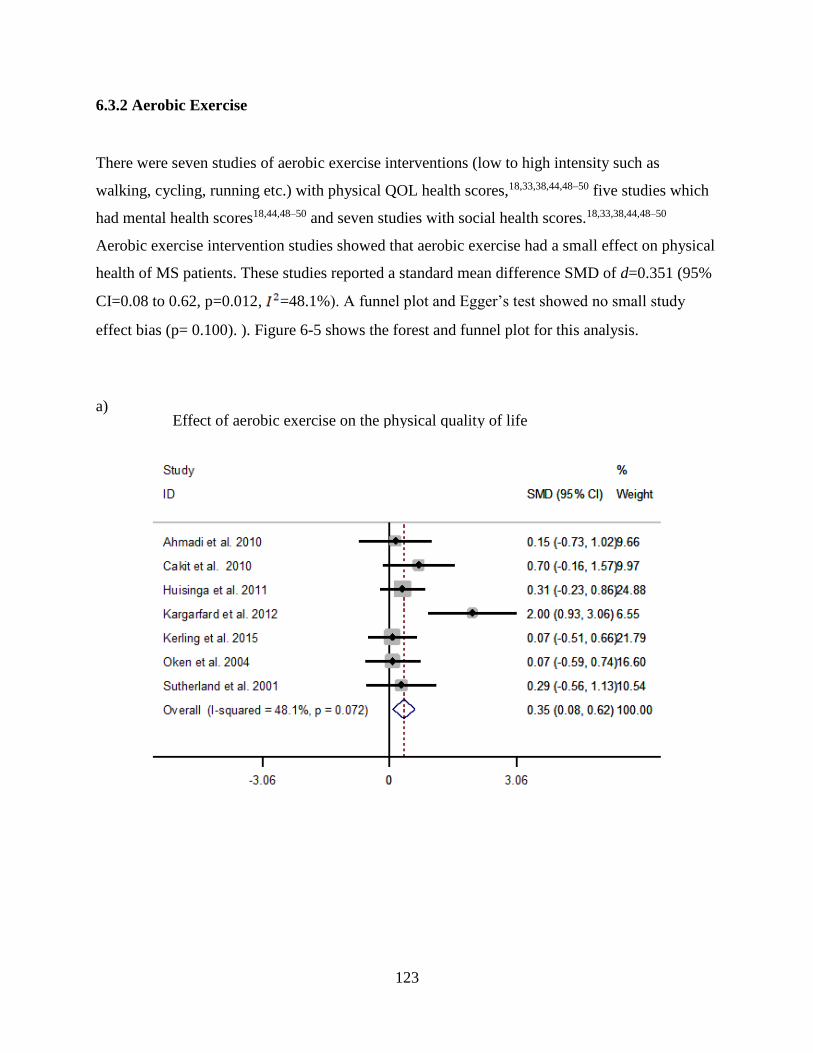
123
6.3.2 Aerobic Exercise
There were seven studies of aerobic exercise interventions (low to high intensity such as
walking, cycling, running etc.) with physical QOL health scores,18,33,38,44,48–50 five studies which
had mental health scores18,44,48–50 and seven studies with social health scores.18,33,38,44,48–50
Aerobic exercise intervention studies showed that aerobic exercise had a small effect on physical
health of MS patients. These studies reported a standard mean difference SMD of d=0.351 (95%
CI=0.08 to 0.62, p=0.012, =48.1%). A funnel plot and Egger’s test showed no small study
effect bias (p= 0.100). ). Figure 6-5 shows the forest and funnel plot for this analysis.
a)
Effect of aerobic exercise on the physical quality of life

124
b)
Figure 6.5: a) The effect of aerobic exercise on the physical health of people living with MS. b)
funnel plot with pseudo 95% confidence limits for aerobic exercise.
A small effect found was found for the impact of aerobic exercise on mental health, d=0.417
(95% CI=0.112 to 0.721, p=0.007, =54.2%). The funnel plot and Egger’s test showed no small
study effect bias (p=0.315).
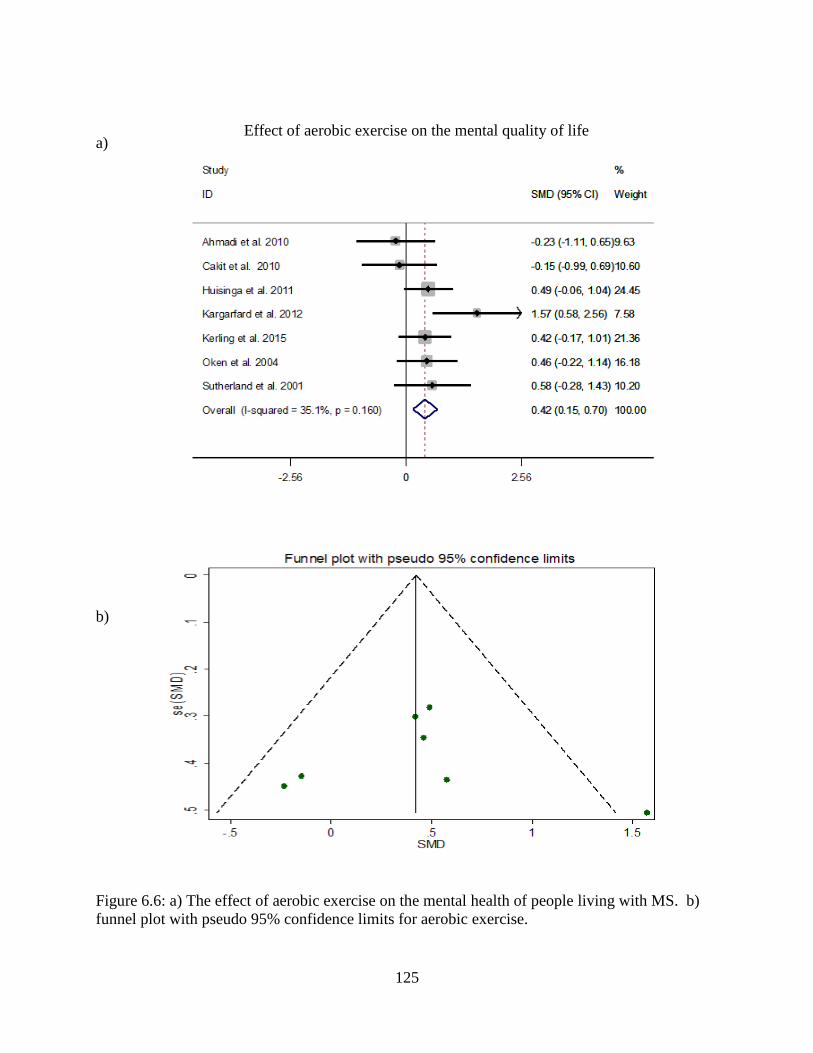
125
a)
b)
Figure 6.6: a) The effect of aerobic exercise on the mental health of people living with MS. b)
funnel plot with pseudo 95% confidence limits for aerobic exercise.
Effect of aerobic exercise on the mental quality of life

126
Aerobic exercise also had a small effect on social health with an SMD of d=0.423 (95% CI=0.15
to 0.69, p=0.002, =35.1%). Again the funnel plot and Egger’s test did not show a small study
effect bias (p=0.851). These combined results clearly show that aerobic exercise has a significant
impact on the physical, mental and social health of MS patients. Figure 7 shows the forest plot
along with the corresponding funnel plots.
a)
b)
Figure 6.7: a) The effect of aerobic exercise on the social health of people living with MS. b)
Funnel plot with pseudo 95% confidence limits for aerobic exercise.
Effect of aerobic exercise on the social quality of life
Effect of physiotherapy on the physical quality of life
127
6.3.3 Anaerobic Exercise
There were four anaerobic exercise studies that had physical health QOL scores 36,41,44,46, two
studies reported mental health scores36,44 and two studies reported social health scores.41,44
Anaerobic exercise in MS patient groups did not have a significant effect on either physical,
mental or social health. The SMD scores were for physical health quality of life was d=-0.02
(95% CI=-0.30 to 0.26 p=0.90, =0%), mental health: d=-0.10 (95% CI=-0.47 to 0.28, p=0.61,
=61.5%) and social health: d=-0.18 (95% CI=-0.81 to 0.45, p=0.573). Funnel plots and
Egger’s did not show any small study effect bias (p=0.94) for the physical QOL studies.
6.3.4 Yoga
Three studies examined the effect of yoga interventions on physical health of MS patients.18,37,45
Yoga did not have a significant effect on physical health d=0.11 (95% CI=-0.26 to 0.48, p=0.57,
=0%). A funnel plot and Egger’s test showed no small study effect bias for yoga on physical
health (p= 0.247). The three studies that assessed the effect of yoga on mental health found no
significant effect d=0.46 (95% CI=-0.24 to 1.17, p=0.19, =70.2%). A funnel plot and Egger’s
test showed no small study effect bias (p=0.398). The one yoga intervention study that reported
social health scores found that there was no effect d=-0.28 (95% CI= -0.89 to 0.32, p=0.36).18
6.3.5 Physiotherapy
Three studies used physiotherapy as an intervention and reported on physical and mental health
outcomes.34,42,43 Physiotherapy did have a significant medium effect on physical health d=0.50
(95% CI=0.19 to 0.80 p=0.001, =0%). An Egger’s test and funnel plot showed no small study
effects bias (p=0.945). Similarly physiotherapy was found to have a significant effect on mental
health outcomes d=0.44 (95% CI=0.14 to 0.75, p=0.004, =0%). Egger’s tests and funnel plot
indicated that there was no small study effect bias for mental health (p=0.174). The one
physiotherapy intervention study that reported social health scores found that physiotherapy had
a medium to large effect d=0.60 (95% CI = 0.21 to 0.9, p=0.002).42 Figures 6-8 and 6-9 shows
the forest and funnel plot for the analysis.
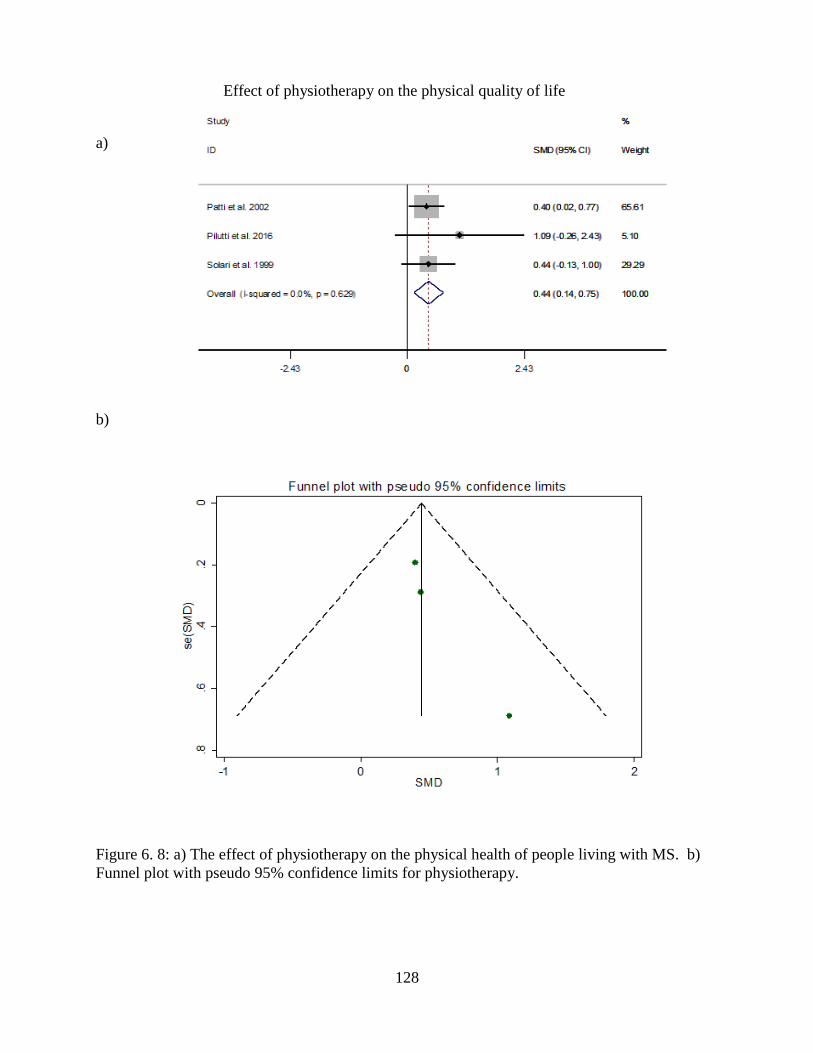
128
a)
b)
Figure 6. 8: a) The effect of physiotherapy on the physical health of people living with MS. b)
Funnel plot with pseudo 95% confidence limits for physiotherapy.
Effect of physiotherapy on the physical quality of life

129
a)
b)
Figure 6. 9:a) The effect of physiotherapy on the mental health of people living with MS. b)
Funnel plot with pseudo 95% confidence limits for physiotherapy.
Effect of physiotherapy on the mental quality of life

130
6.3.6 Combination of exercises
There were five studies of combination of exercise interventions with physical and mental health
QOL scores 36,40,47,50,51 and three studies reporting social health scores.36,47,50 Combination of
exercises has a combination of various types of aerobic, anaerobic and flexibility or strength
training exercises. No significant effect was found for the combination exercises on physical
health QOL; d=0.06 (95% CI=-0.21 to 0.32, p=0.66, =0%), mental health QOL: d=0.59 (95%
CI=-0.15 to 1.33, p=0.12, =83.7), or social health QOL: d=0.07 (95% CI=-0.24 to 0.39,
p=0.65, =4.1%). Funnel plots and Egger’s tests showed no small study effect bias for physical
(p=0.08) and mental scores (p=0.14) but did show for social scores (p=0.01).
Based on the sensitivity analysis, there was no significant change made to the combined results
by any single study indicating that the results were reliable. Meta-regression did not find specific
variables that caused heterogeneity, but there could be other factors associated with the
heterogeneity present in the study such as methodological issues with randomization within
individual studies. However random effect models were used when heterogeneity was present in
our study. The study quality was assessed using the modified Pedro scale (Appendix B). Based
on the scale, the studies ranged from 5 to 9 with the majority of the studies in the 9’s. This
indicated that the majority of studies that were selected were of high quality.
6.3.7 Summary of Results
Table 2 summarizes the impact in terms of effect size of each treatment type on MS patients
QOL domains. For all domains of QOL, aerobic exercise was found to have a small significant
effect. Anaerobic exercise, combinations of exercises and yoga did not have a significant effect
on QOL. Physiotherapy was found to be most effective for the physical, mental and social
domains in comparison to other types of complementary treatments.

131
Table 6. 2:Effect size estimates for interventions based on domains of quality of life.
Domains Type of Intervention No of studies Cohen’s d 95% CI p-value Effect
Physical Aerobic 7 0.35 0.08-0.62
0.01 Small effect
Anaerobic 4 -0.02 -0.30-0.26 0.90
Combined 5 0.06 -0.21-0.32 0.66
Physiotherapy 3 0.50 0.19-0.80 p<0.001 Medium effect
Yoga 3 0.11 -0.26-0.48 0.57
All types of interventions 20 0.19 0.06-0.32 0.004 Small effect
Mental Aerobic 5 0.42 0.11-0.72 0.007 Small effect
Anaerobic 2 -0.10 -0.47-0.28 0.61
Combined 5 0.59 -0.15-1.33 0.12
Physiotherapy 3 0.44 0.14-0.75 0.004 Small effect
Yoga 3 0.46 -0.24-1.17 0.19
All types of interventions 16 0.39 0.13-0.65 0.003 Small effect
Social Aerobic 7 0.42 0.15-0.69 0.002 Small effect
Anaerobic 2 -0.18 -0.81-0.45 0.57
Combined 5 0.07 -0.24-0.39 0.65
Physiotherapy 1 0.60 0.21-0.90 0.002 Medium to large effect
Yoga 1 -0.28 -0.89-0.32 0.36
All types of interventions 11 0.26 0.02-0.49 0.03 Small effect
p<0.05 was used to identify significance

132
6.4 Discussions
This systematic review and meta-analysis extends previous findings by showing aerobic exercise
interventions in MS patients had a small effect size in improving patients physical mental and
social QOL. These results were consistent with a previous systematic review conducted on the
effect of exercise as a treatment for multiple sclerosis that found aerobic exercise helps with
depression.53 In general, studies have shown that aerobic exercise such as jogging, swimming,
cycling, walking reduce anxiety and depression in individuals. It is hypothesized that exercise
stimulates activity in the sympathetic nervous system (SMS) and activates the parasympathetic
nervous system activity (PNS) which causes acetylcholine to be released resulting in a calming
effect.54
Studies have also shown that exercising in general allow for social interactions to take place and
alleviate symptoms of social isolation.54 Our results are consistent with previous reviews where
aerobic exercise have been found to improve physical health since it decreases fatigue and pain
which are two main symptoms of MS.4,42,55 Endurance training was also found to help in
improving aerobic capacity that MS patients lack.56 Recent literature has shown that endurance
training for 3 months improved the quality of life of people living with MS.8
Physiotherapy was also found to be beneficial in improving the physical and mental quality of
life of people living with MS where it was found to have a medium effect on physical quality of
life and small effect on mental health. This was consistent with a randomized controlled trial that
assessed the effect of physiotherapy at home vs an outpatient vs no therapy program. Based on
the study, it was found that physiotherapy improved mobility, subjective wellbeing and mood in
people living with MS.57

133
Smedal et al. (2006) investigated the benefits of physiotherapy for MS found similar results in
that physiotherapy helped to improve balance and gait.58 In a summary of systematic reviews,
incorporating therapeutic exercise into physiotherapy programs was found to be beneficial for
people living with MS as well as other neurological conditions.59 Our pooled analysis of all types
of complementary and alternative treatment (CAM) it was found that there was a small
significant effect on improving the quality of life of people living with MS. Individuals who uses
CAM reported that their overall stress was reduced and found improvements in their overall
wellbeing. One of the main reasons for using CAM was the ineffectiveness of conventional
medical treatments in not providing symptom relief and worsening of symptoms.60 In addition to
this, the longer people use CAMs the less satisfied they were of conventional medicine.61
The strength of this systematic review and meta-analysis is that it looks at the effects of a variety
of complementary therapies on specific quality of life domains and provides an estimate of the
impact of those therapies on QOL in terms of effect size. A limitation of the analysis is that some
studies could not be included in the meta-analysis because they either did not report physical,
mental and social quality of life scores or were published in languages other than English. Some
articles did not report mean and standard deviations needed to calculate SMD and where
therefore excluded.
The exclusion criteria also did not allow for the use of other types of quality of life scales such as
fatigue impact scale which may have reduced the number of articles included in the meta-
analysis. There was also some heterogeneity that were found in some of the analysis which
indicated variation in the degree of association between the type of intervention and its effect on
the physical, mental and social health of individuals with MS. When heterogeneity was present a
random effects model was used for the analysis. Publication bias that was present when assessing
the effect of combination of therapies on social health was due to having only three studies in the
analysis with one study being an outlier. Another limitation was some confidence intervals were
wider, but this is due to the small sample sizes in the study.
134
This systematic review indicates that physical activity particularly aerobic exercise and
physiotherapy had the greatest impact on physical, mental and social health as opposed to
anaerobic, combination or yoga. This review provides strong evidence for the inclusion of
aerobic exercise and physiotherapy programs as part of the regular treatment of patients with
multiple sclerosis. Further studies need to be conducted in CAM treatments in terms of amount
of treatment necessary in order for improvements to be noticed in physical, mental and social
aspects of quality of life. The combination of CAM with traditional medications needs to be
explored in order to determine the overall effectiveness of these treatments in relieving
symptoms of MS.

135
6.5 References
1. Goldenberg MM. Multiple sclerosis review. Pharm Ther. 2012;37(3):175-184.
2. Motl RW, McAuley E. Pathways between physical activity and quality of life in adults
with multiple sclerosis. Health Psychol. 2009;28(6):682-689. doi:10.1037/a0015985.
3. National Multiple Sclerosis Society. Multiple Sclerosis Information Sourcebook.
https://secure.nationalmssociety.org/site/SPageServer/?pagename=HOM_LIB_sourcebook
. Published 2006. Accessed July 28, 2018.
4. Latimer-Cheung AE, Pilutti LA, Hicks AL, et al. Effects of exercise training on fitness,
mobility, fatigue, and health-related quality of life among adults with multiple sclerosis: a
systematic review to inform guideline development. Arch Phys Med Rehabil.
2013;94(9):1800-1828.e3. doi:10.1016/j.apmr.2013.04.020.
5. Benedict RHB, Wahlig E, Bakshi R, et al. Predicting quality of life in multiple sclerosis:
accounting for physical disability, fatigue, cognition, mood disorder, personality, and
behavior change. J Neurol Sci. 2005;231:29-34. doi:10.1016/j.jns.2004.12.009.
6. Amato MP, Ponziani G, Rossi F, Liedl CL, Stefanile C, Rossi L. Quality of life in
multiple sclerosis: the impact of depression, fatigue and disability. Mult Scler.
2001;7(5):340-344. doi:10.1191/135245801681138059.
7. Benito-Leon J, Morales JM, Rivera-Navarro J, Mitchell A. A review about the impact of
multiple sclerosis on health-related quality of life. Disabil Rehabil. 2003;25(23):1291-
1303. doi:10.1080/09638280310001608591.
8. Motl RW, Gosney JL. Effect of exercise training on quality of life in multiple sclerosis: a
meta-analysis. Mult Scler. 2008;14(1):129-135. doi:10.1177/1352458507080464.
9. Rietberg MB, Brooks D, Uitdehaag BMJ, Kwakkel G. Exercise therapy for multiple
sclerosis. Cochrane database Syst Rev. 2005;(1):CD003980.
doi:10.1002/14651858.CD003980.pub2.

136
10. Motl RW, Pilutti LA. The benefits of exercise training in multiple sclerosis. Nat Rev
Neurol. 2012;8(9):487-497. doi:10.1038/nrneurol.2012.136.
11. Oertel-Knoechel V, Mehler P, Thiel C, et al. Effects of aerobic exercise on cognitive
performance and individual psychopathology in depressive and schizophrenia patients.
Eur Arch Psychiatry Clin Neurosci. 2014;264(7):589-604. doi:10.1007/s00406-014-0485-
9.
12. Ronai P, LaFontaine T. Multiple Sclerosis and Exercise. Strength Cond J. 2011;33(1):26-
29. doi:10.1519/SSC.0b013e3181fd0b15.
13. Motl RW, Suh Y, Weikert M. Symptom cluster and quality of life in multiple sclerosis. J
Pain Symptom Manage. 2010;39(6):1025-1032. doi:10.1016/j.jpainsymman.2009.11.312.
14. Motl RW, McAuley E. Physical activity and health-related quality of life over time in
adults with multiple sclerosis. Rehabil Psychol. 2014;59(4):415-421.
doi:10.1037/a0037739.
15. Sandoval AEG. Exercise in multiple sclerosis. Phys Med Rehabil Clin N Am.
2013;24(4):605-618. doi:10.1016/j.pmr.2013.06.010.
16. Motl RW, McAuley E, Snook EM, Gliottoni RC. Physical activity and quality of life in
multiple sclerosis: Intermediary roles of disability, fatigue, mood, pain, self-efficacy and
social support. Psychol Heal Med. 2009;14(1):111-124.
doi:10.1080/13548500802241902.
17. Kratz AL, Hirsh AT, Ehde DM, Jensen MP. Acceptance of pain in neurological disorders:
Associations with functioning and psychosocial well-being. Rehabil Psychol.
2013;58(1):1-9. doi:10.1037/a0031727.
18. Oken BS, Kishiyama S, Zajdel D, et al. Randomized controlled trial of yoga and exercise
in multiple sclerosis. Neurology. 2004;62(11):2058-2064.
doi:10.1212/01.WNL.0000129534.88602.5C.
19. Esmonde L, Long AF. Complementary therapy use by persons with multiple sclerosis:
Benefits and research priorities. Complement Ther Clin Pract. 2008;14(3):176-184.
doi:10.1016/j.ctcp.2008.03.001.

137
20. Wren AA, Wright MA, Carson JW, Keefe FJ. Yoga for presistent pain: New findings and
directions for an ancient practice. Pain. 2011;152(3):477-480.
doi:10.1016/j.pain.2010.11.017.Yoga.
21. Cramer H, Lauche R, Haller H, Steckhan N, Michalsen A, Dobos G. Effects of yoga on
cardiovascular disease risk factors: A systematic review and meta-analysis. Int J Cardiol.
2014;173(2):170-183. doi:10.1016/j.ijcard.2014.02.017.
22. LM B. Physical and psychosocial benefits of yoga in cancer patients and survivors, a
systematic review and meta-analysis of randomized controlled trials. BMC Cancer.
2012;12:no pagination. doi:10.1186/1471-2407-12-559.
23. Hasanpour-Dehkordi A. Effects of yoga on physiological indices, anxiety and social
functining in multiple sclerosis: A randomized trial. J Clin Diagnostic Res. 2016;10(6):1-
5. doi:10.7860/JCDR/2016/18204.7916.
24. Canadian Physiotherapy Association. Description of Physiotherapy in Canada. 2012:17.
http://www.physiotherapy.ca/getmedia/e3f53048-d8e0-416b-9c9d-
38277c0e6643/DoPEN(final).pdf.aspx.
25. Feinstein A, Freeman J, Lo AC. Treatment of progressive multiple sclerosis: What works,
what does not, and what is needed. Lancet Neurol. 2015;14(2):194-207.
doi:10.1016/S1474-4422(14)70231-5.
26. Pereira CM de A, Castiglione M, Kasawara KT. Effects of physiotherapy treatment for
urinary incontinence in patient with multiple sclerosis. J Phys Ther Sci. 2017;29(7):1259-
1263. doi:10.1589/jpts.28.1259.
27. Moher D, Liberati A, Tetzlaff J, Altman DG, Grp P. Preferred reporting items for
systematic reviews and meta-analyses: the PRISMA statement. Phys Ther.
2009;89(9):873-880. doi:10.1371/journal.pmed.1000097.
28. Stroup DF. MOOSE statement: meta-analysis of observational studies in epidemiology: a
proposal for reporting. Jama. 2000;283(15):2008. doi:10.1001/jama.283.15.2008.
29. Cohen J. Statistical Power Analysis for the Behavioral Sciences. 2nd ed. NJ; 1988.
https://books.google.ca/books?id=cIJH0lR33bgC&printsec=frontcover&source=gbs_ge_s
138
ummary_r&cad=0#v=onepage&q&f=false. Accessed January 21, 2017.
30. Higgins JPT, Thompson SG, Deeks JJ, Altman DG. Measuring inconsistency in meta-
analyses. BMJ. 2003;327(7414):557-560. doi:10.1136/bmj.327.7414.557.
31. Durlak JA. How to select, calculate, and interpret effect sizes. J Pediatr Psychol.
2009;34(9):917-928.
32. Egger M, Davey Smith G, Schneider M, Minder C. Bias in meta-analysis detected by a
simple, graphical test. Br Med J. 1997;315(7109):629-634.
doi:10.1136/bmj.316.7129.469.
33. Ahmadi A, Arastoo AA, Nikbakht M. The effects of a treadmill training programme on
balance, speed and endurance walking, fatigue and quality of life in people with multiple
sclerosis. Int Sport J. 2010;11(4):389-397.
http://www.scopus.com/inward/record.url?eid=2-s2.0-
78650616276&partnerID=tZOtx3y1.
34. Pilutti LA, Paulseth JE, Dove C, Jiang S, Rathbone MP, Hicks AL. Exercise training in
progressive multiple sclerosis. Int J MS Care. 2016;18:221-229. doi:10.7224/1537-
2073.2015-067.
35. Rafeeyan Z, Azarbarzin M, Moosa FM, Hasanzadeh A. Effect of aquatic exercise on the
multiple sclerosis patients’ quality of life. Iran J Nurs Midwifery Res. 2010;15(1):43-47.
36. Romberg A, Virtanen A, Ruutiainen J. Long-term exercise improves functional
impairment but not quality of life in multiple sclerosis. J Neurol. 2005;252(7):839-845.
doi:10.1007/s00415-005-0759-2.
37. Salgado BC, Jones M, Ilgun S, McCord G, Loper-Powers M, van Houten P. Effects of a 4-
month Ananda Yoga program on physical and mental health outcomes for persons with
multiple sclerosis. Int J Yoga Therap. 2013;(23):27-38.
http://www.scopus.com/inward/record.url?eid=2-s2.0-
84902399739&partnerID=tZOtx3y1.
38. Sutherland G, Andersen MB. Exercise and multiple sclerosis: Physiological,
psychological, and quality of life issues. J Sports Med Phys Fitness. 2001;41(4):421-432.
139
http://www.scopus.com/inward/record.url?eid=2-s2.0-0035208469&partnerID=tZOtx3y1.
39. Zaenker P, Favret F, Lonsdorfer E, Muff G, DE Seze J, Isner-Horobeti M-E. High-
intensity interval training combined with resistance training improves physiological
capacities, strength and quality of life in multiple sclerosis patients: a pilot study. Eur J
Phys Rehabil Med. 2017;(February):58-67. doi:10.23736/S1973-9087.17.04637-8.
40. Jackson K, Edginton-Bigelow K, Cooper C, Merriman H. A group kickboxing program
for balance, mobility, and quality of life in individuals with multiple sclerosis: a pilot
study. J Neurol Phys Ther. 2012;36(3):131-137. doi:10.1097/NPT.0b013e3182621eea.
41. Ray AD, Udhoji S, Mashtare TL, Fisher NM. A combined inspiratory and expiratory
muscle training program improves respiratory muscle strength and fatigue in multiple
sclerosis. Arch Phys Med Rehabil. 2013;94(10):1964-1970.
doi:10.1016/j.apmr.2013.05.005.
42. Patti F, Ciancio MR, Reggio E, et al. The impact of outpatient rehabilitation on quality of
life in multiple sclerosis. J Neurol. 2002;249(8):1027-1033. doi:10.1007/s00415-002-
0778-1.
43. Solari A, Filippini G, Gasco P, et al. Physical rehabilitation has a positive effect on
disability in multiple sclerosis patients. Neurology. 1999;52(1):57-62.
http://www.scopus.com/inward/record.url?eid=2-s2.0-0032899515&partnerID=tZOtx3y1.
44. Çakt BD, Nacir B, Genç H, et al. Cycling progressive resistance training for people with
multiple sclerosis: A randomized controlled study. Am J Phys Med Rehabil.
2010;89(6):446-457. doi:10.1097/PHM.0b013e3181d3e71f.
45. Cohen ET, Kietrys D, Fogerite SG, et al. Feasibility and Impact of an 8-Week Integrative
Yoga Program in People with Moderate Multiple Sclerosis-Related Disability: A Pilot
Study. Int J MS Care. 2017;19(1):30-39. doi:10.7224/1537-2073.2015-046.
46. Dodd KJ, Taylor NF, Shields N, Prasad D, McDonald E, Gillon A. Progressive resistance
training did not improve walking but can improve muscle performance, quality of life and
fatigue in adults with multiple sclerosis: a randomized controlled trial. Mult Scler.
2011;17(11):1362-1374. doi:10.1177/1352458511409084.
140
47. Gobbi E, Carraro A. Effects of a combined aerobic and resistance exercise program in
people with multiple sclerosis: a pilot study. Sport Sci Health. 2016:1-6.
doi:10.1007/s11332-016-0310-0.
48. Huisinga JM, Filipi ML, Stergiou N. Elliptical exercise improves fatigue ratings and
quality of life in patients with multiple sclerosis. J Rehabil Res Dev. 2011;48(7):881.
doi:10.1682/JRRD.2010.08.0152.
49. Kargarfard M, Etemadifar M, Baker P, Mehrabi M, Hayatbakhsh R. Effect of aquatic
exercise training on fatigue and health-related quality of life in patients with multiple
sclerosis. Arch Phys Med Rehabil. 2012;93(10):1701-1708.
doi:10.1016/j.apmr.2012.05.006.
50. Kerling A, Keweloh K, Tegtbur U, et al. Effects of a short physical exercise intervention
on patients with multiple sclerosis (MS). Int J Mol Sci. 2015;16(7):15761-15775.
doi:10.3390/ijms160715761.
51. Mutluay FK, Tekeoǧlu A, Saip S, Altintaş A, Siva A. Group exercise training approach to
multiple sclerosis rehabilitation. Nobel Med. 2008;4(3):20-26.
http://www.scopus.com/inward/record.url?eid=2-s2.0-
58149142510&partnerID=tZOtx3y1.
52. Ahmadi A, Nikbakh M, Arastoo A, Habibi A-H. The Effects of a Yoga Intervention on
Balance, Speed and Endurance of Walking, Fatigue and Quality of Life in People with
Multiple Sclerosis. J Hum Kinet. 2010;23(1):71-78. doi:10.2478/v10078-010-0009-2.
53. Heesen C, Romberg A, Gold S, et al. Physical exercise in multiple sclerosis: Supportive
care or a putative disease-modifying treatment. Expert Rev Neurother. 2006;6(3):347-355.
doi:10.1586/14737175.6.3.347.
54. Callaghan P. Exercise: A neglected intervention in mental health care? J Psychiatr Ment
Health Nurs. 2004;11(4):476-483. doi:10.1111/j.1365-2850.2004.00751.x.
55. Motl RW, Snook EM. Physical activity, self-efficacy, and quality of life in multiple
sclerosis. Ann Behav Med. 2008;35(1):111-115. doi:10.1007/s12160-007-9006-7.
56. Mostert S, Kesselring J. Effects of a short-term exercise training program on aerobic
141
fitness, fatigue, health perception and activity level of subjects with multiple sclerosis.
Mult Scler. 2002;8(2):161-168. doi:10.1191/1352458502ms779oa.
57. Wiles CM, Newcombe RG, Fuller KJ, Shaw S, Pickersgill TP. Controlled randomised
crossover trial of the efects of physiotherapy on mobility in chronic multiple sclerosis. J
Neurol Neurosurg Psychiatry. 2001;70:174-179.
58. Smedal T, Lygren H, Myhr KM, et al. Balance and gait improved in patients with MS
after physiotherapy based on the Bobath concept. Physiother Res Int. 2006;11(2):104-116.
doi:10.1002/pri.
59. Taylor NF, Dodd KJ, Shields N, Bruder A. Therapeutic exercise in physiotherapy practice
is beneficial: A summary of systematic reviews 2002-2005. Aust J Physiother.
2007;53(1):7-16. doi:10.1016/S0004-9514(07)70057-0.
60. Olsen SA. A review of complementary and alternative medicine (CAM) by people with
multiple sclerosis. Occup Ther Int. 2009;16(1):57-70. doi:10.1002/oti.
61. Nayak S, Matheis RJ, Schoenberger NE. Use of unconventional therapies by individuals
with multiple sclerosis. 2003:181-191.

142
CHAPTER 7: CONCLUSIONS
This thesis covers several areas in MS research. The first area examined was to understand the
public awareness of an important risk factor, second hand smoke exposure on MS development.
The second was to understand how social factors play a role in pain experiences in people living
with MS. The third objective was to understand the factors associated with MS medication
adherence. Lastly the thesis identified the various types of complementary treatments such as
types of exercise on various domains of quality of life (physical, mental and social). This
concluding chapter discusses the relevance of the findings.
7.1 Summary of Findings
The thesis explored various areas in MS research from prevention of risk factors such as second
hand smoking to promotion of medication use and intake of aerobic exercise. The chapters each
touch on difference aspects of MS from prevention to promotion. The results presented in this
thesis can help in the development of policies and inform health care professionals about the
problems that many patients with MS face. Chapters 3 assessed awareness of second hand smoke
exposure and it effect on MS while chapters 4, 5 and 6 looked at improving overall quality of
life.
Chapter 3 is the first study that examined the factors associated with Canadian’s public
perceptions of second hand smoke exposure on MS development. The sociodemographic
variables that were investigated were age, sex, marital status and education level. Other variables
include number of people living in the household, whether other members of the household
smoked, whether they were bothered by second hand smoke, smoking status, the number of
143
children in the household under the age of 18, frequency of breathing in second hand smoke and
whether there were smoking restrictions in workplaces, restaurants or shopping malls.
Through multilevel modelling the results of the study showed that the province of residence
impacted the odds of a person agreeing to whether second hand smoke exposure could cause MS.
The methodology used in this study used a multivariate multilevel mixed effects model which
took into account the interaction effects of sex and smoking status and its effect on people’s
perceptions based on the province in which they reside in Canada. The results of this study
indicated that sex, age, education level, having household members smoke in the home and if the
individual was bothered by second hand smoke exposure was associated with increased odds of
people agreeing to second hand smoke exposure being a risk factor for MS development.
Based on the multilevel mixed effects model, the province of residence of the respondent was
also associated with perceptions about second hand smoke exposure on MS development with
Newfoundland having (24%) and Ontario (23%) of people out of 1,639 people agreeing to the
statement. This chapter explored the knowledge gap in MS and second hand smoke exposure and
highlighted the need to strengthen the stop smoking campaign and to introduce messages about
the harmful effects of second hand smoke exposure to the public.
Chapter 4 explored the psychosocial factors associated with pain in people with MS. The Survey
of Living with Neurological Conditions in Canada 2011 was used for this chapter. This chapter
looked at health promotion and prevention. Pain is a problem with many conditions, however in
MS it is one of the primary symptoms that many people face. Many studies explore pain from a
biological standpoint, however the social aspect of pain has not been explored well in MS
research. This chapter focused on social support and its association with pain in people with MS.
The methodology used for the analysis used a logistic regression model to understand whether
social factors were associated with pain among individuals with MS. This chapter drew attention
to a hidden problem that many individuals with MS face which is having lack of support. Based

144
on the results of the study all types of social support are needed in order to reduce pain outcomes
and that lacking in either one of the 4 (someone to take you to the doctor, someone to do
something enjoyable with, someone to confide/talk to and someone to help in an emergency) is
associated with increased probability of pain. Having someone to talk to or do something
enjoyable allows for a sense of belonging which helps in promotion of positive mental health.
Having someone to take you to the doctor if needed or for help in case of emergencies allows the
person to reduce their stress because they know that there will be someone to help them when
there is a medical emergency. When one of these supports are missing, the odds of pain
increases.
The results of this research indicate the importance of affordable access to health care services
for individuals with MS. Not all individuals will have support from caregivers, therefore it is
important to create programs that are affordable for individuals living with disabilities. The role
of self-efficacy is also important since learning to cope with the problem at hand can help reduce
pain and give a positive outlook to life. Therefore having social support is important for
psychological health but at the same time is needed for help in case of emergencies.
Chapter 5 investigated the factors associated with MS medication adherence using the Survey of
Living with Neurological Conditions in Canada (SLNCC) 2010 to 2011 cycle. This is the first
study that used a logistic regression model to understand the factors that promote medication use
and factors that reduce medication use. Medication for MS is beneficial in order to stop relapses
from occurring, however due to side effects of medication many people reduce the frequency of
medication use or stop taking it altogether. Complementary/alternative treatment (CAM) such as
exercise, herbal products, homeopathic medicine, vitamins, acupuncture, massage and meditation
is beneficial when used with disease modifying MS medications, however when taken alone it
can cause many problems to the overall health of the person with MS. This chapter showed the
hidden factors that influence a person’s decision to take MS medications such as comorbid health
conditions and the use of social behavioural models as a tool to help patients adhere to
medications.
145
The analysis in chapter 6 which used systematic review and meta-analysis examined the effect of
various types of interventions such as exercise (aerobic, anaerobic, mixed, yoga) and
physiotherapy on the quality of life (physical, mental, social) of individuals diagnosed with MS.
Overall quality of life was categorized into 3 categories: a) physical, b) mental and c) social
health. Aerobic exercise such as treadmill training, elliptical exercise and aquatic exercise was
beneficial for all domains of health. Physiotherapy was also found to be beneficial in improving
the physical and mental quality of life of people living with MS. This chapter draws attention to
patient’s quality of life and how each domain such as physical, mental and social health can be
improved by doing aerobic exercise. The results of this study will reinforce physicians’
awareness of the benefits of exercise programs and how they could be incorporated into
treatment regimens for patients. In addition to this, physiotherapy was also found to be beneficial
for people living with MS and could also be used as a complementary treatment approach.
However further studies in this area are needed in order to provide stronger evidence for these
interventions.
7.2 Practical Implications
Based on the findings of this research more educational programs on the harmful effects of
second hand smoking for people living with MS need to be created. In addition to this
advertisements about second hand smoke exposure and its effect on MS need to be included on
television or on public transportation services in order to increase public health awareness. The
findings of this research also indicate a need for more affordable home care services for people
living with MS especially for individuals who live in low income neighbourhoods.
Primary care providers need to also direct caregivers and MS patients on nursing or home care
services available in their area. In terms of medication used, low adherence is a problem that
often goes unnoticed by primary care providers. The results of the chapter on medication
146
adherence highlight the desperation that people living with MS face as they turn to CAMs to
reduce their symptoms. It also shows that poor health literacy and lack of knowledge in the area
of MS medications among people living with MS is a problem. In order to increase medication
adherence rates, patient education programs in hospitals need to be created that stress the harms
of using CAMs and the benefits of medications. Primary care providers need to be aware of
behavioural modification models that patients can use and should refer patients to counselling
services that can help them cope with MS. The results of this dissertation also indicate that
aerobic exercise such as walking, cycling, running and physiotherapy are beneficial for physical,
mental and social health and should be incorporated into MS treatment regimens.
7.3 Limitations
The primary limitation of this study was the lack of data that was available on Multiple Sclerosis.
Chapters 3, 4 and 5 relied on cross sectional surveys such as the Health Canada: Smoking Survey
and the Survey on Living with Neurological Conditions in Canada (SLNCC), therefore a cause
and effect relationship could not be stated. Since these surveys are self-reports they are prone to
information bias and recall bias. In addition to this the cross sectional surveys were not repeated
in consecutive years, therefore a cross year comparison could not be performed.
There were limitations in using the Health Canada: Smoking Survey since it only surveyed 5
provinces (Saskatchewan, Ontario, Newfoundland, Quebec and British Columbia) which left out
many people in the population, thus reducing the sample size. There were limitations in the
SLNCC data set with regards to the descriptions of the types of treatments that were used by
people with MS. Types of medications were not mentioned clearly in the data set and specific
complementary treatments were not clearly identified in the Statistics Canada Survey. Therefore
it was difficult to distinguish between specific types of treatments. In addition to this there were
some variables which were missing such as the types of MS that individuals had which could
have given a clearer picture when carrying out the analysis. For the meta-analysis in Chapter 6
147
the limitations of the study was that the long term effects of each type of complementary
treatments could not be determined since the immediate effect after the intervention was not
measured.
7.4 Future Work
Based on the results of this thesis, future studies could look into assessing the level of knowledge
that people have about risk factors for MS. This could help to understand how messages about
risk factors could be spread to the public in order to increase awareness. Chapters 3 and 4 used
the SLNCC data set since there weren’t any surveys that measured information about people
living with MS in Canada. Since this was measured only once, it would be better if surveys were
conducted every 2 years so that researchers could have access to MS data and a longitudinal
study could be conducted. In addition to this surveys need to ask specific questions with regards
to the type of MS the person has and the type of medication they used.
The results of the study in Chapters 4 about lack of social support and having a greater
probability of pain inform caregivers about the amount of support that a person with MS needs.
This research can be built on by further delving into the area of how caregiver support can be
managed stress free and whether programs need to be created in order to better educate
caregivers on ways to help take care of their loved ones with MS.
The results of Chapter 5 talk about using complementary treatment and its effect on medication
use. Research on other factors associated with not complying to medication need to be examined
such as the side effects of certain medications and what doctors can do to help patients. In
addition patients and caregivers need to be better informed about the role of therapists in helping
patients adhere to medications and how social behavioural models could be used as a tool to

148
manage medications better. Medication should be the primary line of treatment, however
complementary treatments could also be used after consultation with the physician.
The results of the study in chapter 6 examined how beneficial complementary treatments were in
the various domains of quality of life. Aerobic exercise and physiotherapy was found to be more
beneficial, however further research on the type of exercise regimens that is beneficial for the
different types of MS need to be assessed. Research on whether targeted aerobic exercise
programs are beneficial in the long run need to be examined as well.

149
APPENDIX A: Additional file for Chapter 6
Assessment of study quality using modified Pedro scale.
Modified Pedro scale Study Eligibility
Criteria
Specified
Random
allocation of
participants
Allocation
concealed
Groups
similar at
baseline
Assessors
were
blinded
Outcome
measure for
more than
85% of
subjects
Intention
to treat
Reporting of
between group
statistical
comparison
Point and
variability for
that measure
reported
Total
score
out of
9
Ahmadi et al. 2010 1 1 0 1 0 1 1 1 1 8
Cakit et al. 2010 1 1 1 1 1 1 0 1 1 8
Cohen et al.2017 1 0 0 1 0 1 0 1 1 5
Dodd et al. 2011 1 1 1 1 1 1 0 1 1 8
Gobbi et al. 2016 1 0 0 1 1 1 0 1 1 5
Huisinga et al. 2011 1 0 0 1 0 1 0 1 1 5
Jackson et al. 2012 1 0 0 1 0 1 0 1 1 5
Kargarfard et al. 2012 1 1 1 1 1 1 1 1 1 9
Kerling et al. 2015 1 1 1 1 0 1 1 1 1 8
Mutluay et al. 2008 1 1 1 1 1 1 0 1 1 8
Oken et al. 2004 1 1 1 1 1 0 0 1 1 7
Patti et al. 2002 1 1 1 1 1 1 0 1 1 8
Pilutti et al. 2016 1 1 1 1 0 1 0 1 1 7
Ray et al. 2013 1 0 0 1 0 1 0 1 1 5
Romberg et al. 2005 1 1 0 1 0 0 1 1 1 6
Salgado et al. 2013 1 0 0 1 0 1 1 1 1 6
Solari et al. 1999 1 1 1 1 1 1 1 1 1 9
Sutherland et al. 2001 1 1 0 1 0 1 0 1 1 6