multidimensional wellbeing in mozambique vincenzo salvucci university of copenhagen and mpd/dneap
TRANSCRIPT

Multidimensional Wellbeing in Mozambique
Vincenzo Salvucci
University of Copenhagen and MPD/DNEAP

Introduction
• Measuring multidimensional wellbeing involves decisions regarding:
– Dimensions/Indicators– Deprivation cutoffs– Relative importance/weights– Methodology for aggregation/synthetic index

Data
• Census (1997 and 2007)• IAF/IOF (1996/97, 2002/03, 2008/09)• DHS (1997, 2003, 2009, 2011)• Others (MICS, TIA, etc.)
• Different indicators, definitions, representativity
Some studies
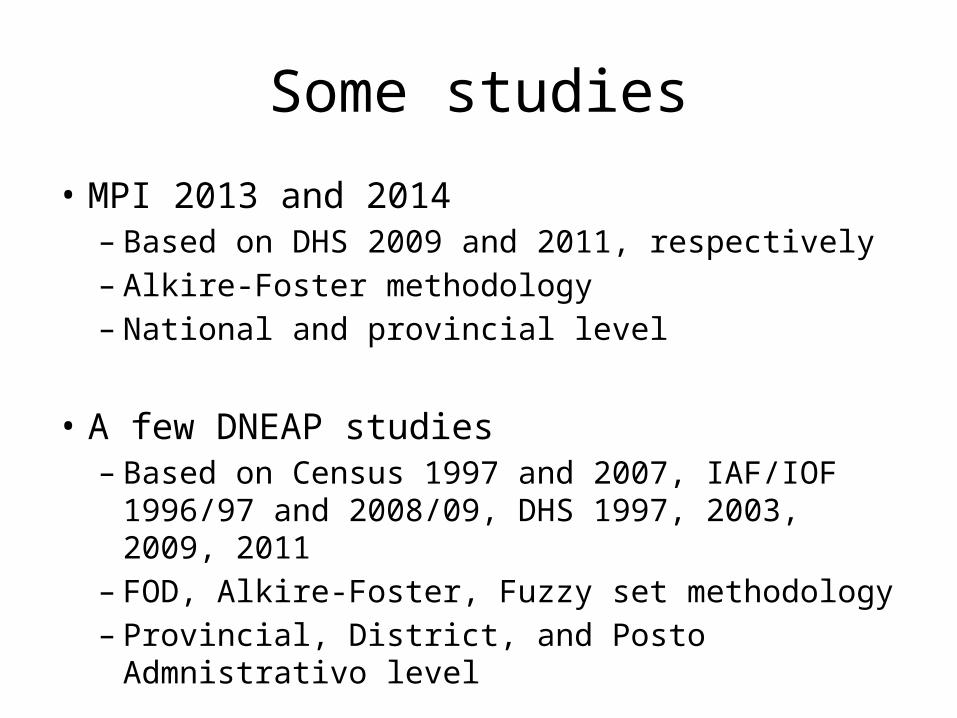
• MPI 2013 and 2014– Based on DHS 2009 and 2011, respectively– Alkire-Foster methodology– National and provincial level
• A few DNEAP studies– Based on Census 1997 and 2007, IAF/IOF 1996/97
and 2008/09, DHS 1997, 2003, 2009, 2011– FOD, Alkire-Foster, Fuzzy set methodology– Provincial, District, and Posto Admnistrativo level

A FIRST ORDER DOMINANCE APPROACH TO POVERTY MAPPING
• FOD principles– The state (0,1,1,0,0) is unambiguously better than
(0,0,1,0,0) because the former state is always at least equivalent and is better than the latter in one instance
– However, the states (1,0,1,0,0) and (1,1,0,0,0) are indeterminate
– The FOD criterion is strict– No judgment is made as to the relative importance
of dimension three versus all other dimensions

Water Sanit Educ Elec Info
0 0 0 0 0
0 1 0 0 0
0 0 1 1 0
1 0 1 1 0
1 0 1 1 1
1 1 1 1 1
Combination

• Safe water: – For 1997, not deprived when the water source is piped water inside or
outside the house or the water source is standpipes. – For 2007, the water source should be piped water inside or outside the
house/yard, spring water, hand pumped well water, or mineral/bottled water
• Sanitation: – For 1997, not deprived when there is a flush toilet or a latrine. – For 2007, having access to flush toilet, toilet with septic tank, or an
improved latrine
• Education: Not deprived for households where at least one household member has some education
• Electricity: Not deprived for households with electricity for lighting
• Radio: Not deprived for households with a functioning radio

(a) Headcount ratio 1996/97 (b) Headcount ratio 2008/09 (c) 1996/97 – 2008/09 change

(a) Spatial FOD index 1997 (b) Spatial FOD index 2007 (c) Temporal FOD index

0.33
02
04
06
08
0S
pat
ial F
OD
Inde
x 1
997
20 40 60 80 100Headcount Ratio 1996/97
Fitted values
0.26
02
04
06
08
0S
pat
ial F
OD
Inde
x 2
007
0 20 40 60 80Headcount Ratio 2008/09
Fitted values
0.15
02
04
06
08
0H
eadc
oun
t Ra
tio 2
008
/09
20 40 60 80 100Headcount Ratio 1996/97
Fitted values
0.86
02
04
06
08
0S
pat
ial F
OD
Inde
x 2
007
0 20 40 60 80Spatial FOD Index 1997
Fitted values
(a) Headcount ratio 1996/97 and spatial FOD index 1997
(b) Headcount ratio 2008/09 and
spatial FOD index 2007
(c) Headcount ratio 2008/09 and 1996/97
(d) Spatial FOD index 2007 and 1997

• Poor/non-poor: consumption poverty indicator from the small area poverty analysis substitutes the radio indicator among the five FOD variables

(a) Spatial FOD index 1997 (b) Spatial FOD index 2007 (c) Temporal FOD index

Serviços básicos e bem-estar em Moçambique, 1997-2007
• Sometimes studying individual dimensions is more useful for policy makers
• In this study we present an atlas of deprivation for several indicators
• Together with a multidimensional poverty index (using Alkire-Foster methodology)
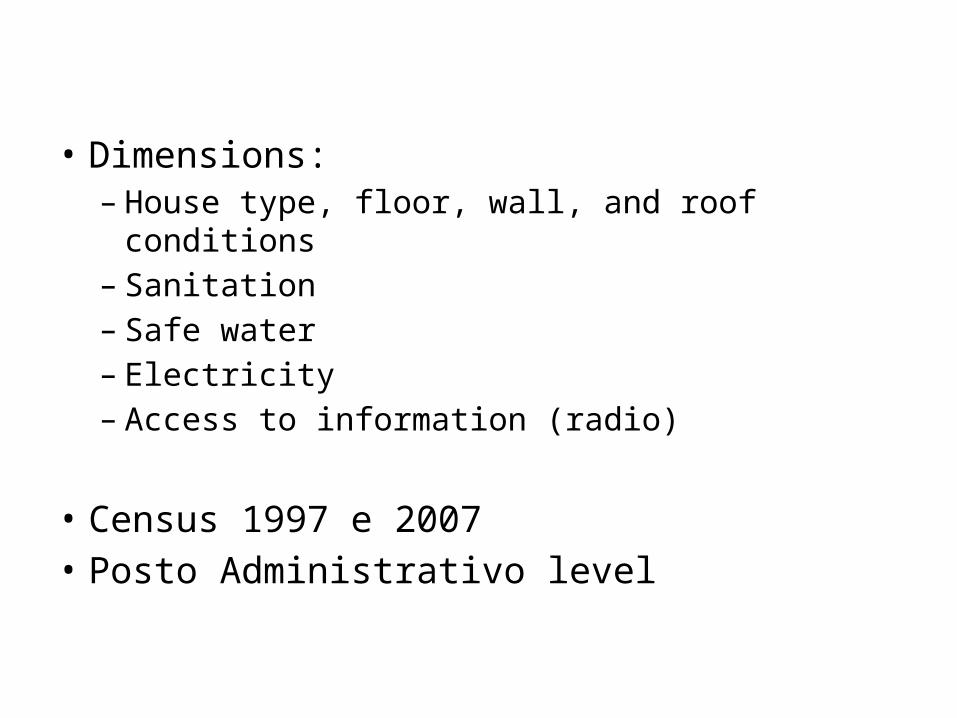
• Dimensions:– House type, floor, wall, and roof conditions– Sanitation– Safe water– Electricity – Access to information (radio)
• Census 1997 e 2007• Posto Administrativo level
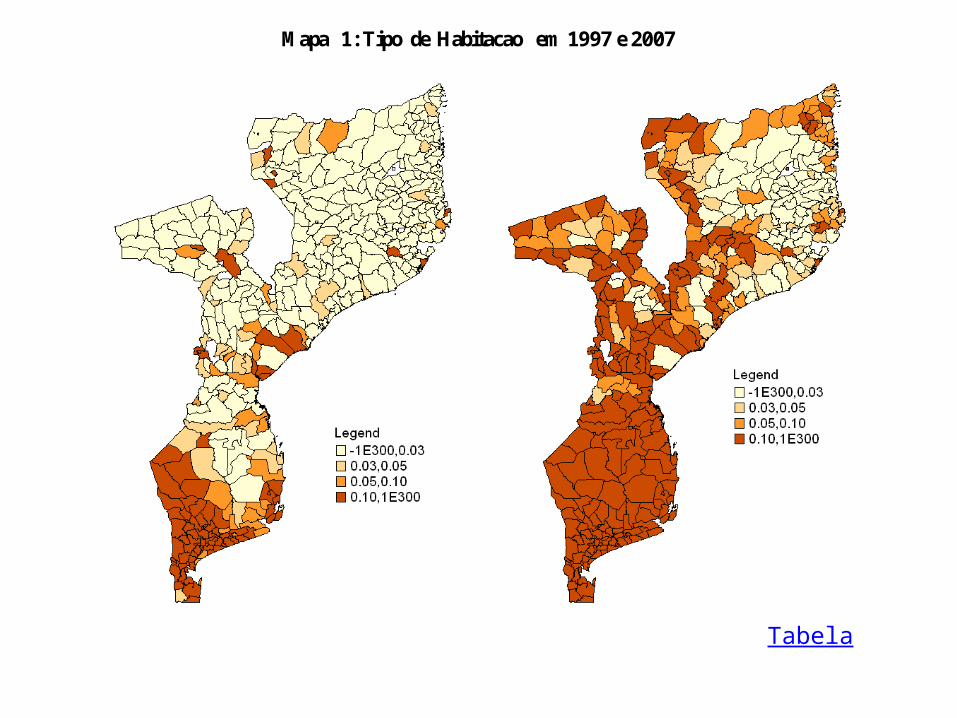
Mapa 1: Tipo de Habitacao em 1997 e 2007
Tabela

Mapa 1: Cobertura da casa em 1997 e 2007
Tabela

Mapa 1: Paredes com bloco de terra abatida em 1997 e 2007
Tabela

Mapa 1: Pavimento (com bloco de terra batida) em 1997 e 2007
Tabela

Mapa 1: Saneamento em 1997 e 2007
Tabela

Mapa 1: Água em 1997 e 2007
Tabela

Mapa 1: Electricidade em 1997 e 2007
Tabela
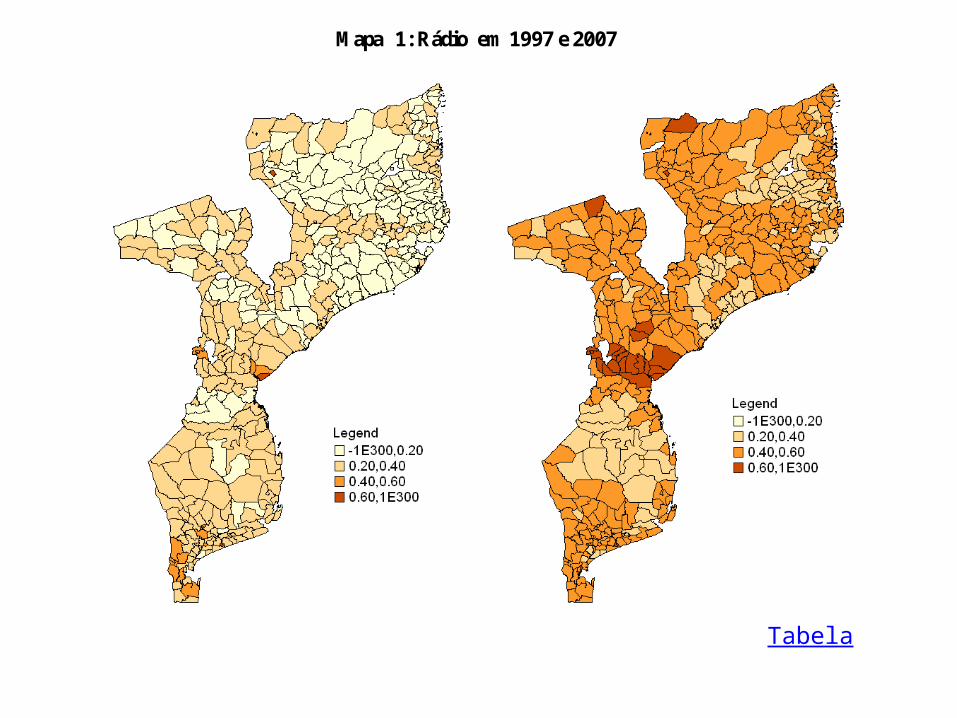
Mapa 1: Rádio em 1997 e 2007
Tabela

Multidimensional Poverty Index (M0_40)

Multidimensional Poverty in Mozambique: An Estimation Based on Two Different Methodologies Using the DHS 1997,
2003, 2009, and 2011
• Here we compare FOD and Alkire-Foster methodology results
• Based on DHS data• Provincial level and comparison over time
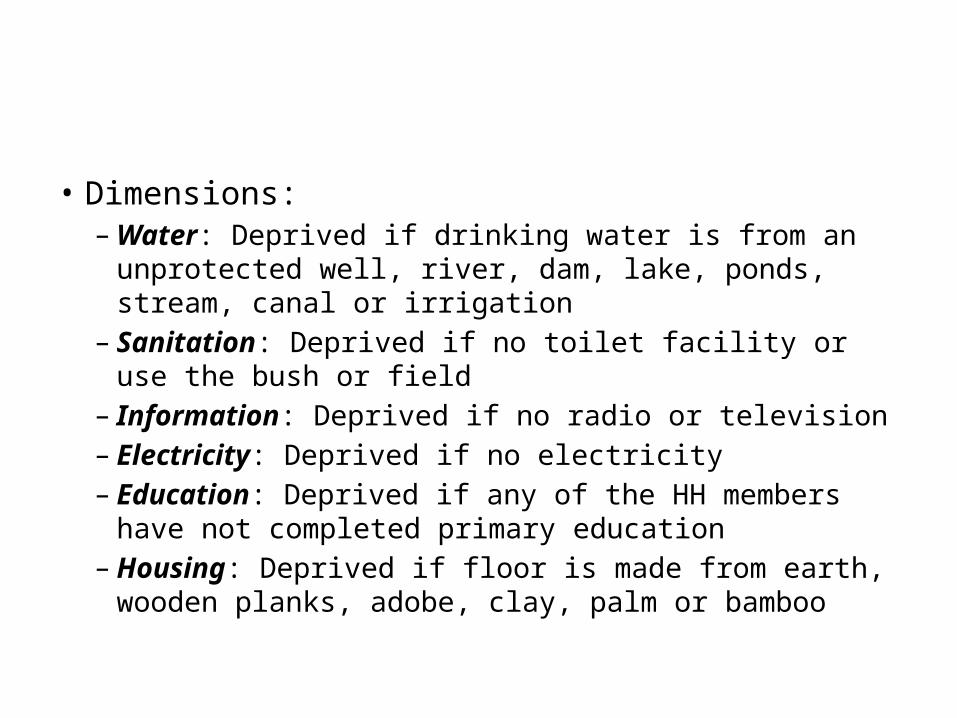
• Dimensions: – Water: Deprived if drinking water is from an unprotected
well, river, dam, lake, ponds, stream, canal or irrigation– Sanitation: Deprived if no toilet facility or use the bush
or field– Information: Deprived if no radio or television– Electricity: Deprived if no electricity– Education: Deprived if any of the HH members have not
completed primary education– Housing: Deprived if floor is made from earth, wooden
planks, adobe, clay, palm or bamboo

M0 (MPI) – ranking1997 2003 2009 2011
Average domination (spatial FOD) – ranking1997 2003 2009 2011

Temporal FOD97-03 97-09 97-11
Change in MPI97-03 97-09 97-11

• High correlation over time
0
1
2
3
4
5
6
7
8
9
10
11
12
Rank_1997 Rank_2003 Rank_2009 Rank_2011
MaputoCd
MaputoPr
Manica
Gaza
Niassa
Inhambane
Sofala
Tete
CaboDelgado
Nampula
Zambezia0
2
4
6
8
10
12
14
16
0 5 10 15
Rank_1997
Rank_2003
Rank_2009

Conclusions
• Choices are important to drive the results
• Important that they are made explicit and discussed, and confronted with the relevant literature
• Relative importance of indicators/dimensions changes over time and across space– From country to country– Nampula rural/Maputo urban– 1997/2007– Income groups

Conclusions
• Measuring multidimensional wellbeing is not substitute for consumption poverty estimates
• It complements the info available (more stable over time)
• Both estimates in the 4th National Poverty Assessment using the IOF 2014/15

Thanks

Appendix
Tabela 1: Tipo de habitação (1997-2007)
1997 % 2007 % Moradia 9.6 Casa convencional 1.76 Flat/apartamento 1.25 Flat/apartamento 0.77 Palhota 84.82 Palhota 69.25 Casa precária (barraca, lata, cartão) 2.79 Casa improvisada (barraca, lata, cartão) 0.54 Casa de madeira e Zinco 1.41 Casa mista 15.44 Casas colectivas 0.01 Casa básica (casa comboio) 11.44 Sem casa 0.11 Parte de um edifício comercial 0.1 Casas colectivas 0.06 Outro 0.62 Sem casa 0.02 Privados 87.72 Privados 70.43 Não-privados 12.28 Não-privados 29.57
Mapa

Tabela 1: Cobertura da casa (1997-2007)
1997 % 2007 % Laje de betão 1.73 Laje de betão 1.39 Telha 0.52 Cimento 0.22 Chapa de lusalite 2.8 Chapa de lusalite 1.92 Chapa de zinco 13.24 Chapa de zinco 22.98 Capim/colmo/palmeira 80.24 Capim/colmo/palmeira 72.4 Outros 1.29 Outros 1.08 Privados 81.71 Privados 73.49 Não-privados 18.29 Não-privados 26.51
Mapa

Tabela 1: Tipo de parede com blocos de terra batida (adobe)
1997 % 2007 % Bloco de cimento 7.81 Bloco de cimento 11.86 Bloco de tijolo 2.4 Bloco de tijolo 4.76 Madeira/zinco 1.66 Madeira/zinco 0.89 Bloco de adobe 18.11 Bloco de adobe 30.73 Caniço/ paus/bambu/palmeira 20.9 Caniço/ paus/bambu/palmeira 17.78 Paus maticados (pau a pique) 47.35 Paus maticados (pau a pique) 33.35 Lata/cartão/papel/saco/casca 0.17 Lata/cartão/papel/saco/casca 0.13 Outros 1.61 Outros 0.51 Privados 70.02 Privados 51.76 Não-privados 29.98 Não-privados 48.24
Mapa

Tabela 1: Pavimento com blocos de adobe
1997 % 2007 % Madeira/parqué 1.33 Madeira/parqué 1.02 Mármore/granulito 0.04 Mármore/granulito 0.15 Cimento 13.32 Cimento 19.52 Mosaico/tijoleira 0.24 Mosaico/tijoleira 0.8 Adobe (terra batida) 17.42 Adobe (terra batida) 62.33 Sem nada 67.17 Sem nada 15.53 Outros 0.48 Outros 0.64 Privados 67.65 Privados 16.18 Não-privados 32.35 Não-privados 83.82
Mapa

Tabela 1: Saneamento (1997-2007)
1997 % 2007 % Retrete com autoclismo 2.35 Retrete ligada a fossa séptica 3.51 Retrete sem autoclismo 1.17 Latrina melhorada 6.58 Latrina 29.65 Latrina tradicional melhorada 5.74 Não tem retrete/latrina 66.83 Latrina não melhorada 30.73 Não tem retrete/latrina 53.44 Privados 96.48 Privados 84.17 Não-privados 3.52 Não-privados 15.83
Mapa
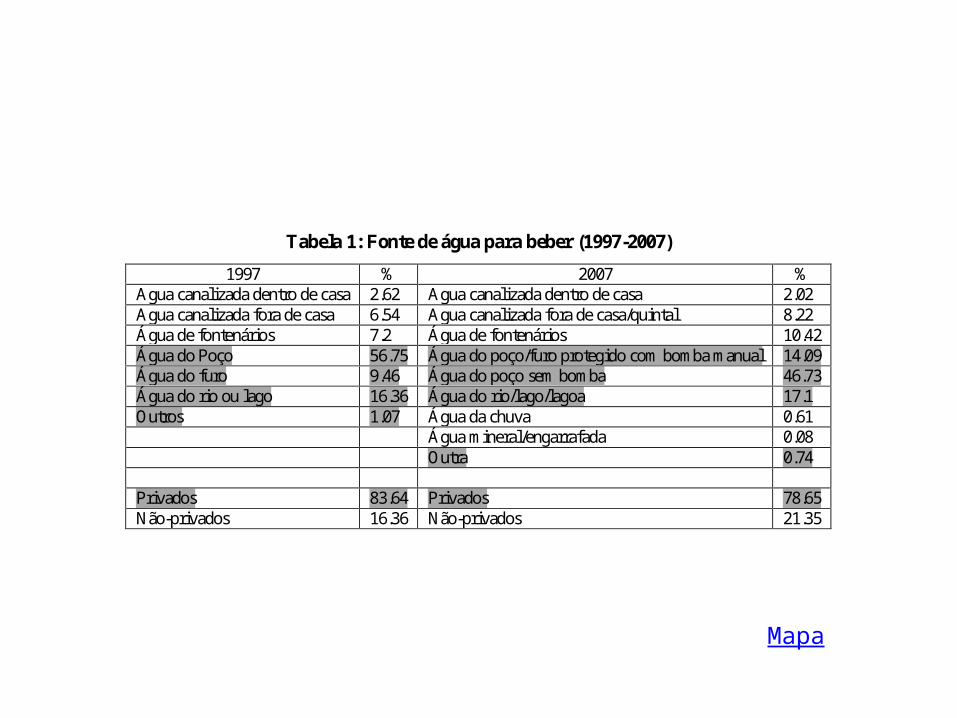
Tabela 1: Fonte de água para beber (1997-2007)
1997 % 2007 % Agua canalizada dentro de casa 2.62 Agua canalizada dentro de casa 2.02 Agua canalizada fora de casa 6.54 Agua canalizada fora de casa/quintal 8.22 Água de fontenários 7.2 Água de fontenários 10.42 Água do Poço 56.75 Água do poço/furo protegido com bomba manual 14.09 Água do furo 9.46 Água do poço sem bomba 46.73 Água do rio ou lago 16.36 Água do rio/lago/lagoa 17.1 Outros 1.07 Água da chuva 0.61 Água mineral/engarrafada 0.08 Outra 0.74 Privados 83.64 Privados 78.65 Não-privados 16.36 Não-privados 21.35
Mapa

Tabela 1: Uso de electricidade (1997-2007)
1997 % 2007 % Usa electricidade (não-privados) 5.4 Usa electricidade (não-privados) 10.16 Não usa electricidade (privados) 94.6 Não usa electricidade (privados) 89.84
Mapa

Tabela 1: Posse de rádio
1997 % 2007 % Têm Radio (não-privados) 28.61 Têm Radio (não-privados) 48.47 Não têm Radio (privados) 71.39 Não têm Radio (privados) 51.53
Mapa