multi-spectral skin imaging by a consumer photo-camera
TRANSCRIPT

Multi-spectral skin imaging by a consumer photo-camera
Janis Spigulis, Dainis Jakovels and Uldis Rubins
Bio-optics and Fiberoptics Laboratory, Institute of Atomic Physics and Spectroscopy University of Latvia, Raina Blvd. 19, Riga, LV-1586, Latvia
ABSTRACT The possibilities to perform multi-band spectral imaging by means of a consumer color camera without external filters have been studied. Images at up to 6 spectral bands may be extracted from a single color image after appropriate signal processing. The proposed technique was tested in pilot measurements of in-vivo skin hemoglobin maps and laser-excited autofluorescence images. Keywords: multi-spectral imaging, skin chromophore mapping, skin autofluorescence.
1. INTRODUCTION Recently a number of multi-spectral imaging cameras have been designed and successfully applied. They generally comprise an imaging sensor and some external spectral filtering device – a set of changeable narrow-band spectral transmission filters or some tunable spectral filter, e.g. acousto-optical or liquid crystal filter. The latter filtering mode is gaining popularity thanks to its compactness, wide spectral range and fast signal processing. The main goal of multi-spectral imaging is to obtain a set of images of the same object, taken at different specific spectral bands. Further such images can be compared and manipulated (extracted, divided, etc.) in order to get information on certain image areas, based on their specific spectral reflectance. Along with applications like remote satellite sensing and pollution monitoring, multi-spectral imaging technique is widely used in clinical diagnostics, e.g. for distant skin chromophore mapping [1]. In digital imaging sensors, the number of photons collected at each pixel is converted into an electrical charge by a miniature photodiode. This charge is then converted into a voltage, amplified, and converted to a digital value, so that the camera can process the values into the final digital image. Two main modalities of digital image sensors are available. In CCD (Charge-Coupled Device) sensors, the pixel measurements are processed sequentially by circuitry surrounding the sensor, while in APS (Active Pixel Sensors) the pixel measurements are processed simultaneously by circuitry within the sensor pixels and on the sensor itself. The most common type of APS is the CMOS (Complementary Metal Oxide Semiconductor) sensor. For color imaging, both CCD and CMOS sensors measure three signal values (R, G and B) at each color image pixel. The combinations of the B, G and R values are further transferred into a certain color value and correspondingly visualized in the output image The blue (B), green (G) and red (R) sub-pixel spectral sensitivities are mimicking those of the three types of cone-shaped retinal cells in the human eye. However, if compared to human eye, there is a notable difference that can find practical applications. Human brain processes the three cone-cell channels simultaneously, resulting in perception of a certain color at certain image point (pixel). Image sensors, however, first produce three color signals (further converted into color values) from every single “color pixel”, and only then identify the respective color for each pixel. Before that, the specific values related to the R-, G- and B-bands at each pixel can be selectively extracted from the sensor output data stream and additionally used for multi-spectral analysis of the image. To get the RGB data from CCD sensors, color array filters are used (Fig. 1, a) – one “color pixel” comprises three neighboring sub-pixels with different color filters, and each sub-pixel reports its detected R, G or B value. For
Multimodal Biomedical Imaging V, edited by Fred S. Azar, Xavier Intes, Proc. of SPIE Vol. 7557 75570M · © 2010 SPIE · CCC code: 1605-7422/10/$18 · doi: 10.1117/12.845492
Proc. of SPIE Vol. 7557 75570M-1
Downloaded from SPIE Digital Library on 01 Feb 2011 to 85.254.232.20. Terms of Use: http://spiedl.org/terms

CMOS sensors, three photodiodes are stacked on top of each other using planar fabrication techniques (Fig. 1, b). Each successive layer acts as a filter for the layer below it shifting the spectrum of absorbed light in successive layers. By de-convolving the response of each layered detector, red, green, and blue signals can be reconstructed.
a b
Fig. 1. Color extraction schemes for the CCD filter array (a) and layered CMOS (b) sensors [2].
High-quality multi-spectral imaging cameras are much more expensive to compare with the consumer color photo-cameras. If the imaging application does not require filtering at extremely narrow and very widely tunable spectral bands, some more robust but less expensive technologies might be of interest. From this point, the potential of the built-in spectral filters at the imaging sensors of consumer color cameras seems not to be fully exploited so far. Even extraction of a color image that correspond to one of the R, G and/or B spectral bands, in combination with the “final” color image may lead to efficient clinical applications – e.g. distant visualization of skin blood pulsations at the pathology areas [3]. Logical analysis of separated R, G and B output signals from each color pixel may lead to extraction of several other spectral sensitivity intervals of a standard color image sensor. The basic options for multi-spectral imaging by a consumer color camera in cases of monochromatic and narrow-band illumination are considered here and illustrated by some results of calculations and pilot measurements.
2. METHOD AND EQUIPMENT
The Canon EOS 400D color camera with CMOS sensor (maximum resolution 3888x2592, 10.2 Megapixels [4]) has been studied as a potential multi-spectral detector. Before taking skin measurements, spectral sensitivities of the color sub-pixels were experimentally tested by recording monochromatic light at various wavelengths within the working spectral range 400…700 nm. Broadband emission of tungsten incandescent lamp was passed via monochromator (MUM-2, output spectral bandwidth ~ 4 nm), and the white reference tile from Avantes was illuminated at its output, with subsequent snap-shooting of the tile at different wavelengths (scan-step 5 nm). The illumination wavelength and spectral band shape were additionally controlled by a fiber-optic spectrometer (Avantes 2048-2). The main interest was focused on relative values of the R, G and B outputs from the illuminated pixels at each specific wavelength. Generally, their ratios should remain the same also at other illumination intensities, as far the photo-responses of the detector sub-pixels are linear. The linearity conditions were checked during the measurements, and the output signal amplitudes were not further corrected with respect to lamp emission spectrum and monochromator/detector spectral responses. The camera was connected to PC, and all three values of the R, G and B signals from the illuminated pixels were extracted at each test wavelength, using the MatLab software. Putting together the data obtained at all fixed wavelengths, the relative spectral sensitivities of the blue, green and red bands for the CMOS detectors of this particular camera have been determined.
Proc. of SPIE Vol. 7557 75570M-2
Downloaded from SPIE Digital Library on 01 Feb 2011 to 85.254.232.20. Terms of Use: http://spiedl.org/terms

As the next step, the inverse problem was considered – if and how would be possible to restore the wavelength of monochromatic radiation that illuminates the RGB sensor of this camera. After a logical analysis, several specific wavelength intervals have been selected where unambiguous relation between wavelength and relative values of the single-pixel R, G and/or B signal amplitudes exist. For each of these intervals calibration curves for identification of the wavelength have been constructed. In addition, model calculations were performed to see how the relative R, G and B values are changing if the spectral interval of illumination increases; Gaussian shape of the emission bands was considered. Human volunteer skin measurements were taken to validate the proposed approach. Bi-chromatic illumination of skin was provided by two cw lasers (532 nm and 635 nm) operating in 1…10 mW power range; the beam was expanded to illuminate ~ 5 cm spot covering three fingers. The 532 nm reflected light mostly was detected by the green (G) sub-pixels of the CMOS sensor, and the 635 nm light – mostly by the red (R) sub-pixels. In this situation the consumer RGB camera worked as a 2-channel multi-spectral detector acquiring both spectral images at once. A resin cuff of arterial occlusion (p ~ 150 mm Hg) was used to reduce skin blood oxygenation in a middle finger. A set of subsequent RGB images taken each 5 seconds during the cw dual-laser illumination was collected. RGB images were acquired during the finger occlusion and after the cuff release. The two mentioned wavelengths were selected for mapping of the skin hemoglobin (blood) concentration distribution: the 532 nm radiation is highly absorbed by hemoglobin, while the 635 nm absorption is about two orders of magnitude weaker [5]. Similar dual-wavelength approach has been used before for simplified erythema index determination, based on different blood optical densities at 560 nm and 650 nm [6]. The relative hemoglobin level H we estimated as:
(1),
where OD - optical density, Iwr - white reference reflected intensity value measured at the beginning of experiment (can be perceived as constant), and Iskin – skin remission intensity.
3. RESULTS AND DISCUSSION Fig. 2,a shows our measured relative R-, G- and B-sensitivities of the Canon EOS 400D camera sensor in comparison with the reported data [7] on two other Canon cameras, models 40D and 50D (Fig.2, b). Generally, the spectral data agree well; differences in the band relative amplitudes can be explained by absence of illumination spectral corrections in our measurements. The characteristic crossing points of the B- and G-curves in both cases are around 490 nm, while the B-R crossings are at ~530 nm and the G-R crossings - at ~580 nm. The band maxima wavelengths are ~450 nm, ~540 nm and ~600 nm for the B, G and R band, respectively. B-band covers the spectral range ~400…550 nm, G-band ~450…620 nm and R-band ~500…700 nm.
Proc. of SPIE Vol. 7557 75570M-3
Downloaded from SPIE Digital Library on 01 Feb 2011 to 85.254.232.20. Terms of Use: http://spiedl.org/terms
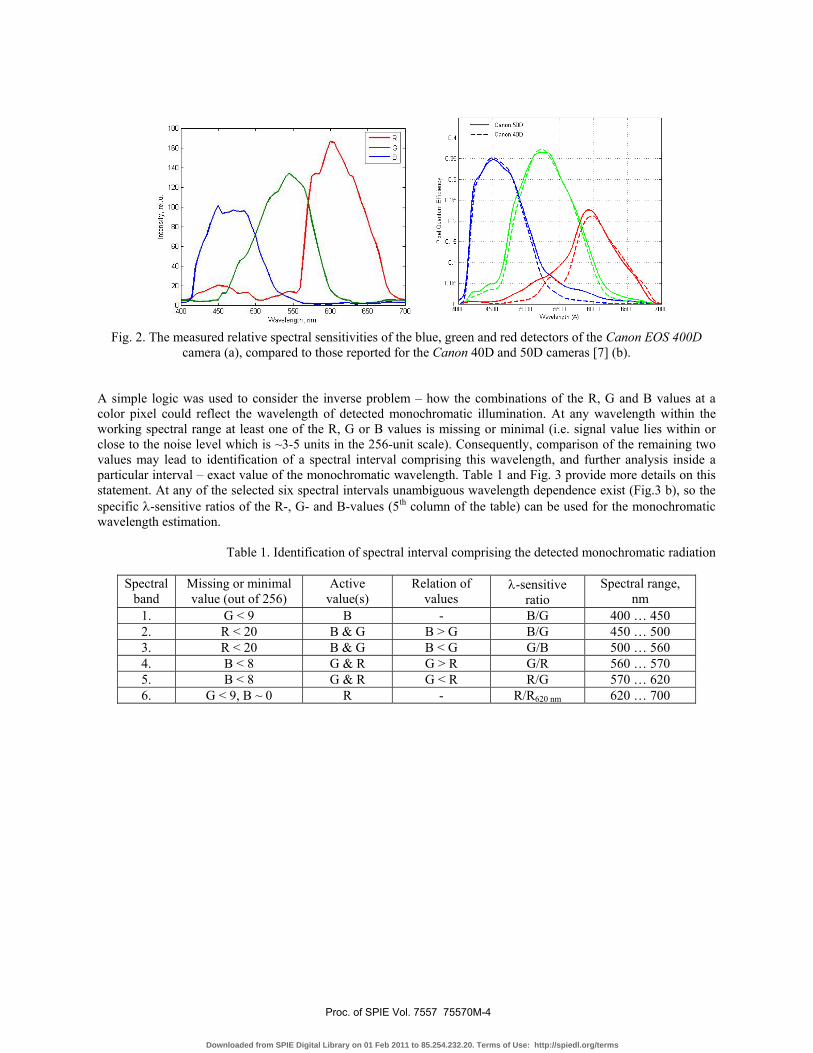
Fig. 2. The measured relative spectral sensitivities of the blue, green and red detectors of the Canon EOS 400D
camera (a), compared to those reported for the Canon 40D and 50D cameras [7] (b).
A simple logic was used to consider the inverse problem – how the combinations of the R, G and B values at a color pixel could reflect the wavelength of detected monochromatic illumination. At any wavelength within the working spectral range at least one of the R, G or B values is missing or minimal (i.e. signal value lies within or close to the noise level which is ~3-5 units in the 256-unit scale). Consequently, comparison of the remaining two values may lead to identification of a spectral interval comprising this wavelength, and further analysis inside a particular interval – exact value of the monochromatic wavelength. Table 1 and Fig. 3 provide more details on this statement. At any of the selected six spectral intervals unambiguous wavelength dependence exist (Fig.3 b), so the specific λ-sensitive ratios of the R-, G- and B-values (5th column of the table) can be used for the monochromatic wavelength estimation.
Table 1. Identification of spectral interval comprising the detected monochromatic radiation
Spectral
band Missing or minimal value (out of 256)
Active value(s)
Relation of values
λ-sensitive ratio
Spectral range, nm
1. G < 9 B - B/G 400 … 450 2. R < 20 B & G B > G B/G 450 … 500 3. R < 20 B & G B < G G/B 500 … 560 4. B < 8 G & R G > R G/R 560 … 570 5. B < 8 G & R G < R R/G 570 … 620 6. G < 9, B ~ 0 R - R/R620 nm 620 … 700
Proc. of SPIE Vol. 7557 75570M-4
Downloaded from SPIE Digital Library on 01 Feb 2011 to 85.254.232.20. Terms of Use: http://spiedl.org/terms

Fig. 3. Digitized spectral sensitivities of the B, G and R sub-pixels of the Canon EOS 400D camera (a) and six spectral intervals for wavelength identification of a monochromatic illumination (b).
Any of the situations presented at the columns 2-4 of the table leads to conclusion that a particular pixel has detected radiation of the respective spectral range (last column of the table). If there are many similar pixels having about the same specific RGB-ratios over the whole image, a narrow-band image related to this particular spectral range can be generated. Theoretically this makes possible to extract six narrow-band spectral images by processing one conventional RGB color image – e.g. if illumination is performed by six laser wavelengths, each “sitting” within one of the specified spectral intervals 1-6. Real-life light sources are mainly non-monochromatic; however, narrow-band LEDs are increasingly applied, and detection of their emission wavelength range by simple RGB analysis might be of practical interest. Spectral emission band of LED in most cases can be roughly approximated with the Gaussian function. Numerical analysis of Gaussians has been performed in order to get feeling about the limits of spectral bandwidth that might be appropriate for wavelength estimation by the above-described method. Fig. 4 represents the obtained sensitivity curves within the specified 6 spectral intervals. Dependencies of the corresponding RGB ratios on the central wavelength of Gaussian band at 4 particular bandwidths (bw) – 10 nm, 25 nm, 50 nm and 100 nm - are shown in comparison with the monochromatic case. One can see that the ratio sensitivity to radiation with 100 nm bandwidth is very low, while the two narrower (10 nm and 25 nm) bandwidths seem to be quite promising for RGB-restoring of their central wavelength, especially with respect to the spectral intervals 2, 3 and 6.
Proc. of SPIE Vol. 7557 75570M-5
Downloaded from SPIE Digital Library on 01 Feb 2011 to 85.254.232.20. Terms of Use: http://spiedl.org/terms

Fig. 4. Relative sensitivities of restoring of the central wavelengths of Gaussian-shaped emission bands with different bandwidth related to the six specified spectral intervals.
Pilot experiments have been performed to validate the above-described approach by separation of the R- and G-images of skin during laser irradiation. First, bi-chomatic (532 nm and 635 nm) laser illumination responses have been studied in order to estimate skin hemoglobin changes during and after finger arterial occlusion. Hemoglobin level H-values (1) were calculated for the occluded finger and the neighboring (non-occluded) fingers with subsequent color scaling, in order to plot the parameter changes in time. During finger occlusion the H-value decreased for ~30%, and later increased up to 30 % after the cuff release, if compared to the initial level; the hemoglobin level changes are clearly reflected in the parametric color map (Fig. 5,a). For comparison, results of similar test using an advanced multi-spectral imaging camera [1] is presented at Fig. 5, b. RGB-responses of skin autofluorescence images under the violet 405 nm laser excitation were also studied. Fluorescence images have been taken via spectral step filter cutting-off the laser wavelength, and images of the G-band and the R-band were extracted by processing the RGB data. Fig. 6,a shows full autofluorescence images of two skin lesions (mole and scar) and the same images as captured in the G and R bands separately. Further, Fig. 6,b represents the difference (G-R) images and Fig. 6,c – the ratio G/R images. The latter two images seem to contain more structural information on the lesions if compared to the “normal” color image.
Proc. of SPIE Vol. 7557 75570M-6
Downloaded from SPIE Digital Library on 01 Feb 2011 to 85.254.232.20. Terms of Use: http://spiedl.org/terms

Fig. 5. Relative hemoglobin level changes during middle finger cuff occlusion as reflected by the R-G-B analysis at
bi-chomatic laser illumination (a) and by the multi-spectral (500-700 nm) analysis at white illumination [1] (b). The color scale represents the relative parameter values with respect to their mean values for normal skin.
4. CONCLUSIONS Extraction and analysis of separated R-, G- and B-values at the pixels of color skin images taken by a consumer camera have been performed. In the case of monochromatic radiation, six spectral intervals have been specified were the illumination wavelength might be approximately restored in result of logical comparison of the R, G and B values detected at a single color pixel. Applicability limits of this approach for Gaussian narrow-band emitters (e.g. LEDs) have been assessed. The results show that the central wavelength could be sufficiently restored also for spectrally narrow-band (10 nm, 25 nm) illumination. Generally, the specific ratios of the single-pixel R, G and B values (Table 1) might be further used for multi-spectral imaging without external filters, if monochromatic or narrow-band spectral features of the images are expected. It has been illustrated by pilot measurements of skin reflectance at simultaneous dual-laser (532 nm and 635 nm) illumination that provided qualitative information on skin hemoglobin changes (Fig.5). Potentially, this approach could be further developed for obtaining more detailed skin chromophore maps. Essential advantage of the discussed technique is possibility to extract multi-spectral data from a single color image data cube, instead of processing a number of images taken at different spectral regions. Thanks to the simplicity, fast processing of parametric maps and sufficient contrast, it could find application, for instance, in monitoring of dynamic skin blood supply changes.
Proc. of SPIE Vol. 7557 75570M-7
Downloaded from SPIE Digital Library on 01 Feb 2011 to 85.254.232.20. Terms of Use: http://spiedl.org/terms

405 nm laser excited skin autofluorescence images extracted separately at the green (G) and red (R) bands of the CMOS detector (Fig. 6) also could be applied for skin structure assessment after appropriate processing. The parametric (G-R) and (G/R) images seem to contain more structural information on the lesions if compared to the “normal” fluorescence color image, so there might be some clinical interest on this kind of skin image processing. The potential of selective R-G-B analysis of the CMOS sensor output for structural assessment of in-vivo skin should be further studied in details; image cross-polarization processing may lead to additional improvements.
Fig. 6. 405 nm laser excited skin autofluorescence images of a mole and wound:
a) full RGB images with their G and R components, b) difference (G-R) images, normalized to the surrounding skin level, c) ratio (G/R) images.
5. ACKNOWLEDGMENTS
Financial support from Latvian Science Council (grant # 09.1026) and European Social Fund (grant # 2009/0211/1DP/1.1.1.2.0/09/APIA/VIAA/077) is highly appreciated.
Proc. of SPIE Vol. 7557 75570M-8
Downloaded from SPIE Digital Library on 01 Feb 2011 to 85.254.232.20. Terms of Use: http://spiedl.org/terms

6. REFERENCES
1. D. Jakovels, J. Spigulis, „2-D mapping of skin chromophores in the spectral range 500-700 nm”, J. Biophoton., 2009 (in press, online http://www3.interscience.wiley.com/journal/122675525/abstract).
2. http://www.dpreview.com/learn/?/key=sensors 3. W. Verkruysse, L.O. Svaasand, J.S. Nelson. „Remote plethysmographic imaging using ambient light”.
Opt. Express, 16(26), 21434–21445 (2008). 4. http://www.dpreview.com/reviews/specs/canon/canon_eos400d.asp 5. S. Prahl, Tabulated Molar Extinction Coefficient for Hemoglobin in Water,
http://omlc.ogi.edu/spectra/hemoglobin/summary.html. 6. B. L. Diffey, R. J. Oliver, P. M. Farr, “A portable instrument for quantifying erythema indicated by
ultraviolet radiation”. Br. J. Dermatol., 111, 663-672 (1984). 7. http://www.astrosurf.com/~buil/50d/test.htm.
Proc. of SPIE Vol. 7557 75570M-9
Downloaded from SPIE Digital Library on 01 Feb 2011 to 85.254.232.20. Terms of Use: http://spiedl.org/terms