multi-sectoral mapping of nutrition actions · source: who, iip at bloomberg school of public...
TRANSCRIPT
UN NETWORK FOR SUN
WEBINAR
SERIES
MULTI-SECTORAL MAPPING OF NUTRITION ACTIONS
Wednesday, June 21
Presented by:
In collaboration with

2
“Mapping” in the global context
While this mapping tool was developed by REACH, with support
from the Boston Consulting Group, the tool is called…
… the Scaling Up Nutrition Planning & Monitoring Tool (SUN PMT)
as findings help to frame planning and scale-up discussions
Picture sources: UNSCN 2017. Global Governance for Nutrition and the role of UNSCN Discussion paper.; OCHA 2015. Nepal: Who does what where when (4W).; WHO GINA website; REACH Stakeholder & Nutrition Action Mapping in Burkina Faso 2015; The Philippines UN Nutrition Inventory.
UNSCNmapping of actors at the global level
OCHA’s 3W / 4W
mapping
WHO’s Global
database (GINA)
FAO’s MAFSAN
AU / UNICEF ESARO mapping
tool
REACH Stakeholder and Nutrition
Action MappingUN Nutrition
Inventory (UN
Network for SUN)
3
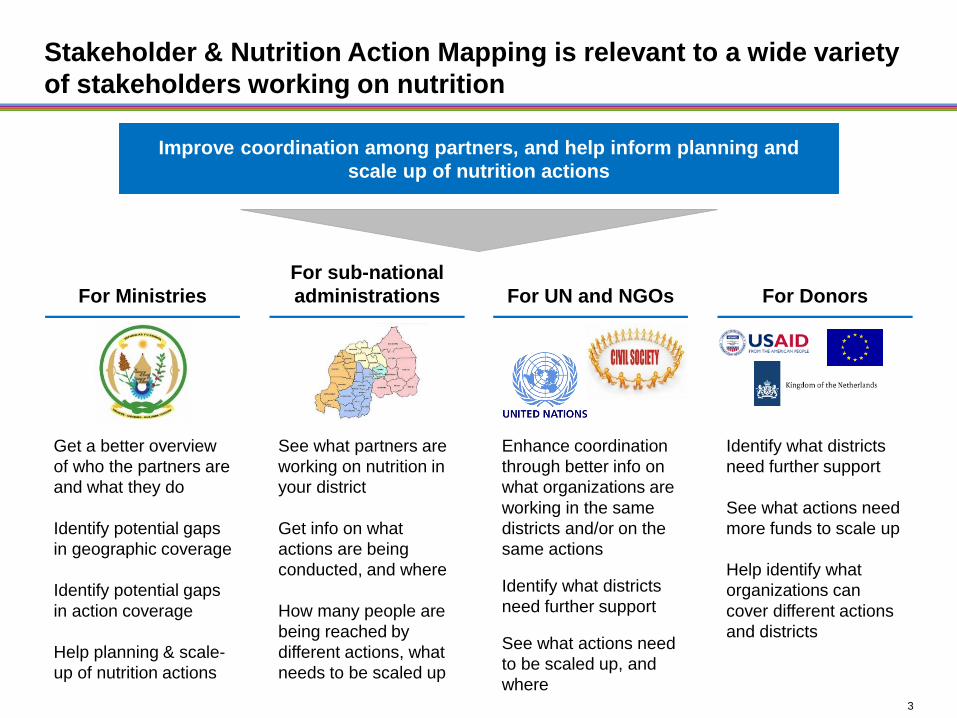
Stakeholder & Nutrition Action Mapping is relevant to a wide variety
of stakeholders working on nutrition
For Ministries
Get a better overview
of who the partners are
and what they do
Identify potential gaps
in geographic coverage
Identify potential gaps
in action coverage
Help planning & scale-
up of nutrition actions
For sub-national
administrations
See what partners are
working on nutrition in
your district
Get info on what
actions are being
conducted, and where
How many people are
being reached by
different actions, what
needs to be scaled up
For UN and NGOs
Enhance coordination
through better info on
what organizations are
working in the same
districts and/or on the
same actions
Identify what districts
need further support
See what actions need
to be scaled up, and
where
For Donors
Identify what districts
need further support
See what actions need
more funds to scale up
Help identify what
organizations can
cover different actions
and districts
Improve coordination among partners, and help inform planning and
scale up of nutrition actions
4
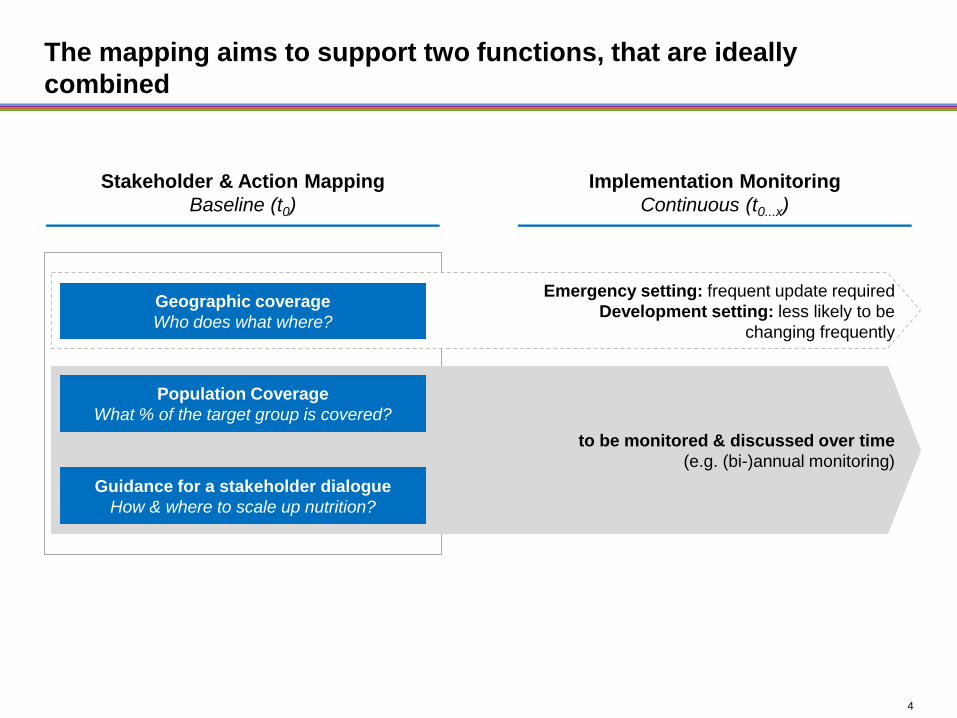
The mapping aims to support two functions, that are ideally
combined
Stakeholder & Action Mapping
Baseline (t0)
Implementation Monitoring
Continuous (t0...x)
to be monitored & discussed over time
(e.g. (bi-)annual monitoring)
Emergency setting: frequent update required
Development setting: less likely to be
changing frequently
Geographic coverage
Who does what where?
Population Coverage
What % of the target group is covered?
Guidance for a stakeholder dialogue
How & where to scale up nutrition?

5
Conceptually, the mapping aims to monitor coverage of nutrition
actions as part of a broader information landscape
Input Output Outcome Impact
Source: WHO, IIP at Bloomberg School of Public Health, Johns Hopkins University; OECD-DAC, REACH Secretariat, REACH Facilitator Manual, BCG analysis
Human and financial
resources
• Used to support the
primary activities of a
project or program
Service delivery
• Food, supplements or other
supplies are procured and
distributed
• Cash and vouchers are
disbursed
• Capacity building is provided
directly to beneficiaries
Changes or effects
• Resulting from what
actions a project /
program provides
Broader/ longer-term effects
on nutrition situation
time
prevalence of malnutrition
time
coverage
Prevalence of
malnutrition
reducing = nutrition
situation improving
Beneficiary
coverage
increasing
Comparing coverage outputs with the nutrition situation helps to identify potential
bottlenecks (e.g. HR, funds, reach of delivery mechanism, quality of delivery etc.) and
what further analysis is required to confirm and address them
6
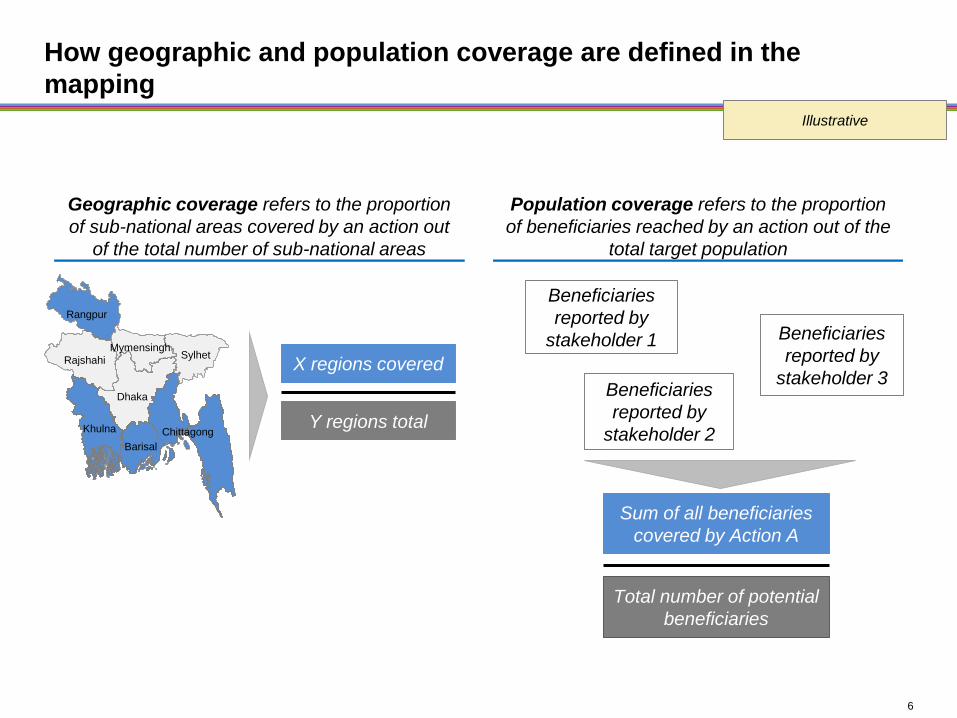
How geographic and population coverage are defined in the
mapping
Rajshahi
Dhaka
Sylhet
Khulna
Barisal
Chittagong
Mymensingh
Geographic coverage refers to the proportion
of sub-national areas covered by an action out
of the total number of sub-national areas
Population coverage refers to the proportion
of beneficiaries reached by an action out of the
total target population
X regions covered
Y regions total
Beneficiaries
reported by
stakeholder 1
Sum of all beneficiaries
covered by Action A
Total number of potential
beneficiaries
Beneficiaries
reported by
stakeholder 2
Beneficiaries
reported by
stakeholder 3
Rangpur
Illustrative
7
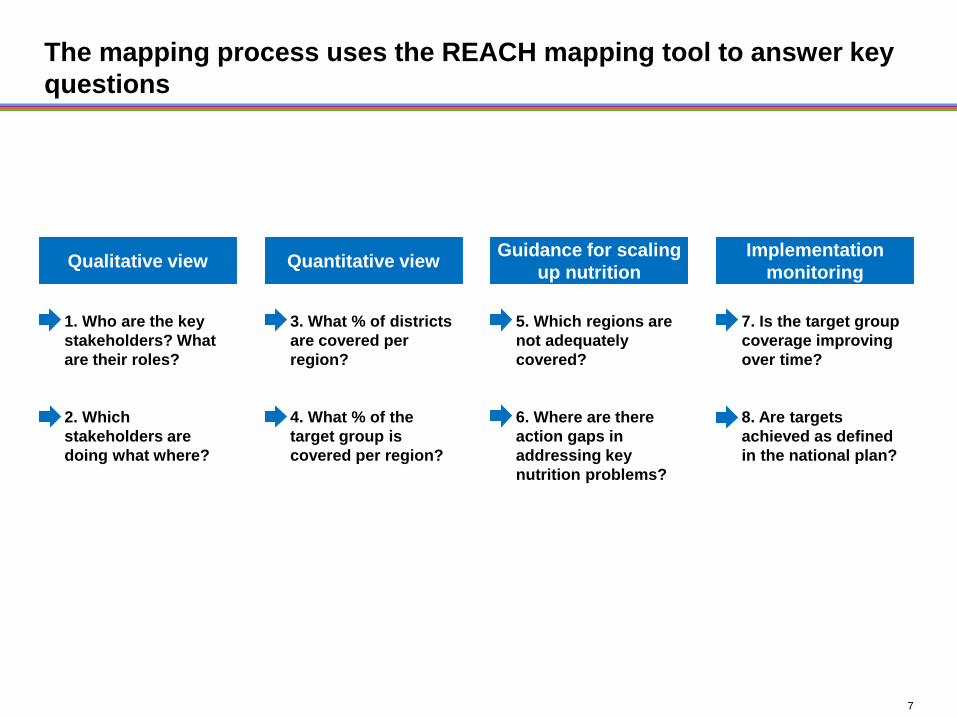
The mapping process uses the REACH mapping tool to answer key
questions
1. Who are the key
stakeholders? What
are their roles?
2. Which
stakeholders are
doing what where?
3. What % of districts
are covered per
region?
4. What % of the
target group is
covered per region?
5. Which regions are
not adequately
covered?
6. Where are there
action gaps in
addressing key
nutrition problems?
7. Is the target group
coverage improving
over time?
8. Are targets
achieved as defined
in the national plan?
Qualitative view Quantitative viewGuidance for scaling
up nutrition
Implementation
monitoring

8
1. Who are the key stakeholders? What are their roles?
Growth monitoring
Provide materials and
training for small-scale
horticulture
Promote food
preservation and storage
Promote universal salt
iodization
Carry out / support food
fortification
Carry out nutrition
education
Provide materials for
improved water sources
Provide conditional cash
transfers
Ch
ild
He
alt
h
Country relevant actions
Fo
od
& A
gri
cu
ltu
re
WHO, DFATD, Hilton Foundation,
Irish Aid
Donors
IDRC, USAID, DFATD, Irish Aid,
BMGF
AGRA, Irish Aid, DFATD, USAID
UNICEF, Irish Aid, DFATD
DFID
IDRC, DFATD, USAID, Hilton
Foundation, Reckit Benkiser,
UNICEF, Irish Aid
Global Sanitation Funds, DFATD,
Irish Aid
Irish Aid
Catalysts
Plan, CRS, HKI, Jhpiego, Africare,
TFNC
CRS, Fintrac, NAFAKA, HKI, IITA,
ICRISAT, Sokoine University,
University of Alberta, International
Livestock Research Institute,
PWRDF
WFP, Save the Children,
COUNSENUTH, IITA, ICRISAT,
PWRDF
Save the Children,
COUNSENUTH, TSPA, PWRDF
HKI, NFFA, TFNC, TFDA
Plan, GAIN, CRS, Save the
Children, AMREF,
COUNSENUTH, Jhpiego, Africare,
Sokoine University, University of
Alberta, International Livestock
Research Institute, PWRDF
CRS, COUNSENUTH, PWRDF
COUNSENUTH, PMO-Disaster
Dept, TFNC, UNICEF, Sokoine
University
Responsible Ministries
MoHSW
MAFC, MLFD, MoHSW
MAFC, MoHSW
MoHSW
MoHSW
MAFC, MoHSW,
PMO-RALG
Ministry of Water, MoHSW
MAFC, MLFD, MoHSW
Field implementers
Aga Khan Foundation, PASADIT,
MOCSO,
Dioceses of Geita
ACT MASASI, Global Service
Corps, HACOCA, CBO, Iringa
Mercy Organization, Rungwe
Small Tea Grower’s Association,
Njombe Agriculture Development
Organization, Zapha+, RUDI,
MVIWATA, FIPs, IFDC, DANIA,
CRS, ARVDC
ACT – MASASI, RUDI, Faida
MaLi, PEMWA, ROPA, TFNC,
Lukoveg, ARVDC
ACT MASASI, TFNC, PEMWA,
ROPA
Private Sector, HKI
Aga Khan Foundation, ACT
MASASI, private sector, PASADIT,
MOCSO, Dioceses of Geita,
PEMWA, ROPA, RHMT, CHMT,
TFNC
ACT MASASI, Dioceses of Ifakara
- Kilombero, Dioces of Arusha,
TFNC
TFNC, UNICEF, MLFD, Sokoine
University
Nu
t. E
du
.W
AS
HS
oc
ial
Pro
t.
Excerpt from the Tanzania Stakeholder &
Nutrition Action Mapping

9
2. Which stakeholders are doing what where?
Sahel
Centre-
Nord
Est
Centre-Est
Centre-
Ouest
Boucle du
Mouhoun
Nord
Hauts-
Bassins
Cascades
Sud-Ouest
Centre
Plateau Central
Centre-
Sud
CICDOCDMIGRETMIMISOLASOSSIBTDH
Implementing partners’ geographic coverage for:
The promotion of optimal breastfeeding practices
DMIFDCMISOLA
ALIMAAMMIEHKIMISOLASEMUS
AfricareDMIFCIHELPMISOLA AES
MISOLAOCADESSCI
MLALMISOLA
MLAL
MISOLA
ABBEFAESGRETMISOLA
FDCMISOLA
CRMISOLA
ALIMAIBFANMISOLA
ACFDMIGRETHKIMISOLA
% of provinces covered in a region:
≤25%
>75%
>50 - ≤75%
>25 - ≤50%
n.d. No data
Number of implementing partners:
1-4
13-16
9-12
5-8
Excerpt from the Burkina Faso Stakeholder
& Nutrition Action Mapping

10
3. What % of districts are covered per region?
4. What % of the target group is covered per region?
RegionProvince coverage
Coverage of pregnant and
lactating women
Cascades
Centre
Centre-Est
Centre-Nord
Centre-Sud
Est
Hauts-Bassins
National
97%
18%
1%
49%
54%
69%
5%
46%
Boucle du Mouhoun 21%
13/13Regions covered
Nord
Plateau Central
Sahel
Sud-Ouest
Centre-Ouest
Implementing partners’ geographic and population coverage for:
The promotion of optimal breastfeeding practices
21%
80%
75%
1%
40%
Excerpt from the Burkina Faso Stakeholder
& Nutrition Action Mapping
% of provinces covered in a region:
≤25%
>75%
>50 - ≤75%
>25 - ≤50%
n.d. No data
11
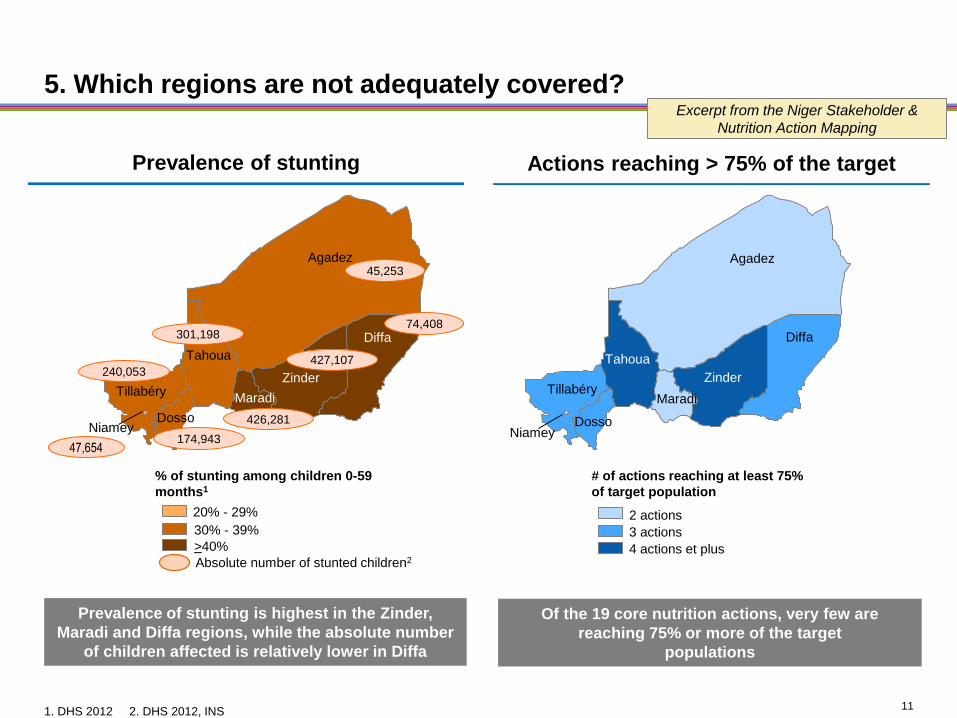
5. Which regions are not adequately covered?
Prevalence of stunting Actions reaching > 75% of the target
20% - 29%
30% - 39%
% of stunting among children 0-59
months1
2 actions
4 actions et plus
3 actions
# of actions reaching at least 75%
of target population
>40%
1. DHS 2012 2. DHS 2012, INS
Absolute number of stunted children2
Agadez
Zinder
Tahoua
TillabéryMaradi
Diffa
DossoNiamey
Agadez
Zinder
Tahoua
TillabéryMaradi
Diffa
DossoNiamey
45,253
74,408301,198
240,053427,107
426,281
174,94347,654
Prevalence of stunting is highest in the Zinder,
Maradi and Diffa regions, while the absolute number
of children affected is relatively lower in Diffa
Of the 19 core nutrition actions, very few are
reaching 75% or more of the target
populations
Excerpt from the Niger Stakeholder &
Nutrition Action Mapping
12
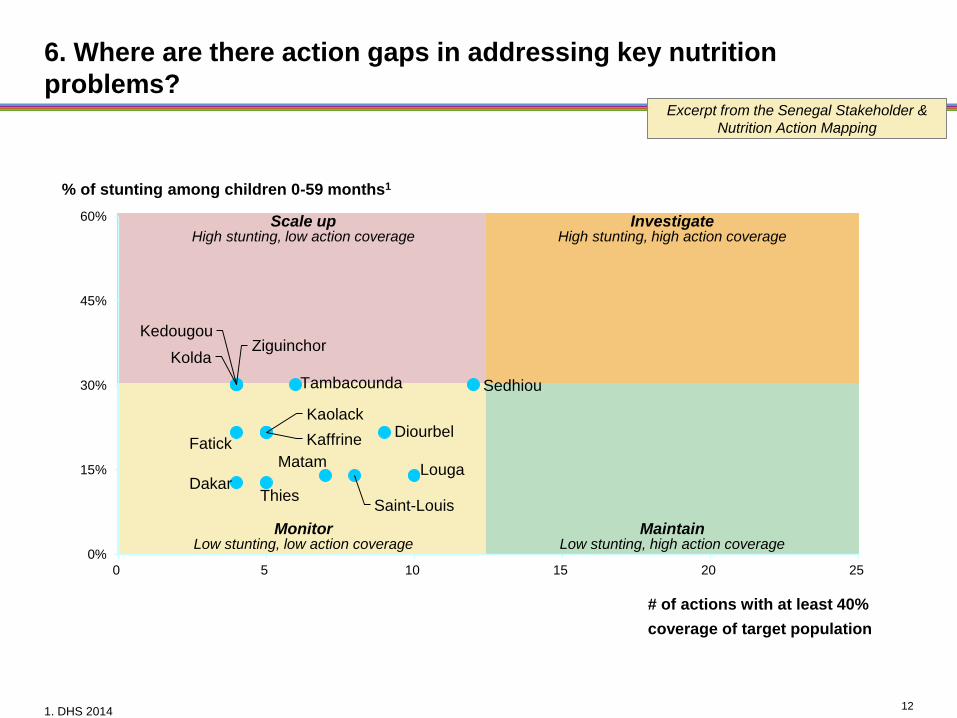
6. Where are there action gaps in addressing key nutrition
problems?
Dakar
DiourbelFatick Kaffrine
Kaolack
Kedougou
Kolda
LougaMatam
Saint-Louis
SedhiouTambacounda
Thies
Ziguinchor
0%
15%
30%
45%
60%
0 5 10 15 20 25
MaintainLow stunting, high action coverage
InvestigateHigh stunting, high action coverage
Scale upHigh stunting, low action coverage
MonitorLow stunting, low action coverage
# of actions with at least 40%
coverage of target population
% of stunting among children 0-59 months1
1. DHS 2014
Excerpt from the Senegal Stakeholder &
Nutrition Action Mapping

13
7. Is the target group coverage improving over time?
Trend1
Coverage1
Po
sit
ive
tre
nd
Ne
ga
tive
tren
d
Source: Sector information, surveys, REACH analysis 12014 vs. Baseline (2012 or 2011) 2FP = Family Planning 3ANC = Antenatal care 4IPTp = intermittent preventive treatment during pregnancy 5ARV = antiretroviral 6HDDS = Household dietary diversity support 7VAS = vitamin A supplementation
16 actions
with
increased
coverage
6 actions
with
decreased
coverage
1 starting &
5 stagnating
SustainReverse negative
trend & strengthen
Attention & scale-up
0% 25% 50% 75% 100%
Is further investment needed in capacity development?
Are new delivery mechanisms needed? Is increased political support needed?
Quality of actions? Are the scale-up strategies being adopted effective?
ANC3 – Iron/Folic acid supple.
Flour fortification
Potable water (rural)
Potable water (urban)
Fortification of vegetable oil
Deworming children & adolescentsANC3 – 4 consultations
ANC3 – ARV5
Promotion of proper hygiene
Improved latrines (rural)
Improved latrines (urban)
Consumption of Vit. A-rich foods for children
HDDS6
VAS7 children 6-59 mo.
FP2 (new users)
FP2– Contraceptives
VAS7 post-partum
ANC3 - Deworming
ANC3 – IPTp4
Improved processing & storage
Demonstrations of improved technologies Consumption of iron-rich
foods for children
Nutrition edu.
materials
Training of teachers in nutrition edu.
Prevention of early pregnancy
Deworming children 12-59 mo.
Compl. feeding
Excerpt from the Mozambique Stakeholder
& Nutrition Action Mapping

14
Are targets achieved as defined in the national plan?
1
Nutrition-related actions Target groups
Provide iron-folic acid /
iron supplements
Provide multiple micro-
nutrient supplements
Pregnant women
15-49 years
Pregnant women
15-49 years2
Summary
coverage
(baseline)
Provide insecticide
treated bednets
Pregnant women
15-49 years3
Provide insecticide
treated bednets
Post-partum women
15-49 years4
Provide deworming
tablets
Pregnant women
15-49 years5
Carry out insecticide
sprayingHouseholds6
Promote small-scale
horticulture / crop div.Households7
Promote small-scale
animal husbandryHouseholds8
Annual targets
% Pop.
coverage
(2016)
% Pop.
coverage
(2017)
% Pop.
coverage
(2018)
% Pop.
coverage
(2020)
% Pop.
coverage
(2019)
XX% XX% XX% XX% XX%
XX% XX% XX% XX% XX%
XX% XX% XX% XX% XX%
XX% XX% XX% XX% XX%
XX% XX% XX% XX% XX%
XX% XX% XX% XX% XX%
XX% XX% XX% XX% XX%
XX% XX% XX% XX% XX%
% coverage
(baseline)
XX%
XX%
XX%
XX%
XX%
XX%
XX%
XX%
Etc. XYZ9 XX% XX% XX% XX% XX%XX%
Source
ABC
ABC
ABC
ABC
ABC
ABC
ABC
ABC
ABC
Illustrative – to be populated
with country data

15
The Scaling Up Nutrition Planning & Monitoring Tool comes in both
an excel version and a new web-based version
The excel tool is used to enter and store
data and PowerPoint templates are used
visualize the outputs
The web-based version uses DHIS2 to
collect, store and visualize data in a web-
based portal
The Excel tool has both a full version
and a lite version. The lite version
maps only geographic coverage.

16
Before starting the mapping exercise, gather input from key
stakeholders to tailor the mapping to your country
Conduct bilateral
consultations
Conduct workshops with
key stakeholders
Workshops with key stakeholders1 at national levelGroup discussion or 1-on-1s with key stakeholders1
Initial view of
stakeholder landscape
Articulation of mapping
scope & country specifics
Facilitator
Main steps:
• Establish a preliminary view of the stakeholder landscape
• Further develop a common understanding of the country
context
Facilitator
...
Main steps:
• Align stakeholders on mapping objectives & process,
including identifying technical lead and dedicated
mapping team
• Fine-tune initial view of stakeholder landscape
• Identify the core nutrition actions to be mapped,
specifying target groups and delivery mechanisms
• Agree on geographic level to be mapped (e.g. region,
district, etc.)
1Key stakeholders may include: gov’t representatives (incl. SUN focal point, members of MSP, focal points of ministries); UN Network for SUN & other UN
nutrition colleagues; colleagues from other SUN Networks incl. Civil Society Network Coordinator & other nutrition stakeholders
17
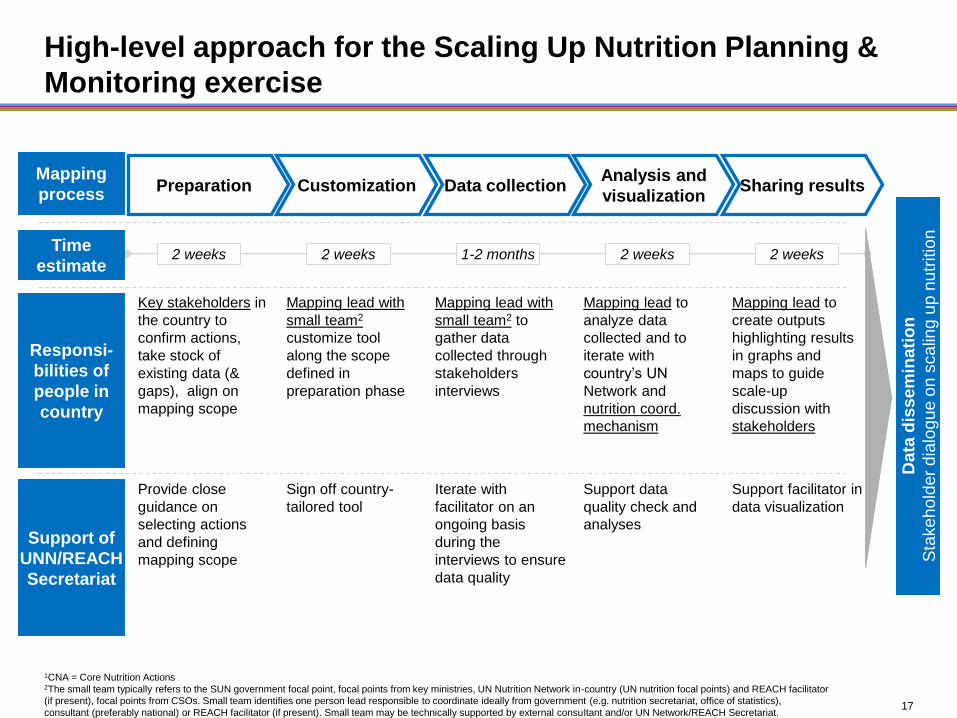
Provide close
guidance on
selecting actions
and defining
mapping scope
Sign off country-
tailored tool
Iterate with
facilitator on an
ongoing basis
during the
interviews to ensure
data quality
Support facilitator in
data visualization
Support data
quality check and
analyses
Key stakeholders in
the country to
confirm actions,
take stock of
existing data (&
gaps), align on
mapping scope
Mapping lead with
small team2 to
gather data
collected through
stakeholders
interviews
Mapping lead to
analyze data
collected and to
iterate with
country’s UN
Network and
nutrition coord.
mechanism
Mapping lead to
create outputs
highlighting results
in graphs and
maps to guide
scale-up
discussion with
stakeholders
Mapping lead with
small team2
customize tool
along the scope
defined in
preparation phase
High-level approach for the Scaling Up Nutrition Planning &
Monitoring exercise
Support of
UNN/REACH
Secretariat
2 weeks 2 weeks 2 weeks
1CNA = Core Nutrition Actions2The small team typically refers to the SUN government focal point, focal points from key ministries, UN Nutrition Network in-country (UN nutrition focal points) and REACH facilitator
(if present), focal points from CSOs. Small team identifies one person lead responsible to coordinate ideally from government (e.g. nutrition secretariat, office of statistics),
consultant (preferably national) or REACH facilitator (if present). Small team may be technically supported by external consultant and/or UN Network/REACH Secretariat.
Sharing resultsAnalysis and
visualizationPreparation Data collectionCustomization
Data
dis
sem
inati
on
Sta
kehold
er
dia
logue o
n s
calin
g u
p n
utr
itio
n
Mapping
process
Time
estimate
Responsi-
bilities of
people in
country
2 weeks1-2 months
18
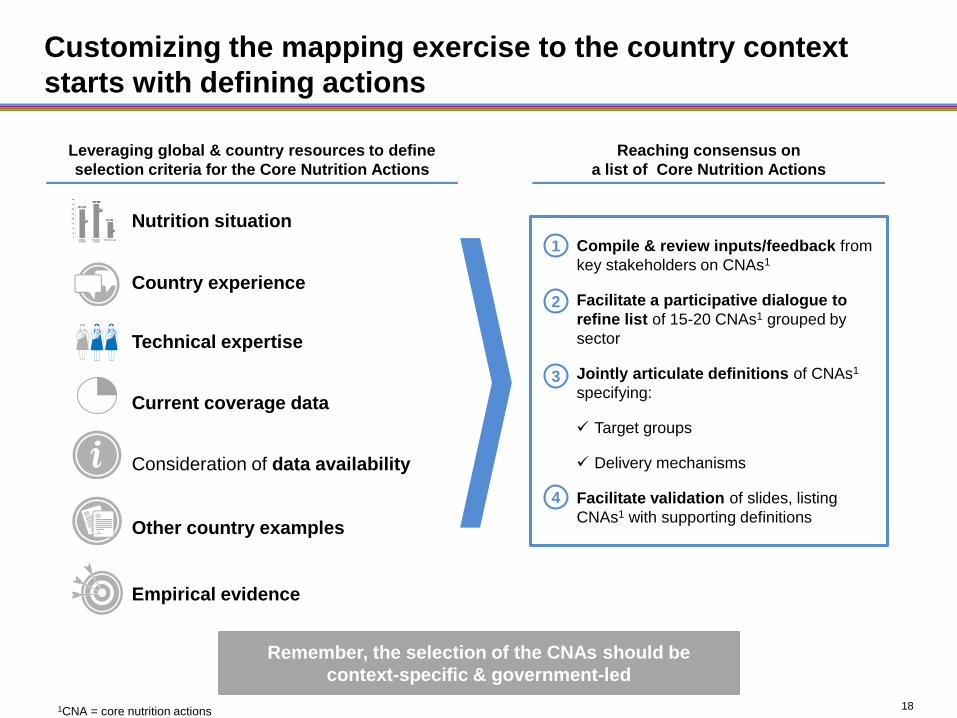
Leveraging global & country resources to define
selection criteria for the Core Nutrition Actions
Reaching consensus on
a list of Core Nutrition Actions
Remember, the selection of the CNAs should be
context-specific & government-led
Nutrition situation
Empirical evidence
Other country examples
Technical expertise
Country experience
Current coverage data
Compile & review inputs/feedback from
key stakeholders on CNAs1
Facilitate a participative dialogue to
refine list of 15-20 CNAs1 grouped by
sector
Jointly articulate definitions of CNAs1
specifying:
Target groups
Delivery mechanisms
Facilitate validation of slides, listing
CNAs1 with supporting definitions
Consideration of data availability
1CNA = core nutrition actions
1
2
3
4
Customizing the mapping exercise to the country context
starts with defining actions

Web-based Mapping Tool
Demo
20
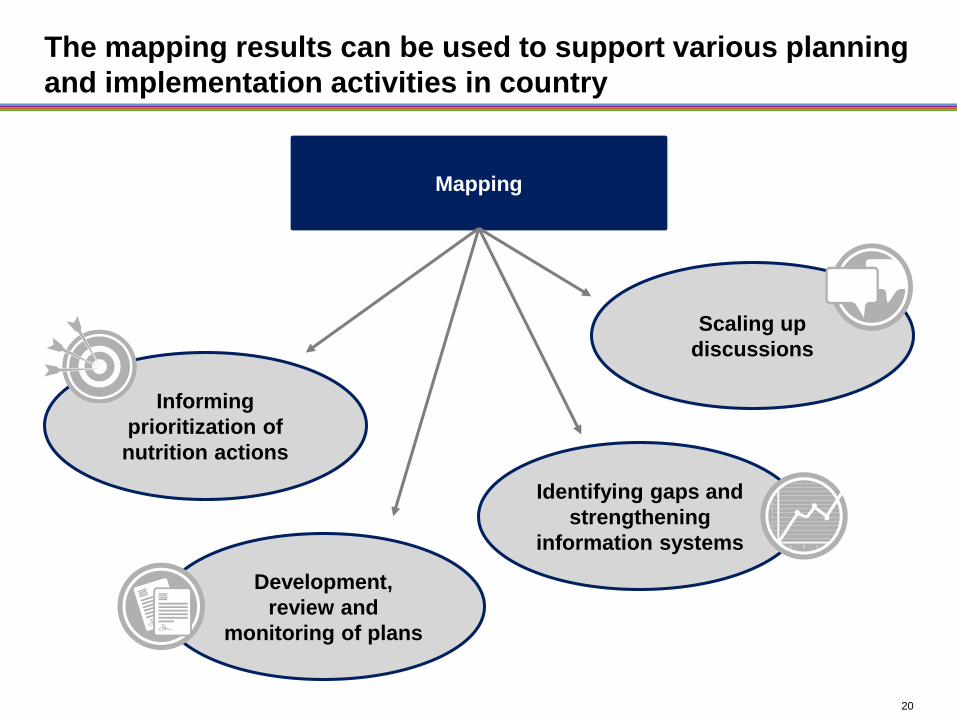
The mapping results can be used to support various planning
and implementation activities in country
Mapping
Informing
prioritization of
nutrition actions
Development,
review and
monitoring of plans
Identifying gaps and
strengthening
information systems
Scaling up
discussions
21
Development,
review and
monitoring of plans
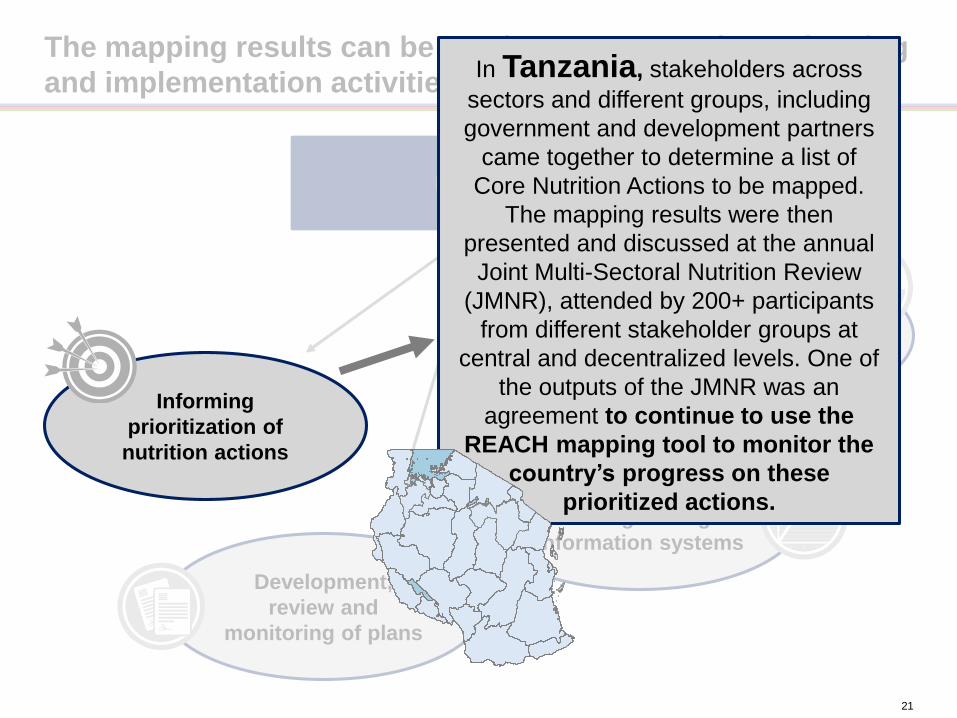
The mapping results can be used to support various planning
and implementation activities in country
Mapping
Identifying gaps and
strengthening
information systems
Scaling up
discussions
In Tanzania, stakeholders across
sectors and different groups, including
government and development partners
came together to determine a list of
Core Nutrition Actions to be mapped.
The mapping results were then
presented and discussed at the annual
Joint Multi-Sectoral Nutrition Review
(JMNR), attended by 200+ participants
from different stakeholder groups at
central and decentralized levels. One of
the outputs of the JMNR was an
agreement to continue to use the
REACH mapping tool to monitor the
country’s progress on these
prioritized actions.
Informing
prioritization of
nutrition actions

22
Informing
prioritization of
nutrition actions
Development,
review and
monitoring of plans
The mapping results can be used to support various planning
and implementation activities in country
Mapping
Identifying gaps and
strengthening
information systems
In Rwanda, the REACH mapping exercise
was used to inform prioritization
discussions about scaling-up nutrition.
The mapping looked at data from 2015 but
also included prospective data on the largest
nutrition programs taking place in the country
to understand the duration and coverage of
these programs in the near future.
Scaling up
discussions

23
Informing
prioritization of
nutrition actions
The mapping results can be used to support various planning
and implementation activities in country
Mapping
Identifying gaps and
strengthening
information systems
Scaling up
discussions
Development,
review and
monitoring of plans
The mapping of key nutrition interventions and
stakeholders supporting those interventions in
Burkina Faso was an important tool in the multi-
sectoral planning process. The exercise made it
possible to identify needs, launch a discussion on
scaling up interventions and mobilize sectors and
development partners around nutrition. Including the
development of the Multi-sectoral Nutrition
Strategic Plan.
24
Informing
prioritization of
nutrition actions
Development,
review and
monitoring of plans
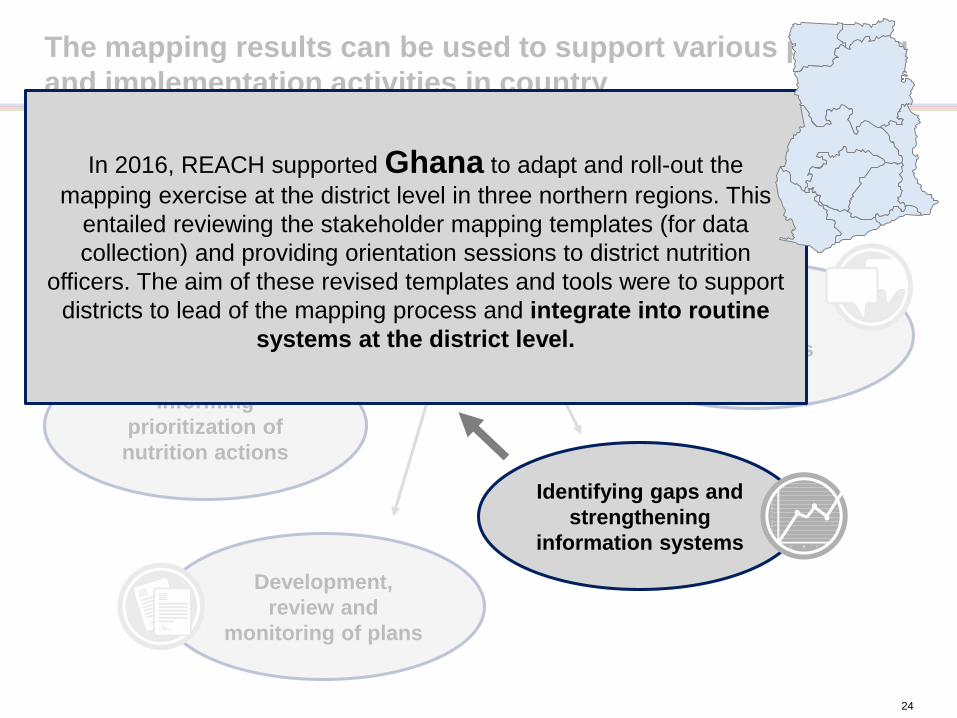
The mapping results can be used to support various planning
and implementation activities in country
Mapping
Scaling up
discussions
In 2016, REACH supported Ghana to adapt and roll-out the
mapping exercise at the district level in three northern regions. This
entailed reviewing the stakeholder mapping templates (for data
collection) and providing orientation sessions to district nutrition
officers. The aim of these revised templates and tools were to support
districts to lead of the mapping process and integrate into routine
systems at the district level.
Identifying gaps and
strengthening
information systems

25
How to get started?
Meet with country stakeholders to discuss whether and when to undertake the mapping exercise, outlining country-specific objectives
Contact the UN Network for SUN / REACH Secretariat for tools and guidance
Contact: [email protected]
The UN Network for SUN / REACH Secretariat
can support with:
• Tools
• Guidance
• Training and technical assistance
• Connecting with experienced consultants