multi-regional environmental io tables: progress of the
TRANSCRIPT

Multi-Regional Environmental IO Tables: Progress of the CREEA projectProf. Arnold Tukker, TNO, Delft, Netherlands and NTNU, Trondheim, Norway, and CREEA teamProject Manager EXIOPOL and CREEAE-Frame Workshop, Groningen, Netherlands, 17-18 July [email protected]
This work and other key projects on Global MR EE IO have been just published in a Special Issue of Economic Systems Research, 2013 (25) 1, edited by Arnold Tukker and Erik Dietzenbacher

Background ElementsCREEA: Compiling and refining environmental and economic accountsEU FP7, 2011-2014, 3.5 Mio EuroBackground
Arnold: TNO, NTNU, Leader of EU funded MR EE IO projects of EXIOPOL and CREEAPartners TNO, CML, WI, SERI, EU DG JRC IPTS, NTNU, 2-0 LCA, ETH, TU Twente (Water Footprint), CBS, SCB, EFI
This and other key projects on MR EE IO just published in a Special Issue of Economic Systems Research, 2013 (25) 1

CREEA is part of a broader portfolio of 15 Mio Euro1. Goal: building the most ambitious macro-database for economic global relations,
emissions and resource use, and the most ambitious global economic model 2. Role of each project (3 Mio each, TNO leads)
EXIOPOL: first version of the database, TNO government money: first version of a dynamic CGE modelCREEA: creates global Monetary, Physical and Energy SUTDESIRE: builds time series that can calibrate our modelCARBON CAP: uncertainty assessment for consumption based climate policyEMINIMM: allows adding diffusion of innovation to the modelPOLFREE: will align our model with an environmental model, and will allow to sophisticate policy scenarios / parametersDG ENV Resource efficiency flagship: very visible application of the modelCOMPLEX: integrating into an IA model
3. Some other ideas:Composition of 400 products with critical materials (AERTOS project, in part)Improve data on taxes, link with transport databases, GIS databases Deal with price volatilty and price changes of commodities
10 januari 2011M Bouman TNO Nieuwe huisstijl
2

What you need: detailed Multi-Regional EE SUT SUT/IOT
Ideal solution: a database that links
country SUT/IOT via trade
Country SUT/IOT including value
added and final demand (red)
Import and export trade matrices
(green)
Exensions: emissions, energy,
materials (grey)
Solves ‘pollution embodied in trade’
Ideally as economic and energy /
material MR SUT at high detail
Some 4-5 MR EE IO available now,
see ESR review
Y*,A Y*,B Y*,C Y*,D q
ZA,A ZA,B ZA,C ZA,D YA,A YA,B YA,C YA,D qA
ZB,A ZB,B ZB,C ZB,D YB,A YB,B YB,C YB,D qD
ZC,A ZC,B ZC,C ZC,D YC,A YC,B YC,C YC,D qC
ZD,A ZD,B ZD,C ZD,D YD,A YD,B YD,C YD,D qD
W WA WB WC WD
g gA gB gC gD
CapitalA CB CC CDLaborA LB LC LDNAMEAA NAMEAB NAMEAC NAMEAD
AgricA AgricB AgricC AgricDEnergyA EnergyB EnergyC EnergyDMetalA MetalB MetalC MetalDMineralA MineralB MineralC MineralDLandA LandB LandC LandD
Industries
Prod
ucts
C & L
Environ Ext

Main steps1: Make harmonized EE SUT (EU27+16 others, RoW)
130 sectors & products 30 emissions, 80 resources, 60 IEA energy carriers, land, waterCreate physical and energy SUT via prices, physical databases
2: Link via trade to global MR EE SUT3: Make global pxp and ixi MR EE IOT by collapsing MR EE SUT

CREEA WP3, water accounts• Physical Water SUT for a test country (Netherlands)• Valuation methods with regard to water extraction• Water quality accounts with regard to chemical and thermal pollution• Dataset for EXIOBASE: water use by 160 sectors for 43 countries
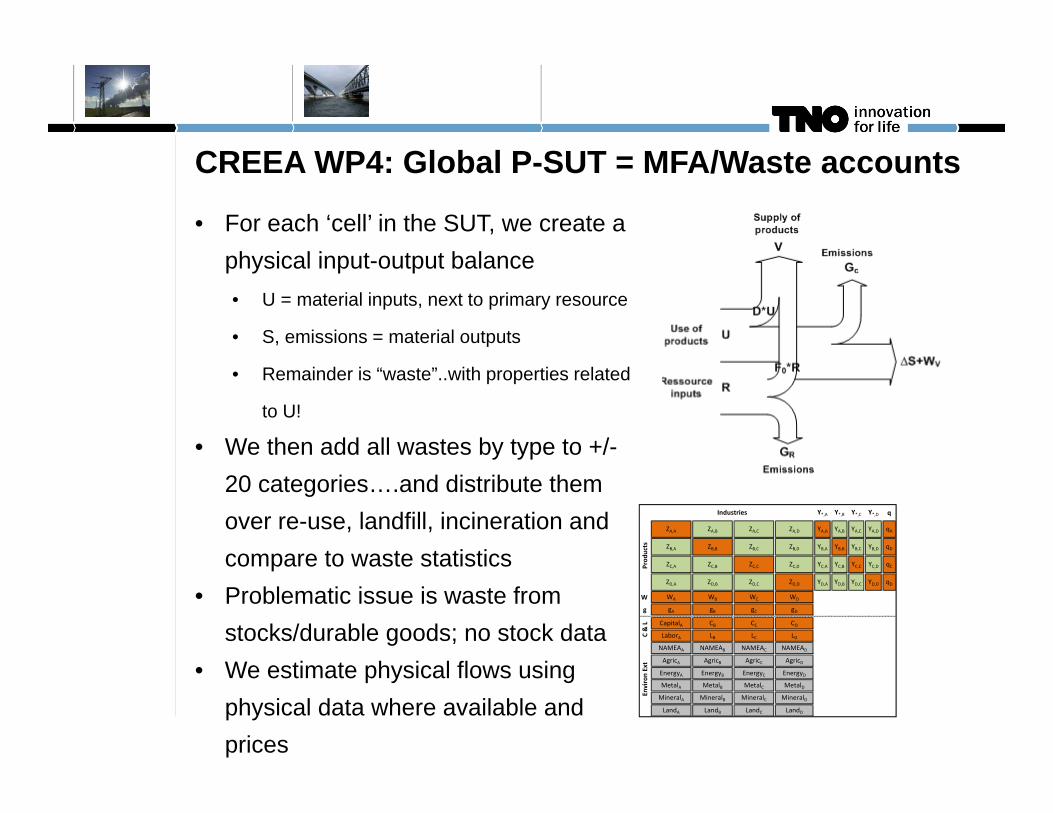
CREEA WP4: Global P-SUT = MFA/Waste accounts
• For each ‘cell’ in the SUT, we create a physical input-output balance• U = material inputs, next to primary resource
• S, emissions = material outputs
• Remainder is “waste”..with properties related
to U!
• We then add all wastes by type to +/-20 categories….and distribute them over re-use, landfill, incineration and compare to waste statistics
• Problematic issue is waste from stocks/durable goods; no stock data
• We estimate physical flows using physical data where available and prices
Y*,A Y*,B Y*,C Y*,D q
ZA,A ZA,B ZA,C ZA,D YA,A YA,B YA,C YA,D qA
ZB,A ZB,B ZB,C ZB,D YB,A YB,B YB,C YB,D qD
ZC,A ZC,B ZC,C ZC,D YC,A YC,B YC,C YC,D qC
ZD,A ZD,B ZD,C ZD,D YD,A YD,B YD,C YD,D qD
W WA WB WC WD
g gA gB gC gD
CapitalA CB CC CDLaborA LB LC LDNAMEAA NAMEAB NAMEAC NAMEAD
AgricA AgricB AgricC AgricDEnergyA EnergyB EnergyC EnergyDMetalA MetalB MetalC MetalDMineralA MineralB MineralC MineralDLandA LandB LandC LandD
Industries
Prod
ucts
C & L
Environ Ext
CREEA WP5: Forest accounts
• TASK 5.1: Revising the proposed SEEA 2012 methodology for forests• TASK 5.2: Developing procedures for integrating national forest data
into the proposed SEEA 2012 framework • TASK 5.3: testing the methodology by data gathering for selected
countries• Each task corresponds to a deliverable in the project• Rather stand alone deliverable

CREEA WP6: Kyoto accounts• Mapping IEA energy database on MR SUT and emission calculation
• IEA format -> SUT
• Territorial to residence
• IEA product classification now harmonized with EXIOBASE 2.0; IEA industries need
correspondence with more detailed EXIOBASE
• Allocation: mix of physical and economic coefficients (latter assuming price
homogeneity of Use)
• UNFCCC emission factors give emissions
• Other emissions similar approach
• Land use cover change: tested for Annex 1, not certain for others• Experimental inclusion of Emission trading schemes• Experimental analysis of response measures (e.g. taxation)

CREEA WP7, Integration in EXIOBASE • Detailing country SUT
• Use more detailed sector and product statistics to detail row and column totals
• Use additional information to estimate per sector supply and use co-efficiency (e.g. similar
country, LCI, IEA, Agrisams); Use detailed trade data to split trade
• …then harmonize with a RAS alike procedure…or iron out incompatibilities (e.g. there is
sure Use, but no domestic Supply nor imports -> imports may be wrong)
• Add extentions, ‘peg’ energy & physical accounts (part integrated in detailing using price assumptions and using physical supply/use totals)
• Link via trade• Distribute imports via trade shares to countries of origin, estimate freight & insurance
margins with global transport databases
• Then usually the implicit exports do not match exports in SUT (mismatch at differen levels:
total global export // global import; export // import by product globally; exports in country
SUT not equal to implicit exports -> there are differences that must be removed!
• Give slack to trade shares and optimize differences
• Store inevitable differences in inventories or ‘difference’ column

What CREEA has created: EXIOBASE 2.0• A global MR SUT with extensions for 2007
• 160 sector and 180 products by country• Trade linked• Not only monetary MR SUT, but also energy MR SUT (probably
good, IEA based) and material MR SUT (somewhat problematic)• 43 countries and 5 ‘rest of continents’• 80 resources, 40 emissions• Nice tool to analyse resource-efficiency at sector, country and
global scale including geographical trade offs

CREEA cases – just started. Some EXIOPOL results Eurostat EU 27 EE SUT/IOT on carbon footprintOne caveat
‘Domestic Technology Assumption” -> EU seems carbon-neutral in trade….
…where other studies show carbon in imports is a factor 2-3 higher as in exports…..EXIOPOL can make such calculations for all 110 extensions Net carbon trade EU. Peters et al, PNAS, 2010

EXIOPOL results
Pollution embodied in EU27 imports and exports relative to pollution driven by final demand, 2000Europe relies heavily on land, water, and material use abroad where product policy focuses mainly on energy issues
0%
10%
20%
30%
40%
50%
60%
70%
Trade
Externa
l cos
tsLa
nd fo
otprin
tNet
Energy
Use
Water C
onsu
mption
Blue
Water C
onsu
mption
Gree
n
Domes
tic Extr
actio
n Use
d
Unuse
d Dom
estic
Extrac
tion
Acidific
ation
Eutrop
hicati
on
GWP
Category
% R
elat
ive
to fi
nal d
eman
d
Import by EU
Export by EU

Conclusion
• UN SEEA 2013 suggests SUT/IOT as the way to organise economic and environmental data in a consistent framework
• EXIOPOL, CREEA show the power of having such a consistent dataset
• Main problem is harmonization across data suppliers• SUT (NSIs): please provide valuation layers• Energy & Physical data (e.g. IEA, FAO): use standard product &
industry classifications• Emission data (e.g. UNFCCC, CLRTAP): idem• Trade (UN COMTRADE): solve mirror statistics puzzle
• EXIOBASE available for a not for profit fee at www.exiobase.eu• Allows us to update; we further envisage ‘flagging’ harmonization
problems to primary data suppliers so that they can improve

THANKS FOR YOUR ATTENTION!

What is needed for more formal MR EE IO tables?Linking country tables to a global MR SUT/IOT is not the problem
EXIOBASE creates this in 20 minutes from country tables and trade dataHas a flexible set up with regard to sector classifications
The problem is (harmonized) data:SUT & IOT (NSIs)
Make valuation layers available – particularly EU must have them….Use harmonized sector classifications where possible – really!
Trade (UN, WB, OECD, NSIs)Put effort in harmonization (‘mirror statistics puzzle’ in UN COMTRADE)Start work on service trade sets…..
Physical data (energy – IEA; agro-food: FAO)It helps to use CPC as product classification in FAOSTAT and IEAIEA: ideally, try to move to an industry classification based on ISIC…and move from territorial to resident principle
Potential collaboration with the statistical world1. There seems interest from UN SD, WB, others to work on MR IO
Project partners from EXIOPOL, EORA, WIOD could helpSharing e.g. EXIOBASE trade linking routineSharing experiences with data harmonizationCf Eurostat’s official EU27 EE SUT build by EXIOPOL&WIOD staff
2. Countries build own EE SUT/IOT but face pollution embodied in tradeA joint WG of NSIs and researchers could link and harmonize such initiatives, compare OECD WG on Material Flow AnalysisCREEA can offer some funds to support this,,,,,,,would there be interest? What would be a good host ? (e.g. UNCEAA, London Group, UNEP SETAC LCI, OECD….)
3. Support to countries with less data seems feasible tooEXIOPOL, EORA had to develop many gap filling routinesCrude but usable EE SUT probably can be estimated with FAOSTAT, IEA and macro-economic data

What kind of results can you get ?Calculating most pressures:
Carbon, water, land & ecological footprintMFA indicatorsEtc.
With one consistent data set:Production perspective: by sector / countryConsumption perspective: by product, pollution in trade
Resource and energy efficiency at sector level
Cross-sector comparisonCross-country comparison by sector
0%
10%
20%
30%
40%
50%
60%
70%
Trade
Externa
l cos
tsLa
nd fo
otprin
tNet
Energy
Use
Water C
onsu
mption
Blue
Water C
onsu
mption
Gree
n
Domes
tic Extr
actio
n Use
d
Unuse
d Dom
estic
Extrac
tion
Acidific
ation
Eutrop
hicati
on
GWP
Category
% R
elat
ive
to fi
nal d
eman
d
Import by
Export by

What you can calculate with EE SUT and IOT
EU EIPRO (480 sector EE IOT)Priority setting of productsProved that food, mobility and housing were prio’s
EU Diet changeChange to healthy diets by changing demand vectorShowed rebounds by linking EE IOT to the CAPRI model
Limitations of official data in EUSector detail (60+)Emissions (few or absent)Imports estimated by ‘domestic technology ass’ Tukker et al., 2011, Ecological Economics (in press)
Tukker (ed., 2006), Journal Industrial Ecology 10: 3

Relations between SUT and IOT
Figure courtesy of Jose Rueda Cantuche, EU DG JRC IPTS, Sevilla, Spain

Major (research) initiatives in creating (Global) MR EE SUT/IOT

SUT/IOT: official UN ‘SEEA 2013’approach to organise environmental and economic data
EE SUT for a single country
Economic Supply and Use
By industry: emissions, primary resource use
Imports, exports
Can provide you
Per final use category: value added by industry
With impact per Euro per industry known: life
cycle impacts per final use category
Relation with MFA, LCA
‘Disaggregated MFA’: splits material flows of
one country into sectors & products (& stocks)
‘Aggregated LCA’: is an LCA at sector rather
than unit process level