mssl-winds-pp-10002 wind proposal issue 1
TRANSCRIPT


Mullard Space Science Laboratory, University College London, Holmbury St Mary, Dorking, RH5 6NT, United Kingdom, Tel: +44 1483 204100, e-mail: [email protected]
WINDS
Demonstrating how to map the Earth’s Winds – 24 hours per day A proposal to the ESA EE-8 opportunity May 2010 Principal Investigator: Prof Jan-Peter Muller University College London, UK Co-Investigators: Dr Chris Chaloner SEA: Systems Engineering & Assessment Ltd, Frome, UK Prof Jürgen Fischer FUB: Institut für Weltraumwissenschaften, Freie Universität Berlin, D Dr Iliana Genkova KNMI: Royal Netherlands Meteorological Institute, NL
Dr Akos Horvath MPI-M: Max Planck Institüt für Meteorologie, Hamburg, D Dr Stefano Migliorini University of Reading, UK Dr Roger Saunders Met Office, UK Dr Gabriela Seiz MétéoSwiss, CH Dr Ad Stoffelen KNMI: Royal Netherlands Meteorological Institute, NL Dr Dong Wu NASA Jet Propulsion Laboratory, Pasadena, USA
Title: WINDS Proposal to ESA Doc. No. MSSL/WINDS/PP/10002 issue 1
Page ii
Contents 0 Executive summary ................................................................................................................ 1 1 Introduction ............................................................................................................................. 3 2 Applicable documents............................................................................................................ 3 3 Definitions and Abbreviations ............................................................................................... 3
3.1 Definitions........................................................................................................................ 3 3.2 Abbreviations .................................................................................................................. 3
4 Scientific objectives, requirements and justification .......................................................... 7 4.1 Mission Objectives.......................................................................................................... 7 4.2 Science requirements for wind measurements............................................................ 8 4.3 Operational requirements............................................................................................... 9
4.3.1 EUMETSAT Post-EPS .............................................................................................. 9 4.3.2 Numerical Weather Prediction (NWP) ..................................................................... 10 4.3.3 Climate .................................................................................................................... 11 4.3.4 Nowcasting.............................................................................................................. 11 4.3.5 MISRlite................................................................................................................... 13
4.4 Mission duration and relationship to other missions................................................ 14 4.5 Geophysical variables and data products .................................................................. 15 4.6 Development status of retrieval algorithms ............................................................... 17
4.6.1 MISRlite retrieval algorithm ..................................................................................... 17 4.6.2 O2 A-band retrieval algorithm .................................................................................. 20
4.7 Assessment of MISR SMVs compared with AMVs, ECMWF winds, and lidar heights ........................................................................................................................................ 22 4.8 Relevance to ESA Living Planet Programme ............................................................. 25 4.9 Relevance to other programmes ................................................................................. 25
5 Mission assumptions and technical requirements............................................................ 27 5.1 Overview ........................................................................................................................ 27 5.2 Observation techniques ............................................................................................... 27
5.2.1 MISRlite................................................................................................................... 27 5.2.2 Oxygen A-band ....................................................................................................... 30 5.2.3 Onboard processing ................................................................................................ 30
5.3 Mission Requirements .................................................................................................. 31 5.3.1 General.................................................................................................................... 31 5.3.2 Prime Science Requirements .................................................................................. 31 5.3.3 Secondary Requirements........................................................................................ 31
5.4 Requirements on the spacecraft and constellation ................................................... 31 5.4.1 Primary Requirements............................................................................................. 31 5.4.2 Secondary Requirements........................................................................................ 32 5.4.3 Orbit Requirements ................................................................................................. 32 5.4.4 Constellation requirements...................................................................................... 32

Title: WINDS Proposal to ESA Doc. No. MSSL/WINDS/PP/10002 issue 1
Page iii
5.4.5 Instrument Requirements ........................................................................................ 33 5.4.5.1 General................................................................................................................ 33 5.4.5.2 MISRlite ............................................................................................................... 33 5.4.5.3 Oxygen A-band sensor........................................................................................ 33 5.4.5.4 Data Processing Unit........................................................................................... 33 5.4.5.5 Constellation Instrument Requirements .............................................................. 33
5.4.6 Spacecraft System requirements ............................................................................ 33 5.4.6.1 Orbital Propulsion ................................................................................................ 33
5.4.7 Downlink requirements............................................................................................ 33 5.5 Ground Data processing requirements....................................................................... 34
6 Proposed mission architecture ........................................................................................... 35 6.1 Space Segment.............................................................................................................. 35
6.1.1 Payload ................................................................................................................... 35 6.1.1.1 MISRlite ............................................................................................................... 35 6.1.1.2 Oxygen A-band sensor........................................................................................ 41 6.1.1.3 Onboard Data Processing ................................................................................... 44 6.1.1.4 Summary of Instrument Resource Requirements ............................................... 46
6.1.2 Spacecraft ............................................................................................................... 46 6.1.2.1 Introduction.......................................................................................................... 46 6.1.2.2 System Design .................................................................................................... 46 6.1.2.3 Subsystems ......................................................................................................... 47 6.1.2.4 Budgets ............................................................................................................... 48
6.1.3 Launcher ................................................................................................................. 50 6.1.4 TRL status ............................................................................................................... 51
6.2 Ground Segment ........................................................................................................... 56 6.2.1 General.................................................................................................................... 56 6.2.2 Integrated Processing Facility (IPF) ........................................................................ 57 6.2.3 TRL status ............................................................................................................... 58
6.3 Mission Analysis and Operations Concept ................................................................ 58 6.3.1 Introduction.............................................................................................................. 58 6.3.2 Constellation Analysis ............................................................................................. 58
6.3.2.1 Constellation Definition........................................................................................ 58 6.3.2.2 Coverage Percentage.......................................................................................... 59
6.3.3 Demonstrator Mission Orbit..................................................................................... 61 6.3.3.1 Orbit and Operations ........................................................................................... 61 6.3.3.2 EarthCARE Formation flying ............................................................................... 62 6.3.3.3 Disposal............................................................................................................... 62
6.3.4 Operations Strategy ................................................................................................ 63 6.4 OSSE .............................................................................................................................. 63
7 Programmatic elements ....................................................................................................... 66 7.1 Design, Development and Verification Plan ............................................................... 66
Title: WINDS Proposal to ESA Doc. No. MSSL/WINDS/PP/10002 issue 1
Page iv
7.1.1 Overall ..................................................................................................................... 66 7.1.1.1 Design and Development .................................................................................... 66 7.1.1.2 AIV....................................................................................................................... 66
7.1.2 Payload ................................................................................................................... 66 7.1.2.1 MISRlite ............................................................................................................... 66 7.1.2.2 OABS................................................................................................................... 66 7.1.2.3 WAPU.................................................................................................................. 67 7.1.2.4 Summary ............................................................................................................. 67
7.1.3 Spacecraft ............................................................................................................... 67 7.1.4 Phase-A organisation .............................................................................................. 68 7.1.5 Phase-BCD organisation......................................................................................... 68 7.1.6 Schedule ................................................................................................................. 68
7.2 Cost Estimate ................................................................................................................ 69 7.2.1 Science Team ......................................................................................................... 69 7.2.2 Payload ................................................................................................................... 69 7.2.3 Spacecraft ............................................................................................................... 69 7.2.4 Cost Summary......................................................................................................... 70
Annex A: Role of CoIs in the science team Annex B: List of references Annex C: Letter of Support from EUMETSAT Annex D: WINDS team CVs Annex E: Cost information Annex F: Phase-A risk register

WINDS Demonstrating how to map the Earth’s winds 24h per day
WINDS Investigation Summary
WINDS is a demonstrator mission to measure winds using the multiview stereo technique. WINDS
(1) will provide stereo heights, which are more accurate than the heights obtained with current Atmospheric Motion Winds (AMVs);
(2) allow creation of higher resolution winds for assimilation in regional high-resolution models to depict mesoscale dynamic processes;
(3) close the gap between geostationary and polar satellite AMVs, especially between 55-75º;
(4) give spin-off benefits for volcanic ash heights
Data Products
Main products are winds and heights of individual cloud features along with optional smoke and ash cloud plume detection. Secondary products such as sea surface temperatures, forest fire “hotspots” and urban heat island delineation are also feasible.
Observational Techniques
WINDS will measure wind speeds and cloud heights using the multiview stereo technique proven by the visible MISR instrument on TERRA. Multiple views of the cloud scene are compared over the 7min overflight time of the spacecraft. An IR sensor will be used so that operations occur night and day. Additionally an Oxygen A-band sensor detects the height of low altitude clouds by a power ratio within the spectral band, a technique proven on the MERIS instrument on Envisat. An onboard data processing system computes and transmits the winds and heights in real time.
Spacecraft
The WINDS spacecraft will use off the shelf technology to reduce risk and cost. The target mass for the spacecraft is 100kg. The aim of the mission is to show that a simple, low spacecraft can deploy the instruments needed for the wind speed measurements.
MISRlite
MISRlite uses five sets of broadband bolometer detectors to give the five views (0º, ±30º, ±57º) needed for cloud height and speed measurement plus two additional narrow band channels for smoke or ash plume detection. A proven detector from INO is used, 25 units being assembled into an uncooled focal plane 2500 pixels wide. A single wide field of view optic is used to give a swath of 1500km and average pixel size of 600m. Data compression is carried out in the readout electronics.
Oxygen A band Sensor
This instrument has three narrow spectral channels in the 760nm Oxygen A band plus two wider reference channels. A filter spectrometer is readout by a standard CCD. A calibration system is required. The swath width is 1500km, with the 1000 pixels giving a ground pixel size of 1.5km.
On-board processing
The onboard processor unit processes the MISRlite and Oxygen sensor data in real-time to calculate the wind speeds and cloud heights. The data can then be down-linked in real time for fast assimilation into numerical weather nowcasting models.
Ground Segment
WINDS requires a simple ground segment. The raw data is downlinked once per orbit and transmitted to the data centre where the wind vectors and heights are calculated. The target is to transmit the processed data to the user within 120 minutes of data capture on-board.
Constellation
The WINDS mission will prove the technology for a constellation of eight spacecraft that would measure the winds across the globe every 3 hours.

Title: WINDS Proposal to ESA Doc. No. MSSL/WINDS/PP/10002 issue 1
Page 1
0 Executive summary Studying the dynamics of the Earth’s atmosphere is critical to improving weather forecasts, both nowcasts and short and medium-range weather forecasts. There is a required synergy between climate research needs and those in NWP (Numerical Weather Prediction), because climate studies are increasingly using analyses of atmospheric (and other) fields from data assimilation systems that were designed originally to provide initial conditions for operational weather forecasting models. Even with recent advances in the assimilation of satellite radiances, wind is still a critical parameter for data assimilation and NWP because of its unique role in specifying the turbulent transport and mixing properties of the atmosphere. Scientific applications are severely limited by the lack of directly measured three-dimensional wind information over the oceans, the tropics, the polar regions, and the southern hemisphere and where other meteorological observations are scarce. Large analysis uncertainties remain over wide areas of the globe, especially for the three-dimensional tropospheric wind field. Complementary to a lidar wind profiler, the enhanced horizontal and temporal resolution would be beneficial, along side improved height assignment with respect to AMV (Atmospheric Motion Vector wind) imagers, in order to increase the skill of forecasting dynamic weather and convective systems at mesoscale. Additionally it would improve the model representation of the storm tracks and cyclogenesis (e.g. for polar lows). EUMETSAT Post-EPS planning for 2018-2033 (see letter of support in Annex C) and the US NRC Earth Sciences Decadal Survey for 2010-2025 noted in 2005 that “Tropospheric winds are the number one unmet measurement objective for improving weather forecasts…Reliable global analyses of three-dimensional tropospheric winds are needed to improve the depiction of atmospheric dynamics, transport of air pollution, and climate processes.” Satellite AMVs derived from geostationary satellites up to ±55º of latitude and over the poles (from 75-90º of latitude) from polar-orbiting satellites have long been used in data assimilation for the improvement of weather forecasts. The dynamics of small-scale tropical circulation, especially severe weather systems such as hurricanes, and of atmospheric boundary layer clouds are poorly represented in AMVs. AMVs also have poor vertical height accuracy due to the use of water vapour imagery at 6.7µm and errors in converting brightness temperatures into heights. As weather forecasts improve in resolution down to 1km and timeliness to a matter of minutes, information on these small-scale processes becomes more and more important. The WMO (World Meteorological Organisation) in their latest Rolling Requirements Review have defined requirements for wind and height at various atmospheric scales, and these requirements will be met by the proposed WINDS mission concept. WINDS will complement existing observational platforms by providing winds in data sparse regions, particularly between 55-75º of latitude, and significantly improve height assignment with respect to AMVs Secondary science objectives of WINDS include measurement of sea surface temperature at multiple angles, discrimination of SO2 and volcanic ash clouds using nadir 10.8 and 12.2µm channels and observations of forest fires and urban heat islands at high resolution. The WINDS mission aims to produce winds 24 hours per day at high horizontal resolution (down to 3km) by tracking clouds or plumes and simultaneously retrieving their height to 600m vertical accuracy and their advective wind-field to ≤3m/s. Building on the heritage of the UK (A)ATSR(2) conical scanner imagery and the 9-look NASA MISR (Multiangle Imaging SpectroRadiometer) instrument, the MISRlite (Multi-angle IR Stereo Radiometer) instrument will acquire Stereo Motion Vectors (SMVs) consisting of winds and heights 24 hours a day (day and night) using a novel 5-look system (±57º, ±30º and 0º) at thermal infrared wavelengths with a single set of wide angle optics for a 1500km swath width. Building on the heritage of the ESA MERIS instrument, the OABS (Oxygen A-Band Sensor) will provide cloud-top heights on a 1.2km grid at a greater accuracy (≈150m) than MISRlite for clouds below 3000m. These cloud-top heights can then be assigned to the MISRlite winds as well as providing a quality check on MISRlite heights for higher-level single layer clouds. The WINDS demonstrator mission proposed here will employ a single spacecraft in a sun-synchronous 12h local time orbit, flying at a nominal altitude of 850km using commercial off-the-shelf technology (COTS). Solar panels (non-deployable) will be used to provide 50W of power
Title: WINDS Proposal to ESA Doc. No. MSSL/WINDS/PP/10002 issue 1
Page 2
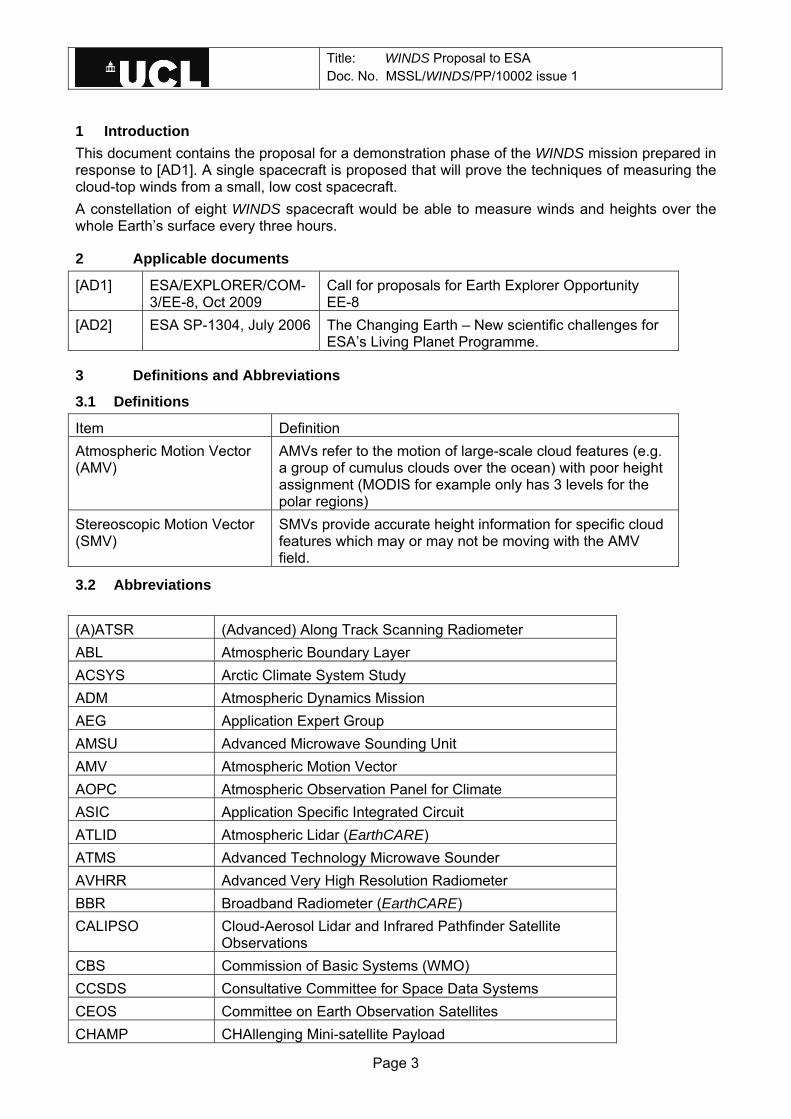
needed for the MISRlite and OABS sensors and for the first time an onboard processing capability to provide real-time wind information by radio transmission to remote areas threatened by severe weather systems. MISRlite will employ the world’s first microbolometer array qualified for spaceborne use which was originally developed for ESA by the Canadian INO® company and will be flown on the CSA-CONAE-NASA SACD/Aquarius mission in 2011. OABS will employ a 5-filter system for measuring precisely the A-band absorption at 0.76µm with a 1500km swath width during daylight hours for clouds and aerosols. Compared to MERIS, OABS will therefore feature additional spectral bands within the oxygen A-band and provide cloud and aerosol height retrievals with enhanced accuracy. In addition to onboard processing, data will be dumped once per orbit and processed into winds and heights within 30 minutes within the WINDS mission Data Centre and thence disseminated through the global telecommunications system based on the EUMETCAST protocols. Science data will be validated against other platforms, including background fields derived from meteorological forecast models, AMVs, radiosondes, ground-based lidar and radar, Doppler wind profilers and match-ups with the lidars onboard EarthCARE and ADM-Aeolus and their successors. Particular attention will be paid to the analysis of high resolution, small-scale and boundary-layer dynamical features which are not precisely captured by existing spaceborne wind measurement systems. If volcanic incidents occur with high SO2 or ash cloud content, and during the forest fire season at different regions of the planet at different times of year, small-scale wind and height measurements will be used to assess plume injection heights and subsequent transport of particulates in the atmosphere. The WINDS demonstrator mission will prove the technologies required for an operational constellation of WINDS spacecraft that will measure the winds everywhere on the globe every three hours.
Title: WINDS Proposal to ESA Doc. No. MSSL/WINDS/PP/10002 issue 1
Page 3
1 Introduction This document contains the proposal for a demonstration phase of the WINDS mission prepared in response to [AD1]. A single spacecraft is proposed that will prove the techniques of measuring the cloud-top winds from a small, low cost spacecraft. A constellation of eight WINDS spacecraft would be able to measure winds and heights over the whole Earth’s surface every three hours.
2 Applicable documents
[AD1] ESA/EXPLORER/COM-3/EE-8, Oct 2009
Call for proposals for Earth Explorer Opportunity EE-8
[AD2] ESA SP-1304, July 2006 The Changing Earth – New scientific challenges for ESA’s Living Planet Programme.
3 Definitions and Abbreviations
3.1 Definitions
Item Definition Atmospheric Motion Vector (AMV)
AMVs refer to the motion of large-scale cloud features (e.g. a group of cumulus clouds over the ocean) with poor height assignment (MODIS for example only has 3 levels for the polar regions)
Stereoscopic Motion Vector (SMV)
SMVs provide accurate height information for specific cloud features which may or may not be moving with the AMV field.
3.2 Abbreviations (A)ATSR (Advanced) Along Track Scanning Radiometer ABL Atmospheric Boundary Layer ACSYS Arctic Climate System Study ADM Atmospheric Dynamics Mission AEG Application Expert Group AMSU Advanced Microwave Sounding Unit AMV Atmospheric Motion Vector AOPC Atmospheric Observation Panel for Climate ASIC Application Specific Integrated Circuit ATLID Atmospheric Lidar (EarthCARE) ATMS Advanced Technology Microwave Sounder AVHRR Advanced Very High Resolution Radiometer BBR Broadband Radiometer (EarthCARE) CALIPSO Cloud-Aerosol Lidar and Infrared Pathfinder Satellite
Observations CBS Commission of Basic Systems (WMO) CCSDS Consultative Committee for Space Data Systems CEOS Committee on Earth Observation Satellites CHAMP CHAllenging Mini-satellite Payload
Title: WINDS Proposal to ESA Doc. No. MSSL/WINDS/PP/10002 issue 1
Page 4
CMW Cloud Motion Winds COSMIC Constellation Observing System for Meteorology,
Ionosphere and Climate CPR Cloud Profiling Radar CrIS Cross-track Infrared Sounder CTH Cloud Top Height CTP Cloud Top Pressure Cu Cumulus DWL Doppler Wind Lidar ECMWF European Centre for Medium-range Weather Forecast ENSO El Niño/Southern Oscillation EPS EUMETSAT Polar System EUMETSAT European Organisation for the Exploitation of
Meteorological Satellites GAW Global Atmosphere Watch GCOS Global Climate Observation System GEMS Global and regional Earth-system (Atmosphere) Monitoring
using Satellite and in-situ data GEO Geostationary Earth Orbit GEOSS Global Earth Observation System of Systems GMES Global Monitoring for Environment and Security GNSS Global Navigation Satellite Systems GOOS Global Ocean Observing System GOS Global Observing System GRAS GNSS Receiver for Atmospheric Sounding GTS Global Telecommunications System HIRS High Resolution Infrared Radiation Sounder HS&M High Stratosphere and Mesosphere (> 32 km or < 10 hPa) HT High Troposphere (5.5-16 km or 500-100 hPa) IASI Infrared Atmospheric Sounding Interferometer ICD Interface Control Document IFOV Instantaneous Field Of View IGACO Integrated Global Atmospheric Chemistry Observation
system IGOS Integrated Global Observing Strategy IPF Instrument Processing Facility IR Infra-Red ITAR International Traffic in Arms Regulations ITCZ Inter Tropical Convergence Zone JGOFS Joint Global Ocean Flux Study JPSS Joint Polar Satellite System KNMI Koninklijk Nederlands Meteorologisch Instituut
Title: WINDS Proposal to ESA Doc. No. MSSL/WINDS/PP/10002 issue 1
Page 5
LEO Low Earth Orbit LIDAR LIght Detection And Ranging LS Lower Stratosphere (16-32 km or 100-10 hPa) LT Lower Troposphere (0-5500 m or 1000-500 hPa) LUT Look Up Table MERIS Medium Resolution Imaging Spectrometer MHS Microwave Humidity Sounder MISR Multiangle Infrared Stereo Radiometer MISRlite Multiangle Infrared Stereo Radiometer Lite MMFI Multimission Facility Infrastructure MODIS Moderate Resolution Imaging Spectroradiometer MOMO Matrix Operator Model MSG Meteosat Second Generation MSI Multi-Spectral Imager (EarthCARE) MTG Meteosat Third Generation MW Microwave NR Nature Run NMS National Meteorological Service NOAA National Oceanic & Atmospheric Administration (US) NPOESS National Polar-Orbiting Operational Environmental Satellite
System (US) NPP NPOESS Preparatory Project NWC Nowcasting NWP Numerical Weather Prediction NWS National Weather Service OOPC Ocean Observations Panel for Climate OSSE Observation System Simulation Experiments PFM Processing Facility Management POES Polar Operational Environmental Satellites POLDER Polarization and Directionality of the Earth’s Reflectance
instrument POLIS RSMD QA Quality Assurance QC Quality Control QI Quality Index QM Quality Metric ROE ReadOut Electronics RRR Rolling Requirements Review Sc Stratocumulus SD Standard Deviation SGP Southern Great Plains

Title: WINDS Proposal to ESA Doc. No. MSSL/WINDS/PP/10002 issue 1
Page 6
SH Southern Hemisphere SMW Stereo Motion Vector SOM Stereo Oblique Mercator SPARC Stratospheric Processes and their Role in Climate SPR Software Problem Report UV Ultra-Violet WALES Water Vapour Lidar Experiment in Space WAPU Wind Algorithm Processor Unit WMO World Meteorological Organisation
Title: WINDS Proposal to ESA Doc. No. MSSL/WINDS/PP/10002 issue 1
Page 7
4 Scientific objectives, requirements and justification
4.1 Mission Objectives Presently, knowledge of the 3D wind field over large parts of the tropics and major oceans is incomplete. This leads to major difficulties both in studying key processes in the coupled climate system and in further improving the numerical weather forecast systems towards mesoscale dynamical processes. Progress in climate modelling is intimately linked to progress in numerical weather prediction (NWP), since the synthesis of the global observing system through NWP reanalyses has become an important vehicle for climate modelling. The wind measurements provided by WINDS are expected to demonstrate improvements in such atmospheric modelling and analysis. These advances will, in turn, enhance the long-term data-bases being created by NWP data assimilation systems to serve the climate research community. As such, WINDS promises also to provide data that are needed to address some of the key concerns of climate research, including climate variability, validation and improvement of climate models, and process studies that are relevant to climate change. The main benefits of WINDS for measuring 3D winds are as follows:
a. It provides stereo heights, which are potentially more accurate than the heights obtained with Atmospheric Motion Winds (AMVs);
b. Ability to create higher resolution winds for assimilation in regional high-resolution models to depict mesoscale dynamic processes;
c. Close the gap between geostationary and polar satellite AMVs; d. Spin-off benefits for volcanic ash etc.
These objectives are further detailed below. The WINDS mission is designed to develop, launch and run a pre-operational research/demonstration mission to advance our understanding of a specific Earth system process, the transfer of energy in dynamical weather systems downscale from solar heating inputs. The WINDS mission will include demonstration of new observation techniques for science and applications communities based on a very strong heritage of more than a decade of observations from the MISR instrument, 19 years of observations from (A)ATSR(2) stereo at thermal wavelengths and eight years of Oxygen A-band from MERIS. Assessment of the operational impact of WINDS measurements on NWP forecasts through data assimilation will be performed by European meteorological services including ECMWF, KNMI, UK Met Office and MétéoSwiss as well as by the joint NASA-NOAA Joint Center for Satellite Data Assimilation. A single spacecraft will be flown for the proposed demonstration mission which will be capable of retrieving wind fields with comparable spatio-temporal resolution and accuracy to the existing NASA EOS MISR instrument Stereo Motion Vectors (SMVs) with 600m height accuracy and wind retrievals to better than 3m/sec (see section 3.1 for definitions of AMV and SMV). An option is to add a second spacecraft and change the spacecraft design to enable station-keeping and active propulsion to create a tandem pair of identical spacecraft located some 200km along-track from each other. This tandem pair would include inter-satellite communications and onboard processing of very precise across-track winds (≤1 m/sec) and heights (≤300m). A direct broadcast from a spacecraft would then permit SMVs to be disseminated to weather services worldwide from onboard processing and once-per-orbit downloads to an ESA receiving station in the Arctic circle with a possible optional addition of a NASA receiving station in Antarctica. If feasible, the orbit could also be placed in tandem with the ESA EarthCARE spacecraft to allow continuous validation of cloud-top heights against the profile measurements from the EarthCARE lidar and radar. Alternatively, WINDS could be placed in an orbit to benefit from the synergy with the ESA ADM-Aeolus spacecraft. This will depend on mission lifetimes and the additional complexity of the ground segment for station-keeping multiple spacecraft. An Observing Systems Simulation Experiment (OSSE) will be used to assess the potential impact of WINDS data, the best possible non sun-synchronous orbit and the optimum future operational configuration for a constellation to provide global winds at synoptic time-scales. If opportunities
Title: WINDS Proposal to ESA Doc. No. MSSL/WINDS/PP/10002 issue 1
Page 8
arise for operational constellation deployment with, for example, the ESA Post-EPS or the private sector Iridium constellation, this OSSE will be applied for selection of the best combination of instruments and platforms. Stereo Motion Vectors (SMVs) will be obtained from tracking individual clouds and collections of cloud features at multiple height levels from multi-look thermal IR imagery. Height assignments for each SMV will be retrieved using stereo photogrammetric techniques and those from Oxygen A-band via Look Up Tables (LUTs) based on previous radiative transfer calculations. The stereo techniques and associated SMVs have been developed from over a decade of observations from the narrow-swath US NASA MISR visible wavelength instrument onboard the Terra platform in which the PI and two of the CoIs are closely involved. The Oxygen A-band technique has a strong heritage with the ESA MERIS instrument on Envisat and one of the WINDS Co-Is was responsible for pioneering the use of this technique. It has been demonstrated to provide state of the art retrievals of low single-layer cloud-top height as well as more recently retrievals of aerosol properties including plume-top heights (e.g. from volcanic ash clouds). Combining the data from both instruments will permit full retrievals over low-level clouds in daylight conditions. WINDS would lead to an operational constellation of multiple spacecraft that would measure the winds in all locations in globe, every three hours.
4.2 Science requirements for wind measurements Reliable instantaneous global analyses of winds are needed to improve the understanding of atmospheric dynamics and climate processes, and also to improve the quality of Numerical Weather Prediction (NWP) models, particularly at the mesoscale (from sizes of 5 kilometres to several hundred kilometres). Indeed there is a synergy between advances in climate-related studies and those in NWP, because climate studies are increasingly using analyses of atmospheric (and other) fields from data assimilation systems that were designed originally to provide initial conditions for operational weather forecasting models. These scientific applications are severely limited by the lack of wind information over the oceans, the tropics, and the southern hemisphere. The mesoscale wind measurements provided by WINDS would depict small scale atmospheric processes such as in polar lows or convective systems. The proper specification and analysis of tropospheric winds are important prerequisites for understanding and prediction of:
- Atmospheric dynamics and global atmospheric transport - Boundary layer dynamics and processes - Cyclone genesis and intensity - Global cycling of energy, water, aerosols and chemicals. - Benefits of improved wind measurements include: - Improved parameterisation of atmospheric processes in models - Advanced climate and atmospheric flow modelling - Better initial conditions for weather forecasting - Assessing the skill of numerical weather prediction models as well as testing climate
models, once a sufficient amount of data is collected over the mission duration Upper Air Wind Speed and Direction is an Essential Climate Variation and the 2010 update of the Implementation Plan for the Global Observing System for Climate in Support of the UNFCCC makes special mention of the value of MISR-type measurements:
• “The WWW/GOS Upper‐air Radiosonde Network is the backbone of the upper‐air wind observation programme. Observations from commercial aircraft are also becoming more plentiful. A further source of wind information is the cloud motion vectors obtained by tracking cloud elements between successive observations and assigning their height by estimating their temperature to provide “satellite winds” over the ocean. These estimates are even more accurate when based on
Title: WINDS Proposal to ESA Doc. No. MSSL/WINDS/PP/10002 issue 1
Page 9
data acquired from multiangular instruments such as MISR, since height information is derived from the parallax in the data and does not involve assumptions about temperature profiles. “1
With respect to numerical weather prediction, even with the recent advances in the assimilation of radiances, wind is still a critical parameter for data assimilation and NWP because of its unique role in specifying the initial potential vorticity required for accurate forecasting. Scientific applications are severely limited by the lack of directly measured three-dimensional wind information over the oceans, the tropics, the polar regions and the southern hemisphere, where other meteorological observations are scarce. Large analysis uncertainties remain over wide areas of the globe, especially for the three-dimensional tropospheric wind field. Direct wind information is particularly valuable to improve the skill of weather forecasts over the tropics and convective processes, where the atmosphere is less geostrophically balanced, given that radiance data from satellite instruments is less likely to constrain winds. Complementary to a lidar wind profiler flying on another mission, the improved resolution and coverage of the vertical wind gradient from the AMV imager on WINDS would be beneficial to the skill of forecasting weather and convective systems at mesoscale, and would in general improve the model representation of storm tracks and the genesis of cyclones. Determining the location of the Atmospheric Boundary Layer (ABL), the key interface for surface fluxes (pollution, and greenhouse gases) to enter the troposphere, has been a great challenge for both NWP and satellite remote sensing to characterize. Direct measurements of the ABL wind and its variability at high vertical and horizontal resolutions are critically needed for understanding the coupled cloud, precipitation and dynamical processes. Experience from the ongoing eruptions of the Eyjafjallajökull volcano, have also shown the importance of accurate measurements and prediction of the transport of aerosols and chemicals, both from a scientific and economic perspective. Information is required both on the location of ash and SO2 and their heights in the atmosphere in order to empower decision making based on evidential reasoning and not solely on numerical simulation based on a particular model of pyroclastic eruptions which may not be appropriate.
4.3 Operational requirements 4.3.1 EUMETSAT Post-EPS The EUMETSAT Post-EPS position papers on Atmospheric Sounding and Wind Profiling (Stoffelen et al., 2006) and on Generic Requirements on Climate Monitoring (Tett et al., 2006) identify the needs for 3D wind measurements and report on the user requirements relevant to atmospheric sounding and wind profiling in the Post-EPS time frame (2019 and beyond). Their basic source of information was the WMO Commission of Basic Systems (CBS) coordinating a table of user requirements that changes with time as the capabilities of the Global Observing System (GOS), and the meteorological applications using it, evolve (WMO, 2004). This so-called Rolling Requirements Review (RRR) covers a wide range of applications from nowcasting to hydrology, and chemistry and land or marine applications (WMO, 2005). As such, the RRR relates to other groups and organisations through IGOS, CEOS, GCOS, GOOS, GAW, IGACO, and GMES (see Acronym list). The RRR also refers to the Meteosat Third Generation (MTG) position papers. The main applications relevant to 3D winds are:
- Global and regional NWP (Stoffelen et al., 2006); - Nowcasting (NWC) (Stoffelen et al., 2006); - Climate, climate monitoring (Stoffelen et al., 2006; Tett et al., 2006);
We follow here the main conclusions of the Post-EPS position papers and provide those requirements in the application areas that are relevant for a MISRlite mission. A LEO satellite complement for winds is needed in particular over the ocean, polar regions, in the tropics, and in 1 “Implementation Plan for the Global Observing System for Climate in Support of the UNFCCC (2010 Update)” DRAFT v1.0 13 November 2009 GCOS Secretariat, http://www.wmo.int/pages/prog/gcos/documents/GCOSIP‐10_DRAFTv1.0_131109.pdf
Title: WINDS Proposal to ESA Doc. No. MSSL/WINDS/PP/10002 issue 1
Page 10
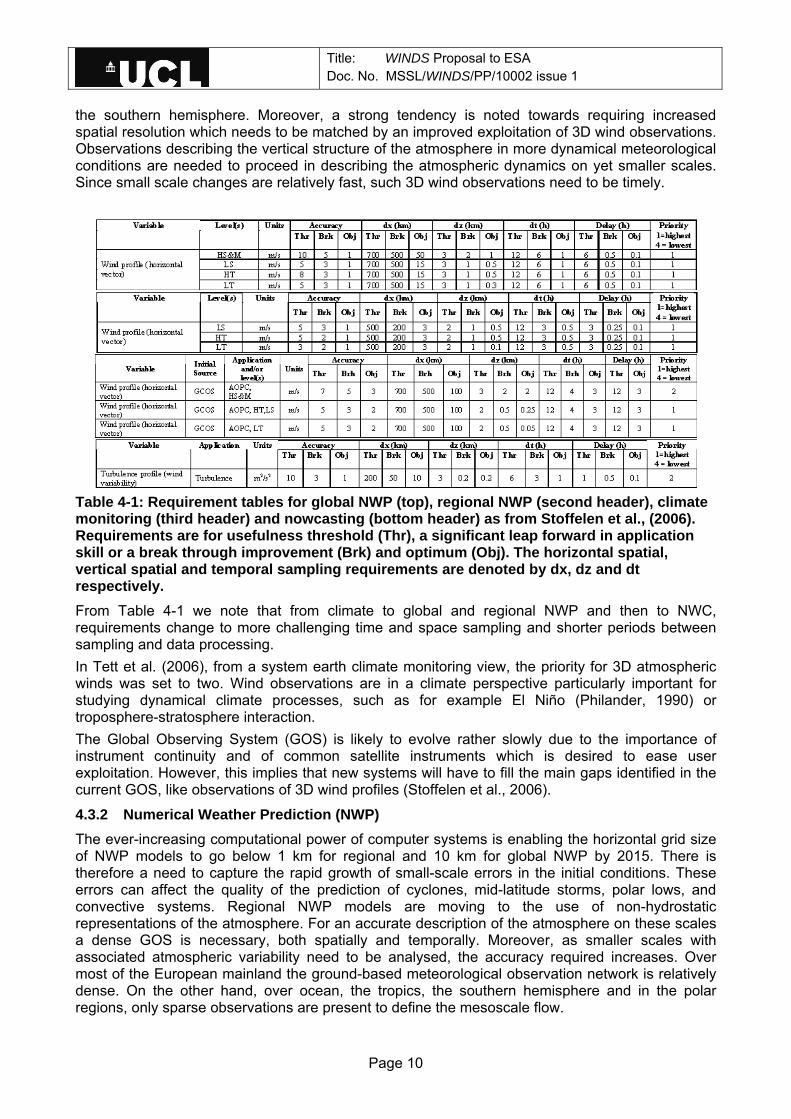
the southern hemisphere. Moreover, a strong tendency is noted towards requiring increased spatial resolution which needs to be matched by an improved exploitation of 3D wind observations. Observations describing the vertical structure of the atmosphere in more dynamical meteorological conditions are needed to proceed in describing the atmospheric dynamics on yet smaller scales. Since small scale changes are relatively fast, such 3D wind observations need to be timely.
Table 4-1: Requirement tables for global NWP (top), regional NWP (second header), climate monitoring (third header) and nowcasting (bottom header) as from Stoffelen et al., (2006). Requirements are for usefulness threshold (Thr), a significant leap forward in application skill or a break through improvement (Brk) and optimum (Obj). The horizontal spatial, vertical spatial and temporal sampling requirements are denoted by dx, dz and dt respectively. From Table 4-1 we note that from climate to global and regional NWP and then to NWC, requirements change to more challenging time and space sampling and shorter periods between sampling and data processing. In Tett et al. (2006), from a system earth climate monitoring view, the priority for 3D atmospheric winds was set to two. Wind observations are in a climate perspective particularly important for studying dynamical climate processes, such as for example El Niño (Philander, 1990) or troposphere-stratosphere interaction. The Global Observing System (GOS) is likely to evolve rather slowly due to the importance of instrument continuity and of common satellite instruments which is desired to ease user exploitation. However, this implies that new systems will have to fill the main gaps identified in the current GOS, like observations of 3D wind profiles (Stoffelen et al., 2006).
4.3.2 Numerical Weather Prediction (NWP) The ever-increasing computational power of computer systems is enabling the horizontal grid size of NWP models to go below 1 km for regional and 10 km for global NWP by 2015. There is therefore a need to capture the rapid growth of small-scale errors in the initial conditions. These errors can affect the quality of the prediction of cyclones, mid-latitude storms, polar lows, and convective systems. Regional NWP models are moving to the use of non-hydrostatic representations of the atmosphere. For an accurate description of the atmosphere on these scales a dense GOS is necessary, both spatially and temporally. Moreover, as smaller scales with associated atmospheric variability need to be analysed, the accuracy required increases. Over most of the European mainland the ground-based meteorological observation network is relatively dense. On the other hand, over ocean, the tropics, the southern hemisphere and in the polar regions, only sparse observations are present to define the mesoscale flow.
Title: WINDS Proposal to ESA Doc. No. MSSL/WINDS/PP/10002 issue 1
Page 11
While the grid size of atmospheric circulation models gets finer, the actual description of detailed atmospheric structures (especially in the vertical) remains limited in some areas by the rather sparse meteorological GOS. The fairly broad weighting functions of satellite radiances and poor vertical representation of AMVs limits the information content of the GOS and renders the analysis problem under-determined. There are additional limitations with some datasets due to spatial and temporal error correlations, which are not allowed for within the assimilation. These are instead handled by spatial and temporal thinning or averaging of the data (Alpach, 2004). In order to represent the mesoscale detail in high resolution models requires observations to be assimilated at higher density and with representativeness more in line with the model grid-size. Provision of high resolution wind data at accurately determined heights in the troposphere would be beneficial for this purpose. Atmospheric dynamical balance dictates that for the analysis of the mesoscale flow, wind observations are most effective in the extra-tropics. Stoffelen et al. (2005) use this basic assessment to motivate the ADM-Aeolus wind profiling mission. Significant improvements to both global and regional NWP are expected from the use of 4D observations of the horizontal wind vector, which are now generally lacking. Wind observations were recently listed by WMO as a key area of deficiency within NWP models and subsequently assigned the highest priority observation for assimilation into future NWP forecasting models. For data assimilation the error characteristics of the observations must be clearly quantified including any horizontal and vertical error correlations. The use of a single line-of-sight wind measurement (i.e. meridional or zonal wind component) has an almost equivalent impact on the analysis (loc.cit. and references therein) to a single retrieved wind vector observation. The error characteristics of the former will be simpler and hence this may be the preferred option for assimilation of the WINDS measurements at many centres, but more studies will be required to confirm this. 4.3.3 Climate Wind observations from a climate perspective are particularly important for studying dynamical climate processes, such as, for example El Niño (Philander, 1990) or troposphere-stratosphere interaction. More detailed 3D observations of the horizontal wind vector are essential for modelling the dynamics and transport properties of the atmosphere. At the equator, winds dominate both the large-scale and the small-scale flow. In a data assimilation experiment, Žagar (2004) points out that contemporary observation of temperature and wind could better reproduce tropical wave motions. In fact, in the tropics the coupling between wind and temperature fields is much weaker, making wind observations even more valuable At present, dynamical structure information on equatorial waves is not available from the global observing system. Moreover, substantial large-scale uncertainties exist in current re-analyses for the tropical regions and related uncertainties in the tropical hydrological cycle (Andersson et al., 2005).
4.3.4 Nowcasting It is envisaged that in the coming decade Nowcasting (NWC) user needs will be increasingly fulfilled through use of high-resolution NWP models able to resolve the temporal and spatial scales of interest in combination with advanced data assimilation and ensemble forecast systems. Therefore, the dynamical aspects of the atmosphere, as deliberated in the NWP section, favour the observation of small-scale phenomena in the wind and humidity fields. Moreover, NWC requirements are spatio-temporally more stringent than NWP requirements, but generally somewhat less stringent on accuracy. Future developments include an extended use of available Meteosat Third Generation (MTG) data, increased use of high-quality NWP products and rapid dissemination of observations to the users. On the other hand, NWC in data sparse higher-latitude and polar regions (not covered by geostationary platforms) is economically and strategically important, and can be supported by timely data provided by polar orbiting platforms. The rapid observational repeat cycle required by NWC is a strong constraint. SMV assimilation - The WINDS mission would deliver in each SMV observation the across-track wind component uo, the along-track wind component vo and a height zo. In a NWP data assimilation

Title: WINDS Proposal to ESA Doc. No. MSSL/WINDS/PP/10002 issue 1
Page 12
system these will be compared to a control variable u(z) and v(z) at height z in order to minimize the distance of the NWP model state control variables to the global data set of observations.
Figure 4-1: Calibration of MISR SMVs on land targets with assumed zero movement. The RMS in the east-west component is 0.69 m/s, while in the north-south component 1.95 m/s. The latter is explained by the close to perfect correlation of the along-track wind component error (along the dashed line) and the height error (in colour). Such correlation can be well exploited in today’s NWP data assimilation systems.
The estimated error in the u and v observations, resp. σu and σv , is used as a weight, and hence a SMV observation cost function may be defined as
( ){ } ( ){ }2
2
2
2
v
oo
u
ooSMV
zvvzuuJ
σσ−
+−
= (1)
Due to the correlated error of along-track wind and height, the estimate of σu will be much lower than that of σv. An alternative formulation may exploit this correlation, however
( ){ } ( ) ( )2
2
2
2
σσ⎭⎬⎫
⎩⎨⎧ −∂
∂+−+
−=
oo
oo
oSMV
zzzvzvvzuuJ (2)
where ∂vo/∂zo is the fixed ratio of along-track component error and height error (~90s). In the variational fitting procedure the height of comparison varies as well as the control wind variables, such that the observed SMV wind vector may be moved vertically and the along-track wind component corrected accordingly, in order to fit the NWP model state control variables. In this formulation, the correlated error of along-track wind and height does not contribute to the error, hence the estimates of σu and σv will be very similar indeed. In other words, the along-track wind component will have increased impact (weight) on the NWP analysis in the alternative formulation of JSMV. Although promising in principle, this type of procedure has not been tested and further studies will be needed to prove its effectiveness.

Title: WINDS Proposal to ESA Doc. No. MSSL/WINDS/PP/10002 issue 1
Page 13
Figure 4-2: Illustration of Atmospheric Boundary Layer height assignment capability of MISR w.r.t AMV METEOSAT-9 and ECMWF (left panel: 10:13-10:41 UTC on 13.8.08), and CALIPSO with METEOSAT-9 and ECMWF (14:57-15:01 UTC on 13.8.08). 4.3.5 MISRlite Wind vector observation data in the atmosphere is thus generally lacking and SMV observations are expected to complement the GOS. In particular, satellites can contribute over otherwise data sparse areas, such as the general AMV data gap between 55 and 75 degrees latitude. Moreover, SMVs have good height assignment accuracy and thus potentially improve vertical resolution of the analysis NWP wind fields. WINDS is complementary to a Doppler wind lidar profiler with a much enhanced horizontal resolution. With respect to an AMV imager WINDS would be beneficial to increase the height assignment and vertical initialisation of meteorological fields, as well as improving the wind coverage at high latitudes. Therefore, WINDS is expected to improve the skill of weather forecasts at the mesoscale, e.g., in convective systems or polar lows, or more generally to improve the model representation of the storm track region and its cyclogenesis. The Atmospheric boundary layer (ABL), the key interface for surface fluxes (pollution, and greenhouse gases) to enter the troposphere, has been a great challenge for both NWP and satellite remote sensing to characterise (Figure 4-2). Direct measurements of ABL wind and its variability at high horizontal resolution is critically needed for understanding the coupled cloud,

Title: WINDS Proposal to ESA Doc. No. MSSL/WINDS/PP/10002 issue 1
Page 14
precipitation and dynamical processes. The combination of surface winds by scatterometer instruments2 and winds at the top of the ABL by WINDS would be revealing in this respect. AMVs have shown beneficial impact after rigorous QC efforts. QC at the interface of NWP data assimilation has not been rigorously tested yet for SMVs and needs elaboration. Other aspects that need scientific elaboration for WINDS is the assimilation of SMVs as mentioned above.
4.4 Mission duration and relationship to other missions Section 4.9 discusses the relevance of WINDS with respect to operational meteorological missions. The proposed initial mission duration is three years from commissioning after launch although it is expected that the spacecraft will last longer than this. The two research missions with which WINDS will have the greatest complementarity is ADM-Aeolus (due for launch in 2012) and the lidar/radar components of EarthCARE (due for launch in 2013). ADM-Aeolus will provide much needed wind profile data and is also a demonstration mission. Once successful, it is expected that the EUMETSAT member states will request an operational Doppler Wind Lidar (DWL) programme. Similarly, once WINDS is successful, the operational meteorological community may favour a constellation of MISRlite. Therefore, in terms of preparations and ground segment similarities will exist between ADM-Aeolus and WINDS. In the context of ADM-Aeolus, studies have been performed on simulated NWP and climate impact, processors have been developed that allow either standalone processing or processing in integrated in NWP forecasting systems, timely data dumps and processing is being arranged to serve the operational meteorological community and prospective DWL scenarios have been assessed in terms of NWP impact in preparation of post-ADM-Aeolus missions. Similar steps would be useful for WINDS. Besides the preparation of the operational meteorological community, ADM-Aeolus and WINDS both measure complementary winds. Whereas ADM-Aeolus directly measures the collective movement of the individual cloud particles, SMVs determine the movement of a cloud feature. It will be interesting to compare these two principal measurements in order to assess cloud dynamical processes. Moreover, comparison of these two data sets and AMVs provides excellent verification of these wind measuring systems. EarthCARE is an Earth Explorer mission from ESA’s Living Planet programme. Developed in co-operation with Japan (JAXA/NICT), it is designed to improve the quantification of the interaction of clouds and aerosols with the earth radiation budget so that the interaction can be correctly included in climate and numerical weather prediction (NWP) models.
Aerosols:Vertical profiles of extinction and characteristics of aerosols
Clouds: Vertical profiles of liquid, supercooled and ice water, cloud overlap, particle size and extinction
Vertical motion:Convective updraft and ice fall speed
2-D Context: Clouds and aerosols horiz. structures
Radiation and Flux: Broad-band SW & LW @ TOA
Needs Techniques
Broadband Radiometer BBR
Radar
Lidar
CPR
ATLIDhigh sp. rs.
EarthCARE instruments
Doppler Radar
CPR Dopplerized
Multi-spectral Imager MSI
Figure 4-3: Relationship between scientific needs and instruments <Credit ESA> The four instruments are (see Figure 4-3), CPR – a 94GHz Doppler Radar; ATLID – a backscatter Lidar with High Spectral Resolution receiver operating in the UV (355nm); MSI – a pushbroom
2 For an overview of scatterometry see the meetings of the International Ocean Vector Winds Science Team at http://www.coaps.fsu.edu/scatterometry/meeting/

Title: WINDS Proposal to ESA Doc. No. MSSL/WINDS/PP/10002 issue 1
Page 15
imager with 7 channels ranging from 0.66um to 12 um; BBR – a broadband radiometer providing top-of-atmosphere radiance in 2 channels, in three directions. The EarthCARE mission is centred on the synergistic use of the data provided by an instrument suite consisting of active and passive sensors. The same volume of atmosphere is observed by all four instruments (although at slightly different times). MSI also provides additional across-track information. This permits acquisition of micro- and macro-level cloud and aerosol measurements – taken as vertical profiles along the flight track – as well as horizontal bi-dimensional information through the across-track observations of MSI. The EarthCARE spacecraft – shown in Figure 4-4(b) – is approximately 1700kg in mass, and is scheduled to be launched into a sun-synchronous orbit in 2013. The exact orbit has not yet been finalised; Table 4-2 shows the range of possible orbital parameters. The spacecraft attitude is also controlled over the orbit such that it yaw steers to compensate for the Earth rotational velocity of the subsatellite point. The planned lifetime for the EarthCARE mission is 37 months.
Altitude (mean spherical)
372-425 Km
Inclination 96.95-97.15 ° Local solar time of descending node 13:30-14:00 H
Table 4-2: EarthCARE orbit parameters
Figure 4-4: EarthCARE mission (a) Observation Principle (b) Spacecraft design <Credit ESA> NASA recently announced an accelerated programme for Earth Science, which will include a Venture-class AO every year, starting FY11. The WindCam system would fit well to either “Small Satellite Mission” or “New Instrument” category under the Venture-class call, and JPL is considering whether to propose the WindCam concept to this new opportunity. The key difference of WindCam from what is proposed here is that it will only operate in the visible and with a smaller swath-width (1000km).
4.5 Geophysical variables and data products The primary output of the WINDS processing (included in direct broadcast data stream) will include:
• Across-track and Along-track wind components at 1.2km with height information • Across-track and Along-track wind components derived from the above with height
information binned/interpolated into standard height levels with associated QC on a 48km grid in a compatible format for direct assimilation into NWP
Title: WINDS Proposal to ESA Doc. No. MSSL/WINDS/PP/10002 issue 1
Page 16
• Associated QC information derived from the stereo matcher and photogrammetric retrievals for each of the above wind components including a metric for how close the derived winds reflect the advective wind field and identification of non-advective components
• Stereo image derived from the optimum combination of views Secondary outputs of the WINDS processing will include
• All available image channels radiometrically calibrated into temperature • Mean or median temperatures of the patch used for the stereo matching • Mean temperature difference (10.8µm-12.2µm) within an image patch when these channels
are activated • Identification of specific cloud features (e.g. contrails, fronts, cycles, hurricane eyes, marine
cloud cells, cumulus, ash clouds) in a nephananalysis • Identification of fire pixels and associated plume edges with smoke plume-top injection
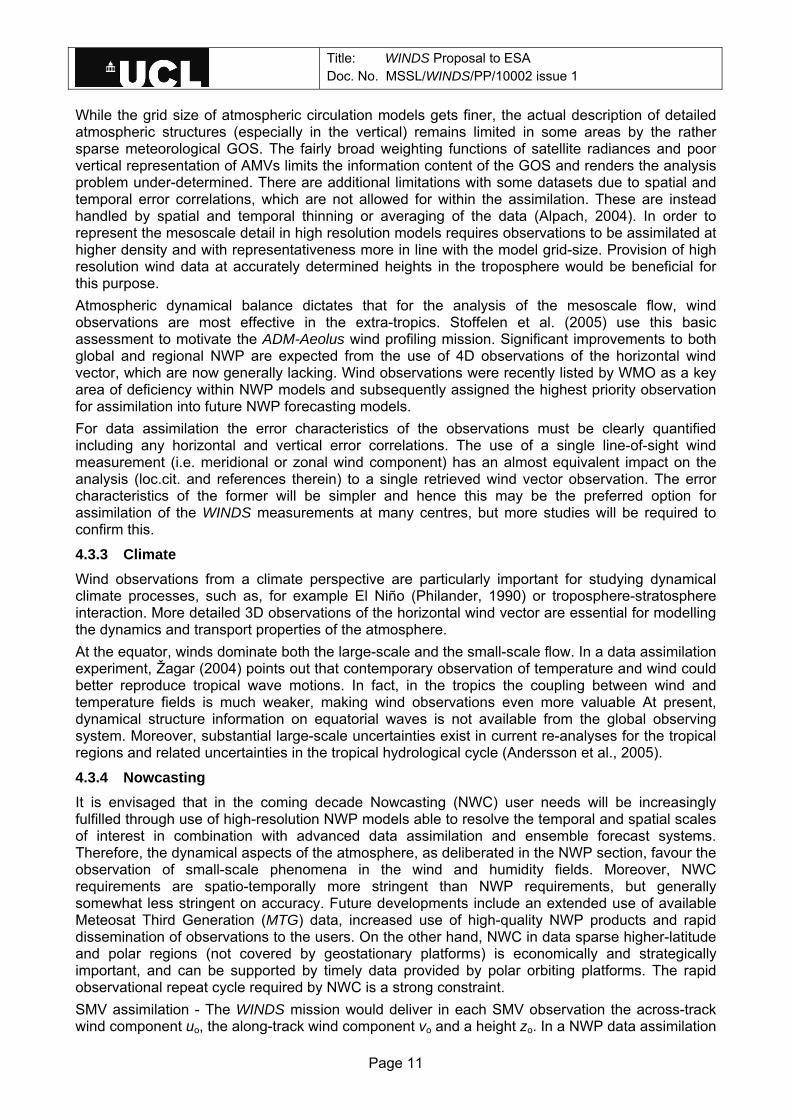
heights and associated wind fields Examples of existing MISR SMVs are shown in Figure 4-5 and Figure 4-6 displaying low-level wind fields from boundary layer clouds and high resolution wind fields over Hurricane Ida.
Figure 4-5: Example of MISR cloud-top heights over boundary layer clouds illustrating the fine detail in the across-track winds and heights.
Title: WINDS Proposal to ESA Doc. No. MSSL/WINDS/PP/10002 issue 1
Page 17
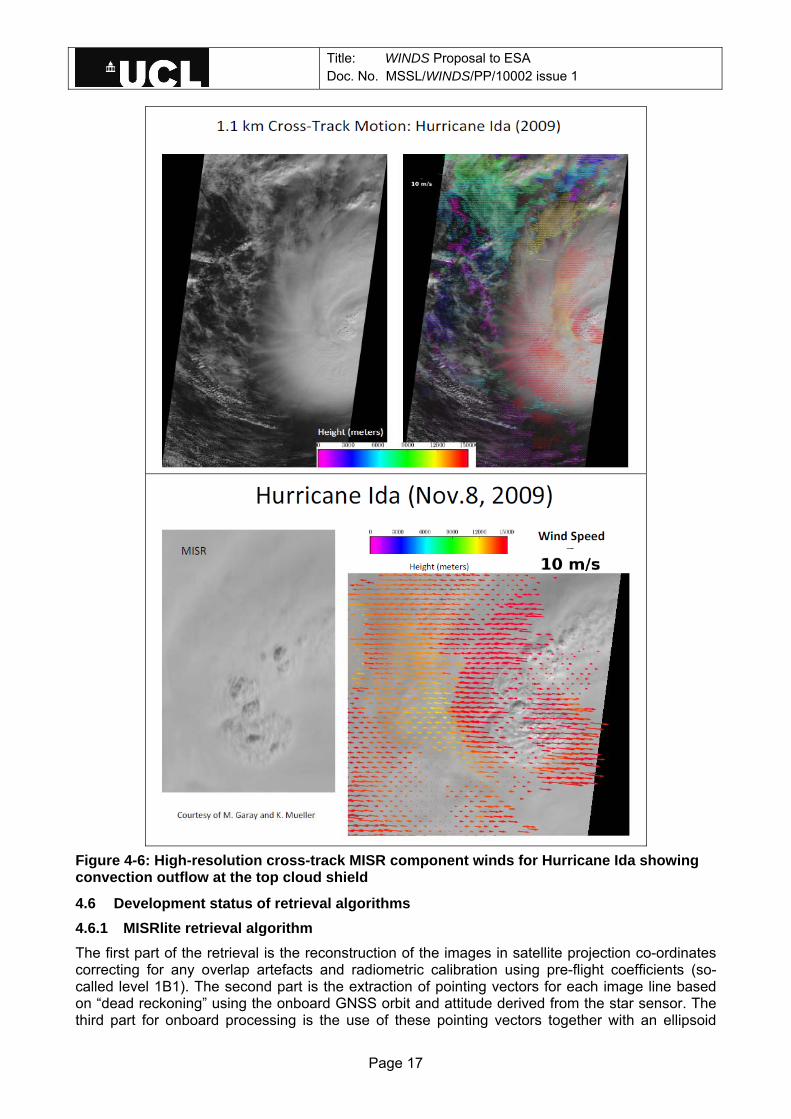
Figure 4-6: High-resolution cross-track MISR component winds for Hurricane Ida showing convection outflow at the top cloud shield
4.6 Development status of retrieval algorithms 4.6.1 MISRlite retrieval algorithm The first part of the retrieval is the reconstruction of the images in satellite projection co-ordinates correcting for any overlap artefacts and radiometric calibration using pre-flight coefficients (so-called level 1B1). The second part is the extraction of pointing vectors for each image line based on “dead reckoning” using the onboard GNSS orbit and attitude derived from the star sensor. The third part for onboard processing is the use of these pointing vectors together with an ellipsoid

Title: WINDS Proposal to ESA Doc. No. MSSL/WINDS/PP/10002 issue 1
Page 18
model to re-project the image co-ordinates into a Space Oblique Mercator (SOM) projection to image blocks where pixel disparity is uni-directional (so-called epipolarity). The photogrammetric process for MISR is described in Jovanovic et al. (1998). This results in the so-called level 1B2. For ground-level processing this projection is not employed as the subsequent stereo matching uses non-epipolar sub-pixel acuity matching algorithms to minimise the error due to re-projection and maximise sub-pixel accuracy. Either process results in five sets of image lines with associated time-tags as input into the wind retrieval. All 5 views will be employed for wind retrieval by matching common points between all views. A set of papers (Horvath and Davies, 1998, 2001; Zong et al., 2002) describe the scheme developed for wind retrieval for MISR 9-look data in detail – a brief summary is given here. The current MISR wind retrieval algorithm employs two sets of three views (one forward triplet- and one backward-looking triplet) to calculate two height-assigned SMVs for a mesoscale domain within a 7-minute time window. From a set of two parallax (disparity) measurements obtained by tracking clouds in the 70º, 60º, and nadir images horizontal cloud motion and height are determined simultaneously. The level of agreement between the independent forward and backward retrievals is then used to assign a quality index to the final reported SMV, which is simply the average of the two values. MISRlite would keep these independent 3-view forward/backward retrievals but would add a third 5-view retrieval employing all available cameras; inclusion of more observations of the same cloud facet would improve the accuracy of the SMVs. The resolution of operational MISR SMVs is 70 km, dictated mostly by the limitations of the employed stereo matcher, which in turn were determined by the available computing power a decade ago. The current feature-matcher, which tracks local maxima in the measured radiances, is fast but rather noisy. This necessitated sampling ~100 cloud features within a 70-km domain to reduce random errors and obtain a reasonably accurate mean parallax. In addition, the current matcher is accurate only to a pixel at most; a pseudo-subpixel disparity is computed simply as the weighted average of the most populated bin and the surrounding bins in the (integer) disparity histogram (crudely estimating the floating point location of the peak of the parallax surface). A more sophisticated stereo matcher with true subpixel capability would remedy both of these limitations. In fact, 35-km SMVs have already been demonstrated using the less noisy M2/M3 area-matcher (Horváth et al., 2002), which is also being used in the soon-to-be-delivered MISR upgrade allowing SMV retrievals down to a scale of 8.8 km. With the state-of-the-art subpixel “Gotcha” matcher proposed for MISRlite, 1.2-km SMVs seem within reach, although a more rigorous quality control scheme would also be required. A caveat to note is the lack of preselecting cloud targets in the operational MISR scheme: even stationary non-cloud surface patterns are tracked, overwhelmingly over land but rarely even over ocean. For such targets the algorithm returns near-zero “wind” speed and the height of topography. These pseudo-winds should not be assimilated in an NWP system, and are currently flagged only in post-processing using cloud mask information. However, they are very useful for (1) establishing the minimum error characteristics of cloud SMVs and (2) monitoring the performance of image navigation/co-registration, which is the potential drawback of the stereo method (Lonitz, 2010). In fact, first-order MISR image co-registration errors are routinely determined by analyzing such pseudo-winds (Moroney et al., 2002). Therefore, MISRlite might keep retrieving such pseudo-winds but with a better classification of the tracked image patches as cloud or clear land/ocean in the pre-processing step. At thermal IR wavelengths, the discrimination of clouds from land or water background is much more straight-forward than at visible wavelengths. Therefore we believe that MISRlite will not suffer from these pseudo-winds in the same was as with MISR. A further potential improvement to the current retrieval scheme could relax the assumption of strictly horizontal winds (i.e. vertical component is assumed zero). Experience with existing MISR data shows that in vigorous convective clouds, especially in the tropics, this assumption can introduce considerable errors in the computed horizontal wind components, leading to failure of the forward-backward QC consistency check. A sophisticated stereo matcher that takes into account the horizontal and vertical development of cloud shapes might allow the explicit inclusion of the vertical wind component in the retrieval equations. Alternatively, the vertical development of the
Title: WINDS Proposal to ESA Doc. No. MSSL/WINDS/PP/10002 issue 1
Page 19
cloud and the resulting horizontal wind errors might be independently estimated by the time evolution of cloud-top temperatures derived from the thermal channels. The MISR processing scheme has been employed in the operational processing of MISR data since first light in March 2000 to provide cloud-top heights at 1.1km and wind retrievals across the whole swath. It has undergone very little change for the image matching components but a series of minor and then recently major modifications for the retrieval of winds on a 70.4km grid. Cloud-top heights are produced for around 90% of all clouds and so-called “Best Winds” are produced for around 20% all cloudy pixels. Recently Mueller et al. (2010) described how they have changed the processing scheme for winds. This change has resulted in some 40% of the cloud pixels now having a wind value associated with them. Image matching forms an integral component of the wind retrieval algorithm. Previous experiments (Muller et al., 2002) showed that feature-based matching approaches are difficult to apply to clouds due to cloud edges having variable Cloud Optical Depths with consequent radiance being mixed between ground-level pixels and those from the clouds. An alternative approach for broken cloud with one or more levels is to segment individual cloud objects and use shape-matching approaches to follow both the same clouds and their shape evolution. This approach has not yet been explored rigorously with MISR data. Area-based matching is employed in the current operational MISR processing chain. Due to limitations on memory and processing speed and the high computational demands of image matching schemes, the so-called M2/M3 scheme provides pixel disparities at only pixel-level acuity (loc. cit.). Disparity ranges are required for each and every patch to be matched or the M4 scheme described by (Muller et al., 2007) which calculates this range in square block areas will be employed. For the ground-level processing scheme these pixel-level acuities will be refined to sub-pixel values as described by Davies et al. (2007). In the case of the MISRlite instrument, an area-based adaptive least-squares correlation scheme called “Gotcha” will be employed Holden et al., (1993). Gotcha includes a precision value based on the maximum eigenvalue of the variance-covariance matrix of the final match which has the “best first” value. Gotcha also includes a region-growing component to fill in gaps and provides much smoother and lower noise 3D surface values for each patch. The resultant disparity fields and QC measures associated with the matcher and the pointing vector skewness (shortest perpendicular distance based on the vector cross-product) are then employed to provide a Quality Metric (QM) for each and every match. These QMs are cross-checked against each other and if they are outside a preset or calculated “on the fly” threshold the disparities are rejected. If they lie within the threshold, bundle adjustment using least-squares is employed to get the highest possible accuracy of localisation for each and every bundle of pointing vectors. Recently, a number of algorithms have been developed to extract sub-pixel values of the motion of thunderstorm systems (Zinner et al., 2008) and track cyclone eye motion (Wong et al., 2008). Such approaches will be explored to provide value-added SMV cloud products. Most effort to date has focused on Cloud-Top Height (CTH) assessment with the MISR Top-of-Atmosphere Cloud product. Several studies have compared MISR CTHs with cloud boundaries retrieved from combined ground-based radar and lidar (Naud et al., 2002, 2004, 2005a; Zong et al., 2005). These studies all indicate that over a wide range of weather conditions, CTHs are retrieved with an accuracy of 0.05±0.62km for single layer clouds of cloud optical depth ≥0.01 showing there is only a very small bias with standard deviations around the theoretical value predicted by Muller et al., (2002) of 560m. In contrast, Naud et al. (2003) showed that radar/lidar cf. radiosondes for CTH show 0.35±0.73km. This should be compared with a value of some 300m±1.2km for MODIS CTHs for cloud optical depths ≥0.3 (Naud et al., 2005). An example of this intercomparison of cloud-top heights is shown in Figure 4-7.

Title: WINDS Proposal to ESA Doc. No. MSSL/WINDS/PP/10002 issue 1
Page 20
Figure 4-7: Radar vs. Difference MISR - Radar cloud-top heights for single level cloud cases selected at CFARR (left) and SGP (right). Taken from Naud et al. (2005b)
More recently, Hinkelman et al., (2009) used Doppler wind data records from 23 of the US NWS Doppler wind profilers to assess the MISR wind retrievals and found agreement of -0.27±3.61m/s with better agreement for the zonal component compared with the meridional component. Figure 4-8 shows a map of the locations of the Doppler wind stations employed for this analysis and the corresponding 2D scatterplots of the winds.
Figure 4-8: Map showing distribution of NOAA Doppler wind profilers employed (filled circles) and corresponding comparison of MISR and NOAA profiler winds at ‘‘Best Winds’’ heights for 23 locations. Ground return filtering applied. (a) W–E (u) wind component. (b) S–N (v) wind component. (c) Wind speed. (d) Wind direction. Taken from Hinkelman et al. (2009) 4.6.2 O2 A-band retrieval algorithm The algorithm for the remote sensing of cloud-top pressure from measurements in the Oxygen A-band at 0.76 µm relies on relating the strength of oxygen absorption to the transmitted air mass: the transmission decreases as the transmitted absorber mass increases. A wide field of remote sensing applications uses this differential absorption technique for the estimation of masses (e.g., the estimation of atmospheric water vapour or trace gases). The presence of clouds significantly alters the path lengths of reflected and backscattered photons, with high clouds leading to shorter path lengths and high transmission and low clouds leading to longer path lengths and low transmission. The transmission cannot be measured directly; it is estimated by the ratio of the measured radiances within and close-by the absorption band. The window radiance serves as an
Title: WINDS Proposal to ESA Doc. No. MSSL/WINDS/PP/10002 issue 1
Page 21
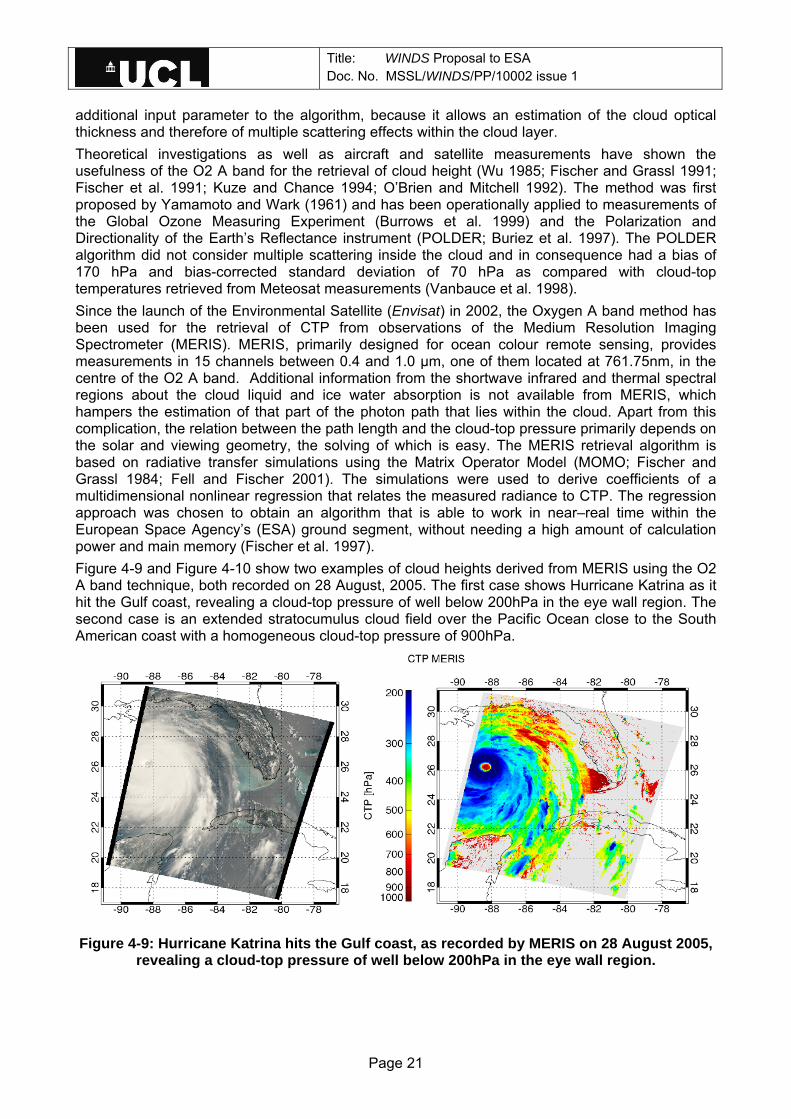
additional input parameter to the algorithm, because it allows an estimation of the cloud optical thickness and therefore of multiple scattering effects within the cloud layer. Theoretical investigations as well as aircraft and satellite measurements have shown the usefulness of the O2 A band for the retrieval of cloud height (Wu 1985; Fischer and Grassl 1991; Fischer et al. 1991; Kuze and Chance 1994; O’Brien and Mitchell 1992). The method was first proposed by Yamamoto and Wark (1961) and has been operationally applied to measurements of the Global Ozone Measuring Experiment (Burrows et al. 1999) and the Polarization and Directionality of the Earth’s Reflectance instrument (POLDER; Buriez et al. 1997). The POLDER algorithm did not consider multiple scattering inside the cloud and in consequence had a bias of 170 hPa and bias-corrected standard deviation of 70 hPa as compared with cloud-top temperatures retrieved from Meteosat measurements (Vanbauce et al. 1998). Since the launch of the Environmental Satellite (Envisat) in 2002, the Oxygen A band method has been used for the retrieval of CTP from observations of the Medium Resolution Imaging Spectrometer (MERIS). MERIS, primarily designed for ocean colour remote sensing, provides measurements in 15 channels between 0.4 and 1.0 µm, one of them located at 761.75nm, in the centre of the O2 A band. Additional information from the shortwave infrared and thermal spectral regions about the cloud liquid and ice water absorption is not available from MERIS, which hampers the estimation of that part of the photon path that lies within the cloud. Apart from this complication, the relation between the path length and the cloud-top pressure primarily depends on the solar and viewing geometry, the solving of which is easy. The MERIS retrieval algorithm is based on radiative transfer simulations using the Matrix Operator Model (MOMO; Fischer and Grassl 1984; Fell and Fischer 2001). The simulations were used to derive coefficients of a multidimensional nonlinear regression that relates the measured radiance to CTP. The regression approach was chosen to obtain an algorithm that is able to work in near–real time within the European Space Agency’s (ESA) ground segment, without needing a high amount of calculation power and main memory (Fischer et al. 1997). Figure 4-9 and Figure 4-10 show two examples of cloud heights derived from MERIS using the O2 A band technique, both recorded on 28 August, 2005. The first case shows Hurricane Katrina as it hit the Gulf coast, revealing a cloud-top pressure of well below 200hPa in the eye wall region. The second case is an extended stratocumulus cloud field over the Pacific Ocean close to the South American coast with a homogeneous cloud-top pressure of 900hPa.
Figure 4-9: Hurricane Katrina hits the Gulf coast, as recorded by MERIS on 28 August 2005,
revealing a cloud-top pressure of well below 200hPa in the eye wall region.
Title: WINDS Proposal to ESA Doc. No. MSSL/WINDS/PP/10002 issue 1
Page 22
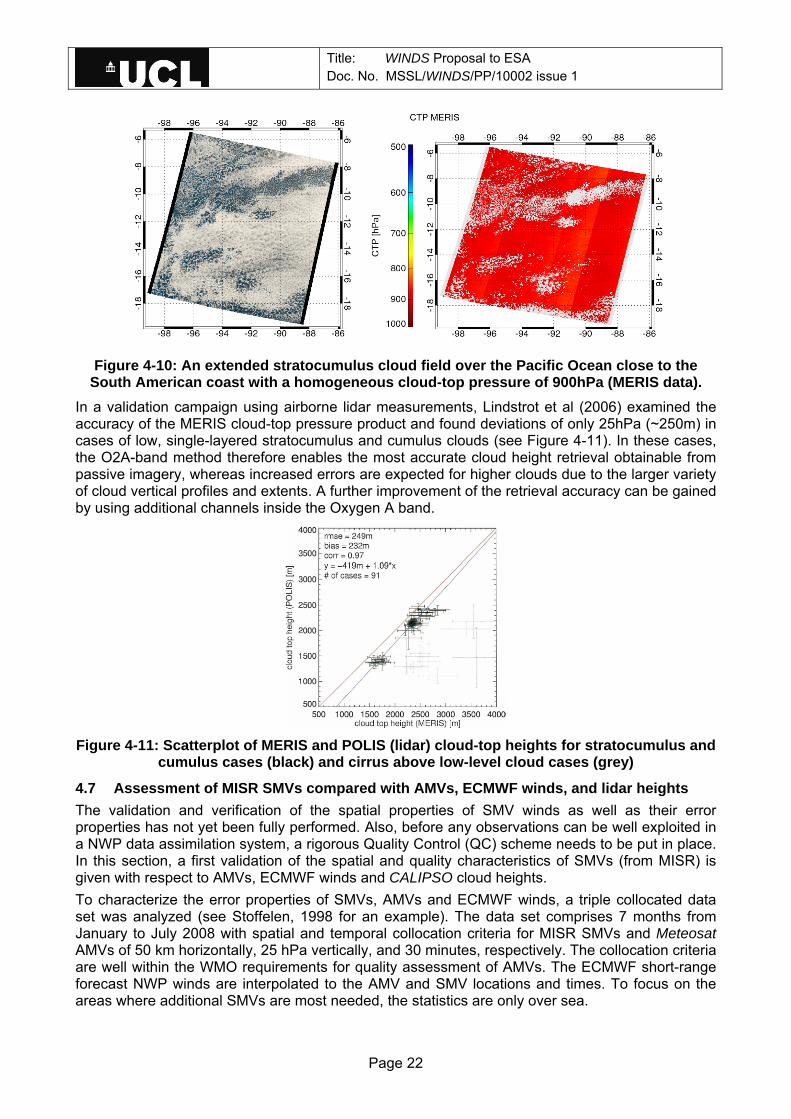
Figure 4-10: An extended stratocumulus cloud field over the Pacific Ocean close to the
South American coast with a homogeneous cloud-top pressure of 900hPa (MERIS data). In a validation campaign using airborne lidar measurements, Lindstrot et al (2006) examined the accuracy of the MERIS cloud-top pressure product and found deviations of only 25hPa (~250m) in cases of low, single-layered stratocumulus and cumulus clouds (see Figure 4-11). In these cases, the O2A-band method therefore enables the most accurate cloud height retrieval obtainable from passive imagery, whereas increased errors are expected for higher clouds due to the larger variety of cloud vertical profiles and extents. A further improvement of the retrieval accuracy can be gained by using additional channels inside the Oxygen A band.
Figure 4-11: Scatterplot of MERIS and POLIS (lidar) cloud-top heights for stratocumulus and
cumulus cases (black) and cirrus above low-level cloud cases (grey)
4.7 Assessment of MISR SMVs compared with AMVs, ECMWF winds, and lidar heights The validation and verification of the spatial properties of SMV winds as well as their error properties has not yet been fully performed. Also, before any observations can be well exploited in a NWP data assimilation system, a rigorous Quality Control (QC) scheme needs to be put in place. In this section, a first validation of the spatial and quality characteristics of SMVs (from MISR) is given with respect to AMVs, ECMWF winds and CALIPSO cloud heights. To characterize the error properties of SMVs, AMVs and ECMWF winds, a triple collocated data set was analyzed (see Stoffelen, 1998 for an example). The data set comprises 7 months from January to July 2008 with spatial and temporal collocation criteria for MISR SMVs and Meteosat AMVs of 50 km horizontally, 25 hPa vertically, and 30 minutes, respectively. The collocation criteria are well within the WMO requirements for quality assessment of AMVs. The ECMWF short-range forecast NWP winds are interpolated to the AMV and SMV locations and times. To focus on the areas where additional SMVs are most needed, the statistics are only over sea.
Title: WINDS Proposal to ESA Doc. No. MSSL/WINDS/PP/10002 issue 1
Page 23
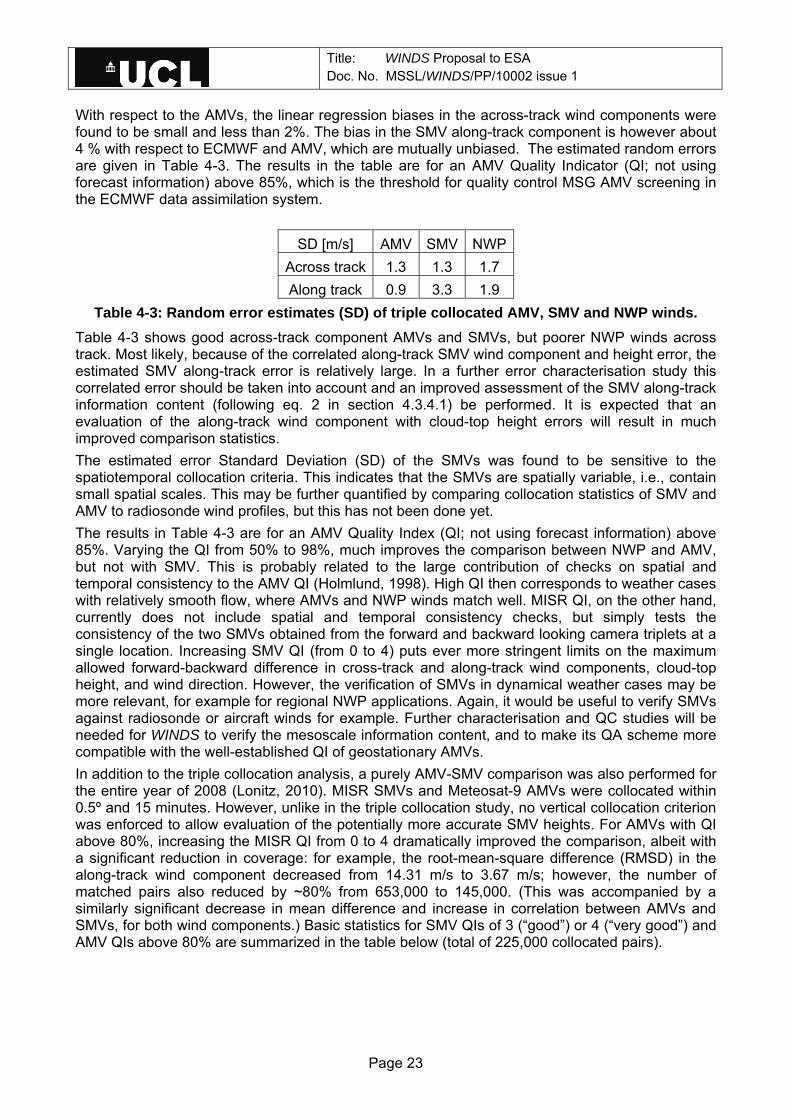
With respect to the AMVs, the linear regression biases in the across-track wind components were found to be small and less than 2%. The bias in the SMV along-track component is however about 4 % with respect to ECMWF and AMV, which are mutually unbiased. The estimated random errors are given in Table 4-3. The results in the table are for an AMV Quality Indicator (QI; not using forecast information) above 85%, which is the threshold for quality control MSG AMV screening in the ECMWF data assimilation system.
SD [m/s] AMV SMV NWPAcross track 1.3 1.3 1.7 Along track 0.9 3.3 1.9
Table 4-3: Random error estimates (SD) of triple collocated AMV, SMV and NWP winds. Table 4-3 shows good across-track component AMVs and SMVs, but poorer NWP winds across track. Most likely, because of the correlated along-track SMV wind component and height error, the estimated SMV along-track error is relatively large. In a further error characterisation study this correlated error should be taken into account and an improved assessment of the SMV along-track information content (following eq. 2 in section 4.3.4.1) be performed. It is expected that an evaluation of the along-track wind component with cloud-top height errors will result in much improved comparison statistics. The estimated error Standard Deviation (SD) of the SMVs was found to be sensitive to the spatiotemporal collocation criteria. This indicates that the SMVs are spatially variable, i.e., contain small spatial scales. This may be further quantified by comparing collocation statistics of SMV and AMV to radiosonde wind profiles, but this has not been done yet. The results in Table 4-3 are for an AMV Quality Index (QI; not using forecast information) above 85%. Varying the QI from 50% to 98%, much improves the comparison between NWP and AMV, but not with SMV. This is probably related to the large contribution of checks on spatial and temporal consistency to the AMV QI (Holmlund, 1998). High QI then corresponds to weather cases with relatively smooth flow, where AMVs and NWP winds match well. MISR QI, on the other hand, currently does not include spatial and temporal consistency checks, but simply tests the consistency of the two SMVs obtained from the forward and backward looking camera triplets at a single location. Increasing SMV QI (from 0 to 4) puts ever more stringent limits on the maximum allowed forward-backward difference in cross-track and along-track wind components, cloud-top height, and wind direction. However, the verification of SMVs in dynamical weather cases may be more relevant, for example for regional NWP applications. Again, it would be useful to verify SMVs against radiosonde or aircraft winds for example. Further characterisation and QC studies will be needed for WINDS to verify the mesoscale information content, and to make its QA scheme more compatible with the well-established QI of geostationary AMVs. In addition to the triple collocation analysis, a purely AMV-SMV comparison was also performed for the entire year of 2008 (Lonitz, 2010). MISR SMVs and Meteosat-9 AMVs were collocated within 0.5º and 15 minutes. However, unlike in the triple collocation study, no vertical collocation criterion was enforced to allow evaluation of the potentially more accurate SMV heights. For AMVs with QI above 80%, increasing the MISR QI from 0 to 4 dramatically improved the comparison, albeit with a significant reduction in coverage: for example, the root-mean-square difference (RMSD) in the along-track wind component decreased from 14.31 m/s to 3.67 m/s; however, the number of matched pairs also reduced by ~80% from 653,000 to 145,000. (This was accompanied by a similarly significant decrease in mean difference and increase in correlation between AMVs and SMVs, for both wind components.) Basic statistics for SMV QIs of 3 (“good”) or 4 (“very good”) and AMV QIs above 80% are summarized in the table below (total of 225,000 collocated pairs).
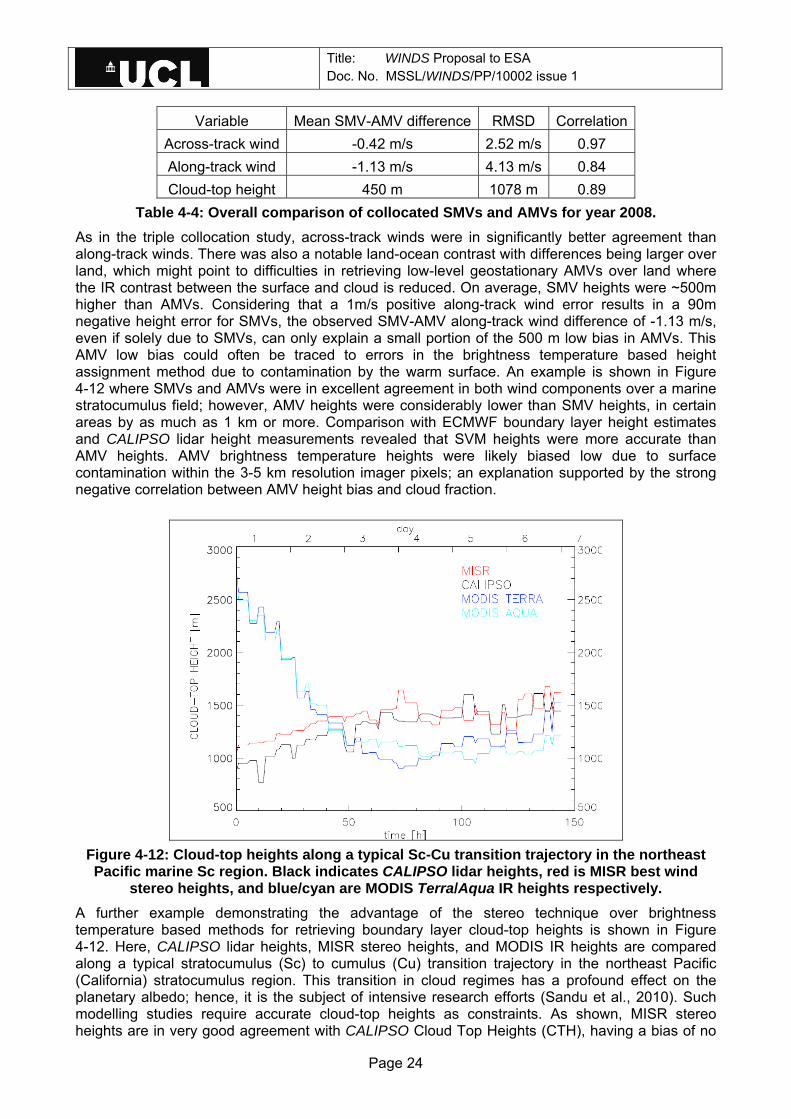
Title: WINDS Proposal to ESA Doc. No. MSSL/WINDS/PP/10002 issue 1
Page 24
Variable Mean SMV-AMV difference RMSD Correlation Across-track wind -0.42 m/s 2.52 m/s 0.97 Along-track wind -1.13 m/s 4.13 m/s 0.84 Cloud-top height 450 m 1078 m 0.89
Table 4-4: Overall comparison of collocated SMVs and AMVs for year 2008. As in the triple collocation study, across-track winds were in significantly better agreement than along-track winds. There was also a notable land-ocean contrast with differences being larger over land, which might point to difficulties in retrieving low-level geostationary AMVs over land where the IR contrast between the surface and cloud is reduced. On average, SMV heights were ~500m higher than AMVs. Considering that a 1m/s positive along-track wind error results in a 90m negative height error for SMVs, the observed SMV-AMV along-track wind difference of -1.13 m/s, even if solely due to SMVs, can only explain a small portion of the 500 m low bias in AMVs. This AMV low bias could often be traced to errors in the brightness temperature based height assignment method due to contamination by the warm surface. An example is shown in Figure 4-12 where SMVs and AMVs were in excellent agreement in both wind components over a marine stratocumulus field; however, AMV heights were considerably lower than SMV heights, in certain areas by as much as 1 km or more. Comparison with ECMWF boundary layer height estimates and CALIPSO lidar height measurements revealed that SVM heights were more accurate than AMV heights. AMV brightness temperature heights were likely biased low due to surface contamination within the 3-5 km resolution imager pixels; an explanation supported by the strong negative correlation between AMV height bias and cloud fraction.
Figure 4-12: Cloud-top heights along a typical Sc-Cu transition trajectory in the northeast Pacific marine Sc region. Black indicates CALIPSO lidar heights, red is MISR best wind
stereo heights, and blue/cyan are MODIS Terra/Aqua IR heights respectively. A further example demonstrating the advantage of the stereo technique over brightness temperature based methods for retrieving boundary layer cloud-top heights is shown in Figure 4-12. Here, CALIPSO lidar heights, MISR stereo heights, and MODIS IR heights are compared along a typical stratocumulus (Sc) to cumulus (Cu) transition trajectory in the northeast Pacific (California) stratocumulus region. This transition in cloud regimes has a profound effect on the planetary albedo; hence, it is the subject of intensive research efforts (Sandu et al., 2010). Such modelling studies require accurate cloud-top heights as constraints. As shown, MISR stereo heights are in very good agreement with CALIPSO Cloud Top Heights (CTH), having a bias of no
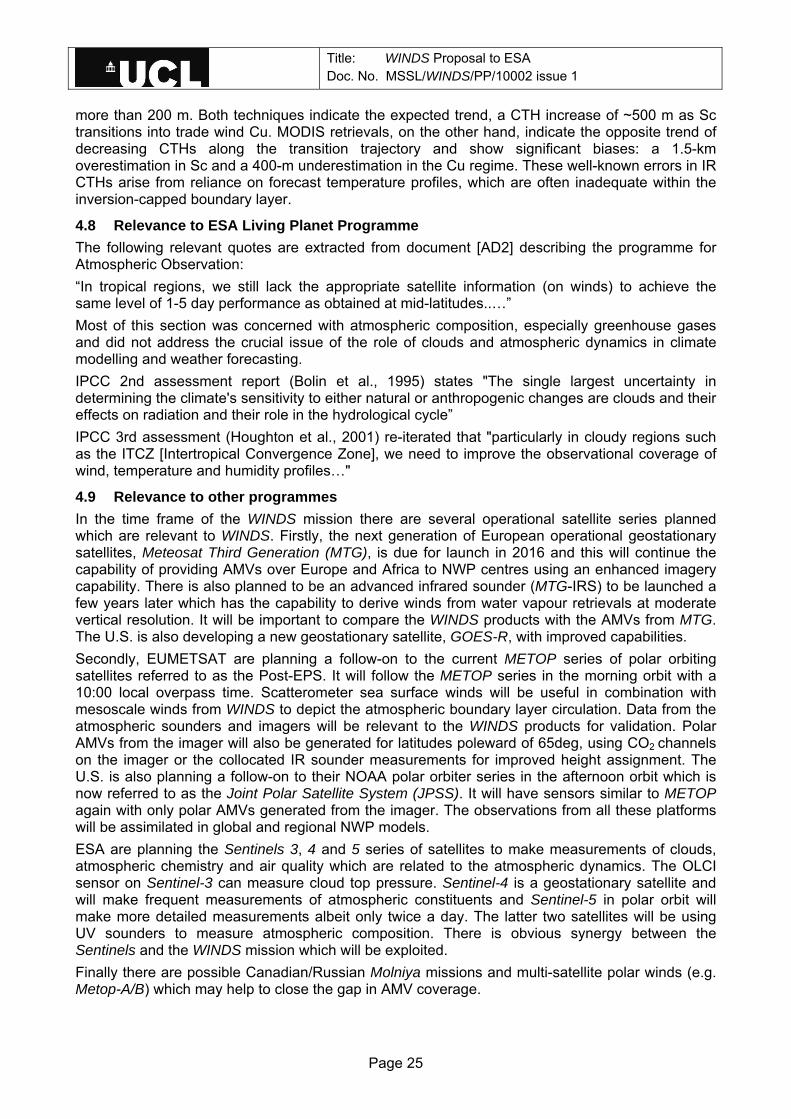
Title: WINDS Proposal to ESA Doc. No. MSSL/WINDS/PP/10002 issue 1
Page 25
more than 200 m. Both techniques indicate the expected trend, a CTH increase of ~500 m as Sc transitions into trade wind Cu. MODIS retrievals, on the other hand, indicate the opposite trend of decreasing CTHs along the transition trajectory and show significant biases: a 1.5-km overestimation in Sc and a 400-m underestimation in the Cu regime. These well-known errors in IR CTHs arise from reliance on forecast temperature profiles, which are often inadequate within the inversion-capped boundary layer.
4.8 Relevance to ESA Living Planet Programme The following relevant quotes are extracted from document [AD2] describing the programme for Atmospheric Observation: “In tropical regions, we still lack the appropriate satellite information (on winds) to achieve the same level of 1-5 day performance as obtained at mid-latitudes..…” Most of this section was concerned with atmospheric composition, especially greenhouse gases and did not address the crucial issue of the role of clouds and atmospheric dynamics in climate modelling and weather forecasting. IPCC 2nd assessment report (Bolin et al., 1995) states "The single largest uncertainty in determining the climate's sensitivity to either natural or anthropogenic changes are clouds and their effects on radiation and their role in the hydrological cycle” IPCC 3rd assessment (Houghton et al., 2001) re-iterated that "particularly in cloudy regions such as the ITCZ [Intertropical Convergence Zone], we need to improve the observational coverage of wind, temperature and humidity profiles…"
4.9 Relevance to other programmes In the time frame of the WINDS mission there are several operational satellite series planned which are relevant to WINDS. Firstly, the next generation of European operational geostationary satellites, Meteosat Third Generation (MTG), is due for launch in 2016 and this will continue the capability of providing AMVs over Europe and Africa to NWP centres using an enhanced imagery capability. There is also planned to be an advanced infrared sounder (MTG-IRS) to be launched a few years later which has the capability to derive winds from water vapour retrievals at moderate vertical resolution. It will be important to compare the WINDS products with the AMVs from MTG. The U.S. is also developing a new geostationary satellite, GOES-R, with improved capabilities. Secondly, EUMETSAT are planning a follow-on to the current METOP series of polar orbiting satellites referred to as the Post-EPS. It will follow the METOP series in the morning orbit with a 10:00 local overpass time. Scatterometer sea surface winds will be useful in combination with mesoscale winds from WINDS to depict the atmospheric boundary layer circulation. Data from the atmospheric sounders and imagers will be relevant to the WINDS products for validation. Polar AMVs from the imager will also be generated for latitudes poleward of 65deg, using CO2 channels on the imager or the collocated IR sounder measurements for improved height assignment. The U.S. is also planning a follow-on to their NOAA polar orbiter series in the afternoon orbit which is now referred to as the Joint Polar Satellite System (JPSS). It will have sensors similar to METOP again with only polar AMVs generated from the imager. The observations from all these platforms will be assimilated in global and regional NWP models. ESA are planning the Sentinels 3, 4 and 5 series of satellites to make measurements of clouds, atmospheric chemistry and air quality which are related to the atmospheric dynamics. The OLCI sensor on Sentinel-3 can measure cloud top pressure. Sentinel-4 is a geostationary satellite and will make frequent measurements of atmospheric constituents and Sentinel-5 in polar orbit will make more detailed measurements albeit only twice a day. The latter two satellites will be using UV sounders to measure atmospheric composition. There is obvious synergy between the Sentinels and the WINDS mission which will be exploited. Finally there are possible Canadian/Russian Molniya missions and multi-satellite polar winds (e.g. Metop-A/B) which may help to close the gap in AMV coverage.

Title: WINDS Proposal to ESA Doc. No. MSSL/WINDS/PP/10002 issue 1
Page 26
The 10th International Winds Workshop held in Tokyo in February 2010 included the following recommendation for discussion at the next meeting of the WMO Coordination Group for Meteorological Satellites: “Height assignment is recognised as a major error source for conventional AMVs. IWW10 presentations highlighted the potential of the stereo-based height approach used for MISR winds. We strongly encourage renewed efforts to evaluate MISR winds in NWP and support proposed initiatives to develop MISR follow-on (e.g. MISR-lite) which consider the timeliness and coverage requirements of NWP.”
Title: WINDS Proposal to ESA Doc. No. MSSL/WINDS/PP/10002 issue 1
Page 27
5 Mission assumptions and technical requirements
5.1 Overview The WINDS mission will deploy two sensors on a small spacecraft. The two sensors are:
MISRlite – A simplified version of the MISR Stereo Radiometer to measure cloud height and wind speed but operating in the thermal IR OABS – An Oxygen A band sensor to measure cloud heights at low altitude
The mission will develop a small spacecraft that can deploy these two sensors required to measure the cloud top winds and height. The spacecraft is to be as low mass and simple as possible, so that a final constellation of spacecraft can be deployed at low cost. The spacecraft has been specified to be built using off-the-shelf designs and technologies. WINDS is proposed as the first mission to encode in Silicon a pre-existing algorithm for pixel-level acuity in very close to real-time shortly after blocks of image lines are acquired. The derived parameters will be continuously downlinked for reception by local ground stations for direct assimilation into NWC forecast models. The instruments are more novel, but based on proven techniques. The novelty of the mission is to place those instruments on the same platform and in a way that can be duplicated at affordable cost.
5.2 Observation techniques 5.2.1 MISRlite The primary payload for wind retrieval will be the MISRlite (Multi-angle IR Stereo Radiometer) instrument. This is based on both the Terra MISR concept for multilook imagery with constant sub-orbital track resolution and the WindCam concept of a single set of wide angle optics. In order to reduce power requirements and increase system reliability and to provide day and night imaging, an uncooled thermal IR microbolometer pushbroom sensor has been chosen to replace the visible pushbroom used in MISR. For five ‘looks’ (±57º, ±30º and 0º) a series of 2500-pixel array elements will be used to provide 600m ground pixels for a 1500km swath. The output from the combined lens (stray-light baffle) and sensor system will need to meet strict requirements on NEdT (≤50mK) to ensure sufficient image contrast in all five looks to maximise the potential correlation between those looks. Very accurate timing circuits will be required to time-stamp each image line from the GNSS clock and ensure correct match-up with the orbital and attitude information provided by the onboard GNSS and star sensor attitude systems. To determine cloud motion vectors it is necessary to identify the disparity (horizontal offset) of an object feature, obtained through matching the same feature in images observed from two or more look angles (Figure 5-1). MISR has pioneered the global, automated retrieval of stereoscopic Cloud Top Height (CTH), and the novel method of height-resolved wind retrieval upon which the MISRlite concept discussed here is based. Because this is computationally expensive, a simple and fast multipoint matcher algorithm was developed for use in MISR data processing (Muller et al., 2002; Moroney et al., 2002).
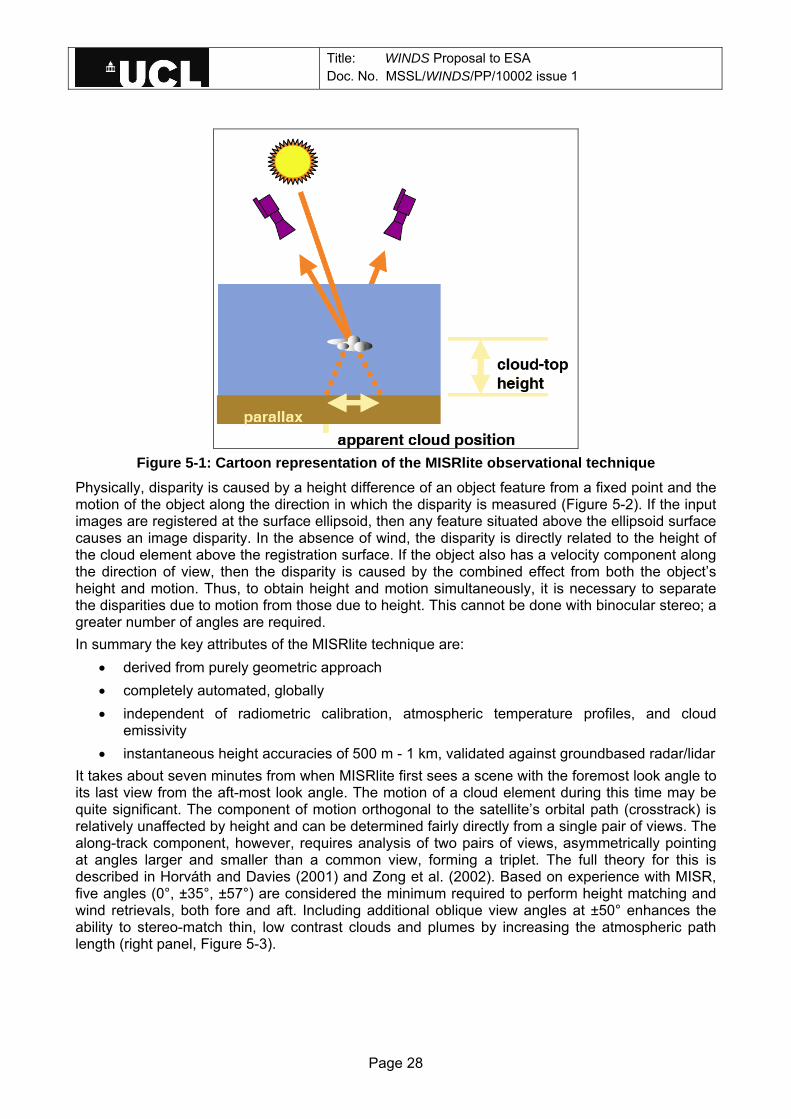
Title: WINDS Proposal to ESA Doc. No. MSSL/WINDS/PP/10002 issue 1
Page 28
Figure 5-1: Cartoon representation of the MISRlite observational technique
Physically, disparity is caused by a height difference of an object feature from a fixed point and the motion of the object along the direction in which the disparity is measured (Figure 5-2). If the input images are registered at the surface ellipsoid, then any feature situated above the ellipsoid surface causes an image disparity. In the absence of wind, the disparity is directly related to the height of the cloud element above the registration surface. If the object also has a velocity component along the direction of view, then the disparity is caused by the combined effect from both the object’s height and motion. Thus, to obtain height and motion simultaneously, it is necessary to separate the disparities due to motion from those due to height. This cannot be done with binocular stereo; a greater number of angles are required. In summary the key attributes of the MISRlite technique are:
• derived from purely geometric approach • completely automated, globally • independent of radiometric calibration, atmospheric temperature profiles, and cloud
emissivity • instantaneous height accuracies of 500 m - 1 km, validated against groundbased radar/lidar
It takes about seven minutes from when MISRlite first sees a scene with the foremost look angle to its last view from the aft-most look angle. The motion of a cloud element during this time may be quite significant. The component of motion orthogonal to the satellite’s orbital path (crosstrack) is relatively unaffected by height and can be determined fairly directly from a single pair of views. The along-track component, however, requires analysis of two pairs of views, asymmetrically pointing at angles larger and smaller than a common view, forming a triplet. The full theory for this is described in Horváth and Davies (2001) and Zong et al. (2002). Based on experience with MISR, five angles (0°, ±35°, ±57°) are considered the minimum required to perform height matching and wind retrievals, both fore and aft. Including additional oblique view angles at ±50° enhances the ability to stereo-match thin, low contrast clouds and plumes by increasing the atmospheric path length (right panel, Figure 5-3).

Title: WINDS Proposal to ESA Doc. No. MSSL/WINDS/PP/10002 issue 1
Page 29
Figure 5-2: MISR data of volcanic dust plume from Mt Etna, showing how the height can be
derived (right image)
Figure 5-3: (Left) Height-resolved cloud motion vectors from MISR showing an extratropical
circulation, overlain on the cloud image. Retrieval resolution is 70 km, the same as for WindCam. Image width is about 380 km. From Horváth et al. (2002). (Right) Nadir and 60º MISR images of smoke from the Chisholm fire in Alberta, Canada, May 2001. Third panel shows height retrievals using the standard processing of nadir and 26º camera data. The rightmost panel uses the 46º and 60º cameras to retrieve heights. The increased optical
depth of the smoke at the oblique angles significantly improves the height retrieval coverage.
Title: WINDS Proposal to ESA Doc. No. MSSL/WINDS/PP/10002 issue 1
Page 30
5.2.2 Oxygen A-band One of the most promising and well studied approaches for the retrieval of cloud height from measurements in the visible and near-infrared spectral region is an exploitation of the Oxygen (O2) absorption band at 762 nm. The technique is based on the assumption that the atmospheric mean photon path length of the reflected solar radiation is related to the amount of absorption measured in the O2 A band. This assumption is valid since oxygen is well mixed and has a well-known and constant concentration in the atmosphere. Furthermore, the oxygen A band neither gets completely saturated even for long atmospheric paths nor does it interfere with the absorption of other gases like e.g. water vapour. The presence of clouds significantly alters the path lengths of reflected and backscattered photons, with high clouds leading to shorter path lengths and high transmission and low clouds leading to longer path lengths and low transmission. The mean photon path length is thus primarily determined by the air mass above the cloud: the Cloud-Top Pressure (CTP). The transmission in the O2 A band cannot be measured directly; it is estimated by the ratio of the measured radiance within and close-by the absorption band: T ≈ LO2A/LWindow The enhancement of photon path lengths due to in-cloud multiple scattering is a function of the cloud vertical extent and its extinction profile. These unknown parameters cannot be easily determined relying on passive VIS/NIR observations. However, it was shown by Fischer and Grassl (1991) that the penetration depth of the photons into the cloud can be related to the window radiance LWindow, which in turn strongly depends on the cloud optical thickness. It is thus possible to derive the cloud optical thickness and the cloud-top pressure from just two channels at 753nm and 762nm. The impact of the surface reflectance on the average photon path length can be estimated by using global surface albedo maps derived from clear sky satellite observations (Muller et al., 2007). The O2 A-band technique is operationally applied to measurements of MERIS onboard ENVISAT. An accuracy of 25hPa was found in cases of low single-layered clouds (Lindstrot et al, 2006), whereas larger errors can be expected in case of high, semi-transparent and / or multilayered clouds. In order to further improve the quality of O2 A-band retrievals, additional channels inside the absorption band are needed. As shown by Preusker and Lindstrot (2009), the level of information about the photon path length distribution is enhanced in case four to five channels are used as compared to the standard two channel approach. It is therefore possible to estimate the cloud vertical extent and thereby improve the accuracy of the retrieved cloud height. The MERIS follow-up instrument OLCI (Ocean and Land Colour Instrument) on board the Sentinel-3 satellite (Aguirre at al, 2007) will therefore provide measurements in three spectral channels inside the Oxygen A band in addition to window channels at 753 and 778nm. 5.2.3 Onboard processing A processing system optimised to the MISR-heritage algorithms will be included as a ‘third’ instrument. This will be capable of taking all the MISRlite and OABS data and deriving the cloud heights and wind speeds in real-time. The same basic algorithms will be used in the onboard processing as in the ground processing so that the results will be comparable and can be updated in parallel. The image of the swath will be divided into 512x512 pixel sections and processed in the same way as the ground system works. Thus there will be five parallel processes, each looking at a 512 pixel section of the swath and generating a total of 25 512x512 images every 51 seconds from the five ‘looks’. The five looks for each ground scene are then compared when the final look is complete. In order to keep up with the data flow, the processing of that set of images has to be complete before the next set of images is complete 51 seconds later. The along-track blocks of “wind packets” will then be direct broadcast to receiving station within line-of-sight of the platform. These “wind packets” will be stored onboard for later data dumping
Title: WINDS Proposal to ESA Doc. No. MSSL/WINDS/PP/10002 issue 1
Page 31
once per orbit and subsequent refined processing and ingestion into the ECMWF and Met services data assimilation systems. For each block there will limited overlap to ensure consistency between blocks and to remove any possibility of block boundary jumps such as appear in current MISR wind processing.
5.3 Mission Requirements 5.3.1 General The aims and requirements below are for the WINDS demonstrator mission. Additional requirements that would only apply to the follow-up operational constellation are listed for information.
5.3.2 Prime Science Requirements The prime science aims of the WINDS mission are defined as: To measure the SMV field at the cloud top with the following accuracies
- wind magnitude accuracy of 3m/s in each vector, across-track and along-track (5m/s total vector magnitude).
- cloud top height to an accuracy of 600m - the horizontal bins to be 48km or smaller on global measurements, and 12km and smaller
over selected areas - system operational day and night
These requirements are to be met for clouds of altitude greater than 600m above the mean land or ocean surface. For clouds that are at altitude less than 3,000m, the following requirements will be met
- velocity accuracy of 3m/s in each vector (5m/s total). - cloud top height to an accuracy of 150m - system shall be operational by day (at least)
For a final operational constellation, the following would also be requirements: - revisit time of 3hours maximum at latitudes north of 30ºN and south of 30ºS. Longer revisit
times will be acceptable at lower latitudes. - coverage shall be global
5.3.3 Secondary Requirements The secondary science aims are as follows:
1. Determine height of aerosol plume tops 2. Detection of forest fires 3. Monitoring of urban heat islands 4. Sea surface temperature measurement – against a set of buoys
The secondary science aims should not drive the design of the spacecraft or instruments.
5.4 Requirements on the spacecraft and constellation 5.4.1 Primary Requirements There is no specific science requirement for multiple spacecraft in the demonstrator programme, for example on short-term revisit periods. Any need for multiple spacecraft should be made on operational, programmatic or technology grounds. Data availability time – The processed SMV shall be available no later than 120 minutes after the data is taken for global observations and 60 minutes for local observations. Operational lifetime – The mission shall have a lifetime ≥3 years.

Title: WINDS Proposal to ESA Doc. No. MSSL/WINDS/PP/10002 issue 1
Page 32
5.4.2 Secondary Requirements Local time of orbit – The local time of the orbit should be 12.00 (+/-1h) to allow use of the real-time data in European weather modelling. Onboard data processing – There is an operational desire for the SMVs to be calculated on board and transmitted in real-time. On the demonstrator mission this requirement may only be fulfilled for part of the orbit/day to demonstrate the capability, e.g. for power reasons. The secondary operational requirements should not drive the risk of the mission.
5.4.3 Orbit Requirements The orbit requirements for the demonstrator mission are shown in Table 5-1.
Parameter Value Inclination Sun synchronous, local time
12 noon
Altitude 850km notional
Orbit Lifetime >4y
Table 5-1: Orbital Requirements – demonstrator mission The inclination requirement for the demonstrator mission flows from the requirement to have local data in Europe at local midday, to be used in local forecasting.
5.4.4 Constellation requirements For a final operational constellation, the following would also be requirements:
- A 3 hour revisit time to all points at latitudes north of 30ºN and south of 30ºS. - There is no requirement on the local time of the orbits of the final constellation, so there is
no requirement for sun-synchronous orbits. Given global coverage is required then high inclinations are preferred.
- A mission structure will be needed to maintain the constellation at the required level to achieve the science requirements for a period of 10 years (TBC) with a reliability of 95% (TBC).
The orbital requirements for the operational mission are shown in Table 5-2.
Parameter Value Inclination Polar preferred
Altitude 850km notional
Orbit Lifetime >15y
Table 5-2: Orbital Requirements – constellation
Title: WINDS Proposal to ESA Doc. No. MSSL/WINDS/PP/10002 issue 1
Page 33
5.4.5 Instrument Requirements 5.4.5.1 General The science requirement is for two instruments.
- MISRlite Multiangle IR stereo radiometer - 3 band nadir only Oxygen A-band sensor
The onboard data processor unit to provide real-time SMVs is considered as an additional instrument here.
5.4.5.2 MISRlite The MISRlite shall measure five views (nadir and 2 forward/2 backwards). Additionally there will be two narrow band channels at 11 and 12 microns that have the same swath but will not be used for cloud height determination. These will be used primarily for sensing atmospheric plumes and will not be operational all the time. The swath width shall be 1500km and the individual elements on the ground shall be 600x600m.
5.4.5.3 Oxygen A-band sensor There shall be five channels of operation (three narrow band channels in the O2 band, and two reference channels), so five numbers per pixel per integration will be generated. The resolution shall be 1.2km over a swath width of 1500km.
5.4.5.4 Data Processing Unit A data processing unit (titled here the Wind Algorithm Processing Unit – WAPU – to distinguish it from any spacecraft data processor) shall provide the real-time SMVs using the MISRlite and OABS data. For the demonstrator mission the processing shall be executed using a processor based system.
5.4.5.5 Constellation Instrument Requirements The instrument requirements are the same for the Constellation. A firmware solution for the WAPU may be acceptable to reduce mass, power or costs.
5.4.6 Spacecraft System requirements 5.4.6.1 Orbital Propulsion Demonstrator Mission – If there is one spacecraft then propulsion will not be required. If there are multiple spacecraft and spacing is a science requirement then propulsion will be required. The possibility should be considered of positioning the spacecraft a short time behind or in front of the ESA EarthCARE spacecraft due to fly in 2013. However, the requirement to fly in formation on EarthCARE shall not drive the propulsion requirement. Operational Mission – The requirement for propulsion will be driven by mission analysis of the final constellation. If there is one spacecraft per plane then orbital drift may cause the orbits in different planes to become out of sync. If there are multiple spacecraft per plane and even spacing is required then orbital propulsion may be required. The initial analysis presented below suggests that propulsion will not be required for operational mission and so is not included in the Demonstrator Mission.
5.4.7 Downlink requirements Data Availability time – The data availability time of 120 minutes will mean that one ground station will be required so the spacecraft can be interrogated once per orbit. The number of ground stations required will be an output from the mission analysis. Data realtime availability – Data shall be transmitted in real-time (direct broadcast) as well as dumped to the ground station.
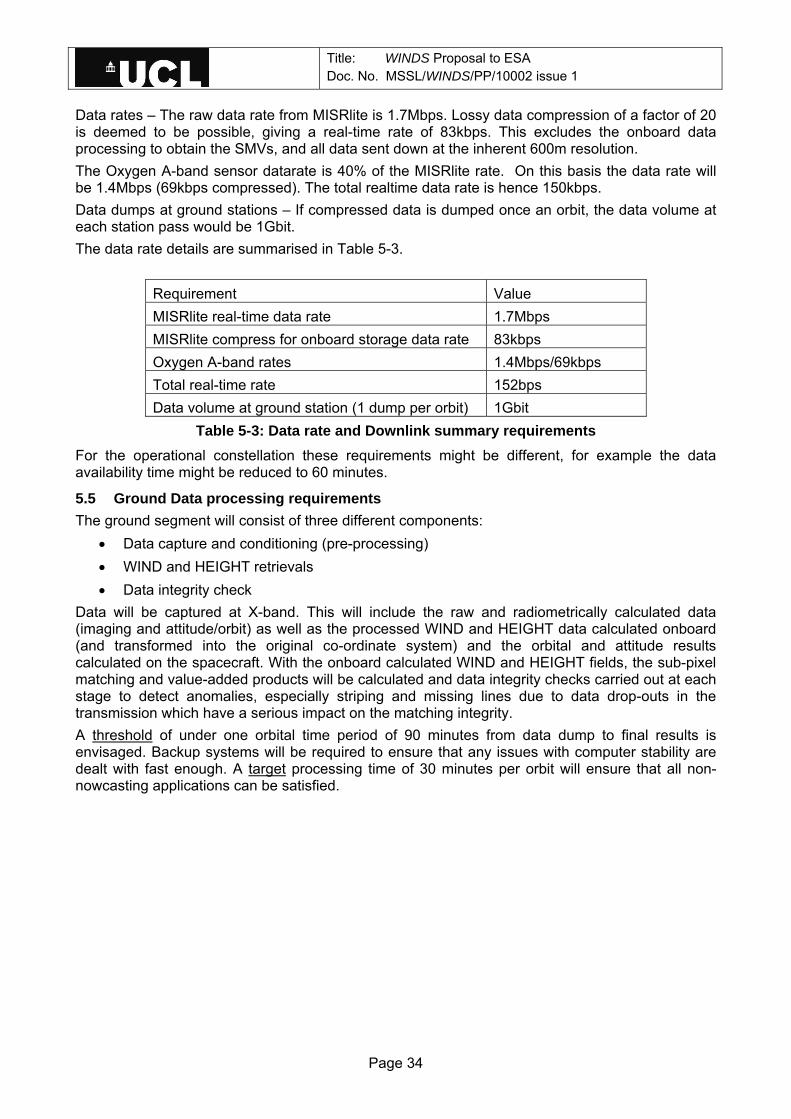
Title: WINDS Proposal to ESA Doc. No. MSSL/WINDS/PP/10002 issue 1
Page 34
Data rates – The raw data rate from MISRlite is 1.7Mbps. Lossy data compression of a factor of 20 is deemed to be possible, giving a real-time rate of 83kbps. This excludes the onboard data processing to obtain the SMVs, and all data sent down at the inherent 600m resolution. The Oxygen A-band sensor datarate is 40% of the MISRlite rate. On this basis the data rate will be 1.4Mbps (69kbps compressed). The total realtime data rate is hence 150kbps. Data dumps at ground stations – If compressed data is dumped once an orbit, the data volume at each station pass would be 1Gbit. The data rate details are summarised in Table 5-3.
Requirement Value MISRlite real-time data rate 1.7Mbps MISRlite compress for onboard storage data rate 83kbps Oxygen A-band rates 1.4Mbps/69kbps Total real-time rate 152bps Data volume at ground station (1 dump per orbit) 1Gbit
Table 5-3: Data rate and Downlink summary requirements For the operational constellation these requirements might be different, for example the data availability time might be reduced to 60 minutes.
5.5 Ground Data processing requirements The ground segment will consist of three different components:
• Data capture and conditioning (pre-processing) • WIND and HEIGHT retrievals • Data integrity check
Data will be captured at X-band. This will include the raw and radiometrically calculated data (imaging and attitude/orbit) as well as the processed WIND and HEIGHT data calculated onboard (and transformed into the original co-ordinate system) and the orbital and attitude results calculated on the spacecraft. With the onboard calculated WIND and HEIGHT fields, the sub-pixel matching and value-added products will be calculated and data integrity checks carried out at each stage to detect anomalies, especially striping and missing lines due to data drop-outs in the transmission which have a serious impact on the matching integrity. A threshold of under one orbital time period of 90 minutes from data dump to final results is envisaged. Backup systems will be required to ensure that any issues with computer stability are dealt with fast enough. A target processing time of 30 minutes per orbit will ensure that all non-nowcasting applications can be satisfied.
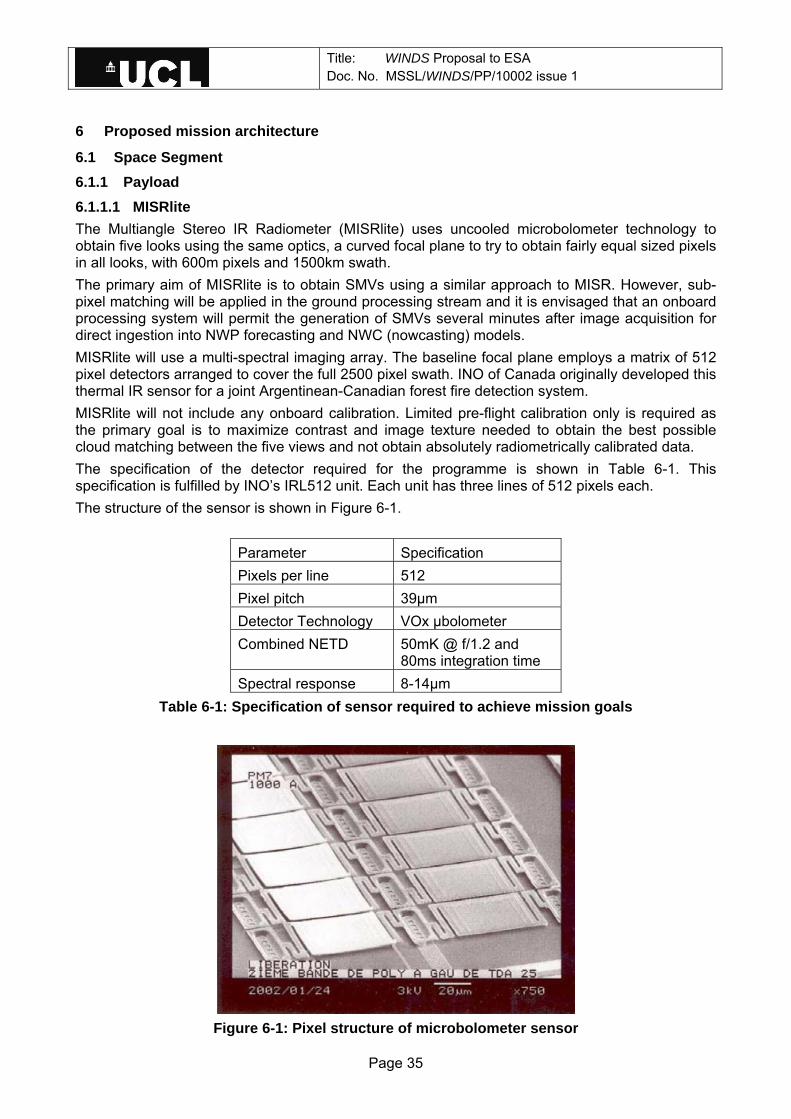
Title: WINDS Proposal to ESA Doc. No. MSSL/WINDS/PP/10002 issue 1
Page 35
6 Proposed mission architecture
6.1 Space Segment 6.1.1 Payload 6.1.1.1 MISRlite The Multiangle Stereo IR Radiometer (MISRlite) uses uncooled microbolometer technology to obtain five looks using the same optics, a curved focal plane to try to obtain fairly equal sized pixels in all looks, with 600m pixels and 1500km swath. The primary aim of MISRlite is to obtain SMVs using a similar approach to MISR. However, sub-pixel matching will be applied in the ground processing stream and it is envisaged that an onboard processing system will permit the generation of SMVs several minutes after image acquisition for direct ingestion into NWP forecasting and NWC (nowcasting) models. MISRlite will use a multi-spectral imaging array. The baseline focal plane employs a matrix of 512 pixel detectors arranged to cover the full 2500 pixel swath. INO of Canada originally developed this thermal IR sensor for a joint Argentinean-Canadian forest fire detection system. MISRlite will not include any onboard calibration. Limited pre-flight calibration only is required as the primary goal is to maximize contrast and image texture needed to obtain the best possible cloud matching between the five views and not obtain absolutely radiometrically calibrated data. The specification of the detector required for the programme is shown in Table 6-1. This specification is fulfilled by INO’s IRL512 unit. Each unit has three lines of 512 pixels each. The structure of the sensor is shown in Figure 6-1.
Parameter Specification Pixels per line 512 Pixel pitch 39µm Detector Technology VOx µbolometer Combined NETD 50mK @ f/1.2 and
80ms integration time Spectral response 8-14µm
Table 6-1: Specification of sensor required to achieve mission goals
Figure 6-1: Pixel structure of microbolometer sensor
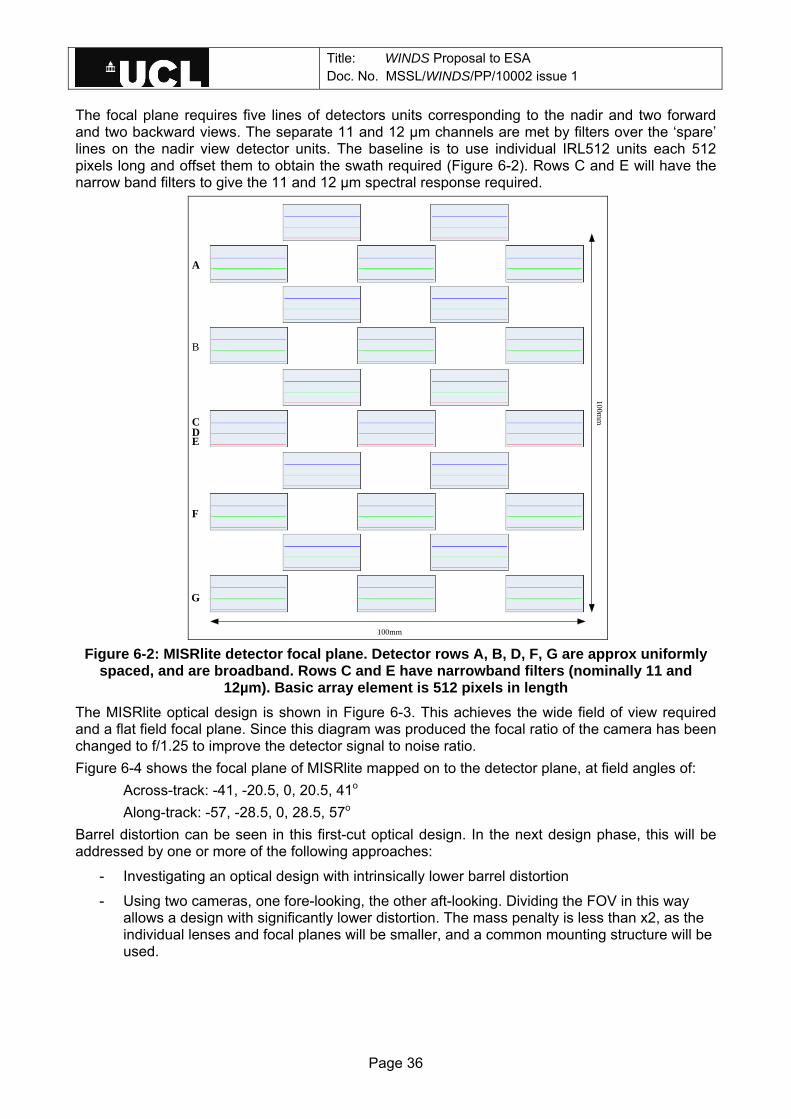
Title: WINDS Proposal to ESA Doc. No. MSSL/WINDS/PP/10002 issue 1
Page 36
The focal plane requires five lines of detectors units corresponding to the nadir and two forward and two backward views. The separate 11 and 12 µm channels are met by filters over the ‘spare’ lines on the nadir view detector units. The baseline is to use individual IRL512 units each 512 pixels long and offset them to obtain the swath required (Figure 6-2). Rows C and E will have the narrow band filters to give the 11 and 12 µm spectral response required.
100mm
100mm
A
G
F
EDC
B
Figure 6-2: MISRlite detector focal plane. Detector rows A, B, D, F, G are approx uniformly
spaced, and are broadband. Rows C and E have narrowband filters (nominally 11 and 12µm). Basic array element is 512 pixels in length
The MISRlite optical design is shown in Figure 6-3. This achieves the wide field of view required and a flat field focal plane. Since this diagram was produced the focal ratio of the camera has been changed to f/1.25 to improve the detector signal to noise ratio. Figure 6-4 shows the focal plane of MISRlite mapped on to the detector plane, at field angles of:
Across-track: -41, -20.5, 0, 20.5, 41o Along-track: -57, -28.5, 0, 28.5, 57o
Barrel distortion can be seen in this first-cut optical design. In the next design phase, this will be addressed by one or more of the following approaches:
- Investigating an optical design with intrinsically lower barrel distortion
- Using two cameras, one fore-looking, the other aft-looking. Dividing the FOV in this way allows a design with significantly lower distortion. The mass penalty is less than x2, as the individual lenses and focal planes will be smaller, and a common mounting structure will be used.
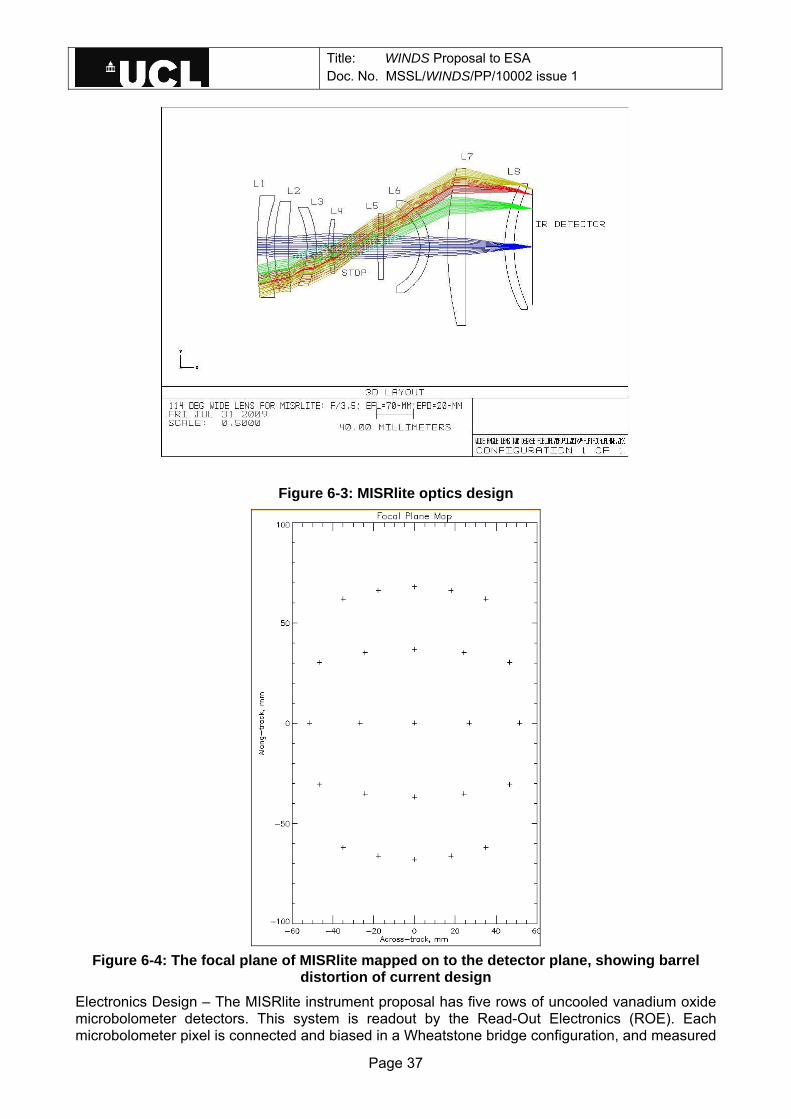
Title: WINDS Proposal to ESA Doc. No. MSSL/WINDS/PP/10002 issue 1
Page 37
Figure 6-3: MISRlite optics design
Figure 6-4: The focal plane of MISRlite mapped on to the detector plane, showing barrel
distortion of current design Electronics Design – The MISRlite instrument proposal has five rows of uncooled vanadium oxide microbolometer detectors. This system is readout by the Read-Out Electronics (ROE). Each microbolometer pixel is connected and biased in a Wheatstone bridge configuration, and measured
Title: WINDS Proposal to ESA Doc. No. MSSL/WINDS/PP/10002 issue 1
Page 38
by a low noise differential amplifier, followed by a low-pass filter/integrator for noise averaging. 12-bit bipolar ADCs digitize the signal. Data registers latch the data ready for readout by the Main electronics. Some multiplexing into the ADCs is expected in order to save power. Groups of detector strips can share common bias circuitry, clock timing and control, with possible redundancy to be identified as a result of further analysis. It is possible that the detectors covering the 11 µm and 12 µm bands will require their own bias. Through the use of multiplexing and common bias circuitry the power dissipation of the detectors and front-end electronics is expected to be around 12 W. The data path through the main electronics has three main blocks: An FPGA with ESA SpaceWire core receives and interprets commands from the spacecraft. The FPGA controls the detector front-end electronics, controls the capture of image data from each of the detector rows, and writes the data to the image capture memory banks. There is one memory bank per detector, seven in all. The FPGA collects housekeeping data from analogue monitors (voltages, currents and temperatures) and transmits this to the spacecraft along with other status data. The FPGA selected is one of the ACTEL RTAX-S rad-tolerant FPGA family. MSSL has wide experience of using these devices in flight instrumentation. Designed for Space, the RTAX-S has SEU-hardened registers which eliminate the need for triple-module redundancy. The devices are immune to SEU to LETth > 37 MeV-cm2/mg, with an SEU rate < 10-10 errors/bit-day in worst-case; TID up to 300 krad, and Single-Event Latch-Up Immunity (SEL) to LETth > 104 MeV-cm2/mg. Seven banks of memory (SDRAM or SRAM) are required to accumulate blocks of push-broom image data from each of the seven detectors. A trade-off analysis will be performed to determine whether single or dual port memories are used, or FIFOs. The size of each memory block will depend on the number of ‘seams’ which can be allowed in the image, and the fault tolerance (redundancy) philosophy of the design. There is little restriction of choice due to data rate, given that the instantaneous output from each detector row is around 1 Mbps. In addition, the availability of a range of sizes of rad-hard relatively large memory ICs places little restriction on the choice of topology. Using the number of focal plane pixels and line repeat times for MISRlite, the instantaneous data rate is 1.65Mbps. While this data rate is well within current technology, implementation on small satellites or platforms of opportunity may require reducing the data rate. Lossless compressors are expected to achieve a compression ratio of 2 at the most. However, because the stereo measurement approach makes use of pattern matching for which good image quality is required but absolute radiometric accuracy is secondary, it is possible to consider lossy compression as a data management option. As “proof of concept” that lossy compression might be tolerable we chose a MISR image set and used it as the input to the operational stereo cloud height/motion retrieval data processing chain. We found that applying standard lossy JPEG (Joint Photographic Experts Group) encoding and decoding algorithms attained 8x compression ratios without significant effect on the final CTH/CMV results. As discussed later, we also propose to perform the derivation of the SMVs in a separate on-board processing system and to downlink the calculated wind data. The CCSDS Wavelet Image COMpression (CWICOM) ASIC has been identified as a suitable data compression engine for transmitting image data directly to the spacecraft. The device implements the CCSDS 122.0 wavelet-based image compression standard and outputs compressed data according to the CCSDS output source packet protocol standard. Developed under contract from ESA, the CWICOM ASIC benefits from EADS Astrium’s expertise of image compression techniques (transform coding, entropy coding, rate regulation) and compression standards (H261, JPEG DCT, JPEG-LS, JPEG2000 Wavelet). The ASIC can perform lossless and lossy image compression at high data rate (up to 60 Mpixels/s) without external memory (Figure 6-6).

Title: WINDS Proposal to ESA Doc. No. MSSL/WINDS/PP/10002 issue 1
Page 39
Figure 6-5: block diagram of the MISRlite readout electronics (ROE)
Figure 6-6: CCSDS Wavelet Image COMpression (CWICOM) ASIC
Characteristics relevant to MISRlite are input data rates of up to 60 Mpixels/s (around of 1M pixel/s is required for MISRlite), image width up to 3496 columns, image height unlimited in push-broom, and compression 0.5 bpp to 10 bpp (bits per pixel). CWICOM is implemented using the ATMEL ATC18RHA technology, and will be provided into a standard surface mount package CQFP256, size 50 x 50 x 3 mm3, mass 12 g, power ~100 mW/Mpix/s max. The device is tolerant to 100 krad total dose, and has SEU tolerant technology (internal EDAC), and is latch-up free (LETth level > 80 MeV). The main electronics receives its master clock from the spacecraft; alternatively, for stand-alone test purposes, the clock may be derived from a local oscillator. The FPGA can be driven in various test modes during development, accessible via jumpers on the main electronics board. In addition, test stimuli can be applied to the detectors and front-end electronics. The total power dissipation for the ROE is expected to break down roughly as shown in Table 6-2.

Title: WINDS Proposal to ESA Doc. No. MSSL/WINDS/PP/10002 issue 1
Page 40
Block Power (W)
Detectors, Front-End Electronics, Bias circuitry
12
FPGA, Memory, CWICOM ASIC 1.5
Power filtering and regulation, HK monitors, Clock oscillator
1.5
TOTAL 15
Bus power including converter inefficiency
23
Table 6-2: MISRlite power budget (excluding thermal control) Breadboard Detector Programme at MSSL – A breadboard system development funded by the UK NERC CEOI (Centre for EO Instrumentation) has recently been completed. Figure 6-7 shows the breadboard sensor test rig provided by INO. A 3-line uncoooled thermal IR linear array of 512 elements, sealed in a ceramic vacuum-evacuated container, has been tested in the laboratory at MSSL. Wide-angle optics have been designed for a test system to mimic the final system.
Figure 6-7: INO microbolometer sensor and control electronics for testing at UCL-MSSL
Figure 6-8 shows an example image taken by this test system of a cloud complex by staring out of the window of the optics laboratory. A small residual striping can be seen in the image. Aside from this no other artefact is visible. The final detector will have an improved NEdT, probably around 5-8 times better than at present.

Title: WINDS Proposal to ESA Doc. No. MSSL/WINDS/PP/10002 issue 1
Page 41
Figure 6-8: Image taken with INO microbolometer array in the UCL-MSSL test system of clouds (top) and trees (bottom). The 512-pixel array was scanned using a slow scanning
mirror (3-4 minutes for a 1000 line scan). The sole artefact visible is the striping.
6.1.1.2 Oxygen A-band sensor The WINDS oxygen A band sensor (OABS) is planned to be a filter-based nadir-looking pushbroom spectrometer with a swath width equal to that of the MISRlite sensor (1500km). The spatial resolution will be 1.2km. OABS will provide five spectral channels: two window channels at 753 nm and 778 nm (each 7.5nm wide) and three spectrally narrow absorption channels inside the O2 A band. The spectral design of the channels will be closely linked to that of the Ocean and Land Colour Instrument (OLCI) onboard Sentinel-3 satellite. In a simulation study regarding the information content of O2 A band measurements above clouds, the optimal spectral configuration of the O2A channels was determined, resulting in central wavelengths of 760.625nm, 764.375nm and 768.125nm (Figure 6-9).
Figure 6-9: Optimized configuration of three spectral channels inside the O2 A band

Title: WINDS Proposal to ESA Doc. No. MSSL/WINDS/PP/10002 issue 1
Page 42
Due to a strong sensitivity of the measured oxygen absorption to the central wavelength of the channels, a spectral calibration accuracy of ≤0.1nm is required to avoid artefacts in the derived cloud-top pressure. The channel configurations, calibration requirements and corresponding saturation levels are given in Table 6-3.
Central wavelength
[nm]
Central wavelength
accuracy [nm]
Channel Width [nm]
Saturation levels [Wm-2sr-1µm-1]
Spectral calibration knowledge
753 0.5 7.5 TBD Not critical 760.625 0.5 2.5 1.8 / 325 ≤0.1nm 764.375 0.5 5 3.2 / 360 ≤0.1nm 768.125 0.5 2.5 5.9 / 390 ≤0.1nm
778 0.5 7.5 TBD Not critical Table 6-3: OABS spectral channel requirement summary
The spectrometer requirements call for a wide field of view and narrow spectral channels. A number of solutions were considered:
- Single grating spectrometer - Multiple grating spectrometer - Single filter spectrometer - Multiple filter spectrometer - Spectrometer with tilt mechanism - Spectrometer with pushbroom mirror
Grating spectrometer - In general spectrometers are limited to a FoV of much less than 80° while 85° would be needed for a 1500km swath with a satellite at 850 km orbit height. A complex optical design would be required for a large FoV. If the optical design cannot achieve the dispersion required to allow use of standard CCDs, development of a tailored CCD in a hybrid layout would be needed. Multiple Grating Spectrometer - To reach the full expected FOV a combination of at least 6 sensors would be required. The envelope and scientific approach to the required instrument does not allow for a multi sensor setup. Filter Spectrometer - The filter spectrometer might be realized with a telecentric objective or a multi-lens wide-angle objective. The design assumes that very narrow band pass region filter can be applied on the CCD for the required wavelengths. The filters need to be developed with respect to spectral filter properties and geometry. Multiple Filter Spectrometer - It might be more feasible to reach the FOV with two to three filter spectrometers. However, the envelope could be exceeded with several instruments. The filter spectrometer is most favourable option at this stage. The OABS consists of the following main units:
• Structure (casing, athermalized structure) • Entrance optic (incl. Si entrance window) • Focal Plane with filter protected CCD arrays • Front end electronics • Sun calibration system • Switch Mechanism (if redundant CCDs are required) • Thermal Hardware (cooling of CCD)

Title: WINDS Proposal to ESA Doc. No. MSSL/WINDS/PP/10002 issue 1
Page 43
Structure: The casing will be an ultralight integral construction of aluminium alloy. Depending on the optical and mechanical design analysis special alloys like RSP technology optical alloys RSA 443. The interior will be cladded with blackened sheets for further stray light rejection. The sheets will be blacked with Aeroglaze Z306 or Acktar Ltd. Magic Black. The cladding covers any built-in component like cables and electronics against the optical path. Entrance Optic: The entrance optic needs to be optimized for low and very high light intensity and large field of view. Intense light optics show less resolution capability. An acceptable optimum has to be elaborated during feasibility studies. A first draft of a telecentric optical design is shown in Figure 6-10. A wide angle optical design for the three channel filter spectrometer is shown in Figure 6-11. A detailed design analysis and trade-off has to identify the most appropriate solution.
Figure 6-10: Grating spectrometer optical design concept
Figure 6-11: Filter Spectrometer Optical design concept (3 channels)
Focal plane: First calculations show that the image plane deviates from a simple plane. Hence the design of the focal plane strongly depends on the characterization of the image plane. The first draft for the focal plane comprises one focal plane fastened on a ball-prism-system for mechanical defined positioning and stress free fastening. The three prisms are embedded into the focal plane. The balls can be adjusted by differential micro actuators within a range of +/- 1 mm. Depending on the imaging results the CCDs need to be aligned and fixed on the focal plane. Focusing is required to allow for changes between ambient and vacuum environmental conditions. Thermal Hardware: The thermal hardware will be designed to the power dissipation of the CCDs and FEEs. It will consist of:

Title: WINDS Proposal to ESA Doc. No. MSSL/WINDS/PP/10002 issue 1
Page 44
• Heatpipes for transfer of power dissipation • Peltiercooler • Heat exchanger
Connection to a radiator or equivalent thermal interface to spacecraft (e.g. spacecraft radiator) Calibration Device: Figure 6-12 shows an example concept of the sun calibration device. Not shown are additional casings and baffles for stray light reduction and Multi Layer Insulation fixation points. Subassemblies are required for moving the two hatches in normal and emergency situations: electric drives, launch locks, fail safe mechanism and release devices. Both hatches should have the lowest possible mass to reduce inertial forces and should be manufactured from honeycomb-sandwich material. The ZENITH® (from SphereOptics) plate is mounted to the sun diffuser hatch in a way that differences in thermal expansion are compensated.
Figure 6-12: Example concept of sun calibration device
6.1.1.3 Onboard Data Processing WINDS will compute the SMVs onboard and then downlink the calculated winds in real-time. The same basic algorithms will be used as in the ground processing (based on those developed for MISR) but optimised for speed. This will be performed in the Winds Algorithm Processing Unit (WAPU). The instrument swath will be split into five equal parts, with one processor responsible for the matching of a ~500 pixel wide element. Five images will be obtained from each 500x500 pixel element of the ground scene and these must to be matched by a single processor in less than 50s (the rate at which the spacecraft moves 500 pixels over the ground). We have baselined use of the Atmel AT697F rad-hard SPARC processor which uses 1W running full speed at 86 MIPS. The Fast Fourier Transform element of the processing would be performed by a separate FPGA shared between the five processors. This is an ITAR free system and is shown schematically in Figure 6-13.

Title: WINDS Proposal to ESA Doc. No. MSSL/WINDS/PP/10002 issue 1
Page 45
Processor #1Processor
#1Processor
#1
MISRlite instrument
S/C Data Handling System
FFT
FPG
A
Co-ordination processor
WAPU
Processor #4Processor
#5
Figure 6-13: WAPU block diagram
We have assessed the speed of processing using the proposed WAPU based on standard PCs running the existing algorithms. Over the 2500 pixel wide swath, the proposed configuration can process the images at the full resolution of 600m. On this basis the system can keep up with the rate of five images (for each 500pixel section) every 50s. It should be possible to decrease the time taken to complete the slowest part of the processing, the 2D convolution, and hence recover the full resolution by using one or more FPGA-based convolution processors. Digital image processing has kept up interest in such ideas for a number of years and there are already many designs and investigations. Perri et al. 2005 shows a design that can process a 1024x1024 image with a 5x5 kernel in 37ms at 28MHz using 3W. This would mean that the WINDS processing of one 512x512 block would still take 20s, but a design of this type has more room for development using 2010 technologies. ITAR regulated technology could be considered for the WAPU, but would be a programmatic risk if the US regulations were to change. The early design of the hardware would be for a scalable array of processing cores (processors and processing cores in FPGAs). This would allow the flexibility necessary to process data in parallel but easily extend or scale back the processing as early designs are tested. The code will be developed before launch alongside the ground data processing code, though it is unlikely is can be identical given the need for speed optimisation. The same basic algorithms will be used so that the two sets of code can be updated in parallel after launch with the aim of the results being very similar. The WAPU power budget has been built up as shown in Table 6-4.

Title: WINDS Proposal to ESA Doc. No. MSSL/WINDS/PP/10002 issue 1
Page 46
Item Power per item (W)
Number Total Power (W)
Processors 1 5 5 FPGA 1 1 1 Memory etc 1 3 3 Power converter inefficiency 3 1 3 Total power 12W
Table 6-4: WAPU power budget It is possible that power budgets on the demonstrator mission may not allow the onboard processing to run 100% of the time, but this would not be a major issue since the objective is to show that the concept works. For the final Constellation a lower power processor approach could be taken, either as technologies develop or with proven algorithms operating in a lower power but less flexible processor configuration.
6.1.1.4 Summary of Instrument Resource Requirements The resource requirement on the instruments are summarised in Table 6-5. Note that it is not proposed that all the three instruments will be operational 100% of the orbit.
Unit Mass (kg) Power (W) MISRlite 10 23 OABS 10 6 WAPU 5 12 Margin 5 Total 30 41
Table 6-5: Summary Instrument Requirements 6.1.2 Spacecraft 6.1.2.1 Introduction A basic design for the WINDS spacecraft has been considered in this proposal. The aims of this basic design are to demonstrate that the requirements of the mission are within the realms of feasibility and that the budgets can be met, and to help in calculating an initial cost estimate and DD&V plan contained later in the proposal. The design of the platform has been approached to ensure a high TRL by using as many COTS components as possible. This will keep costs down and ensure high reliability.
6.1.2.2 System Design The space segment has been designed around the concept of a small, recurring platform in order to aid simplicity of design and keep costs low. The key features of the spacecraft are the lack of propulsion system and the panel mounted solar arrays. Figure 6-14 and Figure 6-15 show the initial design of the WINDS spacecraft. The spacecraft fits within an envelope of 700 x 600 x 600 mm.
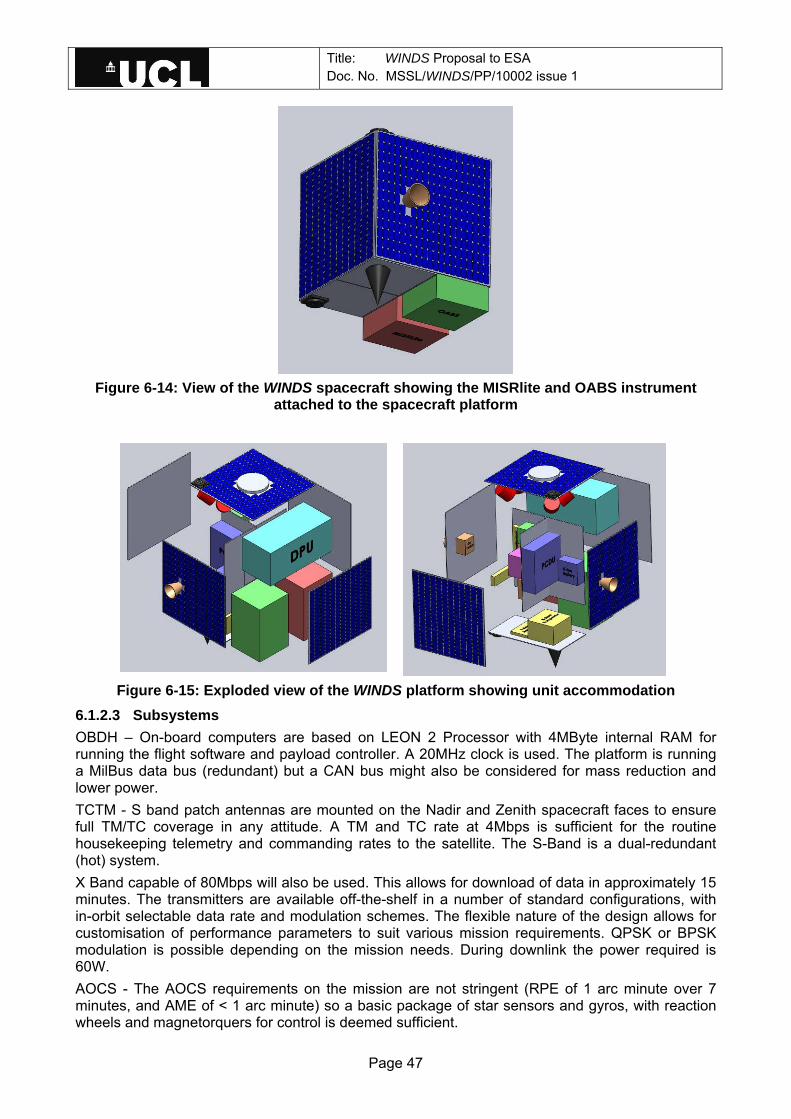
Title: WINDS Proposal to ESA Doc. No. MSSL/WINDS/PP/10002 issue 1
Page 47
Figure 6-14: View of the WINDS spacecraft showing the MISRlite and OABS instrument
attached to the spacecraft platform
Figure 6-15: Exploded view of the WINDS platform showing unit accommodation
6.1.2.3 Subsystems OBDH – On-board computers are based on LEON 2 Processor with 4MByte internal RAM for running the flight software and payload controller. A 20MHz clock is used. The platform is running a MilBus data bus (redundant) but a CAN bus might also be considered for mass reduction and lower power. TCTM - S band patch antennas are mounted on the Nadir and Zenith spacecraft faces to ensure full TM/TC coverage in any attitude. A TM and TC rate at 4Mbps is sufficient for the routine housekeeping telemetry and commanding rates to the satellite. The S-Band is a dual-redundant (hot) system. X Band capable of 80Mbps will also be used. This allows for download of data in approximately 15 minutes. The transmitters are available off-the-shelf in a number of standard configurations, with in-orbit selectable data rate and modulation schemes. The flexible nature of the design allows for customisation of performance parameters to suit various mission requirements. QPSK or BPSK modulation is possible depending on the mission needs. During downlink the power required is 60W. AOCS - The AOCS requirements on the mission are not stringent (RPE of 1 arc minute over 7 minutes, and AME of < 1 arc minute) so a basic package of star sensors and gyros, with reaction wheels and magnetorquers for control is deemed sufficient.
Title: WINDS Proposal to ESA Doc. No. MSSL/WINDS/PP/10002 issue 1
Page 48
Magnetorquers - The Magnetorquers are used for initial rate control (after separation) and for routine de-saturation of the reaction wheels. 3 magnetorquers are mounted in the X, Y and Z axes within the satellite. The Magnetorquers comprise two windings. Each winding is powered individually to provide up to 5Am2 per winding with a total of 10Am2 per axis. Reaction Wheels - Four wheels (each with a 10mNm torque capacity) are mounted in a tetrahedral configuration to provide redundancy. This configuration allows 3-axis pointing control required for the payload data product. Each wheel can spin up to 5000rpm in any direction before being saturated. This provides a momentum capacity of ~ 0.5Nms. Star Sensors - Various star trackers are available commercially to suit the needs of this mission. Typically they all come with predefined star maps and provide attitude information at ~1Hz rates with accuracies of 0.02° in attitude knowledge (which is approximately 1 arcmin as needed by the initial payload assessment). Star sensors would be provided in a pair for redundancy and to allow for sun or moon blinding over parts of an orbit. MEMS rate sensor - This unit provides attitude rate information during all mission phases including separation from the launcher (capable of 20 degree/second which is significantly higher than any typical launcher tip-off rate). The unit provides 3-axis rate information at 10Hz and is a major input to the attitude estimator. The drift of the MEMS Rate Sensor (5° per hour) is corrected by routine Star Tracker measurements.
Power - The power system is nominally 28v unregulated with power provided by solar arrays in the sunlight phases for platform needs and battery recharging. During eclipse, power is supplied by the Li-ion battery with approx 20Ah capacity. Charge regulation is required to ensure the efficiency of the battery over the mission lifetime. Solar panels are integral elements of the satellite structure and do not require deployment. The solar array will produce approximately 50 W of power on average over an orbit. Since this is not sufficient to drive the systems during the peak power demand (i.e. data transmission) some additional battery power is required even in sunlight. A power control unit distributes the power throughout the satellite and includes a regulated 5V supply for the data handling system. This unit also provides electrical filters and regulation to avoid EMC disturbances. Thermal - The thermal balance of the spacecraft will be maintained primarily through the use of blankets and radiators, with no active components. The payloads may require additional heaters, but these are included in the instrument power budgets. A detailed thermal analysis has not been performed as part of the proposal, but given the simple design of the satellite, it is not foreseen to be a problem.
6.1.2.4 Budgets Table 6-6 shows the Mass and power budget for the WINDS spacecraft.

Title: WINDS Proposal to ESA Doc. No. MSSL/WINDS/PP/10002 issue 1
Page 49
Item Mass (kg) (for all units)
Power (W) (for operating unit)
Structure 21 - Thermal hardware 4 - Mil Bus controller + bus couplers
3 1
Power harness 3 - Li-ION Battery (20Ah) 5 - Power Controller Unit 2 1 Battery Charge Regulator
2 -
Solar Array 5 - Star Sensor (x2) 3 9 MEMS rate sensor 0.75 4 Reaction Wheels (x4) 6 5 Magnetorquers (x2) 1 2 S Band Comms (4Mbps)
3 7
X Band downlink (80Mbps)
3 60
OBC (20MHz, 4MB) 4 3 Solid State Mass Memory
3 7
MISRlite 9.5 23 Oxygen A Band Sensor
9.5 6
WAPU 6 12 Sub total 93.75 Margin (20%) 18.75 Total 112.5
Table 6-6: Mass and Power budget of the WINDS spacecraft The current mass estimate is greater than the required 100kg including margin. This is expected at this initial stage as a full mass optimisation has not been performed in this proposal. It is expected this mass will come down with further study. The power requirements do not allow for continuous operation of all the instruments over the Orbit. The OABS is only operational on the day side so can be put into a low power mode on the night side. The WAPU proposed here is a demonstration so will only be required for a limited time on each orbit (over Europe and North America), and have assumed 15 minutes per orbit here. On this basis the average power requirements are 63W. This is outside the conservative EOL estimate of 50W for the array power production given above. During a Phase-A study the estimates will be further refined and a small increase in the size of the fixed array considered, though this will be limited by the launcher accommodation. It is clear from the study to date that power is the limiting

Title: WINDS Proposal to ESA Doc. No. MSSL/WINDS/PP/10002 issue 1
Page 50
resource in the WINDS mission if a simple spacecraft concept is to be retained and will need to be carefully assessed at all stages.
6.1.3 Launcher The consideration for launchers in for the demonstration mission and does not refer to the final constellation. For this proposal Vega is assumed to be the baseline launcher with a shared launch. This has the capability of launching a mass of 1400 kg into a 700km sun synchronous orbit. For this launcher the VESPA launch adapter is currently baselined, however, at this stage there is little information available on this adapter. The allocated volume (length x width x height) per spacecraft is estimated to be 600 x 600 x 800 mm. Furthermore the mass should be limited to 100 to150 kg range. The design of the spacecraft fits within these boundaries (600 x 600 x 700), and mass limitations.
Figure 6-16: Vega Accommodation
Other launcher options are also available (Figure 6-17), for example, Rockot, which has the capability of launching a mass of 1400 kg into a 700km sun synchronous orbit, and DNEPR which has the capability of launching a mass of 700 kg into a 700km sun synchronous orbit (which may not be adequate for the demonstrator mission depending on the masses of the other satellites with which it is launched).

Title: WINDS Proposal to ESA Doc. No. MSSL/WINDS/PP/10002 issue 1
Page 51
Figure 6-17: Rockot (left) and DNEPR (right) accommodation
6.1.4 TRL status Spacecraft – The requirements on the spacecraft are not exceptional and no new developments are required. Therefore the spacecraft is already at TRL 6-8. MISRlite – The MISRlite instrument requires development in three areas, as summarised in Table 6-7.
Item Current TRL level
Development Required Planned TRL level at end Phase-
A Focal plane 2 Build a focal plane of required
size. 5
Detector electronics 4 Build a prototype that has the performance and power dissipation required
5
Wide field optics 2 Demonstrate that the wide-field design has required thermal and mechanical stability
5
Table 6-7: MISRlite Technology Development Areas The new technologies will be developed in the steps listed in Table 6-8. Focal Plane – The baseline requires 25 INO IR sensors to be assembled into a flat focal plane. The basic sensor does not require further development, but the hybridisation needs to be demonstrated. A programme would be negotiated with the detector provider, INO of Canada, leading to a prototype focal plane. Initial discussions with INO have lead to the price that is shown in the costing section.

Title: WINDS Proposal to ESA Doc. No. MSSL/WINDS/PP/10002 issue 1
Page 52
Detector Electronics – INO have developed a detector and supporting electronics for a Canadian-Argentinean mission. However, multiplication of this approach for WINDS would give too high a power consumption so a new design is required. This could be carried out by INO, or by a space electronics group with more background of low power/rad tolerant electronics. Provision has been made in the costings for a development programme based on in-house costs at MSSL and at INO. Wide Field Optics – ATC in the UK carried out a design study of an f3.5 optic for WINDS. Since that time the f number has been changed to f/1.25 to improve the SNR for the detector. The stability of the optics to thermal disturbance has not been demonstrated. During Phase-A the optics design would need to be revisited and a prototype optic element built and tested under representative conditions. The prices obtained by ATC for fabrication of the current design of optic has been used as the basis for this programme. System Design – The Phase-A will include development of a scientific prototype of the instrument, with the aim that the instrument will be TRL 4/5 at the end of Phase-A.
Milestone Anticipated Status
Item Activities for preparing status
PRR TRL2 Focal Plane Define requirements for focal plane arrangement – detector type, readout requirements. Decide relationship with detector manufacturer.
TRL4 Detector Electronics
Define requirements on the detector electronics. Decide approach to achieving goals, options are detector manufacturer or alternative electronics development group.
TRL2 Wide field optics
Trade-off for realisation of optical requirements of wide field, flat focal plane, plate-scale. Proof-of- concept design performed with extended ZEMAX optical design calculations.
SRR TRL3 Focal Plane Plan for detector focal plane completed, with options as required, prototype programme agreed, parts ordered.
TRL4 Detector Electronics
Build breadboards of detector electronics to demonstrate performance and reduced power consumption.
TRL3 Wide field optics
Trade-off for realisation of optical requirements of wide field, flat focal plane, plate-scale. Proof-of- concept design performed with extended ZEMAX optical design calculations, laboratory optical tests as required.
PDR TRL3 Focal Plane Prototype focal plane built and tested with detector electronics. Thermal vacuum testing.
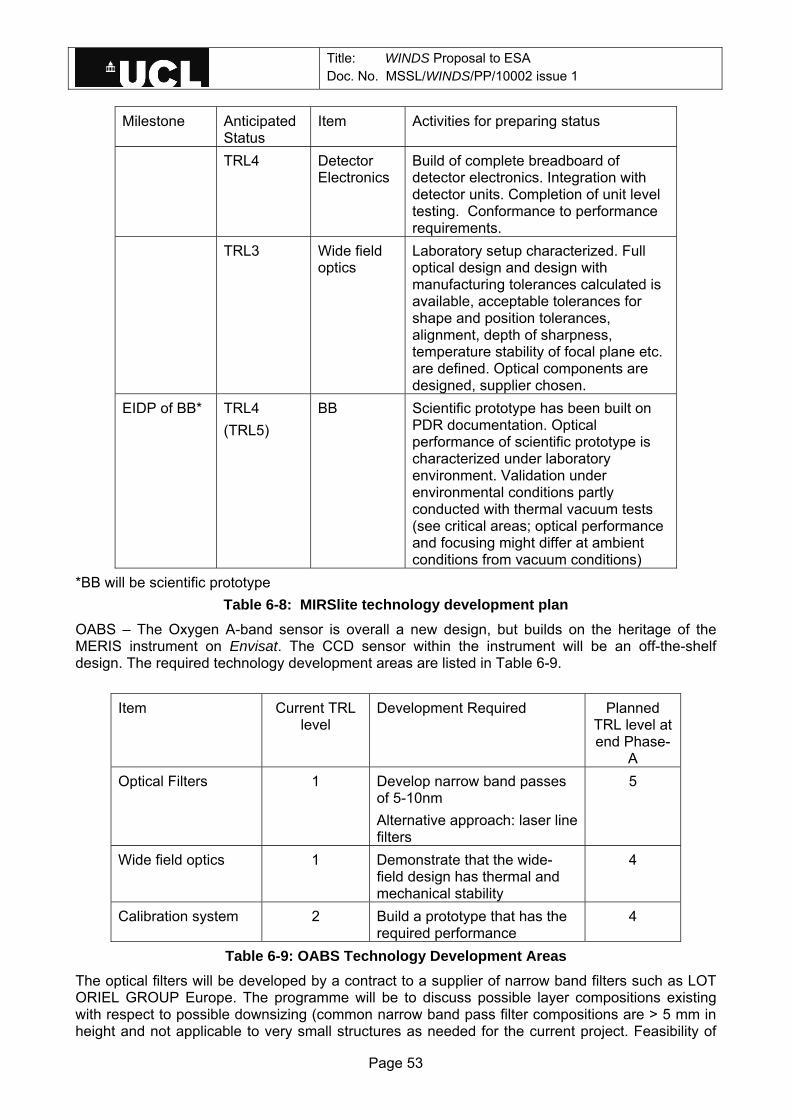
Title: WINDS Proposal to ESA Doc. No. MSSL/WINDS/PP/10002 issue 1
Page 53
Milestone Anticipated Status
Item Activities for preparing status
TRL4 Detector Electronics
Build of complete breadboard of detector electronics. Integration with detector units. Completion of unit level testing. Conformance to performance requirements.
TRL3 Wide field optics
Laboratory setup characterized. Full optical design and design with manufacturing tolerances calculated is available, acceptable tolerances for shape and position tolerances, alignment, depth of sharpness, temperature stability of focal plane etc. are defined. Optical components are designed, supplier chosen.
EIDP of BB* TRL4 (TRL5)
BB Scientific prototype has been built on PDR documentation. Optical performance of scientific prototype is characterized under laboratory environment. Validation under environmental conditions partly conducted with thermal vacuum tests (see critical areas; optical performance and focusing might differ at ambient conditions from vacuum conditions)
*BB will be scientific prototype Table 6-8: MIRSlite technology development plan
OABS – The Oxygen A-band sensor is overall a new design, but builds on the heritage of the MERIS instrument on Envisat. The CCD sensor within the instrument will be an off-the-shelf design. The required technology development areas are listed in Table 6-9.
Item Current TRL level
Development Required Planned TRL level at end Phase-
A Optical Filters 1 Develop narrow band passes
of 5-10nm Alternative approach: laser line filters
5
Wide field optics 1 Demonstrate that the wide-field design has thermal and mechanical stability
4
Calibration system 2 Build a prototype that has the required performance
4
Table 6-9: OABS Technology Development Areas The optical filters will be developed by a contract to a supplier of narrow band filters such as LOT ORIEL GROUP Europe. The programme will be to discuss possible layer compositions existing with respect to possible downsizing (common narrow band pass filter compositions are > 5 mm in height and not applicable to very small structures as needed for the current project. Feasibility of

Title: WINDS Proposal to ESA Doc. No. MSSL/WINDS/PP/10002 issue 1
Page 54
bandwidth smaller 10nm at anticipated wavelengths needs to be studied. The alternative approach of laser line filters promises smaller part sizes due to thin coating composition and bands around centre wavelength of 2nm as well as very high transmission. It needs to be studied, if anticipated centre wavelength can be reached with the laser line filters. The new technologies will be developed in the steps listed in Table 6-10. The wide field optics and calibration system will be developed under the control of the Phase-A instrument contract. In both cases a prototype will be developed as part of the contract. The calibration system for the prototype will be functionally representative to the EQM and FM, but without flight approved release mechanisms and redundancies. The Phase-A will include development of a scientific prototype of the instrument, with the aim that the instrument will be TRL 4/5 at the end of Phase-A.
Milestone Anticipated Status
Item Activities for preparing status
PRR TRL2 Optical Filters
Technology concept formulated for filter elements, cooperation partner chosen,
TRL2 Wide field optics
Trade-off for realisation of entrance optic, filters and layout of focal plan. Characteristic proof-of- concept performed with extended ZEMAX optical design calculations and simple laboratory setups
TRL2 Calibration system
Tailoring existing concept for the OABS instrument
SRR TRL3 Optical Filters
Experimental tests on optical setups with filters of selected wavelengths (either bandbass or laser line); Update of optical design calculations with the available filter characteristics, definition of requirements with filter subcontractor for prototype design and manufacturing
TRL3 Wide field optics
Analytical and experimental critical function and characteristic proof-of- concept performed with extended ZEMAX optical design calculations and simple laboratory setups
TRL3 Calibration system
Extended design analyses
PDR TRL3 Optical Filters
Prototype has been made available and has been characterised (centre wavelength, accuracy, bandwith, transmission) in the optical setup
TRL3 Wide field optics
Laboratory setup characterized. Full optical design and design with manufacturing tolerances calculated is available, acceptable tolerances for shape and position tolerances, alignment, depth of sharpness, temperature stability of focal plan etc. are defined. Optical components are designed, supplier chosen.
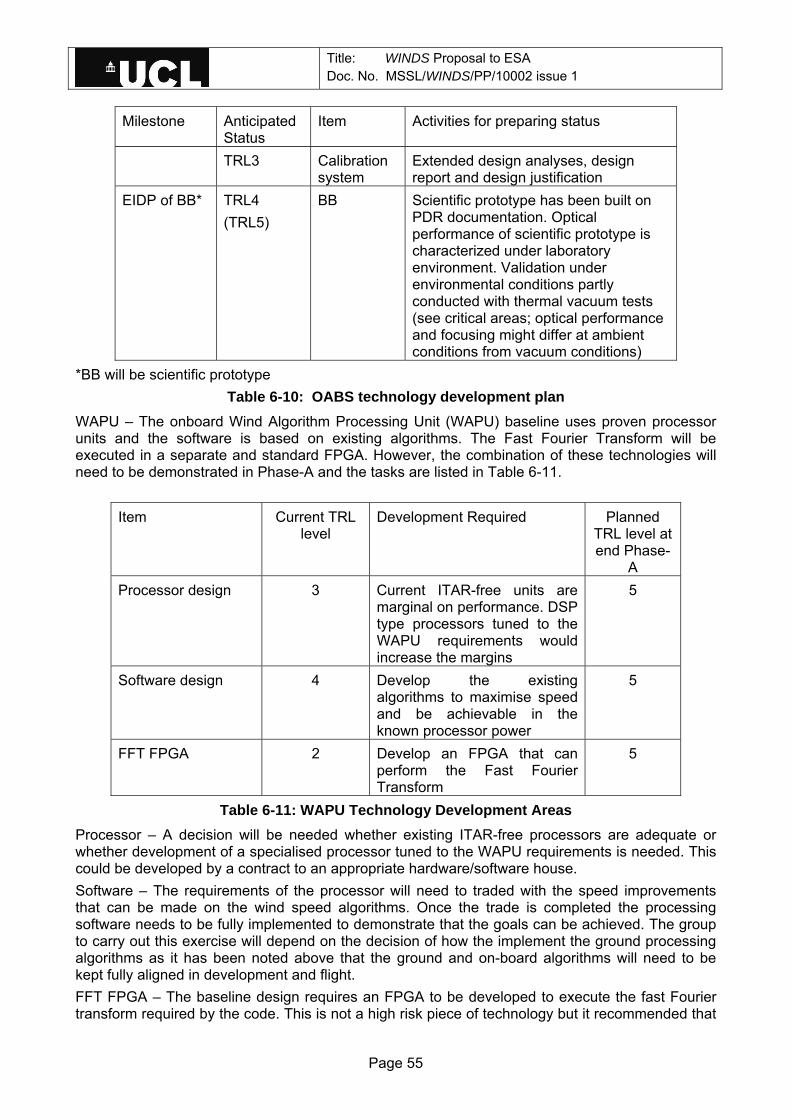
Title: WINDS Proposal to ESA Doc. No. MSSL/WINDS/PP/10002 issue 1
Page 55
Milestone Anticipated Status
Item Activities for preparing status
TRL3 Calibration system
Extended design analyses, design report and design justification
EIDP of BB* TRL4 (TRL5)
BB Scientific prototype has been built on PDR documentation. Optical performance of scientific prototype is characterized under laboratory environment. Validation under environmental conditions partly conducted with thermal vacuum tests (see critical areas; optical performance and focusing might differ at ambient conditions from vacuum conditions)
*BB will be scientific prototype Table 6-10: OABS technology development plan
WAPU – The onboard Wind Algorithm Processing Unit (WAPU) baseline uses proven processor units and the software is based on existing algorithms. The Fast Fourier Transform will be executed in a separate and standard FPGA. However, the combination of these technologies will need to be demonstrated in Phase-A and the tasks are listed in Table 6-11.
Item Current TRL level
Development Required Planned TRL level at end Phase-
A Processor design 3 Current ITAR-free units are
marginal on performance. DSP type processors tuned to the WAPU requirements would increase the margins
5
Software design 4 Develop the existing algorithms to maximise speed and be achievable in the known processor power
5
FFT FPGA 2 Develop an FPGA that can perform the Fast Fourier Transform
5
Table 6-11: WAPU Technology Development Areas Processor – A decision will be needed whether existing ITAR-free processors are adequate or whether development of a specialised processor tuned to the WAPU requirements is needed. This could be developed by a contract to an appropriate hardware/software house. Software – The requirements of the processor will need to traded with the speed improvements that can be made on the wind speed algorithms. Once the trade is completed the processing software needs to be fully implemented to demonstrate that the goals can be achieved. The group to carry out this exercise will depend on the decision of how the implement the ground processing algorithms as it has been noted above that the ground and on-board algorithms will need to be kept fully aligned in development and flight. FFT FPGA – The baseline design requires an FPGA to be developed to execute the fast Fourier transform required by the code. This is not a high risk piece of technology but it recommended that

Title: WINDS Proposal to ESA Doc. No. MSSL/WINDS/PP/10002 issue 1
Page 56
the development is completed in Phase-A so that a complete breadboard WAPU can be built and tested. System Design - The Phase-A will include development of a prototype of the unit, with the aim that the instrument will be TRL 4/5 at the end of Phase-A.
Milestone Anticipated Status
Item Activities for preparing status
PRR TRL3 Processor Trade-off of processor requirements and software performance. Allocation of budgets. Definition of final processor concepts. Selection of development partner.
TRL4 Software Trade-off of processor requirements and software performance. Allocation of budgets. Definition of code speed improvements needed. Decision on software development approach and selection of partner.
TRL2 FFT FPGA Trade-off of processor requirements and software performance. Allocation of budgets. Definition of speed/performance requirements of the FPGA. Selection of development partner.
SRR TRL4 Processor Initial system design. Simulation of performance. Breadboarding of key components. Benchmarking.
TRL5 Software Update of code to achieve speed improvements required. Benchmarking on standard processors.
TRL5 FFT FPGA Coding of FPGA to achieve requirements. Functional testing.
PDR TRL5 Processor Build of prototype WAPU unit (one complete chain). Integration of FFT FPGA. End to end testing.
TRL5 Software Goals achieved by SRR TRL5 FFT FPGA Goals achieved by SRR EIDP of BB* TRL5 BB Scientific prototype has been built on
PDR documentation. Performance characterized under laboratory environment. TV testing of prototype not envisaged.
Table 6-12: WAPU technology development plan
6.2 Ground Segment 6.2.1 General WINDS will require standard operational support as required by a LEO polar orbit. The special requirements are:
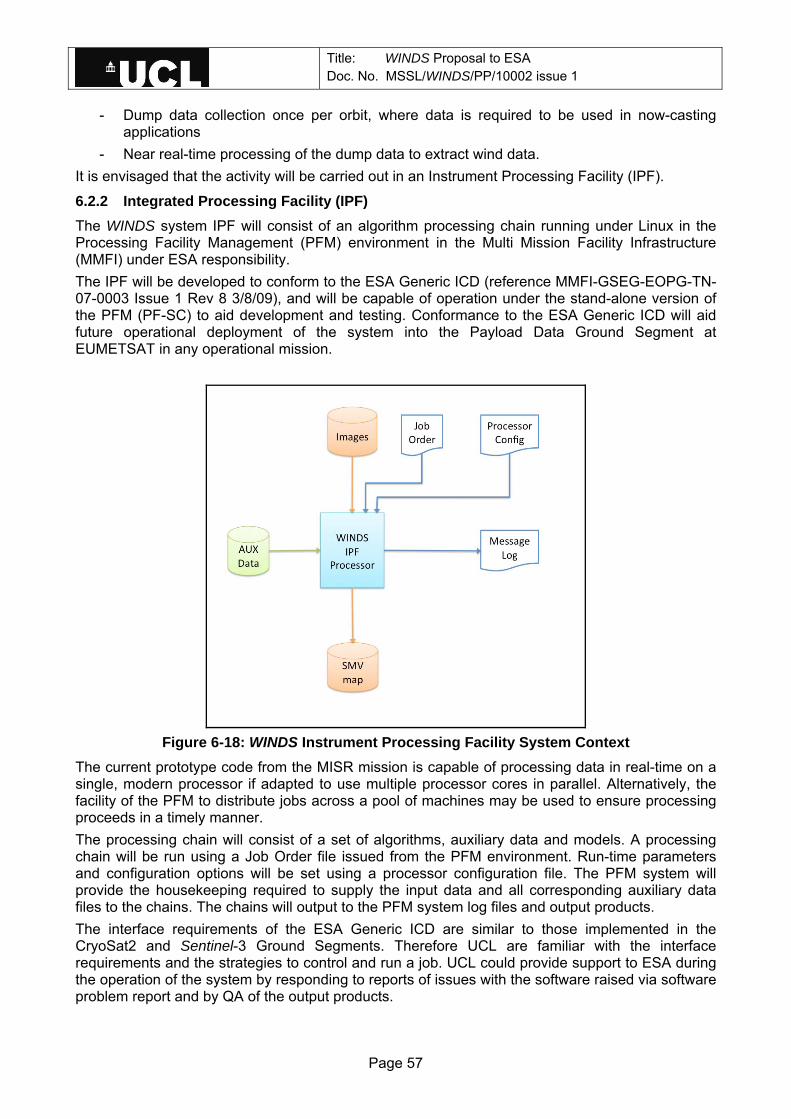
Title: WINDS Proposal to ESA Doc. No. MSSL/WINDS/PP/10002 issue 1
Page 57
- Dump data collection once per orbit, where data is required to be used in now-casting applications
- Near real-time processing of the dump data to extract wind data. It is envisaged that the activity will be carried out in an Instrument Processing Facility (IPF).
6.2.2 Integrated Processing Facility (IPF) The WINDS system IPF will consist of an algorithm processing chain running under Linux in the Processing Facility Management (PFM) environment in the Multi Mission Facility Infrastructure (MMFI) under ESA responsibility. The IPF will be developed to conform to the ESA Generic ICD (reference MMFI-GSEG-EOPG-TN-07-0003 Issue 1 Rev 8 3/8/09), and will be capable of operation under the stand-alone version of the PFM (PF-SC) to aid development and testing. Conformance to the ESA Generic ICD will aid future operational deployment of the system into the Payload Data Ground Segment at EUMETSAT in any operational mission.
Figure 6-18: WINDS Instrument Processing Facility System Context
The current prototype code from the MISR mission is capable of processing data in real-time on a single, modern processor if adapted to use multiple processor cores in parallel. Alternatively, the facility of the PFM to distribute jobs across a pool of machines may be used to ensure processing proceeds in a timely manner. The processing chain will consist of a set of algorithms, auxiliary data and models. A processing chain will be run using a Job Order file issued from the PFM environment. Run-time parameters and configuration options will be set using a processor configuration file. The PFM system will provide the housekeeping required to supply the input data and all corresponding auxiliary data files to the chains. The chains will output to the PFM system log files and output products. The interface requirements of the ESA Generic ICD are similar to those implemented in the CryoSat2 and Sentinel-3 Ground Segments. Therefore UCL are familiar with the interface requirements and the strategies to control and run a job. UCL could provide support to ESA during the operation of the system by responding to reports of issues with the software raised via software problem report and by QA of the output products.

Title: WINDS Proposal to ESA Doc. No. MSSL/WINDS/PP/10002 issue 1
Page 58
6.2.3 TRL status The ground data processing code has been developed under the MISR programme and the code technology is already at a high level, TRL 6 at least. It is not envisaged that any further technology development is required during Phase-A.
6.3 Mission Analysis and Operations Concept 6.3.1 Introduction The aim of this section is to define the orbit and operations that meet the science requirements, and allow a realistic system design to be proposed.
6.3.2 Constellation Analysis The discussion of a potential constellation is aimed at identifying derived requirements for the demonstrator. These requirements will identify necessary features that the demonstrator must have in order to effectively demonstrate the feasibility of the future constellation. The critical requirement that must be addressed at this stage is the propulsion and guidance systems required on the constellation (and therefore the demonstrator).
6.3.2.1 Constellation Definition The analysis assumes that the individual spacecraft are in similar orbits to that required by the demonstrator mission along with a couple of assumptions
Parameter Value Altitude 850 km Inclination 90° (for the sake of analysis,
may be slightly different) Eccentricity 0 Sun Synchronous
No
Table 6-13: Orbital parameters for the constellation The analysis looks at potential constellations of up to 10 satellites in total. These satellites are divided up among a specified number of planes. Within the framework the analysis is constrained to:
• Constant angles between RA of the ascending node (Ω) of the planes, e.g. 3 planes will be evenly spaced with 30° between their ascending nodes.
• Constant spacing (Mean anomaly) of the satellites within the planes, e.g. two satellites within a plane will be spaced 180° apart.
• Constant mean anomaly between planes. This depends on the number of satellites and the number of planes and assumes even spacing across the constellation (i.e. with 8 satellites in 4 planes the mean anomaly between planes is 90° to space the pairs of satellites out at any given moment
It is recognised that this may not identify the most efficient constellation for the task, but for this proposal it represents a set of constraints that can effectively narrow down what is a near infinite parameter space for the constellation. The constellations are therefore defined by three parameters; the number of satellites per plane, the mean anomaly between the satellites in a plane (i.e. their angular spacing) MA(S), and the mean anomaly between the satellites in neighbouring planes (i.e. how offset are the satellites in each plane from each other) MA(P).
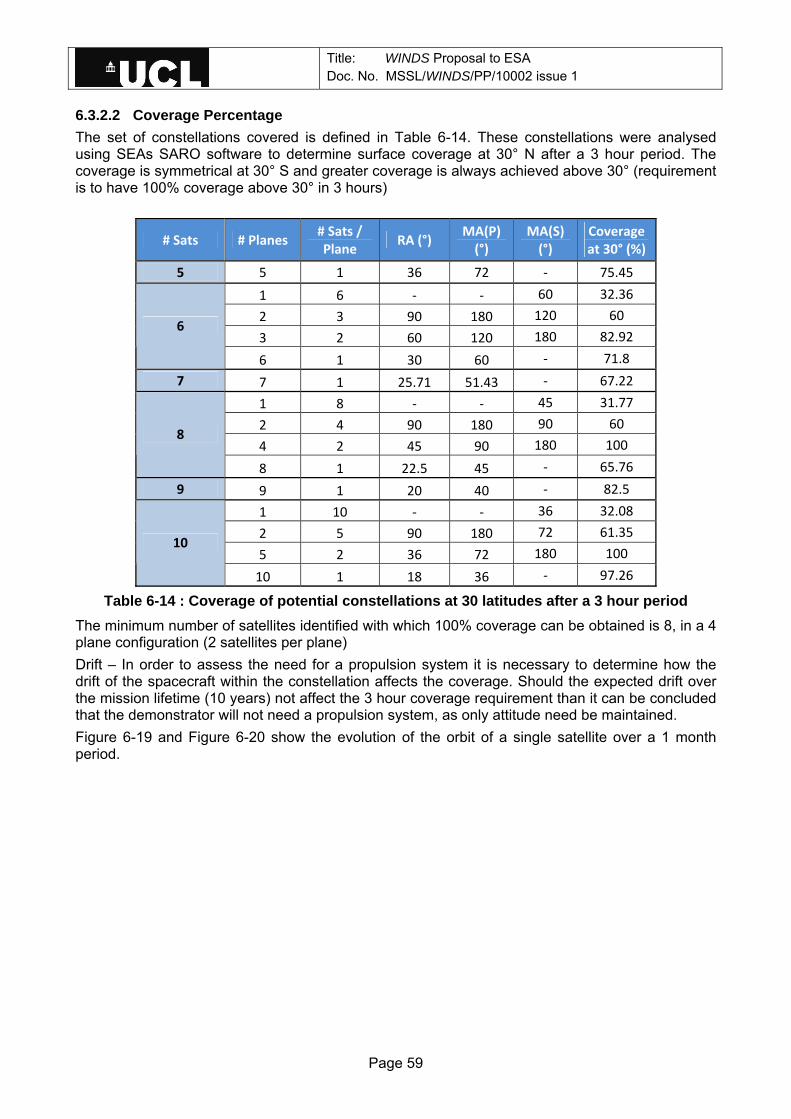
Title: WINDS Proposal to ESA Doc. No. MSSL/WINDS/PP/10002 issue 1
Page 59
6.3.2.2 Coverage Percentage The set of constellations covered is defined in Table 6-14. These constellations were analysed using SEAs SARO software to determine surface coverage at 30° N after a 3 hour period. The coverage is symmetrical at 30° S and greater coverage is always achieved above 30° (requirement is to have 100% coverage above 30° in 3 hours)
# Sats # Planes # Sats / Plane RA (°) MA(P)
(°) MA(S) (°)
Coverage at 30° (%)
5 5 1 36 72 ‐ 75.45
1 6 ‐ ‐ 60 32.36 2 3 90 180 120 60 3 2 60 120 180 82.92
6
6 1 30 60 ‐ 71.8 7 7 1 25.71 51.43 ‐ 67.22
1 8 ‐ ‐ 45 31.77 2 4 90 180 90 60 4 2 45 90 180 100
8
8 1 22.5 45 ‐ 65.76 9 9 1 20 40 ‐ 82.5
1 10 ‐ ‐ 36 32.08 2 5 90 180 72 61.35 5 2 36 72 180 100
10
10 1 18 36 ‐ 97.26
Table 6-14 : Coverage of potential constellations at 30 latitudes after a 3 hour period The minimum number of satellites identified with which 100% coverage can be obtained is 8, in a 4 plane configuration (2 satellites per plane) Drift – In order to assess the need for a propulsion system it is necessary to determine how the drift of the spacecraft within the constellation affects the coverage. Should the expected drift over the mission lifetime (10 years) not affect the 3 hour coverage requirement than it can be concluded that the demonstrator will not need a propulsion system, as only attitude need be maintained. Figure 6-19 and Figure 6-20 show the evolution of the orbit of a single satellite over a 1 month period.

Title: WINDS Proposal to ESA Doc. No. MSSL/WINDS/PP/10002 issue 1
Page 60
Keplerian Elements
0 5 10 15 20 25 307200
7220
7240
a
0 5 10 15 20 25 301.5699
1.57
1.5701
i
0 5 10 15 20 25 300
5
10
W
0 5 10 15 20 25 300
5
10
w
0 5 10 15 20 25 300
2
4x 10
-3
e
Time (days)
Figure 6-19 : Keplerian elements of single constellation orbit plane over a 1 month period
Keplerian Anomalies
0 5 10 15 20 25 30-5
0
5
M
0 5 10 15 20 25 30-5
0
5
E
0 5 10 15 20 25 30-5
0
5
v
0 5 10 15 20 25 300
2
4
L
Time (days)
Figure 6-20 : Keplerian anomalies of single constellation orbit plane over a 1 month period
The elements of interest are the inclination (i), the Mean anomaly (M) and the RA of the ascending node (W in the figures). It can be seen that the inclination varies a small amount away from 90° (2π radians), and the mean anomaly varies over a 5° range. The RA of the ascending node drifts by 5°, but then remains constant. It can be estimated that the RA remains fairly constant, but the mean anomaly can close the angle between satellites by up to 5°. Although it is likely that the forces causing the mean anomaly to vary will be constant over the whole orbit (e.g. drag and gravitational perturbation) and hence affect
Title: WINDS Proposal to ESA Doc. No. MSSL/WINDS/PP/10002 issue 1
Page 61
the satellites in the same way, a conservative analysis is taken that allows the satellites to move towards each other. Table 6-15 shows the effect of a change in the mean anomaly between satellites in a plane for the 8 and 10 satellite constellations that can attain 100% coverage.
4 Planes of 2 satellites 5 Planes of 2 satellites
MA(S) Coverage at 30° (%) Coverage at 30° (%)
180 100 100 170 99.55 100 160 99.55 100 150 99.55 100 140 99.13 100
Table 6-15 : Coverage of satellite constellations with 8 and 10 spacecraft with drift in mean anomaly
The analysis shows that the satellites can be allowed to drift by up to 20° each (total of 40°) without a significant impact on the coverage. A worst case analysis has been performed by calculating the orbit decay rate due to atmospheric drag at 850km (-0.027 km/year with a ballistic coefficient of 265 kg/m2), and calculating the angular drift as a consequence. This is performed in an iterative fashion month by month to determine the total drift in 10 years. Using this approach it can be calculated that an individual satellite will drift by 8.5° in mean anomaly due to orbit decay. Thus 99.55% coverage will be maintained over the 10 year mission. Of course this is assuming the drag operates only on one satellite in the plane, which is not the case, but it demonstrates that propulsion is not required to maintain sufficient separation in a plane. Drift of the RA of the ascending node can be calculated primarily by considering the first order perturbations of a non-spherical earth and those of the Sun and Moon
Where n is the mean motion of the satellite, J2 is the second zonal coefficient of the Earth, RE is the equatorial radius of the Earth, a is the semi-major axis of the orbit, I is the inclination, e the eccentricity and N the number of orbits per day. For the example orbit used for the constellation, i=0°, which returns zero for all the perturbations. In order to perform a worst case analysis, we have considered the demonstrator orbit (see section below) with i=98.81°. Given this is a sun-synchronous orbit we know that ΩEARTH is 1°/day, so this term is ignored as it will be the same for all satellites. The moon and sun perturbations can be added together and treated as a worst case perturbation on the RAAN of an individual satellite. This gives a perturbation of ~0.02°/year, or 0.2° over the course of the 10 year mission. This is well within acceptable limits.
6.3.3 Demonstrator Mission Orbit 6.3.3.1 Orbit and Operations The demonstrator mission orbit has the characteristics stated in Table 6-16.
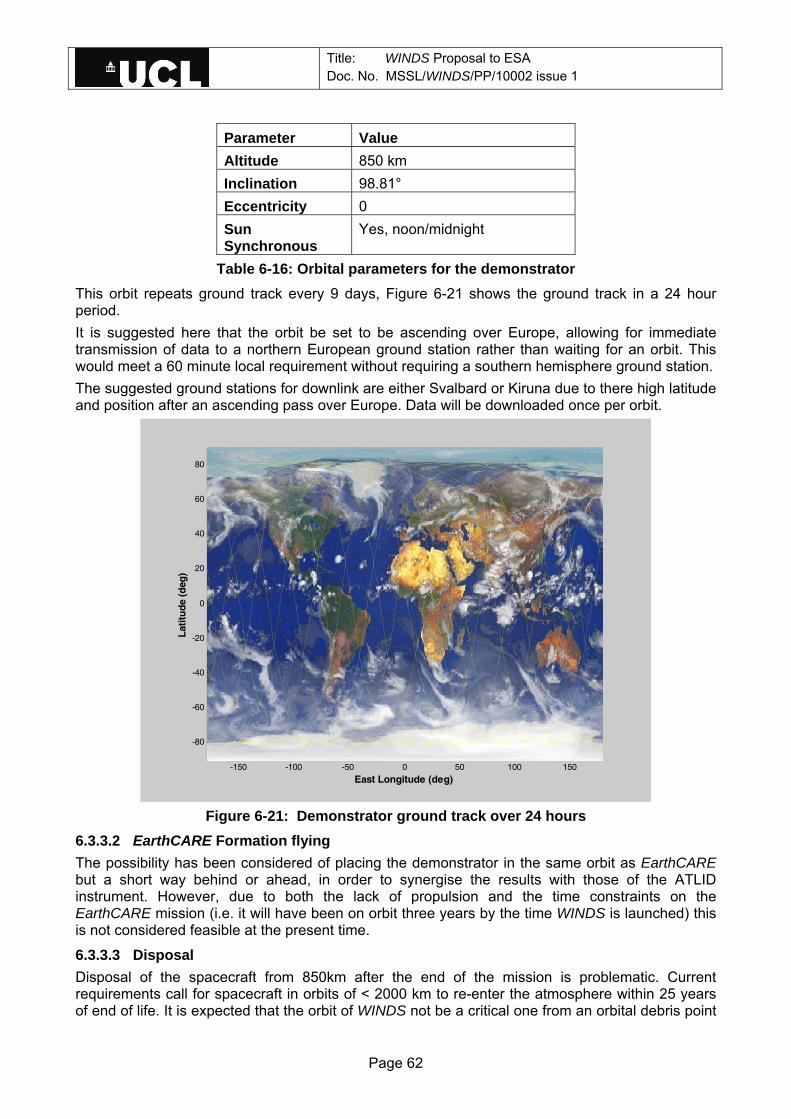
Title: WINDS Proposal to ESA Doc. No. MSSL/WINDS/PP/10002 issue 1
Page 62
Parameter Value Altitude 850 km Inclination 98.81° Eccentricity 0 Sun Synchronous
Yes, noon/midnight
Table 6-16: Orbital parameters for the demonstrator This orbit repeats ground track every 9 days, Figure 6-21 shows the ground track in a 24 hour period. It is suggested here that the orbit be set to be ascending over Europe, allowing for immediate transmission of data to a northern European ground station rather than waiting for an orbit. This would meet a 60 minute local requirement without requiring a southern hemisphere ground station. The suggested ground stations for downlink are either Svalbard or Kiruna due to there high latitude and position after an ascending pass over Europe. Data will be downloaded once per orbit.
-150 -100 -50 0 50 100 150
-80
-60
-40
-20
0
20
40
60
80
East Longitude (deg)
Lat
itu
de
(deg
)
Figure 6-21: Demonstrator ground track over 24 hours
6.3.3.2 EarthCARE Formation flying The possibility has been considered of placing the demonstrator in the same orbit as EarthCARE but a short way behind or ahead, in order to synergise the results with those of the ATLID instrument. However, due to both the lack of propulsion and the time constraints on the EarthCARE mission (i.e. it will have been on orbit three years by the time WINDS is launched) this is not considered feasible at the present time.
6.3.3.3 Disposal Disposal of the spacecraft from 850km after the end of the mission is problematic. Current requirements call for spacecraft in orbits of < 2000 km to re-enter the atmosphere within 25 years of end of life. It is expected that the orbit of WINDS not be a critical one from an orbital debris point

Title: WINDS Proposal to ESA Doc. No. MSSL/WINDS/PP/10002 issue 1
Page 63
of view, however guidance will be sought in the Phase-A study from the Agency as to the exact requirements for end of mission disposal. It is worth noting that if left for the orbit to decay due to atmospheric drag at 850km (the orbit will have decayed to only 847 km in this time). In-order to de-orbit from 850km, a delta-V of -~2 km/s is required. For a spacecraft weighing 100kg, this would require at least 50kg of propellant (assuming a bipropellant system with an Isp of 300s). This is clearly unfeasible in the frame of a low mass mission and would grossly affect the simplicity and cost of the mission in design and launcher selection.
6.3.4 Operations Strategy After placement in the final orbit, commissioning tests will be carried out over a three month time period to ensure that outgassing is completed and test and stress all aspects of the ground processing system. Timeliness is critical to ensure that data from WINDS is available to the NWP partners within a sufficiently short time period from imaging. This will require a two-pronged strategy to be adopted. In the first prong, onboard processing will be used to navigate and georeference each pixel and provide pixel-level acuity wind components on a 48km grid alongside 1.2km products in the satellite projection system. These will be directly broadcast and can be employed by weather services around the world for local and regional NWP forecasts and nowcasts in the case of severe weather. In the second prong, a complete data dump will be made of all looks collected (either once or twice an orbit depending on whether NASA might support an Antarctic receiving station in a similar manner to the one proposed for ADM-Aeolus). These data will then be processed at a suitable ground processing station in Europe. Then using the EUMETSAT infrastructure (EUMETCAST) the WINDS data will be re-broadcast and disseminated to European weather services (and hence worldwide through GTS).
6.4 OSSE The benefits to numerical weather prediction that are expected from assimilating stereo motion vectors (SMVs) in addition to existing sources of AMVs can be determined through an Observation System Simulation Experiments (OSSE) (Arnold and Dey, 1986; Lord et al., 1997) performed with and without MISR SMVs. This is further described in section 4.7. A crucial component of a traditional3 OSSE is the reference (or “true”) atmosphere – denoted as the Nature Run (NR) – which is represented by a model forecast spanning a period of time during which the new instrument is assessed. Note that the evolution of the atmospheric states as defined by the NR are not supposed to closely approximate the real atmosphere, as they are not constrained by observations (as opposed to, say, a succession of atmospheric analyses). This does not pose a problem, as long as the NR trajectory is realistic (i.e., its evolution represents a likely state of the climatological distribution), and has the advantage of representing the real atmosphere in the idealized case of the absence of initial and boundary conditions error as well as of model error. The NR that we would use in this project is that produced by ECMWF for the period between May 1st 2005 to June 1st 2006. The NR atmospheric fields, with a three-hour temporal frequency, have a T511 horizontal resolution, corresponding to a grid size of about 40 km, over 91 vertical levels. This succession of “true” atmospheric states is used to simulate a comprehensive set of imperfect observations, reflecting the statistical characteristics of the error on each observation, including representativeness error reflecting differences between the resolution of the measuring instruments and of the simulated atmosphere. Considerable attention needs to be paid on a reliable simulation of observation errors, given the results of the OSSE are sensitively dependent on them. However, real observations may be biased or have correlated errors and it may be challenging to reflect these characteristics on the simulated observations.
3 Other approaches to OSSEs are briefly discussed below

Title: WINDS Proposal to ESA Doc. No. MSSL/WINDS/PP/10002 issue 1
Page 64
The first task of an OSSE is to assimilate existing observations (i.e., excluding those from the instrument we want to assess) to test its ability to produce estimates of atmospheric state at a given time (denoted as “analysis”) that have characteristics that are, on average, similar to those produced with a data assimilation system that uses real observations. The OSSE performed for this project will make use of the latest version of the ECMWF operational 4D-Var data assimilation system (DAS), which is available for use provided access is granted through the ECMWF Member States allocation of computational resources. The NCEO group based at the University of Reading has acquired over the years a considerable experience on the use of the ECMWF DAS and will apply for accessing ECMWF computational resources to perform this OSSE. Due to its relatively high computational costs, the OSSE will only cover a relatively limited period of time, that is likely to be between one and two months, depending on the granted allocation of resources. If the results of the assimilation of existing observations in the DAS are considered realistic – a condition that may involve a number of successive adjustments – these are said to represent the “control” run that will be used to compare the OSSE results when the data from the new instrument is used together with all other available measurements. As anticipated above, the next step required for our OSSE is to perform the “perturbation” run, a data assimilation experiment using exactly the same configuration used for the control run, but with the addition of measurements of wind from the MISRlite instrument to the set of data to be assimilated. The data from the new instrument will have to be carefully simulated according to the expected characteristics of the instrument (e.g. spatial resolution, temporal frequency) and of its errors (e.g. precision, systematic and representativeness components). A possible way to test that the errors MISRlite is assumed to have are realistic is to compare real MISR SMVs with MISR SMVs that are simulated by means of the NR, which represents our true atmosphere. The statistical distribution of the differences between real and simulated MISR winds should reflect the distribution of MISR wind errors and can be used to guide the specification of MISRlite errors. Due to the relatively coarse resolution of the NR with respect to the resolution of MISRlite, we will perform the MISRlite OSSE with data at 12 km resolution, originally from cloud-top height and wind retrievals on a 1.2 km grid, to minimise problems due to an incorrect specification of the characteristics of representativeness errors. Results produced by the perturbation run during the chosen case study will be compared to the results with the control run, except for the initial part of the simulation period. The exclusion of this initial (often denoted as “spin-up”) period is motivated by the fact that during this period the observations simulated with model forecasts usually systematically differ from the observations simulated with the NR, due to the different configurations (including the choice of the initial conditions) of two models. The effect of assimilating observations from the NR into the two model used for the control and perturbation runs will tend to eliminate systematic differences between the model forecasts (owing to the fact that simulated observations are assumed unbiased) so that the differences between the different runs and the NR will only reflect differences due to different observational configurations. The length of the spin-up period can vary significantly, depending on the observational configuration and geographical location, and can be determined by monitoring the systematic differences between observations and model forecasts. In our case, the expected length of our experiment will pose a cap on the length of the spin-up time, which will be of the order of a week. To compare the two runs we will calculate the skill of the forecasts when using the control and the perturbation configurations. The agreement between forecasts and analyses for the two runs will be calculated by means of standard statistical indicators, such as the root-mean square difference and the anomaly correlation (AC), for a number of atmospheric fields. For example, we will compute the AC for the 500 hPa geopotential height, for both runs and compare the differences with the results obtained from the AC at 200 hPa and 850 hPa (e.g., Matsutani et al., 2006). Geographically dependent evaluations will also be performed, to reflect possible dependence of impact of MISRlite winds where there is less availability of wind measurements, as well over the tropics, where winds cannot be inferred from the mass field, due to the breakdown of the predominance of geostrophic balance.

Title: WINDS Proposal to ESA Doc. No. MSSL/WINDS/PP/10002 issue 1
Page 65
The robustness of the results obtained with the traditional OSSE can be tested by means of another approach to OSSEs that make use of a data assimilation ensemble technique (e.g. Tan et al., 2007). The advantage of this approach is that MISRlite winds are the only data source that needs to be simulated, while it is possible to use all other real data that are assimilated operationally at ECMWF. However, in this case the true atmosphere replaces the NR, with the result that an independent forecast (e.g., produced with the Met Office model) needs to be used to simulate MISRlite data, to avoid misrepresenting its errors. Results from these two types of OSSEs will be compared to provide an accurate assessment of MISRlite wind measurements.
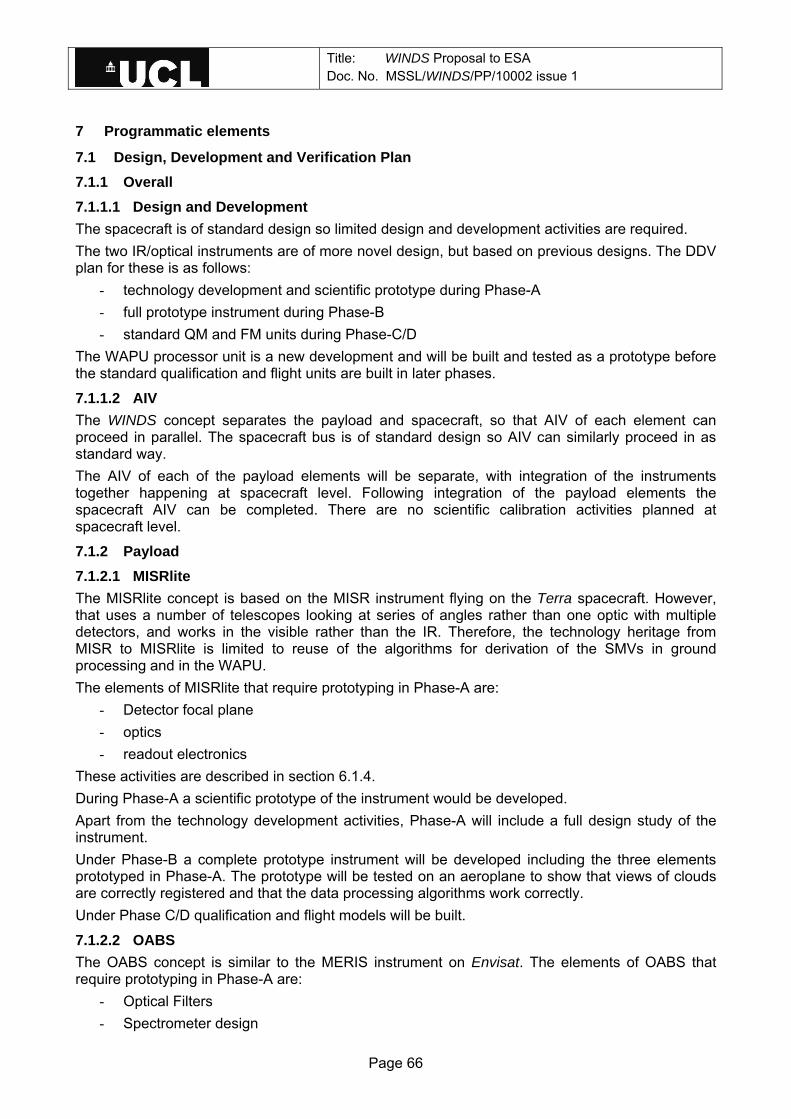
Title: WINDS Proposal to ESA Doc. No. MSSL/WINDS/PP/10002 issue 1
Page 66
7 Programmatic elements
7.1 Design, Development and Verification Plan 7.1.1 Overall 7.1.1.1 Design and Development The spacecraft is of standard design so limited design and development activities are required. The two IR/optical instruments are of more novel design, but based on previous designs. The DDV plan for these is as follows:
- technology development and scientific prototype during Phase-A - full prototype instrument during Phase-B - standard QM and FM units during Phase-C/D
The WAPU processor unit is a new development and will be built and tested as a prototype before the standard qualification and flight units are built in later phases.
7.1.1.2 AIV The WINDS concept separates the payload and spacecraft, so that AIV of each element can proceed in parallel. The spacecraft bus is of standard design so AIV can similarly proceed in as standard way. The AIV of each of the payload elements will be separate, with integration of the instruments together happening at spacecraft level. Following integration of the payload elements the spacecraft AIV can be completed. There are no scientific calibration activities planned at spacecraft level.
7.1.2 Payload 7.1.2.1 MISRlite The MISRlite concept is based on the MISR instrument flying on the Terra spacecraft. However, that uses a number of telescopes looking at series of angles rather than one optic with multiple detectors, and works in the visible rather than the IR. Therefore, the technology heritage from MISR to MISRlite is limited to reuse of the algorithms for derivation of the SMVs in ground processing and in the WAPU. The elements of MISRlite that require prototyping in Phase-A are:
- Detector focal plane - optics - readout electronics
These activities are described in section 6.1.4. During Phase-A a scientific prototype of the instrument would be developed. Apart from the technology development activities, Phase-A will include a full design study of the instrument. Under Phase-B a complete prototype instrument will be developed including the three elements prototyped in Phase-A. The prototype will be tested on an aeroplane to show that views of clouds are correctly registered and that the data processing algorithms work correctly. Under Phase C/D qualification and flight models will be built.
7.1.2.2 OABS The OABS concept is similar to the MERIS instrument on Envisat. The elements of OABS that require prototyping in Phase-A are:
- Optical Filters - Spectrometer design
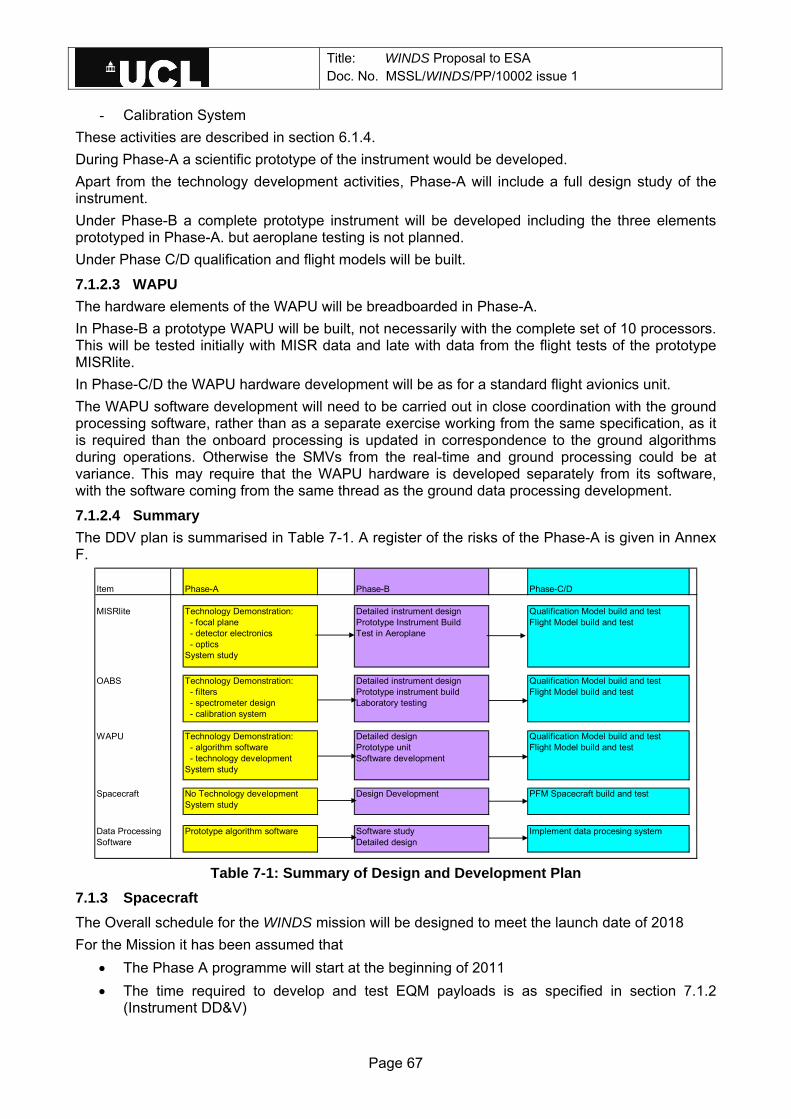
Title: WINDS Proposal to ESA Doc. No. MSSL/WINDS/PP/10002 issue 1
Page 67
- Calibration System These activities are described in section 6.1.4. During Phase-A a scientific prototype of the instrument would be developed. Apart from the technology development activities, Phase-A will include a full design study of the instrument. Under Phase-B a complete prototype instrument will be developed including the three elements prototyped in Phase-A. but aeroplane testing is not planned. Under Phase C/D qualification and flight models will be built.
7.1.2.3 WAPU The hardware elements of the WAPU will be breadboarded in Phase-A. In Phase-B a prototype WAPU will be built, not necessarily with the complete set of 10 processors. This will be tested initially with MISR data and late with data from the flight tests of the prototype MISRlite. In Phase-C/D the WAPU hardware development will be as for a standard flight avionics unit. The WAPU software development will need to be carried out in close coordination with the ground processing software, rather than as a separate exercise working from the same specification, as it is required than the onboard processing is updated in correspondence to the ground algorithms during operations. Otherwise the SMVs from the real-time and ground processing could be at variance. This may require that the WAPU hardware is developed separately from its software, with the software coming from the same thread as the ground data processing development.
7.1.2.4 Summary The DDV plan is summarised in Table 7-1. A register of the risks of the Phase-A is given in Annex F.
Item Phase-A Phase-B Phase-C/D
MISRlite Technology Demonstration: - focal plane - detector electronics - opticsSystem study
Detailed instrument designPrototype Instrument BuildTest in Aeroplane
Qualification Model build and testFlight Model build and test
OABS Technology Demonstration: - filters - spectrometer design - calibration systemS
Detailed instrument designPrototype instrument buildLaboratory testing
Qualification Model build and testFlight Model build and test
WAPU Technology Demonstration: - algorithm software - technology developmentSystem study
Detailed designPrototype unitSoftware development
Qualification Model build and testFlight Model build and test
Spacecraft No Technology developmentSystem study
Design Development PFM Spacecraft build and test
Data Processing Software
Prototype algorithm software Software studyDetailed design
Implement data procesing system
Table 7-1: Summary of Design and Development Plan
7.1.3 Spacecraft The Overall schedule for the WINDS mission will be designed to meet the launch date of 2018 For the Mission it has been assumed that
• The Phase A programme will start at the beginning of 2011 • The time required to develop and test EQM payloads is as specified in section 7.1.2
(Instrument DD&V)

Title: WINDS Proposal to ESA Doc. No. MSSL/WINDS/PP/10002 issue 1
Page 68
• EQM models will be flown and that a one month refurbishment programme will be required on completion of EQM testing;
• Procurement of long lead items will start a year before start of instrument AIT; • The time required to re-qualify, procure and test the platform ready for payload integration
is 18 months and commences 18 months before delivery of the payload. This activity is not, however, on the critical path and can commence earlier if required.
The COTS nature of the platform will mean a lengthy C/D phase for the platform is not required and the DD&V plan is driven by the Instrument development
7.1.4 Phase-A organisation It is envisaged that ESA will issue a consolidated tender for the Phase-A study of the WINDS mission, if it is selected at the EE-8 assessment. The Principal Investigator and other proposers will expect to be involved in the following areas on a continuing basis during Phase-A:
- Support of the scientific definition of the mission and translation into system requirements - Development of the algorithms for cloud recognition for the ground processing and on-
board processing functions ESA will need to consider how the development activities of the MISRlite instrument already carried out at UCL-MSSL and of the OABS instrument at FUB can be properly incorporated into the mission. ESA will also need to consider that the spacecraft development will not be the critical path for the mission and hence how sufficient emphasis is placed on the instrument development and that this is not held up by spacecraft contractual issues.
7.1.5 Phase-BCD organisation The WINDS programme development is consistent with an industrial tender for the complete phase BCD development. Parallel support of the scientific team will be required and is costed below.
7.1.6 Schedule An indicative schedule for development of WINDS is given in Figure 7-1.
Title: WINDS Proposal to ESA Doc. No. MSSL/WINDS/PP/10002 issue 1
Page 69
Phase-ASpacecraft study
Instrument Technology developmentInstrument science prototype buildOSSE
Phase-BCDMission selection
Tender processPrime selection
Spacecraft Phase B
Spacecraft developmentSpacecraft AIV
Instrument developmentInstrument designPrototype buildQM model build and testFM build and test
Launch campaign
Launch
2016 2017 20182012 2013 2014 2015
Figure 7-1: Indicative WINDS development Schedule
7.2 Cost Estimate 7.2.1 Science Team A provision of 2FTE (full-time equivalent) of support from the PI and a supporting team has been made for the Phase A and BCD. The cost of execution of the OSSE has been included in Phase-A under this heading.
7.2.2 Payload MISRlite – The Phase A cost is based on estimates for a programme at MSSL based on proving the technologies required plus a system study. The INO focal plane programme is based on indicative prices from INO. The optics study uses prices for build of the current optical design derived by ATC. The detector electronics development programme is based on the cost of an MSSL programme for Gaia in 2005. The Phase BCD cost is based on the cost at MSSL of previous instrument programmes and particularly on 60 staff years of effort required to develop, debug and build a complete new instrument. OABS – OABS costs are based on a short study of the programme by Astro und Feinwerktechnik GmbH. Provision has been made for the development of the technologies required for OABS. On-board software provision was not costed by Astro und Feinwerktechnik and has been added separately. WAPU – WAPU has been costed by analogy with the development of the digital electronics for the Solar Orbiter EUI instrument at MSSL. This includes high speed data acquisition and data compression in its functions. A descope to 70% of the EUI cost has been made on the basis of software development being simpler.
7.2.3 Spacecraft The following are the estimated costs for a small satellite platform of approximately 100kg total mass (e.g. SSTL-100 platform).
• Platform costs (including payload integration and EVT):

Title: WINDS Proposal to ESA Doc. No. MSSL/WINDS/PP/10002 issue 1
Page 70
o 100kg class small satellite: €5 to 10M • Launch campaign (excluding launch cost): £650 to 750k (0.7 to 0.8M€)
Note that any re-qualification costs are highly dependent on what has to be qualified and to what standards, the existing ECSS coverage of the chosen platform design will drive this. As an estimate the costs to re-qualify for the WINDS satellite (assuming as a worst case that the platform is not wholly recurring) is expected to be a further €8-10M. This is included in the cost estimate as a margin as the initial design has taken an approach designed to minimise the amount of non-recurrent engineering. Thus for the platform, it is expected that the total cost of the WINDS spacecraft will be approximately €20M Although not requested specifically as part of the proposal (and outside of any future industrial contract), an estimate of launch costs are
• Launch costs (typical figures for a DNEPR launch): o $12 to 20M (9 to 15M€ assuming an exchange rate of $0.75 to one €); o $3 to 4M ( 2.3 to 3M€ for a piggyback launch).
Figures for a DNEPR launch have been used as exact costs for a VEGA launch are not fixed yet.
7.2.4 Cost Summary The ROM cost for the mission are summarised in Table 7-2. More detailed breakdown is given in Annex E. This does not include the launch or the other activities listed as non applicable in [AD1].
WINDS cost SummaryElement Phase-A Phase-BCD Total
Keuro Keuro Keuro
Science Team 510 1276 1786
PayloadMISRlite 2097 9976 12073OABS 1930 6386 8316WAPU 554 3929 4483
Spacecraft 1000 20000 21000
Ground Segment 390 650 1040
Total 6482 42217 48699
Margin (20%) 9740
Total 58439 Table 7-2: WINDS Mission Cost Summary
Title: WINDS Proposal to ESA Doc. No. MSSL/WINDS/PP/10002 issue 1
Page 71
Annex A. The WINDS team Name and Affiliation Area of Expertise
(Involvement in other missions) Prof. Jan-Peter Muller (PI) Mullard Space Science Laboratory, UCL, UK
SMV retrieval, analysis & validation (MISR, MODIS)
Dr Chris Chaloner (CoI) Systems Engineering & Assessment Ltd, Frome, UK
Spacecraft design and revisit statistics (EARTHCARE)
Prof Jürgen Fischer (CoI) Institut für Weltraumwissenschaften, Freie Universität Berlin, D
O2 A-band retrieval, analysis, validation, radiative transfer simulations (MERIS)
Dr Iliana Genkova (CoI) KNMI: Royal Netherlands Meteorological Institute, NL
NWP data analysis, validation
Dr Ákos Horváth (CoI) MPI-M: Max Planck Institute for Meteorology Hamburg, D
SMV retrieval, analysis, validation (MISR)
Dr Stefano Migliorini (CoI) University of Reading, UK
OSSE
Dr Roger Saunders (CoI) Met Office, UK
Product validation and NWP data assimilation
Dr Gabriela Seiz (CoI) MétéoSwiss, CH
NWP data assimilation
Dr Ad Stoffelen (CoI) KNMI: Royal Netherlands Meteorological Institute, NL
NWP data assimilation (ADM-Aeolus, MetOp (-A,B,C), ERS, QuikScat, CFOSAT, OceanSat-2)
Dr Dong Wu (CoI) NASA Jet Propulsion Laboratory, Pasadena, USA
Small-scale ABL & hurricanes (MISR)
CVs of the investigators are at Annex D.

Title: WINDS Proposal to ESA Doc. No. MSSL/WINDS/PP/10002 issue 1
Page 72
In addition to the investigators, the following have made input to this proposal. Mullard Space Science Laboratory, University College London
Richard Cole David Brockley Dan Fisher Phil Smith Phil Thomas David Walton
Systems Engineering & Assessment Ltd Simon Chalkley Michael Guest
Institut für Weltraumwissenschaften, Freie Universität Berlin
Rasmus Lindstrot
University of Reading Zofia Stott Met Office, UK Mary Forsythe Astro- und Feinwerktechnik Adlershof GmbH
Claudia Kirstein
INO, Canada François Châteauneuf Claude Chevalier
Astronomy Technology Centre, UK Eli Atad-Ettedgui David Henry
Title: WINDS Proposal to ESA Doc. No. MSSL/WINDS/PP/10002 issue 1
Page 73
Annex B - Final References Aguirre, M., and Coauthors, (2007) Sentinel-3, the ocean and medium-resolution land mission for GMES operational services. ESA Bull., 131, 24–29. Alpbach (2004), Third WMO Workshop on the Impact of Various Observing Systems on NWP, Alpbach, Austria 9-12 March 2004. http://www.wmo.ch/pages/prog/www/GOS/Alpbach2004/Agenda-index.html Andersson, E., Bauer, P., Beljaars, A., Chevallier, F., Hólm, E., Janisková, M., Kållberg, P., Kelly, G., Lopez, P., Mcnally, A., Moreau, E., Simmons, A.J., Thépaut, J.-N., Tompkins, A.M. (2005): Assimilation and modelling of the atmospheric hydrological cycle in the ECMWF forecasting system, Bulletin of the American Meteorological Society, 86, 387-402. Arnold, C. P., Jr. and C. H. Dey, (1986) Observing-systems simulation experiments: Past, present, and future. Bull. Amer., Meteor. Soc., 67, 687-695. Bolin, B. et al. (1995). "IPCC Second Assessment: Climate Change 1995. A Report of the Intergovernmental Panel on Climate Change" Buriez, J., and Coauthors, (1997) Cloud detection and derivation of cloud properties from POLDER (processing algorithms). Int. J. Remote Sens., 18, 2785–2813. Burrows, J., and Coauthors, (1999): The Global Ozone Monitoring Experiment (GOME): Mission concept and first scientific results. J. Atmos. Sci., 56, 151–175. Davies, R., Horváth, Á., Moroney, C., Zhang, B., Zhu, Y. (2007) Cloud motion vectors from MISR using sub-pixel enhancements, Remote Sens. Environ., 107, 194-199 Fell, F., and J. Fischer, (2001) Numerical simulation of the light field in the atmosphere–ocean system using the matrix-operator method. J. Quant. Spectrosc. Radiat. Transf., 69, 351–388. Fischer, J., and H. Grassl, (1984) Radiative transfer in an atmosphere–ocean system: An azimuthally dependent matrix-operator approach. Appl. Opt., 23, 1032–1039. Fischer, J., and H. Grassl, (1991) Detection of cloud-top height from backscattered radiances within the oxygen A band. Part 1: Theoretical study. J. Appl. Meteor., 30, 1245–1259. Fischer, J , W. Cordes, A. Schmitz-Pfeifer, W. Renger, and P. Mörl, (1991) Detection of cloud-top height from backscattered radiances within the oxygen A band. Part 2: Measurements. J. Appl. Meteor., 30, 1260–1267. Fischer, J, R. Preusker, and L. Schüller, (1997) ATBD 2.3 cloud top pressure. Algorithm Theoretical Basis Doc. PO-TN-MELGS-0006, European Space Agency, 28 pp. Hinkelman, L. N., R. T. Marchand, and T. P. Ackerman, (2009) Evaluation of Multiangle Imaging Spectroradiometer cloud motion vectors using NOAA radar wind profiler data. J. Geophys. Res, 114, 12 Holden, M., Zemerly, M.J., Muller, J.-P. (1993) Parallel Stereo and Motion Estimation., in: I. Pitas, (Ed), Parallel Architectures and Algorithms for Computer Vision, Image Processing and Neural Networks, John Wiley & Sons, Chichester, 1993, pp. 175-232. Holmlund, K. (1998) The utilization of statistical properties of satellite-derived atmospheric motion vectors to derive quality indicators. Weather Forecasting 13, 1093–1104. Horváth, Á., R. Davies, R. (2001) Simultaneous retrieval of cloud motion and height from polar- orbiter multiangle measurements, Geophys. Res. Lett. 28, 2915-2918. Horváth, Á., R. Davies, R. (2001) Feasibility and error analysis of cloud motion wind extraction from near-simultaneous multiangle MISR measurements, J. Atmos. Ocean. Technol. 18, 591-608. Horváth, Á., R. Davies, and G. Seiz, (2002) Status of MISR cloud-motion wind product, Proceedings of the Sixth International Winds Workshop, Madison, Wisconsin, USA, 7-10 May 2002, EUMETSAT P.35, Darmstadt, pp. 269-275. Houghton et al. (2001) “IPCC Third Assessment: Scientific Basis”
Title: WINDS Proposal to ESA Doc. No. MSSL/WINDS/PP/10002 issue 1
Page 74
Jovanovic, V.M., Smyth, M.M., Zong, J. Ando, R., Bothwell, G.W. (1998) MISR photogrammetric data reduction for geophysical retrievals., IEEE Trans. Geosci. & Rem. Sens. 36, 1290-1301. Kuze, A., and K. V. Chance, (1994) Analysis of cloud top height and coverage from satellites using the O2 A and B bands. J. Geophys. Res., 99, 14 481–14 491. Lindstrot, R., R. Preusker, T. Ruhtz, B. Heese, M. Wiegner, C. Lindemann, and J. Fischer, (2006) Validation of MERIS cloud top pressure using airborne lidar measurements. J. Appl. Meteor. Climatol., 45, 1612–1621. Lindstrot, R, Preusker, R. and Fischer, J., (2010) The empirical correction of stray light in the MERIS oxygen A band channel, J. Atmos. Oceanic Technol., in press Lord, S. J., E. Kalnay, R. Daley, G. D. Emmitt, and R. Atlas, (1997) Using OSSEs in the design of the future generation of integrated observing systems, Preprints, First Symp. on Integrated Observing Systems, Long Beach, CA, Amer. Meteor. Soc., 45–47. Lonitz, K.,(2010) Comparison of MISR and Meteosat-9 cloud motion winds, MSc thesis, University of Leipzig, Leipzig, Germany, p. 107. Ludewig, E., (2010) Multi-sensor analysis of cloud-top height along stratocumulus to cumulus transition trajectories, MSc thesis, University of Hamburg, Hamburg, Germany. Masutani, M., J.S. Woollen, S.J. Lord, T.J. Kleespies, G.D. Emmitt, H. Sun, S. A. Wood, S. Greco, J. Terry, and K. Campana, (2006) Observing System Simulation Experiments at NCEP. NCEP Office Note No. 451. Merheim-Kealy, P., J. P. Huot, and S. Delwart, (1999) The MERIS ground segment. Int. J. Remote Sens., 20, 1703–1712. Moroney, C. M., Á. Horváth, and R. Davies (2002), Use of stereo-matching to co-register multiangle data from MISR, IEEE Transactions on Geoscience and Remote Sensing, 40(7), pp. 1541-1546. Moroney, C., Davies, R., Muller, J.-P. (2002) Operational Retrieval of Cloud-Top Heights Using MISR Data. IEEE Transactions on Geoscience and Remote Sensing, 40, 1532-1540 Mueller, K., Garay, M.J., Di Girolamo, L., Jovanovic, V., Moroney, C., Davies, R., Diner, D.J. (2010), MISR Cloud Motion Vector product Algorithm Theoretical Basis. JPL D-64973, February 9. Muller, J.P., Mandanayake, A., Moroney, C., Davies, R., Diner, D.J., Paradise, S. (2002) MISR stereoscopic image matchers: Techniques and results, IEEE Trans. Geosci. Remote Sensing 40, 1547-1559. Muller, J.-P., Denis, M., Dundas, R.D., Mitchell, K.L., Naud, C., Mannstein, H. (2007) Stereo cloud-top heights and cloud fraction retrieval from ATSR-2, Int. J. Remote Sens. 28, 2007, pp. 1921-1938. Muller, J.-P., R. Preusker, J. Fischer, M. Zuhlke, C. Brockmann, and P. Regner, (2007) ALBEDOMAP: MERIS land surface albedo retrieval using data fusion with MODIS BRDF and its validation using contemporaneous EO and in situ data products. Proc. IGARSS Int. Geoscience and Remote Sensing Symp., Barcelona, Spain, Institute of Electrical and Electronics Engineers, 2404–2407. Naud, C., J. P. Muller, and E. E. Clothiaux, (2002) Comparison of cloud top heights derived from MISR stereo and MODIS CO2-slicing. Geophysical Research Letters, 29, art. no.-1795. Naud, C., J. P. Muller, and P. de Valk, (2005) On the use of ICESAT-GLAS measurements for MODIS and SEVIRI cloud-top height accuracy assessment. Geophysical Research Letters, L19815. Naud, C., J. P. Muller, M. Haeffelin, Y. Morille, and A. Delaval, (2004) Assessment of MISR and MODIS cloud top heights through intercomparison with a back-scattering lidar at SIRTA. Geophysical Research Letters, 31, art. no.-L04114.
Title: WINDS Proposal to ESA Doc. No. MSSL/WINDS/PP/10002 issue 1
Page 75
Naud, C. M., J. P. Muller, and E. E. Clothiaux, (2003) Comparison between active sensor and radiosonde cloud boundaries over the ARM Southern Great Plains site. Journal of Geophysical Research-Atmospheres, 108, art. no.-4140 Naud, C. M., J. P. Muller, E. C. Slack, C. L. Wrench, and E. E. Clothiaux, (2005a) Assessment of the performance of the Chilbolton 3-GHz advanced meteorological radar for cloud-top-height retrieval. Journal of Applied Meteorology, 876-887. Naud, C. M., Muller, J.-P., Clothiaux, E. E., Baum, B.A., Menzel, W.P., (2005b.) Intercomparison of multiple years of MODIS, MISR and radar cloud-top heights. Annales Geophysicae, 23, 2415-2424 O’Brien, D., and R. Mitchell, (1992) Error estimates for retrieval of cloud-top pressure using absorption in the A band of oxygen. J. Appl. Meteor., 31, 1179–1192. Perri, S, Lanuzzaa, M, Corsonellob, P, (2005), “A high-performance fully reconfigurable FPGA-based 2D convolution processor Microprocessors and Microsystems”, Volume 29, Issues 8-9, 1 November 2005, 381-391 Philander, S. G. (1990). El Niño, La Niña and the Southern Oscillation. Academic Press, 286pp Preusker, R., and R. Lindstrot, (2009) Remote Sensing of Cloud-Top Pressure Using Moderately Resolved Measurements within the Oxygen A Band—A Sensitivity Study. J. Appl. Meteor. Climatol., 48, 1562–1574. Sandu, I., Stevens, B., and Pincus, R.: (2010) On the transitions in marine boundary layer cloudiness, Atmos. Chem. Phys., 10, 2377-2391, doi:10.5194/acp-10-2377-2010. Stoffelen, A. (1998) Towards the True Near-Surface Wind Speed: Error Modelling and Calibration Using Triple Collocation, J. Geophys. Res.,103, 7755-7766 Stoffelen A., Pailleux, J., Källén, E., Vaughan, J. M., Isaksen, L., Flamant, P., Wergen, W., Andersson, E., Schyberg, H., Culoma, A., Meynart, R., Endemann, M., Ingmann, P. (2005) The Atmospheric Dynamics Mission For Global Wind Field Measurement. Bulletin of the American Meteorological Society: 86, 73–87 Stoffelen, A., Bonavita, M., Eyre, J., Goldberg, M., Järvinen, H., Serio, C., Thépaut, J.-N., Wulfmeyer, V. (2006): Position Paper – Post-EPS Developments on Atmospheric Sounding and Wind Profiling. EUMETSAT Position Paper. Tan, D.G.H., E. Andersson, M. Fisher and L. Isaksen (2007) Observing system impact assessment using a data assimilation ensemble technique: Application to the ADM-Aeolus wind profiling mission . Q.J.Roy.Met.Soc, 133, 381-390. Tett, S., Bates, J., Boers, R., Chédin, A., Dewitte, S., McCarthy, M., Schulz, J., Werner Thomas, W. (2006): Position Paper - Post-EPS: Generic Requirements on Climate Monitoring. EUMETSAT Position Paper. Vanbauce, C., J. Buriez, F. Parol, B. Bonnel, G. Seze, and P. Couvert, (1998) Apparent pressure derived from ADEOSPOLDER observations in the oxygen A-band over ocean. Geophys. Res. Lett., 25, 3159–3162. Wong, K., Lap, Y., Li, P. (2008) Automatic tropical cyclone eye fix using genetic algorithm, Expert Systems with Applications, 34, 643-656. WMO (2004) TD No. 1052: Statement of guidance regarding how well satellites and in situ sensor capabilities meet WMO user requirements in several application areas. WMO (2005) TD No. 1267: Implementation plan for the evolution of space and surface-based sub-systems of the GOS. http://www.wmo.ch/pages/prog/www/OSY/Publications/TD1267_Impl-Plan_Evol-GOS.pdf Wu, M.-L. C., (1985) Remote sensing of cloud-top pressure using reflected solar radiation in the oxygen A-band. J. Climate Appl. Meteor., 24, 539–546. Yamamoto, G., and D. Wark, (1961) Discussion of the letter by R. A. Hanel: Determination of cloud altitude from a satellite. J. Geophys. Res., 66, 3569.

Title: WINDS Proposal to ESA Doc. No. MSSL/WINDS/PP/10002 issue 1
Page 76
Žagar N. (2004) Assimilation of Equatorial Waves by Line-of-Sight Wind Observations. Journal of the Atmospheric Sciences, 61, 1877–1893. Zinner, T., Mannstein, H., Tafferner, A. (2008) Cb-TRAM: Tracking and monitoring severe convection from onset over rapid development to mature phase using multi-channel Meteosat-8 SEVIRI data, Meteorol. Atmos. Phys., 101, 191-210. Zong, J., Davies, R., Muller, J.-P., Diner, D.J. (2002) Photogrammetric retrieval of cloud advection and top height from the multi-angle imaging spectroradiometer (MISR), Photogramm. Eng. Remote Sensing of Environment, 68, 821-829.

Title: WINDS Proposal to ESA Doc. No. MSSL/WINDS/PP/10002 issue 1
Page 77
Annex C: Letter of Support from EUMETSAT


Title: WINDS Proposal to ESA Doc. No. MSSL/WINDS/PP/10002 issue 1
Page 78
Annex D: Team CVs
Prof. Jan-Peter Muller Professor Jan-Peter Muller is the leader of the Imaging Group at MSSL since moving from the UCL Department of Geomatic Engineering in September 2006 where he was previously leader of the environmental monitoring and mapping group for 15 years. He currently first supervises 3 PhD students including a NERC-CASE student working on developing autonomous 3d vision guided helicopter swarms for vicarious radiometric calibration over mountainous terrain including forests and urban areas with NPL, a NERC-NCEO student (in collaboration with CLRC) working on using AATSR stereo cloud-top heights for establishing an independent cloud climatology for climate studies and a STFC student working on solar CME teleconnections to cloud formation and lightning in the polar regions.. He is also about to commence co-supervision of a NERC CEOI-supported PhD student who will be working on natural forest scene simulation of lidar echo waveforms using Monte Carlo ray-tracing. He currently supervises one post-doc working on a STFC-funded grant on the role of water on Mars and another post-doc working on the development of a generic stereo workstation for Mars rover stereo imagery. He is PI of the ESA GlobAlbedo project and supervises two programmers who are working on the creation and validation of a 15 year time series of land surface albedo measurements. He is also a CoI on the ESA ALANIS project and supervises a post-doc working on developing new methods of retrieving smoke plume injection heights for use in numerical model simulations of smoke soot transport. He is involved in two EU-FP7 projects concerned with stereo panoramic camera data fusion with orbital high resolution imagery and aerobot measurements of fluorescent imaging or PAH organics and biological material. He has been a science team member on the NASA MODIS experiment (which flies on TERRA and AQUA) since 1989 jointly responsible with Dr Alan Strahler (and now Dr Crystal Schaaf) of Boston University for the BRDF/albedo algorithm development and was engaged in developing under ESA contract a global MERIS land surface albedo product based on his work on MODIS. He has been a science team member on the NASA MISR experiment (which flies on TERRA) since 1990 and has been responsible for the development of the world’s first operational stereo matching and photogrammetric system for the production of global cloud-top heights and winds. He is the recipient of two NASA Achievement Awards for these contributions. He was leader of the HEFCE-JISC funded LANDMAP project which produced a 30m DEM of the British Isles using the ESA ERS-tandem radar interferometric data-set which is the most heavily used geo-dataset from any of the CHEST holdings. He is Chair of the JISC Geospatial Working Group since 2005. Since 2009, he is a member of the Planetary Science Sub-Panel of the STFC Astronomy Grants Panel. Since 2010, he is chair of the UK Space Agency Aurora Advisory Committee. From 1997-2003, he was the Co-ordinator of two EU funded projects concerned with the 3D mapping of clouds from space, their validation using ground-based radar and lidar systems and a thermal IR camera, the use of satellite data products for data assimilation in a NWP model and the delivery and dissemination of Near-real Time cloud products for forecasting offices in several European National Meteorological Services. Both projects received excellent reviews from the European Commission. Professor Muller is currently Chairman of the CEOS Working Group on Calibration/Validation Sub-group on “Terrain mapping from satellites” and leader of the GEO DA-09-03d task on “Global DEM” which aims to complete a global 30m public domain DEM of the entire earth’s land surface by June 2012. Key Publications Professor Muller has contributed towards 78 peer reviewed papers, 10 books and 176 conference papers as well as 13 other media multi-media works including the award-winning Erd-Sicht Global Change videodisk (Melia 1993), the consumer 3D Atlas® (BIMA 1994) which has sold over 5 million copies worldwide. A few recent peer review papers are listed below which are relevant to this application. Cawkwell, F. G. L., J. L. Bamber, and J.-P. Muller, 2001: Determination of cloud top amount and altitude at high latitudes. Geophysical Research Letters, 28, 1675-1678. Chapman, L., J. E. Thorne, J.-P. Muller, and S. McMuldroch (2007): Potential applications of thermal fisheye imagery in urban environments. IEEE Geoscience and remote Sensing Letters, 4, 56-59 Denis, M. A., J.-P. Muller, and H. Mannstein, (2007): ATSR-2 camera models for the automated stereo photogrammetric retrieval of Cloud-Top heights. International Journal of Remote Sensing, 28, 1939-1955.
Diner, D. J., B. H. Braswell, R. Davies, N. Gobron, J. Hu, Y. Jin, R. A. Kahn, Y. Knyazikhin, N. Loeb, J. P. Muller, A. W. Nolin, B. Pinty, C. B. Schaaf, G. Seitz, and J. Stroeve, 2005: The value of multiangle measurements for retrieving structurally and radiatively consistent properties of clouds, aerosols, and surfaces. Remote Sensing of Environment, 97, 495-518. Diner, D. J., M. Mischna, R. A. Chipman, A. Davis, B. Cairns, R. Davies, R. A. Kahn, J.-P. Muller, and O. Torres, 2008: WindCam and MSPI: two cloud and aerosol instrument concepts derived from Terra/MISR heritage. SPIE Earth Observing Systems XIII, San Diego, SPIE, 70810T-70810T-9. Li, Z., J.-P. Muller, Cross, P., Albert. P., Fischer, J., Bennartz, R. (2006). "Assessment of the potential of MERIS Near-infrared Water Vapour Products to Correct ASAR Interferometric Measurements." Int. J. Rem. Sens. 27: 349-365 Marchand, R. T., T. P. Ackerman, M. D. King, C. Moroney, R. Davies, J.-P. Muller, and H. Gerber, 2001: Multiangle observations of Arctic clouds from FIRE ACE: June 3, 1998, case study. Journal of Geophysical Research-Atmospheres, 106, 15201-15214. Moroney, C., R. Davies, and J.-P. Muller, 2002: Operational retrieval of cloud-top heights using MISR data. IEEE Transactions on Geoscience and Remote Sensing, 40, 1532-1540. Muller, J.-P., A. Mandanayake, C. Moroney, R. Davies, D. J. Diner, and S. Paradise, 2002: MISR stereoscopic image matchers: Techniques and results. IEEE Transactions on Geoscience and Remote Sensing, 40, 1547-1559. Muller, J.-P. and J. Fischer (2007): The EU-CLOUDMAP Project on "Cirrus and contrail cloud-top maps from satellites for weaather forecasting climate change analysis". International Journal of Remote Sensing, 28, 1915-1919. Muller, J.-P., M. A. Denis, R. Dundas, K. L. M. Mitchell, C. M. Naud, and H. M. Mannstein (2007): Stereo cloud-top height and amount retrieval from ATSR2. International Journal of Remote Sensing, 28, 1921-1938. Muller, J.-P., R. Preusker, J. Fischer, Zühlke, M., C. Brockmann, and P. Regner, 2007: ALBEDOMAP: MERIS land surface albedo retrieval using data fusion with MODIS BRDF and its validation using contemporaneous EO and in situ data products. IGARSS06, Barcelona, Spain, 23-27 July 2007, IEEE (invited paper). Muller, J.-P., M. A. Denis, R. Dundas, K. L. M. Mitchell, C. M. Naud, and H. M. Mannstein (2007): Stereo cloud-top height and amount retrieval from ATSR2. International Journal of Remote Sensing, 28, 1921-1938 Naud, C., J.-P. Muller, and E. Clothiaux, (2006): Assessment of multispectral ATSR2 stereo cloud-top height retrievals. Remote Sensing of Environment, 104, 337-345 Naud, C., K. L. Mitchell, J.-P. Muller, E. E. Clothiaux, P. Albert, R. Preusker, J. Fischer, and R. Hogan, (2007): Comparison between ATSR2 stereo, MOS O2-A band and ground-based derived cloud top Heights. International Journal of Remote Sensing, 28, 1969-1987. Naud, C., J.-P. Muller, et al. (2005). "On the use of ICESAT-GLAS measurements for MODIS and SEVIRI cloud-top height accuracy assessment." Geophysical Research Letters 32(19): L19815. Naud, C., J.-P. Muller, et al. (2005). "Assessment of the Performance of the Chilbolton 3-GHz Advanced Meteorological Radar for Cloud-Top-Height Retrieval." J. Applied Meteorology 44(6): 876-887 Naud, C. M., J.-P. Muller, E. E. Clothiaux, B. A. Baum, and W. P. Menzel, (2005). "Intercomparison of multiple years of MODIS, MISR and radar cloud-top heights." Annales Geophysicae 23: 2415-2424

Dr. Chris Chaloner
Business Development Executive, Aero-Space Division Qualifications: BA in Physics, University of Oxford D.Phil in Atmospheric Physics, University of Oxford
Career Summary Chris Chaloner’s educational background is a Physics degree and then a D.Phil in Atmospheric Physics from the University of Oxford on the potential climatic effects of Concorde, using a balloon-borne infrared gas correlation spectrometer which was the field trial for the SAMS instrument on Nimbus 7 and ISAMS on the Upper Atmosphere Research Satellite. He then worked for 13 years as an experimental scientist at the Rutherford Appleton Laboratory. This gave him a broad practical skill base in optics, electronics, GNC and communications, derived from projects such as balloon-borne astronomical telescopes, atmospheric laser radar, Skylark sounding rockets and the last UK scientific satellite (AMPTE-UKS), which was launched in 1984 to observe the plasma physics of the interactions between the solar wind and the Earth’s magnetic field. [n.b. The Engineering Model of the spacecraft can now be seen in the Science Museum.] In 1988 he moved to BAe Space Systems in Filton as a Syetems Engineer and worked mainly on mission and instrument studies for BNSC, ESA and the MoD. He was the system lead for the UK contribution to the Optical Mapping Instrument and SPOT 5 mission studies of a high resolution 3D stereo imaging mission, and the system engineer on the Phase A study for ESA of the MORO lunar orbiter mission. He contributed the system level aspects of the SOPRANO and MASTER sub-mm and microwave limb sounder instrument studies, and some of the RF spectrometry assessments – only now are those instruments being considered seriously for flight, and SEA is working towards a leading role. He ran a number of studies of surveillance missions and constellations for MoD and the WEU. Chris joined SEA in 1998. As a Senior Principal Consultant he was responsible for the technical content and the management of studies for the European Space Agency (such as the Advanced Microsatellite Mission study) and for BNSC. His engineering rôle in preparation of proposals led naturally to his current rôle as Business Development Executive responsible for the acquisition of space business – in this market where the Customers are experts in their fields, technical credibility is essential for such a function. He made major contributions for example, to the successful proposal for the EarthCARE BroadBand Radiometer and contributed to SEA’s success in winning work from NiCT/JAXA on the EarthCARE Cloud Profiling Radar. Recently he has managed a study for NOAA let through Iridium of a constellation of Earth Radiation Budget sensors based on the EarthCARE BBR. He is a major interface with the scientific Customers of the Division – STFC, NERC, the Met Office and their ESA counterparts. He represents SEA at UKspace – the Trade Association of the UK space industry, and is an Industry Officer of the Parliamentary Space Committee (an All-Party Group). As Chair of the UKspace Space Science and Exploration Committee he represents UKspace on the STFC/BNSC Space Science Advisory Committee and the Aurora Advisory Committee. He is an author or co-author of 22 papers in the scientific literature, but most of his recent output has naturally been in the form of technical reports. Only those papers directly relevant to this proposal are listed below:
C P Chaloner Some measurements of the minor constituents of the stratosphere: The vertical distribution of water vapour.
D.Phil. Thesis (Oxford), 1976.
C P Chaloner, J R Drummond, J T Houghton, R F Jarnot, H Roscoe
Stratospheric measurements of H2O and the diurnal change of NO and NO2.
Nature 258 , 696-697, 1975.
C P Chaloner, J R Drummond, J T Houghton, R F Jarnot, H Roscoe
Infra-red measurements of stratospheric composition: I. The balloon instrument and water vapour measurements
Proc. R. Soc. Lond. A364 , 145-159, 1978.
L Thomas, C P Chaloner, S K Bhattacharyya
Laser radar measurements in southern England of aerosols from Mount St Helens
Nature 289 ,473,1981
S M Parkes, C P Chaloner and P Brooks
Stereomatching of Satellite Pushbroom Images
Proc. ESA Vision Conference, Antibes, September 1993

Prof. Dr. Jürgen Fischer Institut für Weltraumwissenschaften Freie Universität Berlin Jürgen Fischer received the diploma degree in meteorology from the Free University of Berlin in 1979, and the Ph.D. and the Habilitation degrees from the University of Hamburg in 1983 and 1991, respectively. He is a full professor at the Free University of Berlin since 1991 and become the director of the Institute for Space Science in 1995. His major areas of activity concern the development of radiative transfer codes to simulate polarised radiation processes in clear and cloudy atmospheres as well as in combined atmosphere/ocean systems. He also performed multi-spectral radiation measurements from ships and aircrafts in several field experiments with the goal to develop new radiation instruments and remote sensing techniques for the retrieval of aerosol, water vapour and cloud properties as well as water constituents. Currently he develops a new polarimeter to measure the full Stokes vector, which is planned to operate on the new high-flying research aircraft HALO from DLR. Jürgen Fischer is a principal and co-investigator on numerous national and international grants and contracts. He is currently involved in national research project on clouds and precipitation as well as three major ESA projects GlobVapour, GlobAlbedo and CCI-Clouds. For the preparation of Sentinel-3 he is responsible for atmospheric correction as well as water vapour retrieval. He acts as an invited member of several scientific bodies, such as ESA’s MERIS advisory group (1991-2005), MERIS quality working group (2002-today), JAXA’s GLI (1997-2003), ESA CoastColour science team and NASA’s-CLOUDSAT (1999-) science team and the International Radiation Commission (IRC). Selected publications relevant for this proposal Bennartz, R. and J. Fischer, 2000: A modified k-distribution approach applied to narrow band water vapor and oxygen absorption estimates in the near infrared, JQSRT, 66, 539-553.
Rathke, C. and J. Fischer, 2000: Retrieval of cloud microphysical properties from thermal infrared observations by a fast iterative radiance fitting method, J. Atmos. Oceanic Technol., 17, 1509-1524.
Schüller, L., W. Armbruster and J. Fischer, 2000: Retrieval of cloud optical and microphysical properties from multi-spectral radiances, Atmos. Res., 55, 35-46.
Bennartz, R. and J. Fischer, 2001: Retrieval of columnar water vapour over land from back-scattered solar radiation using the Medium Resolution Imaging Spectrometer (MERIS). Remote Sensing of Environment, 78, 271-280.
Fell, F. and J. Fischer, 2001: Numerical simulation of the light field in the atmosphere-ocean system using the matrix-operator method, JQSRT, 69, 351-388.
Rathke, C., and J. Fischer, 2002: Evaluation of four approximate methods for calculating infrared radiances in cloudy atmospheres, J. Quant. Spectrosc. Radiat. Transfer, 75, 297-321.
Rathke, C., und J. Fischer, 2002: Efficient parameterization of the infrared effective beam emissivity of semitransparent atmospheric layers, J. Geophys. Res., 107 (D4).
Asseng, H., T. Ruhtz, and J. Fischer, 2004: Sun and Aureole Spectrometer for Airborne Measurements to Derive Aerosol Optical Properties. Appl. Opt. 43, 2146-2155 (2004)
Schüller, L., R. Bennartz, J. Fischer, J.L. Brenguier, 2005: An algorithm for retrieval of droplet number concentration nd geometrical thickness of stratiform marine boundary layer clouds to MODIS radiometric observations. J. Appl. Met., 44, 28-38.
Lindstrot, R., Preusker, R., Ruhtz, T., Heese, B., Wiegner, M., Lindemann, C. and Fischer, J., 2006: Validation of MERIS cloud top pressure using airborne lidar measurements. J. Appl. Meteor. Clim., 45 (12), 1612-1621.

Boesche, E., P. Stammes, T. Ruhtz, R. Preusker, and J. Fischer, 2007: Effect of aerosol microphysical properties on polarization of skylight: sensitivity study and measurements. Appl. Opt. 45, 8790-8805.
Muller, J.-P. and J. Fischer, 2007: The EU-CLOUDMAP project: Cirrus and contrail cloud-top maps from satellites for weather forecasting climate change analysis. Int. J. Remote Sensing, , 1915–1919.
Preusker, R., J. Fischer, P. Albert, R. Bennartz, and L. Schüller, 2007: Cloud-top pressure retrieval using oxygen A-band channels of the IRS-3 MOS instrument. Int. J. Remote Sensing, 28, 1957-1967.
Zieger, P., T. Ruhtz, R. Preusker, and J. Fischer, 2007: Dual-aureole and sun spectrometer system for airborne measurements of aerosol optical properties. Appl. Opt. 46, 8542-8552.
Boesche, E., P. Stammes, R. Preusker, R. Bennartz, W. Knap, and J. Fischer, 2008: Polarization of skylight in the O2A band: effects of aerosol properties. Appl. Opt. 47, 3467-3480. Lindstrot, R, Preusker, R. and Fischer, J., 2009: The empirical correction of stray light in the MERIS oxygen A band channel, accepted to J. Atmos. Oceanic Technol. Lindstrot, R, Preusker, R. and Fischer, J., 2009: The retrieval of land surface pressure from MERIS measurements in the oxygen A band, J. Atmos. Oceanic Technol., 26 (7), 1367–1377. Lindstrot, R, Preusker, R. and Fischer, J., 2009: Remote Sensing of Multilayer Cloud-Top Pressure Using Combined Measurements of MERIS and AATSR Onboard ENVISAT, accepted by J. Appl. Meteor. Climatol.

Curriculum Vitae Iliana Genkova
2010-present, KNMI TROPOMI Scientific Data Processing Specialist - responsible for scientific support of the Ground Data Processing Segment (GDPS) development, data analysis, calibration and support for the TROPOMI instrument development; 2008-2010, ECMWF Research Fellow – responsible for the assimilation of Atmospheric Motion Vectors (AMVs) in the ECMWF Data Assimilation system – monitoring and maintaining operational AMV assimilation; improving existing quality control and observational operator; novel AMV data set performance assessment; of performance of new AMV data set in 2006-2008, CIMSS-University of Wisconsin, Madison Researcher - improve existing and design new algorithms for deriving winds from current (GOES 11/12) and future (GOES ABI) satellite imagers, investigate accuracy of derived winds in terms of height assignment, quality control routines; algorithm validation with proxy (MSG SEVIRI, CALIPSO) and synthetic data; product error characterisation ; Develop an algorithm for extracting GOES Sounder moisture retrieval fields for input to height resolved wind retrieval algorithm; Adapt the CIMSS/NESDIS operational feature tracking wind algorithm to derive atmospheric motion vectors from GOES Sounder moisture fields; 2005 – 2006, University of Illinois at Urbana-Champaign Researcher - investigate the effect of spatial resolution and spectral band on two stereographic cloud top pressure retrieval algorithms; Inter-compare cloud top heights from TERRA's ASTER, MISR, and MODIS instruments for trade wind Cumuli 2002 – 2004, Pacific Northwest National Laboratory Post-Doctoral Research Fellow - use DOE's Atmospheric Radiation Program South Great Plane (ARM SGP) test bed ground based measurements (VIS, IR, MW radiometers, Micro-Pulse Lidar, Cloud Radar, Sondes, etc.) and products to validate satellite derived (GOES 11/12) cloud properties - cloud fraction, optical depth, LWP and cloud top pressure; Satellite and surface data synergy investigation for developing a 3D cloud structure/properties characterization appropriate for GCM use 2000 – 2001, University of Arizona - Tucson NSF-NATO Post-Doctoral Fellow - investigate the spatial heterogeneity of cloud top reflected radiances measured by TERRA-MISR (globally distributed clouds) Education 1995 - 2000 , PhD, Environmental Sciences, Bulgarian Academy of Sciences - Sofia 1989 - 1994 , MSc, Electronics and Microelectronics, Technical University of Sofia, Branch Plovdiv Funding 2007 1) Project: "Assessment of Satellite-derived Cloud Motion Vectors height assignments utilizing active remote sensing measurements from CALIPSO", PI: Steven A. Ackerman, Co-PI: Iliana Genkova, Chris Velden, James Jung, Jamie Daniels, Jeff Key 2) Project: "A US Effort for ADM/Aeolus Calibration and Validation" - pending review PI: Michael Hardesty, co-PI: Iliana Genkova and 15 others Publications and presentations Genkova, Iliana, C.S. Velden, S. Wanzong, and W.P. Menzel. Height-resolved wind vectors from GOES sounder moisture analyses. Joint 2007 EUMETSAT Meteorological Satellite Conference and the 15th Satellite Meteorology and Oceanography Conference of the American Meteorological Society, Amsterdam, The Netherlands, 24-28 September 2007

Genkova I., S. Wanzong, C. Velden, L. Grasso, and M. DeMaria, 2007: Wind retrieval performance on synthetic GOES-R ABI imagery, Joint 2007 EUMETSAT meteorological Satellite Conference and 15th AMS Satellite Meteorology and Oceanography Conference, 24-28th September, 2007 Amsterdam, The Netherlands Velden, C., S. Wanzong, I. Genkova, D. Santek, J. Li, E. Olson, and J. Otkin, 2007: Clear sky atmospheric motion vectors derived from the GOES Sounder and simulated GOES-R hyper-spectral moisture retrievals. Symposium on Future National Operational Environmental Satellites, 3rd, San Antonio, TX, 14-18 January 2007 (preprints). American Meteorological Society, Boston, MA, 2007, Manuscript not available for publication. Genkova, I., G. Seiz, P. Zuidema, G. Zhao, and L. Di Girolamo, 2007: Cloud top height comparisons from ASTER, MISR, and MODIS for trade wind Cumuli. Rem. Sens. Env., 107, pp. 211-222. Genkova, I.; C. Velden, S. Wanzong, and P. Menzel, 2006: Satellite wind vectors from GOES sounder moisture fields. International Winds Workshop, 8th, Beijing, China, 24-28 April 2006. Proceedings. European Organization for the Exploitation of Meteorological Satellites (EUMETSAT), Darmstadt, Germany, 2006, Unpaged. Call Number: Reprint # 5269 Genkova, I., and R. Davies, 2003: Spatial heterogeneity of reflected radiance from globally distributed clouds, Geophysical Research Letters, Vol. 30, No. 21 Genkova, I., B. Pachedjieva, E. Ferdinandov, and V.. Tsanev, 1998: Modified time mutability method for drift velocity estimation, Comp. Rend. Acad. Bulg. Sci., Tome 51, No.11
ÁKOS HORVÁTH ▪ PhD RESEARCH APPOINTMENTS Research Scientist ▪ 2007-present Max Planck Institute for Meteorology ▪ Atmosphere in the Earth System Hamburg ▪ Germany Postdoctoral Scholar ▪ 2005-2007 Rosenstiel School of Marine and Atmospheric Science University of Miami ▪ Miami ▪ Florida ▪ USA Postdoctoral Scholar ▪ 2004-2005 Jet Propulsion Laboratory ▪ Multi-angle Imaging Group California Institute of Technology ▪ Pasadena ▪ California ▪ USA Research Assistant ▪ 1997-2004 Department of Atmospheric Sciences University of Arizona ▪ Tucson ▪ Arizona ▪ USA EDUCATION PhD ▪ Atmospheric Sciences ▪ Remote Sensing Minor ▪ 2004 University of Arizona ▪ Tucson ▪ Arizona ▪ USA MSc ▪ Atmospheric Sciences ▪ 1999 University of Arizona ▪ Tucson ▪ Arizona ▪ USA BSc with Honors ▪ Meteorology ▪ 1996 Eötvös University ▪ Budapest ▪ Hungary GRANTS ▪ AWARDS Marie Curie International Reintegration Grant #208245 ▪ 2007-2011 Project title: Improving subgrid-scale cloud parameterization in global climate models using remote sensing data. A total funding of €100,000 (€25,000/year for 4 years) is awarded by the European Commission. MISR Team Group Achievement Award ▪ 2001 Presented by the National Aeronautics and Space Administration (NASA) in recognition of the successful development, deployment, and operation of the Multi-angle Imaging SpectroRadiometer (MISR) instrument, science, and data systems.
Ákos Horváth ▪ Page 1 of 2
Ákos Horváth ▪ Page 2 of 2
RELEVANT PUBLICATIONS Lonitz, K., and Á. Horváth (2010), Comparison of MISR and Meteosat-9 cloud motion winds, Journal of Geophysical Research, in preparation. Davies, R., Á. Horváth, and C. Moroney (2007), Cloud motion vectors from MISR using sub-pixel enhancements, Remote Sensing of Environment, doi:10.1016/j.rse.2006.09.023. Horváth, Á., R. Davies, and G. Seiz, Status of MISR cloud-motion wind product, Proceedings of the Sixth International Winds Workshop, Madison, Wisconsin, USA, 7-10 May 2002, EUMETSAT P.35, Darmstadt, pp. 269-275. Moroney, C. M., Á. Horváth, and R. Davies (2002), Use of stereo-matching to co-register multiangle data from MISR, IEEE Transactions on Geoscience and Remote Sensing, 40(7), pp. 1541-1546. Horváth, Á., and R. Davies (2001), Simultaneous retrieval of cloud motion and height from polar-orbiter multiangle measurements, Geophysical Research Letters, 28(15), pp. 2915-2918. Horváth, Á., and R. Davies (2001), Feasibility and error analysis of cloud motion wind extraction from near-simultaneous multiangle MISR measurements, Journal of Atmospheric and Oceanic Technology, 18(4), pp. 591-608. Diner, D. J., R. Davies, L. Di Girolamo, Á. Horváth, C. M. Moroney, J. P. Muller, S. R. Paradise, D. Wenkert, and J. Zong (1999), MISR Level 2 Cloud Detection and Classification Algorithm Theoretical Basis, JPL D-11399, Revision D. CURRENT AND FORMER STUDENTS Chellappan Seethala, PhD advisor ▪ 2008-present Investigating subgrid-scale cloud variability from satellite observations and model simulations Max Planck Institute for Meteorology ▪ Atmosphere in the Earth System Hamburg ▪ Germany Elke Ludewig, MSc advisor ▪ 2010-present Multisensor analysis of cloud-top heights along stratocumulus to cumulus transition trajectories Max Planck Institute for Meteorology ▪ Atmosphere in the Earth System Hamburg ▪ Germany Katrin Lonitz, MSc advisor ▪ 2008-2010 Comparison of MISR and Meteosat-9 cloud motion winds Max Planck Institute for Meteorology ▪ Atmosphere in the Earth System Hamburg ▪ Germany

Stefano Migliorini
Senior Research Fellow
EDUCATION
2000 PhD in "Methods and technologies for environmental monitoring", University of Florence. Thesis: "Physical modelling of microwave atmospheric emission: applications to precipitable water estimate using satellite remote sensing".
1996 Laurea degree in Physics, University of Florence. Thesis: "Temperature and density diagnostic of alpha Cen coronal plasma between 100 and 700 Angstrom". Final marks: 108/110.
EMPLOYMENT HISTORY
2001 to present
Research Fellow at the National Centre for Earth Observation (previously at the Data Assimilation Research Centre), Department of Meteorology, University of Reading (UK).
1998 to 2001
Researcher for the Applied Meteorology Foundation at the Laboratory for Meteorology and Environmental Modelling (La.M.M.A.), Florence, Italy.
MEMBERSHIPS
2005 to present
Fellow of the Royal Meteorological Society
RESEARCH EXPERIENCE
2008 Co-Investigator for the National Centre for Earth Observation (NCEO) Theme 3 (Atmospheric composition).
2008 Researcher Co-Investigator for the National Centre for Earth Observation (NCEO) Theme 4 (Synergistic use of remote sensing data for high resolution predictions of hazardous weather, floods and water resources).
2007 Principal Investigator for the University of Reading of the EU FP7 GENESI-DR project.
2007 Demonstrator Leader of the ESA-funded GlobModel project, part of the ESA Data User Element (DUE) programme.
2006 Principal Investigator of the ECMWF Special Project on "Assimilation of geostationary ozone measurements for global ozone monitoring".
2006 Co-Investigator the Eumetsat project "Study on the Exploitation of SEVIRI IR 9.7 Channel"
2005 Principal Investigator of the ESA Category-1 OMI data Calibration and Validation proposal on "Calibration and validation of OMI measurements using a NWP assimilation system".
TEACHING EXPERIENCE
2010
2004-
Lecturer at the Earth System Science Spring School (ES4) 2010, Scarborough, UK.
Lecturer at "The 2nd, 3rd and 4th ENVISAT Summer School on Earth System Monitoring
2008 and Modelling", ESA ESRIN, Frascati, Italy.
2007 to present
Lecturer on the Course on Remote Sensing, MSc in "Atmosphere, Ocean and Climate", "Applied Meteorology" (Department of Meteorology) and "Mathematical and Numerical Modelling of the Atmosphere and Oceans" (Department of Mathematics), University of Reading.
2002 Teaching Assistant at the course on "Data Assimilation for the Earth System", a NATO Advanced Study Institute, Maratea, Italy.
SUPERVISION OF RESEARCH STUDENTS
2009 Assimilation of IASI data in the presence of cloud: Supervisor of Cristina Prates, PhD student in Meteorology, University of Reading.
2007 Ensemble methods for convective scale data assimilation: Supervisor of Sanita Vetra, joint PhD student in Maths and Meteorology, University of Reading.
2003-2006
Assimilation of the full information content of satellite observations: Co-Supervisor of Rossana Dragani (currently at ECMWF), PhD student in Meteorology, University of Reading.
PEER-REVIEW EXPERIENCE
Ad hoc reviewer for Atmospheric Chemistry and Physics, International Journal of Climatology, Journal of Geophysical Research - Atmosphere, Quarterly Journal of the Royal Meteorological Society, Tellus. Ad hoc referee for the Geophysical Sciences Series, Springer-Praxis Publishing, Chichester. Ad hoc referee for research grants submitted to the Natural Environment Research Council (NERC) and the US National Science Foundation.
RELEVANT PUBLICATIONS
- Singh, R., P. Rayer, R. Saunders, S. Migliorini, R. Brugge, and A. O'Neill (2009), A fast radiative transfer model for the assimilation of water vapor radiances from the Kalpana very high resolution radiometer, Geophys. Res. Lett., 36, L08804, doi:10.1029/2009GL037852. - Migliorini, S.; Dragani, R.; Kaiser-Weiss, A.; Brugge, R.; Thepaut, J.-N.; O'Neill, A. (2009), The GlobMODEL Demonstrator: Assimilation of New Satellite Products in an Operational Meteorological Center, Selected Topics in Applied Earth Observations and Remote Sensing, IEEE Journal of, in press, doi:10.1109/JSTARS.2009.2021770. - Migliorini, S., C. Piccolo, and C.D. Rodgers, 2008: Use of the Information Content in Satellite Measurements for an Efficient Interface to Data Assimilation. Mon. Wea. Rev., 136, 2633-2650. - Migliorini, S., R. Brugge, A. O'Neill, M. Dobber, V. Fioletov, P. Levelt, and R. McPeters (2008), Evaluation of ozone total column measurements by the Ozone Monitoring Instrument using a data assimilation system, J. Geophys. Res., 113, D15S21, doi:10.1029/2007JD008779 - J. Geer, C. Peubey, R. Bannister, R. Brugge, D. R. Jackson, W. A. Lahoz, S. Migliorini, A. O'Neill, and R. Swinbank, Assimiliation of stratospheric ozone from MIPAS into a global general circulation model: the September 2002 vortex split. Quart. J. Royal Met. Soc., 132, 231-257, 2006. - W. A. Lahoz, R. Brugge, D. R. Jackson, S. Migliorini, R. Swinbank, D. Lary and A. Lee, An Observing System Simulation Experiment to evaluate the scientific merit of wind and ozone measurements from the future SWIFT instrument. Quart. J. Royal Met. Soc., 131, 503-524, 2005. - Migliorini, S., C. Piccolo, and C. D. Rodgers (2004), Intercomparison of direct and indirect measurements: Michelson Interferometer for Passive Atmospheric Sounding (MIPAS) versus sonde ozone profiles, J. Geophys. Res., 109, D19316, doi:10.1029/2004JD004988. - Migliorini, S. and S. Nativi, PIn Part I: An Operational Nonlinear Physical Inversion Algorithm for Precipitable and Cloud Liquid Water Estimate in Nonraining Conditions Over Sea, IEEE Trans. Geosci. Remote Sensing, vol. 39, pp. 2563-2571, Dec. 2001. Nativi, S. and S. Migliorini, PIn Part II: Comparative Evaluation of SSM/I and TMI Precipitable Water Estimate for the Mediterranean Sea, IEEE Geosci. Remote Sensing, vol. 39, pp. 2572-2583, Dec. 2001.

����������������� ������������� � � � � " $ & � ( " * $ �
- . 0 1 3 5 7 9 ; < = ? A A ? D E F H J L N O 5 F R N < VW . X 1 . - W�\ ]�. _ 1 b d e f h X j 3 l m o q H s < ? A l w m x y { < ? } o 7 A � O � 9 A D � �- . X f b - . ]�f X � 3 { < ? o ? } q� 1 � 3 � D A ;]�. - � � . � 1 � 3 ¡ O 5 � H L £ 9 7 7 �j b 0 1 . W W h 1 � � 3 «�A D � ? � } � { D < < 7 � 5 � � « D ° q ; E ² < ° � ¨ 7 � ? o 7 � � N ; ´ 7 � � O � 9 A D � � µ ; A ¶ · l x · x ¸ ¹ x l º » º¼ b h ½�. W W h 1 ��� 3 F D o ; A A ? o ; H s s A ? � D o ? 7 � } � � ; o ; 7 < 7 A 7 9 ? � D A ¿ À � ; � ¦ ? o Á < 7 ° 5 � � O à ; o ; < � N ; ´ 7 � � O Ä l » «�{ � O � 9 A D � �
µ ; A ¶ · l » w Å ¸ ¹ ¹ º Å w m � ¦ D Ã ¶ · l » w Å ¸ ¹ ¹ m º ¹ l � ; E D ? A ¶ < 7 9 ; < } D � � ; < } È E ; o 7 À � ; 9 7 ´ É
Ê � � & Ë Ì " (�* �
l w º m £ Í Å � ? � } 7 E ; < L 7 < o 7 � ¡�< D E E D < F � q 7 7 Al l ¡ § O Î ¿ Ï A ; ´ ; A s D } } ; } ¶ � D o q ; E D o ? � } � Ñ D o ? � � H � � ? o ? 7 � D A � D o q } � ¦ < ; � � q � ¨ ? } o 7 < ° � O � 9 A ? } q Ñ D � 9 �O � 9 A ? } q Ñ ? o � {�? 7 A 7 9 ° � « q ° } ? � } � § q ; E ? } o < ° � ¡�; < E D �» ¡ §�O Î H Ï A ; ´ ; A s D } } ; } ¶ « q ° } ? � } Î F Ï A ; ´ ; A R H Å V � ¦ < o q ; < � D o q ; E D o ? � } R { V � § q ; E ? } o < ° R { V
l w Í Å £ Í m { F � ¨ 7 � } R Å l V ? � «�q ° } ? � } D o µ q ; J � ? ´ ; < } ? o ° 7 Ô {�? < E ? � 9 q D E
l w Í m £ Í º � F � � N Õ § ? � H o E 7 } s q ; < ? � «�q ° } ? � } D o Õ E s ; < ? D A § 7 A A ; 9 ; � Ñ 7 � � 7 � J � ? ´ ; < } ? o °
l w Í º £ Í ¹ « q N ? � H o E 7 } s q ; < ? � «�q ° } ? � } D o Õ E s ; < ? D A § 7 A A ; 9 ; � Ñ 7 � � 7 � J�� ? ´ ; < } ? o °
Ö � � × � $ ��Ù × � (
l w w w £ s < ; } ; � o ¨�; D � 7 Ô F D o ; A A ? o ; Õ E D 9 ; < ° H s s A ? � D o ? 7 � } ¡�< 7 s D o o q ; � ; o ; 7 < 7 A 7 9 ? � D A ¿ À � ; � O à ; o ; < �
l w w m £ l w w w ¨�; D � 7 Ô F D o ; A A ? o ; F ; � o ? 7 � D o o q ; O < 7 s ; D � § ; � o < ; Ô 7 < � ; � ? E 5 D � 9 ; = ; D o q ; <�¦ 7 < ; � D } o } �5 ; D � ? � 9 � { ; < É }
l w w Å £ l w w m « < ? � � ? s D A F � ? ; � o ? Û � ¿ À � ; < D o o q ; � ; o �¿ À � ; 5 ; E 7 o ; F ; � } ? � 9 Õ � } o < E ; � o D o ? 7 � { < D � � q �¦ D < � ² 7 < 7 9 q � ¨ D � o }
l w ¹ ¹ £ l w w l « < ? � � ? s D A F � ? ; � o ? Û � ¿ À � ; < D o o q ; � ; o ; 7 < 7 A 7 9 ? � D A 5 ; } ; D < � q ¦ A ? 9 q o � ¦ D < � ² 7 < 7 9 q � ¨ D � o }
l w ¹ x £ l w ¹ ¹ F ; � ? 7 <�F � ? ; � o ? Û � ¿ À � ; <�D o�o q ; � ; o ; 7 < 7 A 7 9 ? � D A ¿ À � ; J�� ? o �§ A D < ; � � 7 � Ñ D ² 7 < D o 7 < ° � ¿�Ã Ô 7 < � J�� ? ´ ; < } ? o °
l w ¹ Å £ ¹ » Ý ? } ? o ? � 9 F � ? ; � o ? } o D o o q ; O < 7 s ; D � F s D � ; ¿ s ; < D o ? 7 � } § ; � o < ; � N D < E } o D � o � ¡�; < E D � °
l w ¹ l £ ¹ Å F � ? ; � o ? Û � § 7 � } A o D � o�o 7 5� o q ; < Ô 7 < � H s s A ; o 7 � Ñ D ² 7 < D o 7 < ° � ¿�à 7 �
l w Í ¹ £ ¹ l « 7 } o ¸ � 7 � o 7 < D A < ; } ; D < � q D } } ? } o D � o ? � o q ; Ñ D ² 7 < D o 7 < ° Ô 7 <�«�A D � ; o D < ° H�o E 7 } s q ; < ; } �J � ? ´ ; < } ? o ° § 7 A A ; 9 ; Ñ 7 � � 7 � � Ñ 7 � � 7 � J � ? ´ ; < } ? o °
Þ ��× � × ß � � � à * � � â � ��� â � � � * � " $ � � Ì * � (�* � �
5 7 ° D A � ; o ; 7 < 7 A 7 9 ? � D A F 7 � ? ; o °
ä ��$ * � ( � â ��� $ � æ " ( � Ë ß $ * Ì " (�* � �
ê ë ì H � ? E s < 7 ´ ; � E ; o q 7 � Ô 7 < � ; o ; � o ? � 9 � A ; D < } É ° D � � � A 7 � ° < D � ? D � � ; }�Ô < 7 E H Ý ¨ 5 5 � D o D í ² ° h ë ¼ ë � î ï ð ñò ó ô õ D � � ö µ ö�< ? ; ² ; A ÷ ø ù ú�û ý þ ÿ���� ý ù������ ø�� ø��� ���������� ��� � ��� � �
" ë ì H � 7 E s D < ? } 7 � 7 Ô } D o ; A A ? o ; < ; o < ? ; ´ ; �s D < D E ; o ; < } � ? o q E ; } 7 } � D A ; E 7 � ; A D � D A ° } ; } í�² ° h ë ¼ ë � î ï ð ò�ó ô õ#�$�%�& ù û ÿ ý ' ) � ù � ý - ê ê�/ 0 � � � 0�4 � � ��� � �
7 ë ì µ q ; � ; o ; < E ? � D o ? 7 � 7 Ô ² < 7 D � ² D � � } < Ô D � ; D A ² ; � 7 Ô < 7 E H Ý ¨ 5 5�´ ? } ? ² A ; D � � � ; D < ? � Ô < D < ; � < D � ? D � � ; } í ² °h ë ¼ ë � î ï�ð ò ó ô õ ÷ ø ù û ý þ ÿ�� � ý ù � ��� ø � ø�� ê ê < = � � 0 4 ��� � ���
@�ë ì H�o E 7 } s q ; < ? � µ < D � } E ? o o D � � ; } Ô 7 < o q ; H Ý ¨ 5 5 � q D � � ; A } í ² ° h ë ¼ ë � î ï ð ò�ó ô õ D � � N O O � ��D < � } A C C ú � GH C ù - � "�K < = ��� = � = � 0 � ��� � � �
/ ë ì H s s A ? � D o ? 7 � } 7 Ô 5 ; E 7 o ; F ; � } ? � 9 ? � � ; o ; 7 < 7 A 7 9 ° D � � § A ? E D o 7 A 7 9 ° í ² ° h ë ¼ ë � î ï ð ò ó ô õ D � � { F ; 9 ? �÷ ø ù û ý þ ÿ�� � ý ù�� ��� ø�� ø�� ê�7 � ��� � ��� � ��� � ��� � �
N ë ì L 7 o ; 7 � o q ; H � ´ D � � ; � � ? � < 7 ��D ´ ; F 7 � � ? � 9 J � ? o í ² ° h ë ¼ ë � î ï�ð ò ó ô õ O $ ú ú A ��� & ) � ù�� ý & ý ú � ý -S @ � � ��� ��� � ��� � ��� � �
S ë ì µ q ; ´ D A ? � D o ? 7 � 7 Ô H µ F 5 } ? � 9 D ? < � < D Ô o < D � ? 7 E ; o ; < � D o D 7 ´ ; < o q ; µ < 7 s ? � D A H�o A D � o ? � í ² ° H ¨ F E ? o q � h ë ¼ ë� î ï�ð ò ó ô õ D � � H � U D ´ 7 � ° û �A ù � ý � H -�� % ø - V ��- X� ê ê 4 � � � � ��� � ��� � =
K ë ì µ q ; < D � ? 7 E ; o < ? � � q D < D � o ; < ? } D o ? 7 � 7 Ô H � F J ¸ { í�² ° h ë ¼ ë � î ï ð ò ó ô õ � µ [ �¨ ; � ? } 7 � � F [ F o < ? � 9 ; < D � �L §� H�o É ? � } 7 � �÷ \ \ \ ^ ) V V @ 7 4 0 � � 4 4 � � ��� ���
ë ì � ; D } < ; E ; � o } 7 Ô�o q ; H � F J ¸ { D � o ; � � D s D o o ; < � í ² ° µ [ ¨ ; � ? } 7 � D � � h ë ¼ ë � î ï ð ò ó ô õ ÷ \ \ \ V & % ø��ý ø d � ý�� - � ø -�� % ø G ÿ�� � ý ù ����� ø�� ø�� 7�@ = � � ^ = ��� ��� � � 0
ê�k ë ì L ; D < ¸ } < Ô D � ; } D o ; A A ? o ; � ? � � 7 ² } ; < ´ D o ? 7 � }�7 Ô q < < ? � D � ; } D � � o q ; ? <�? E s D � o 7 � O §�� = ¦ E 7 � ; A D � D A ° } ; } D � �Ô 7 < ; � D } o } í ² ° � µ 7 E D } } ? � ? � N Ñ ; � ; <�D � � h ë ¼ ë � î ï�ð ò�ó ô õ ) ý ø ù X ú ' m�� % ù X � & ÿ�� n� � p ê "�N ��� 4 = � ����� 0� ��� ����
ê ê ë ì J } ; 7 Ô F F � q Õ�? � ; � 7 � � ; � o < D o ? 7 � � D o D�? � o q ; O § � = ¦�F F µ D � D A ° } ? } í ² ° « ¦ ; < � D � � ; Á � ¡ ö�; A A ° D � �h ë ¼ ë � î ï�ð ò ó ô õ ) � ù�� ý & ý ú ý�� - % ú A C C ú - % ù ý ø�� / � � 4 ��� � 0 � ��� � �
ê " ë ì H ��Õ E s < 7 ´ ; �¦ D } o 5 D � ? D o ? ´ ; µ < D � } Ô ; < � 7 � ; A Ô 7 < H } } ? E ? A D o ? 7 � 7 Ô F D o ; A A ? o ;�5 D � ? D � � ; ¿ ² } ; < ´ D o ? 7 � } í ² °h ë ¼ ë � î ï�ð ò ó ô õ � � � D o < ? � D < � ? D � � « { < � ; A #�$ % & ù û ÿ ý ' ) � ù � ý & ý ú � ý - ê " / � = � 4 ^ � = � 0 � ��� ���
ê�7 ë ì x N Ý D < D } } ? E ? A D o ? 7 � 7 Ô F F � q Õ o 7 o D A � 7 A E � ��D o ; < ´ D s 7 < ? � o q ; O § � = ¦ E 7 � ; A í ² ° O ¡ t; < D < � D � � h ë ¼ ë� î ï�ð ò ó ô õ #�$ % & ù û ÿ ý ' ) � ù�� ý & ý ú � ý - ê " / � � 4�4 ^������ � � ��� ���
ê @ ë ì H Ô D } o < D � ? D o ? ´ ;�o < D � } Ô ; < E 7 � ; A Ô 7 < } ? E A D o ? 7 � 7 Ô Õ H�F Õ < D � ? D � � ; } í ² ° � � D o < ? � D < � ? D � � h ë ¼ ë � î ï ð ò ó ô õA C�C ú ��G H C ù - � 7 K < � 0�4 � ^ � 0 � ��� ��� ���
ê / ë ì § 7 � ´ ; < } ? 7 � 7 Ô H µ F 5 ¸ Å } ; D } < Ô D � ; } É ? � o 7 ² A É o ; E s ; < D o < ; Ô 7 < } ; ? � � A ? E D o ; } o � ? ; } í ² ° H ¿ Ï § D < < 7 A A �{ § D � � ° � h ë ¼ ë � î ï ð ò�ó ô õ�x & ý - ý þ \�ÿ�� ^ \�ø n� � % ù ��' � C ý�� $ � < z { ý ý | ø�� G ý�p ø�ù ý \ % & ù X ø�ù X � ø � p� ú ú � ø $ � z�< d ý ù X � ø ~ $�& � < � 0 ^ ��� H - ù ý�~�� & ��� ���
ê�N ë ì H � ? � ´ ; } o ? 9 D o ? 7 � 7 Ô o q ; s ; < Ô 7 < E D � � ; 7 Ô ? � Ô < D < ; � < D � ? 7 E ; o ; < } Ô 7 < o q ; � ; o ; < E ? � D o ? 7 � 7 Ô } ; D } < Ô D � ; o ; E ¸s ; < D o < ; Ô < 7 E } s D � ; í�² ° h ë ¼ ë � î ï ð ò ó ô õ � « [ � ? � � ; o o ��H � U D ´ 7 � ° D � �N µ Ñ A ; � ; A A ° � [ 7 � ; } ÷ \ \ \x & ý - ý ø�d � ý � - � ø -�� % ø G ÿ���� ý ù������ ø�� ø�� 7 ë ê � ��� � �
ê S ë ì F D o ; A A ? o ; � A o ? � q D � � ; A ? � Ô < D < ; � E ; D } < ; E ; � o } 7 Ô } ; D ¸ } < Ô D � ; o ; E s ; < D o < ; 7 Ô o q ; L O H�o A D � o ? � 7 � ; D � } ? � 9 H Ý ¨ 5 5 q Å í�² ° N µ Ñ A ; � ; A A ° � [ 7 � ; } � « [ � ? � � ; o o � h ë ¼ ë � î ï�ð ò�ó ô õ D � � H � U D ´ 7 � ° # û ÿ ý '�) � ù� ý - ê ê�k 0 ��� � 0 ��� ��� � � =
ê�K ë ì ¿ ² } ; < ´ D o ? 7 � } 7 Ô } ; D ¸ } < Ô D � ; o ; E s ; < D o < ; Ô 7 < � A ? E D o ; < ; } ; D < � q í ² ° [ O ¨ D < < ? ; } � N µ Ñ A ; � ; A A ° � [ 7 � ; } �« [ � ? � � ; o o � h ë ¼ ë � î ï�ð ò ó ô õ D � � H � U D ´ 7 � ° x X ú V &�% ø�� ÿ ý ' � ý - { ý ø G . 7 k ����� � � ��� � ��� � �
Family Name Given Name Title
Seiz Gabriela Dr.
Year of Birth Country of birth Nationality/Nationalities
1973 Switzerland CH
European Community Languages spoken (best first)
German English French Italian
Currently working for (organisation) Since (yr.) Position
Federal Office of Meteorology and Climatology MeteoSwiss 2006 Head of Staff Office
Climate Division
Curriculum Vitae as well as academic and professional qualifications
Professional Experience
2006–present: Head of Staff Office Climate Division, Swiss GCOS Office, MeteoSwiss.
2005–2006: Postdoctoral Research Fellow, European Space Agency (ESA), ESRIN, Frascati (I).
2004: Visiting Independent Advisor, MISR Science Team, Jet Propulsion Laboratory (JPL), NASA, California Institute of Technology, Pasadena, USA (07/2004 - 09/2004).
2004: Visiting Scientist, EUMETSAT, Darmstadt (D) (04/2004 and 11/2004).
1999-2005: Project Manager and Research Scientist, Institute of Geodesy and Photogrammetry, ETHZ.
1996-2003: Scientist, Federal Office of Meteorology and Climatology MeteoSwiss.
Education
2003: PhD, Photogrammetry and Remote Sensing, Swiss Federal Institute of Technology ETH, Zürich
1996: Master, Geography and Atmospheric Physics, University of Zurich
Reference List (Important publications, relevant for this proposal)
Seiz, G., Foppa, N., 2007. National Climate Observing System (GCOS Switzerland). Publication of MeteoSwiss and ProClim, Zurich, 92 S.
Seiz, G., Watts, P., Tjemkes, S., 2007. Multi-view cloud-top height and wind retrieval with photogrammetric methods: application to Meteosat-8 HRV observations. Journal of Applied Meteorology and Climatology, 46, pp. 1182-1195.
Seiz, G., Shields, J., Feister, U., Baltsavias, E., Gruen, A., 2007. Cloud mapping with ground-based photogrammetric cameras. International Journal of Remote Sensing, 28(9), pp. 2001-2032.
Genkova, I., Seiz, G., Zuidema, P., Zhao, G., Di Girolamo, L., 2007. Cloud top height comparisons from ASTER, MISR, and MODIS for trade wind cumuli. Remote Sensing of the Environment, 107, pp. 211-222.
Seiz, G., Davies, R., Gruen, A., 2006. Stereo cloud-top height retrieval with ASTER and MISR. International Journal of Remote Sensing, 27(9), pp. 1839–1853.
Diner, D., Braswell, B., Davies, R., Gobron, N., Hu, J., Jin, Y., Kahn, R., Knyazikhin, Y., Loeb, N., Muller, J.-P., Nolin, A., Pinty, B., Schaaf, C., Seiz, G., Stroeve, J., 2005. The value of multiangle measurements for retrieving structurally and radiatively consistent properties of clouds, aerosols, and surfaces. Remote Sensing of the Environment, 97(4), pp. 495-518.
Seiz, G., Baltsavias, E., Gruen, A., 2002. Cloud mapping from the ground: use of photogrammetric methods. Photogrammetric Engineering & Remote Sensing (PERS), 68(9), pp. 941-951.
CV – Ad Stoffelen
In 2008 Ad Stoffelen was one of the seven nominees for the annual national prize for achievements in "Science and Society" among all scientists in the Netherlands. Dr. Ir. Ad Stoffelen studied physics at the Technical University of Eindhoven until February 1987. Since then he works for the KNMI and the ECMWF. He was the ECMWF scientist responsible for the scatterometer data processing and assimilation from '91 - '94 where he initiated developments on data visualisation, transfer function estimation, quality control, and data assimilation. Currently, he manages both the EUMESAT Ocean and Sea Ice and Numerical Weather Prediction Satellite Application Facilities at KNMI with its prime responsibility in the EUMETSAT ASCAT data and software products. In this context he lead ASCAT calibration flights with the NOAA hurricane "hunter" team through hurricanes, a.o., through tropical hurricane Ike in 2008. He is a member of the ESA/EUMETSAT ASCAT SAG, co-chairs the International Ocean Vector Wind Science Team, and is member of EUMETSAT’s Post-EPS Mission Expert Team after chairing the Post-EPS Application Expert Group on Atmospheric Profiling and Sounding. He is also a member of the CFOSAT science team. Other areas of involvement in satellite data interpretation are Doppler Wind Lidar (member of the ESA AEOLUS Mission Advisory Group and VAMP project leader) and assimilation of ozone data in NWP models (project leader of the EU SODA project). In the reference list below several publications on these subjects can be found.
References:
Masutani, Michiko, Thomas W. Schlatter, Ronald M. Errico, Ad Stoffelen, Erik Andersson, William Lahoz, John S. Woollen, G. David Emmitt, Lars-Peter Riishøjgaard, Stephen J. Lord, /Observing System Simulation Experiments ,/ Chapter 2, section F, to appear in Springer book on Data Assimilation, 2010.
Belmonte Rivas, M. and A. Stoffelen, /New Bayesian algorithm for sea ice detection with QuikSCAT, IEEE Transactions on Geoscience and Remote Sensing, under minor revision, 2010.
Houchi, K., A. Stoffelen, G.J. Marseille, J. de Kloe, /Comparison of wind and wind-shear climatologies derived from high-resolution radiosondes and the ECMWF model, J. Geophys. Research (C), under minor revision, 2010.
Marseille, G.J., K. Houchi, J. de Kloe and A. Stoffelen, /The definition of an atmospheric database for ADM-Aeolus/ submitted, Atmospheric Measurement Techniques, 201
Vogelzang, J., A. Stoffelen and A. Verhoef, /On the quality of high-resolution scatterometer winds J. Atm. Oceanic Technol., submitted, 2010.
Portabella, M. and A.C.M. Stoffelen, /On Scatterometer Ocean Stress/ J. Atm. Oceanic Technol., 2009, 26, 2, 368-382,
Verspeek, J.A., A. Stoffelen, M. Portabella, H. Bonekamp, C. Anderson and J. Figa, Validation and calibration of ASCAT using CMOD5. IEEE Transactions on Geoscience and Remote Sensing, 2009
Vogelzang, J., A. Stoffelen, A. Verhoef, J. de Vries and H. Bonekamp, /Validation of two-dimensional variational ambiguity removal on SeaWinds scatterometer data/ J. Atm. Oceanic Technol., 7, 2009, 26, 1229-1245
Marseille, G.J., A. Stoffelen and J. Barkmeijer, /A CYCLED SENSITIVITY OBSERVING SYSTEM EXPERIMENT ON SIMULATED DOPPLER WIND LIDAR DATA DURING THE 1999 CHRISTMAS STORM/ Tellus, A, 2008, 60, 2, 249-260

Marseille, G.J., A. Stoffelen and J. Barkmeijer, /IMPACT ASSESSMENT OF PROSPECTIVE SPACE-BORNE DOPPLER WIND LIDAR OBSERVATION SCENARIOS/ Tellus, A, 2008, 60, 2, 234-248
Marseille, G.J., A. Stoffelen and J. Barkmeijer, /Sensitivity Observing System Experiment (SOSE) - A New Effective NWP-based Tool in Designing the Global Observing System/ Tellus, A, 2008, 60, 2, 216-233,
Tan, D.G.H., E. Andersson, J. de Kloe, G.J. Marseille, A. Stoffelen and et al., /The ADM-Aeolus wind retrieval algorithms/ Tellus, A, 2008, 60, 2, 191-205
Zagar, N., A. Stoffelen, G.J. Marseille, C. Accadia and P. Schlussel, /Impact Assessment of Simulated Wind Lidars with a Multivariate Variational Assimilation in the Tropics/ Mon. Wea. Rev., 2008, 136, 2443-2460
Barale, V., M. Gade (eds), /Remote Sensing of the European Seas/, Chapter: "/Scatterometer Applications in the European Seas"/, contributed by Ad Stoffelen, pp. 269-282, ISBN: 978-1-4020-6772-3, Springer, 2008.
Hersbach, H., A. Stoffelen and S. de Haan, An Improved C-band scatterometer ocean geophysical model function: CMOD5, J. Geophys. Res., 2007, 112,
Portabella, M. and A. Stoffelen, Scatterometer backscatter uncertainty due to wind variability, IEEE Gosci. Remote Sensing Letters, 2006, 44, 11, 3356-3362.
Stoffelen, A., G.J. Marseille, F. Bouttier, D. Vasiljevic, S. de Haan and C. Cardinali, Doppler Wind Lidar Observation System Simulation Experiment, Quart. J. Royal Meteor. Soc., 2006, 132, 1927-1947.
Stoffelen, A. and M. Portabella, On Bayesian Scatterometer Wind Inversion IEEE Transactions on Geoscience and Remote Sensing, 2006, 44, 6, 1523-1533.
Kerr, Y.H., G. Rochard, P. Tristant, S. English, M. Dreis, A. Stoffelen, J. Pla, B. Rommen, E. Marelli, K. Ruf and P. Bauer, Comments on Interference from 24-GHz Automotive Radars to Passive Microwave Eart Remote Sensing Satellites, IEEE Transactions on Geoscience and Remote Sensing, 2005, 43, 1691-1692.
Stoffelen, A., E. Andersson, G.J. Marseille and D. Tan, Comments on - The impact of DWL observations on a Single-level Meteorological Analysis, by L.P. Riishojgaard, R. Atlas, and G.D. Emmitt, J. Appl. Meteor., 2005, 44, 8, 1276-1277.
Stoffelen, A., P. Flamant, E. Källén, J. Pailleux, J.M. Vaughan, W. Wergen, E. Andersson, H. Schyberg, A. Culoma, M. Endemann, P. Ingmann and R. Meynart, The Atmospheric Dynamics Mission for Global Wind Field Measurement, Bull. Amer. Meteor. Soc., 2005, 86, 1, 73-87.
Portabella, M. and A. Stoffelen, A probabilistic approach for SeaWinds data assimiliation, Quart. J. Royal Meteor. Soc., 2004, 130, 127-152.
Stoffelen, A., Discussion on the meeting on - Statistical approach to inverse problems, J. of the Roy. Statist. Soc. Ser. B, 2004, 66, 3, 627-652.
Marseille, G.J. and A. Stoffelen, Simulation of Wind Profiles from a space-borne Doppler Wind Lidar, Quart. J. Royal Meteor. Soc., 2003, 129, 3079-3098.
Portabella, M. and A. Stoffelen, A comparison of KNMI Quality Control and JPL Rain Flag for SeaWinds, Can. Jour. of Rem. Sens, 2002, 28, 3, 424-430.
Portabella, M., A. Stoffelen and J.A. Johannessen, Toward an optimal inversion method for SAR wind retrieval, J. Geophys. Res., 2002, 107.
Curriculum Vitae of Dong L. Wu Tel: (818) 393-1954 (work)
(626) 446-7502 (home)
Email: [email protected]
Mail Stop 169-237, Jet Propulsion Laboratory
California Institute of Technology
Pasadena, CA 91109
RESEARCH INTERESTS
Remote sensing of clouds and Earth/planetary atmospheric winds, Atmospheric/Ionospheric gravity waves (GWs),
Radiative transfer modeling and retrieval algorithm
EDUCATION 1994 Ph.D. in Atmospheric Sciences, The University of Michigan, Ann Arbor, Michigan
1993 M.S. in Electrical Engineering, The University of Michigan, Ann Arbor, Michigan
1989 M.S. in Physics, Louisiana State University, Baton Rouge, Louisiana
1985 B.S. in Space Physics, Univ. of Science and Technology of China, Hefei, Anhui, China.
Honors and Awards • JPL Ed Stone Award, 2006, for Outstanding Research Paper.
• NASA Board Award, 2005, NTR no. 35188
• GSFC Group Achievement Award (2005, 2007, 2009)
• NASA Group Achievement Award (2005, 2006)
• NASA Exceptional Achievement Medal (2001,20
• JPL Award for Excellence, 1997.
PROFESSIONAL SOCIETIES AND AFFILIATIONS
American Geophysical Union (AGU)
IEEE Geoscience and Remote Sensing Society
American Meteorological Society (AMS)
Selected Publications (out of 99 papers) 1. Wu, D. L., et al., MISR CMVs and multiangular views of tropical cyclone inner-core dynamics. Proceeding of
The 10th
International Wind Workshop (IWW10), Tokyo, Japan, 2010.
2. Chae, J. H., D. L. Wu, W. G. Read, and S. C. Sherwood, The role of tropical deep convective clouds on
temperature, water vapor, and dehydration in the tropical tropopause layer (TTL), ACPD, in review, 2010.
3. Xie, F., D. L. Wu, …, Super-refraction effects on GPS radio occultation refractivity in marine boundary layers.
Geophys. Res. Lett., in press, 2010.
4. Flury, T., K. Hocke, N. Kampfer, and D. L. Wu, “Gravity wave activity at midlatitudes during sudden
stratospheric warmings in 2008”, J. Geophys. Res., in review, 2010.
5. Li, T., …, D. L. Wu, …, “Seasonal and interannual variability of gravity wave variances revealed from long-
term lidar observations over Mauna Loa Observatory, Hawaii. J. Geophys. Res., accepted, 2010.
6. Jiang, J.H., .., D.L. Wu, …, "Five-year (2004-2009) Observations of Upper Tropospheric Water Vapor and
Cloud Ice from MLS and Comparisons with GEOS-5 analyses," J. Geophys. Res., accepted, 2010.
7. Wu, D. L. , J. H. Chae, A. Lambert, and F. F. Zhang, Characteristics of CALIOP attenuated backscatter noise:
Implication for cloud/aerosol detection, ACPD, in review, 2010.
8. Lee, J. N., D. L. Wu, G. L. Manney, and M. J. Schwartz, Aura Microwave Limb Sounder Observations of the
Northern Annular Mode: From the Mesosphere to the Upper Troposphere, Geophys. Res. Lett., 36, L20807,
doi:10.1029/2009GL040678., 2009.
9. Limpasuvan, V., and D. L. Wu, "Anomalous Two-day Wave Behavior during the 2006 Austral Summer,"
Geophys. Res. Lett. 36, L04807, doi:10.1029/2008GL036387, 2009.
10. Waliser, D. E., …., D. L. Wu, Cloud Ice: A Climate Model Challenge With Signs and Expectations of
Progress, J. Geophys. Res., CloudSat special section, 114, D00A21, doi:10.1029/2008JD010015, 2009.
11. Wu, D. L., et al., Vertical Distributions and Relationships of Cloud Occurrence Frequency as Observed by
MISR, AIRS, MODIS, OMI, CALIPSO, and CloudSat, Geophys. Res. Lett., 36, L09821,
doi:10.1029/2009GL037464., 2009.
12. Kim, S.-Y., H.-Y. Chun, and D. L. Wu, A study on stratospheric gravity waves generated by Typhoon Ewiniar:
Numerical simulations and observations, J. Geophys. Res. 114, D22104, doi:10.1029/2009JD011971, 2009.
13. Wu, D. L., et al., Comparisons of global cloud ice from MLS, CloudSat, and other correlative data sets. J.
Geophys. Res., CloudSat special section, 114, D00A24, doi:10.1029/2008JD009946, 2009.
14. Eckermann, S. D., L. Hoffmann,M. Ho¨pfner, D. L. Wu, and M. J. Alexander, Antarctic NAT PSC belt of

June 2003: Observational validation of the mountain wave seeding hypothesis, Geophys. Res. Lett, 36,
L02807, doi:10.1029/2008GL036629, 2009.
15. Eckermann, S. E., J. Ma, D. L. Wu, and D. Broutman, A Three-Dimensional Mountain Wave Imaged in
Satellite Radiance Throughout the Stratosphere: Evidence of the Effects of Directional Wind Shear. Q. J. R.
Meteoro. Soc., 2009.
16. Limpasuvan, V., and D. L. Wu, Recent structures of the two-day wave: zonal wavenumbers 2-4, Geophys. Res.
Lett., 36, L04807, doi:10.1029/2008GL036387, 2008.
17. Wu, D. L., H. M. Pickett, and N. J. Livesey, Aura MLS THz observations of global cirrus near the tropopause,
Geophys. Res. Letts., 35, L15803, doi:10.1029/2008GL034233, 2008.
18. P. Eriksson, M. Ekström, B. Rydberg, D. L. Wu, R. T. Austin, and D. P. Murtagh, Comparison between the
first Odin-SMR, Aura MLS and CloudSat retrievals of cloud ice mass in the upper tropical troposphere,
Atmos. Chem. Phys. 8, 1937–1948, 2008.
19. Wu, D.L., J.H. Jiang, W.G. Read, R.T. Austin, C.P. Davis, A. Lambert, G.L. Stephens, D.G. Vane, and J.W.
Waters, "Validation of the Aura MLS Cloud Ice Water Content (IWC) Measurements," J. Geophys. Res. 113,
doi:10.1029/2007JD008931, 2008.
20. Wu, D. L., and Eckermann, S. D., Global atmospheric gravity wave variances from Aura MLS: Characteristics
and interpretations, J. Atmos. Sci., 65, 3695-3718, DOI: 10.1175/2008JAS2489.1,, 2008.
21. Wu, D. L., et al., Mesospheric Doppler Wind Measurements from Aura Microwave Limb Sounder (MLS) ,
Adv. Space Res., 42, 1246–1252, 2008.
22. Zhang, R., …, D. L. Wu…, Intensification of Pacific Storm Track Linked to Asian Pollution, PNAS,
10.1073/pnas.0700618104, March 20, 2007.
23. Davis, C. P., H. C. Pumphrey, K. F. Evans, S. Buehler, and D. L. Wu, 3D polarised simulations of space-borne
passive mm/sub-mm midlatitude cirrus observations: A case study. Atmos. Chem. Phys. 7, 4149-4158, 2007.
24. Eckermann, S.D., J. Ma, D.L. Wu, and D. Broutman, "A Three-Dimensional Mountain Wave Imaged in
Satellite," Q. J. Roy. Meteorol. Soc., 133 (629), 1959-1975, Part B, 2007.
25. Shepherd, M.G., D.L. Wu, I.N. Fedulina and S. Gurubaran, Temperature variability in the tropical mesosphere
during the northern hemisphere winter, Adv. Space Res., In Press, 2007.
26. Kahn, B. H., …, D. L. Wu, Toward the characterization of upper tropospheric clouds using Atmospheric
Infrared Sounder and Microwave Limb Sounder observations, J. Geophys. Res., 112, D05202,
doi:10.1029/2006JD007336, 2007
27. Limpasuvan, V., D. L. Wu, M. J. Alexander, M. Xue, M. Hu, S. Pawson, and J. R. Perkins, Stratospheric
gravity wave simulation over Greenland during 24 January 2005, J. Geophys. Res., 112, D10115,
doi:10.1029/2006JD007823, 2007.
28. Su, H., …, D. L. Wu, Enhanced positive water vapor feedback associated with tropical deep convection: New
evidence from Aura MLS, Geophys. Res. Lett. 33, L05709, doi:10.1029/2005GL025505, 2006.
29. Fu, R., …, D. L. Wu, Short circuit of water vapor and polluted air to the global stratosphere by convective
transport over the Tibetan Plateau. 5664–5669 PNAS, vol. 103, no. 15, 2006.
30. Eckermann, S. D., and D. L. Wu, Imaging gravity waves in lower stratospheric AMSU-A radiances, Part 1:
Simple forward model, Atmos. Chem. Phys., 6, 3325-3341, 2006.
31. Wu, D. L., W. G. Read, and M. J. Filipiak, A Highlight of the First-Year Aura MLS Observations. SPARC
Newsletter, 26, 38, 2006
32. Forbes, J. M., and D. Wu, Solar Tides as Revealed by Measurements of Mesosphere Temperature by the MLS
Experiment on UARS. J. Atmos. Sci., 63 (7), 1776–1797, DOI: 10.1175/JAS3724.1, 2006.
33. Wu, D. L., J. H. Jiang, C. Davis, EOS MLS Cloud Ice Measurements and Radiative Transfer Model, IEEE
Transactions on Geoscience and Remote Sensing, 44, no. 5, 1156-1165, May 2006.
34. Wu, D. L., Chi O. Ao, George A. Hajj, Manuel de la Torre Juarez, and Anthony J. Mannucci, Sporadic-E
Morphology from GPS-CHAMP Radio Occultation. J Geophys. Res.-Space 110 (A1): Art. No. A01306, 2005.
35. Wu, D. L., and F. Zhang, A study of mesoscale gravity waves over the North Atlantic with satellite
observations and a mesoscale model, J. Geophys. Rev. Atmos. 109 (D22): Art. No. D22104,
doi:10.1029/2004JD005090, 2004.
36. Wu, D. L., and J.W. Waters, Satellite observations of atmospheric variances: A possible indication of gravity
waves, Geophys. Res. Lett, 23, 3631-3634, 1996.
37. Hays, P. B., D. L. Wu, and the HRDI science team, Observations of the diurnal tide from space, J. Atmos. Sci.,
51, pp.3077-3093, 1994.
38. Hays, P. B., …, D.L. Wu, …, Remote sensing of mesospheric winds with the High Resolution Doppler Imager,
Planet. Space Sci., 40, 1599-1606, 1992.

Title: WINDS Proposal to ESA Doc. No. MSSL/WINDS/PP/10002 issue 1
Page 79
Annex E: Cost information This annex gives the cost information that the summary in section is based on. WINDS cost SummaryElement Phase-A Phase-BCD Total
Keuro Keuro Keuro
Science Team 510 1276 1786
PayloadMISRlite 2097 9976 12073OABS 1930 6386 8316WAPU 554 3929 4483
Spacecraft 1000 20000 21000
Ground Segment 390 650 1040
Total 6482 42217 48699
Margin (20%) 9740
Total 58439 Science Team Phase-A Phase BCD Notes
Phase-A2 FTE £K 300 For 18 months
OSSE £K 100
Travel £K 40
Phase BCD2 FTE 1000 For 5 years
Travel 100
Total £K 440 1100
Total Keuro 510 1276

Title: WINDS Proposal to ESA Doc. No. MSSL/WINDS/PP/10002 issue 1
Page 80
Spacecraft Phase-A Phase BCD
Spacecraft Phase-A Keuro 1000 SEA estimate
Phase BCDS/C build Keuro 10000 SEA estimateS/C qualification Keuro 10000 SEA estimate
Total Keuro 1000 20000
MISRLite Phase-A Phase-BCD Notes
Phase-A Focal PlaneINO large package KCan$ 1000 INO indicative costNew readout circuit KCan$ 400 INO indicative cost
Optics DevelopmentDesign £K 20Prototype optics £K 120 two sets costed
Detector electronics developmentMSSL cost £K 197 ESA PEM cost with escalation
System design £K 550 5sy
Phase BCDMSSL cost £K 8600 Analogy to MSSL instrument progs
£K 1808 8600
Keuro 2097 9976
Phase BCD estimate (all £K)
sy costStaff 60 110 6600 Previous programmes
Non-staffDetectors 1000Components 800Materials 100Facilities 50Travel 50
Total (K£) 8600
OABS Phase-A Phase-BCD Notes
Astro und Fein Werk pro Keuro 1650 5546 with margin
Software Kuro 280 840 2sy and 6sy
Total 1930 6386
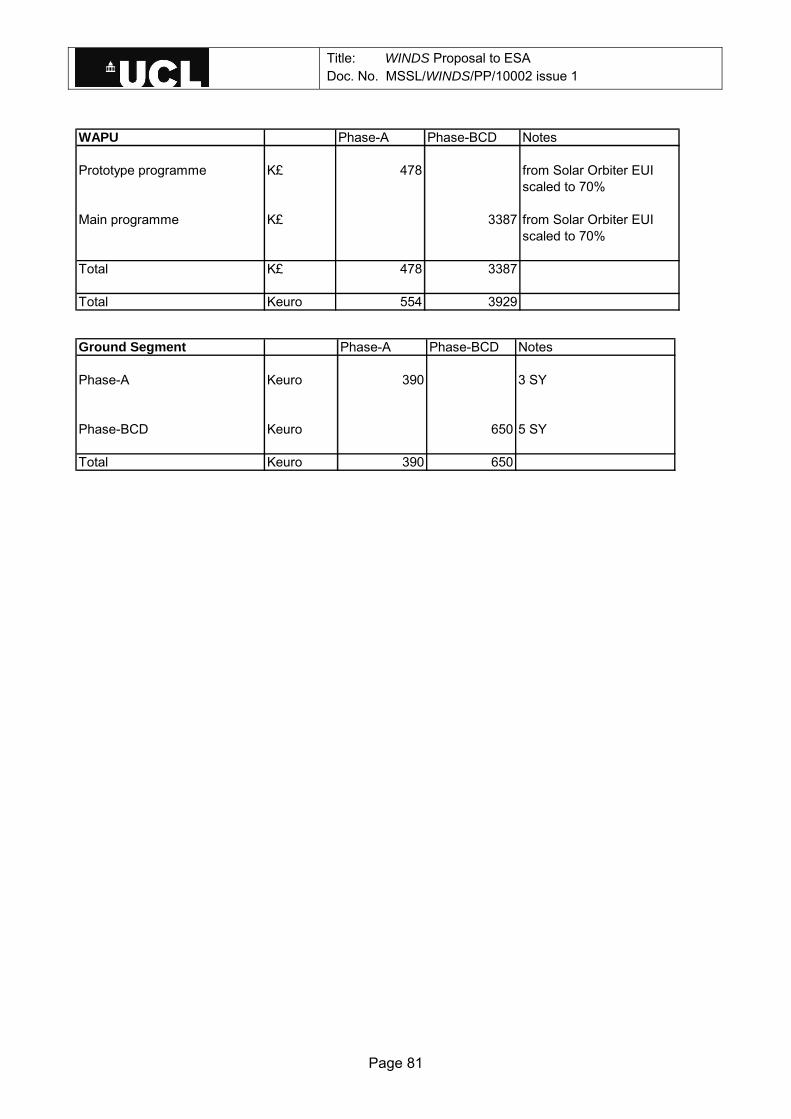
Title: WINDS Proposal to ESA Doc. No. MSSL/WINDS/PP/10002 issue 1
Page 81
WAPU Phase-A Phase-BCD Notes
Prototype programme K£ 478 from Solar Orbiter EUIscaled to 70%
Main programme K£ 3387 from Solar Orbiter EUIscaled to 70%
Total K£ 478 3387
Total Keuro 554 3929 Ground Segment Phase-A Phase-BCD Notes
Phase-A Keuro 390 3 SY
Phase-BCD Keuro 650 5 SY
Total Keuro 390 650
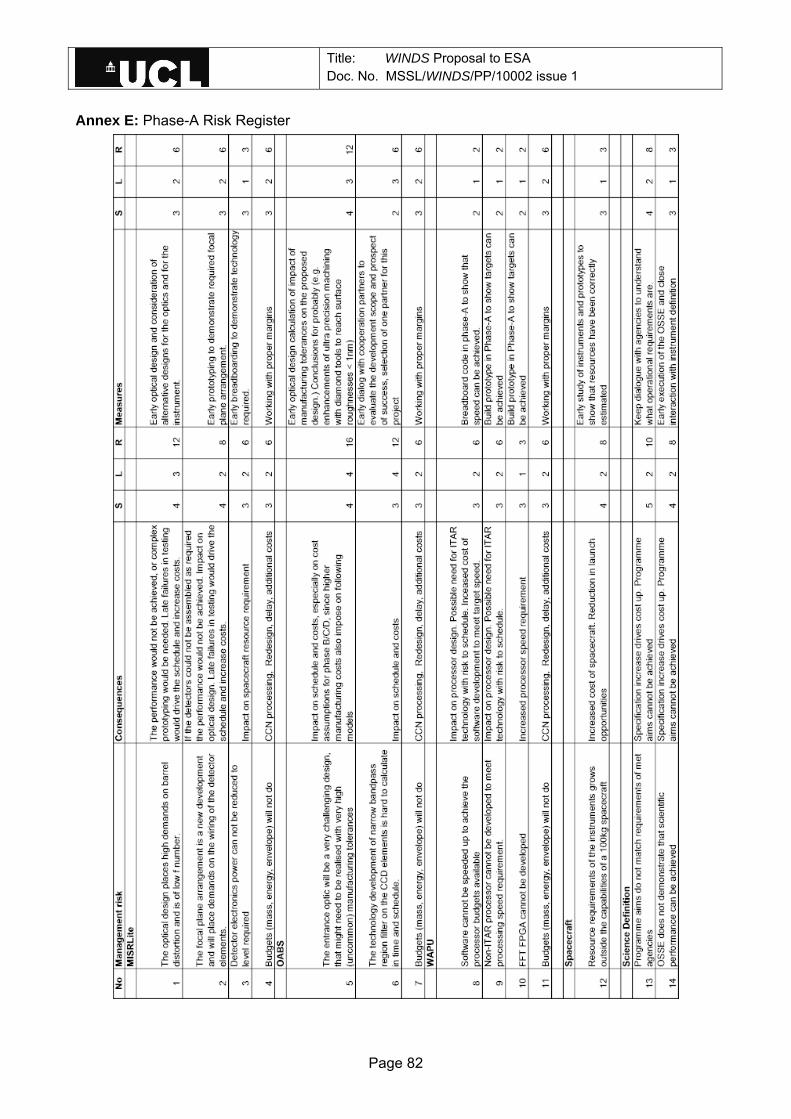
Title: WINDS Proposal to ESA Doc. No. MSSL/WINDS/PP/10002 issue 1
Page 82
Annex E: Phase-A Risk Register