msc programme in urban management and development thesis · chapter 2: literature review / theory...
TRANSCRIPT

MSc Programme in Urban Management and Development Rotterdam, The Netherlands
September 2016
Thesis Title: Impact of Land Use Regulation on Land Values
(Case Study for Measuring Impact of Sleman Regency Spatial Plan on Land Value in Ngaglik District, Sleman, Indonesia)
Name: A.Yunastiawan Eka Pramana
Supervisor: D.Ary Adriansyah Samsura
(Radboud University Nijmegen)
Specialization: Urban Land Development
UMD 12

MASTER’S PROGRAMME IN URBAN MANAGEMENT AND DEVELOPMENT
(October 2015 – September 2016)
Impact of Land Use Regulation on Land Values (Case Study for Measuring Impact of Sleman Regency Spatial Plan on
Land Value in Ngaglik District, Sleman, Indonesia)
A.Yunastiawan Eka Pramana Indonesia
Supervisor: D.Ary Adriansyah Samsura
UMD 12 Report number:
Rotterdam, September 2016
Impact of Land Use Regulation on Land Values
ii

Summary In Indonesia, the implementation of National Law no. 28/2009 has given local government great challenge to provide public infrastructure and also a great opportunity to find a suitable alternative for generating revenue. Land value capture policy could become an alternative for local government to generate revenue to be used for providing public service. In the condition where rapid urbanization happens, increment value of land also becomes inevitable. This increment value of land, which in many cases occurs as a result of public investment on infrastructure development and land use regulation, could be captured back to be used for financing public infrastructure.
The problem is that it is sometimes difficult to separate which part of that increment is resulted from public action, and which one is resulted from the investment of either individual land owners or private developer. If the effect of public infrastructure development, especially transportation infrastructure, into land value is more or less clear, the effect of public action in term of land use regulation is still debatable. This research is then conducted to gives contribution into the debate about the impact of land use regulation into land value and to figure out the impact of land use regulation imposed within the context of Indonesian city into land value.
This research used Ngaglik district as case study area. It is located in Sleman, a regency in Yogyakarta Province who has enacted a new spatial plan, called RTRW Sleman 2011-2031 in 2012. This new spatial plan put a clear distinction between urban and rural area, which gives several advantages into area designated as urban in term of intensity of social-economic activity in the future, possibility of development, and availability of public infrastructure. This regulation has the possibility to affect land value, thus making this case as an interesting example to be investigated.
This research utilized primary data collection using Global Positioning System (GPS) tool and GIS Software analysis. This primary data collection method could deal with the problem of lack of official data about land transaction in the case study area. It also utilized secondary data resources from newspaper advertisement to figure out the fluctuation of land value in the case study area before and after the enactment of the new spatial plan. Finally, this research has demonstrated the usefulness of statistical modelling using Multi Linear Regression to isolate the impact of land use regulation from other factors that may determine land value in the case study area.
The result shows that despite there was a significant land value uplift in the designated urban area after the enactment of RTRW Sleman 2011-2031, this uplift could not be attributed into the enactment of the new spatial plan. There might be another factor that creates this significant land value uplift in the designated urban area, such as the existence of big development that occurs in the designated urban area after the new spatial plan has been enacted. The insignificant effect might also due to the lack of consistency and stringency on the enforcement of the new spatial plan. The statistical modelling shows that public action in term of transportation infrastructure development and change land status into development land are considered as giving more significant effect on land value rather than the enactment of RTRW Sleman 2011-2031.
Keywords Land value capture, land use regulation, land value
Impact of Land Use Regulation on Land Values
iii

Acknowledgements Greatly thanks to Jesus Christ, Our Lord and God, who have been always with me in all the moment of my life. Ad Maiorem Dei Gloriam.
Big thanks also to Lembaga Pengelola Dana Pendidikan (LPDP) who has already sponsored my study at IHS and also sponsored this research.
Special thanks to my supervisor, Ary Adriansyah Samsura. Having a thesis supervisor from the same country has a chance of 1: 1,000 while having a thesis supervisor from the same country with the same birthday has a chance of 1: 1,000,000. Feel lucky to be supervised by you.
Big thanks to my father, M. Purnomo Harto and my mother, Neny Andayani, who always supported me during this research, especially in the preparation phase and data collection process.
Big thanks and love also to my girlfriend, Tutut Lestari, who have given me support when I was feeling down.
Big thanks also to all IHS Staff, especially to Urban Land Development (ULD) specialization team, for the great support and wonderful time during my study in IHS. I would like to give thanks especially to Carlos Morales, the father of ULD Specialization who has triggered the idea for me to do this research, Ore Fika, for your advice to do primary data collection, and Paul Rabe, who gives important feedback for this thesis. I am looking forward to collaborate again with all of you in the future.
Many thanks also to all parties that have been involved during data collection process for this research: Ibu Nurul and Pak Bardi from Badan Pertanahan Nasional (BPN) Kabupaten Sleman, staffs of Badan Pusat Statistik (BPS) Kabupaten Sleman, and fourteen land brokers involved in the field survey, especially Bapak Nur, Bapak Widodo, Bapak Gatot, Ibu Gatot, Bapak Mulud,and Bapak Basuki.
Impact of Land Use Regulation on Land Values
iv

Foreword I would like to thanks to the God Almighty because He has guided me until I could finish this thesis.
This thesis is written as completion to the Master Courses on Urban Management and Development at Institute for Housing and Urban Development Studies (IHS) Erasmus Universiteit Rotterdam. This course focuses on complex aspects of urban management and development, in which Urban Land Development becomes a part of this complexities.
Land value capture is an interesting topic to be discussed because its two sides: it becomes an interesting alternative for local government to generate revenue for financing public service provision in the one hand, but in the other hand it creates debate about which part of this increment is resulted from public action. I would like to contribute into this debate by conducting this research, especially about the contribution of public action in term of land use regulation into land value.
This thesis has much changed rather than the one that I proposed in the beginning together with Carlos Morales. After receiving many feedbacks and reflecting the condition in the field, I, with helps of my thesis supervisor, Ary Ardiansyah Samsura, decided to change the thesis topic drastically, in order to make it more focuses on one issue rather than elaborates too many issues within a research. This research was conducted through a field work in Sleman, Yogyakarta, in which I would like to say thank you for all colleagues who has helped and encouraged me during the field work process.
Finally, I acknowledge that there are many limitations in this research. This research is a part of learning process for myself and it is only the beginning, not the end of my passion to develop my knowledge. Hopefully the first step that I have taken so far would enable me to contribute more to the society.
Rotterdam, 17 October 2016
A.Yunastiawan Eka Pramana
UMD-12 Student
Impact of Land Use Regulation on Land Values
v

Abbreviations
IHS Institute for Housing and Urban Development
RTRW Rencana Tata Ruang Wilayah (Regional Spatial Plan)
RTRWP Rencana Tata Ruang Wilayah Propinsi (Provincial Spatial Plan)
UGB Urban Growth Boundary
BPN Badan Pertanahan Nasional (National Land Administration Office)
BPS Badan Pusat Statistik (Central Agency of Statistics)
BAPPEDA Badan Perencanaan Pembangunan Daerah (Regional Development Planning Office)
Impact of Land Use Regulation on Land Values
vi

Table of Contents
Summary ................................................................................................................................. iii Keywords ................................................................................................................................ iii Acknowledgements ................................................................................................................. iv
Foreword ................................................................................................................................... v
Abbreviations .......................................................................................................................... vi Table of Contents ................................................................................................................... vii List of Tables ........................................................................................................................ viii List of Figures ....................................................................................................................... viii Chapter 1: Introduction .......................................................................................................... 1
1.1.Background ................................................................................................................................... 1 1.2.Problem Statement ........................................................................................................................ 2 1.3.Research Objective ....................................................................................................................... 4 1.4.Research Question ........................................................................................................................ 4 1.5.Significance of the Study .............................................................................................................. 4 1.6.Scope and Limitations .................................................................................................................. 5
Chapter 2: Literature Review / Theory ................................................................................. 6
2.1.Modelling urban land values ........................................................................................................ 6 2.2. Land use regulation and its impact on land values .................................................................... 10 2.3. Land market and land regulation in developing countries ......................................................... 14 2.4.Conceptual Framework ............................................................................................................... 16
Chapter 3: Research Design and Methods .......................................................................... 17
3.1. Definition ................................................................................................................................... 17 3.2.Operationalization ...................................................................................................................... 19 3.3.Research Strategy ....................................................................................................................... 20 3.4.Validity and Reliability .............................................................................................................. 21 3.5.Data Collection Method .............................................................................................................. 21 3.6.Data Analysis Method ................................................................................................................ 23
Chapter 4: Research Findings .............................................................................................. 24
4.1. Spatial Plan of Sleman Regency (RTRW Sleman) 2011-2031 ................................................. 24 4.2. Description of the Case Study Area ........................................................................................... 29 4.3.Land Values Fluctuations 2009-2015 ......................................................................................... 31 4.4.Sample characteristics for statistical modelling.......................................................................... 35 4.5. Land value modelling for land transaction in Ngaglik during 2008-2015 ................................. 38 4.6. RTRW Kabupaten Sleman 2011-2031 and its impact into land value in case study area ......... 43
Chapter 5: Conclusions and recommendations .................................................................. 48
Bibliography ........................................................................................................................... 51
Annex 1: Location of sample ................................................................................................. 55
Annex 2: Questionnaire (Research Instrument) ................................................................. 56
Annex 3: Result of Normality Test for Land Fluctuations Analysis (Refer to Chapter 4.3) ........................................................................................................................................... 58
Annex 4: IHS copyright form ............................................................................................... 61 Impact of Land Use Regulation on Land Values
vii

List of Tables
Table 1. Population density in districts that included in APY ............................................................................................. 2 Table 2. Operationalization ................................................................................................................................................... 20 Table 3. Population density in Ngaglik district 2009-2015 ................................................................................................. 30 Table 4. Increase rate of population density in Ngaglik 2010-2014 ................................................................................... 30 Table 5. Result of Mann-Whitney test in 2009 .................................................................................................................... 34 Table 6. Result of Mann-Whitney test in 2012 .................................................................................................................... 34 Table 7. Result of Mann-Whitney Test for 2015 ................................................................................................................. 35 Table 9 Distribution of sample based on price .................................................................................................................... 36 Table 8. Distribution of sample based on administrative location ..................................................................................... 36 Table 10. Distribution of sample based on lot size .............................................................................................................. 37 Table 11. Distribution of sample based on location and time of transactions ................................................................... 37 Table 12. Distribution of sample based on land status and time of transaction ............................................................... 38 Table 13. Descriptive statistics for distance variable .......................................................................................................... 38 Table 14 Result of regression analysis .................................................................................................................................. 40
List of Figures Figure 1. Map of Sleman Regency .......................................................................................................................................... 1 Figure 2 Urban land value bid curve model for agricultural and residential ..................................................................... 7 Figure 3. Conceptual framework .......................................................................................................................................... 16 Figure 4 Hierarchy of Spatial Plan in Indonesia ................................................................................................................. 24 Figure 5 Content of RTRW Sleman 2011-2031 ................................................................................................................... 25 Figure 6 Designated Urban Area based on RTRW Sleman 2011-2031 ............................................................................. 27 Figure 7 Map of Ngaglik District with some part delineated as Urban Area in RTRW Sleman 2011-2031 .................. 29 Figure 8. Contributor of GDP in Ngaglik 2009-2014 .......................................................................................................... 31 Figure 9. Fluctuation of land asking price 2009-2015 ......................................................................................................... 32 Figure 10. Mean comparison of land asking price in rural and urban area ..................................................................... 33 Figure 11 Land value change in Ngaglik 2013-2015 ........................................................................................................... 45
Impact of Land Use Regulation on Land Values
viii

Chapter 1: Introduction
1.1.Background Sleman is one of the five regencies under the jurisdiction of Daerah Istimewa/ D.I. Yogyakarta) -Yogyakarta Special Region, Indonesia. It is located on the north of Yogyakarta City, which is the capital of D.I. Yogyakarta. Sleman consists of seventeen districts, which can be seen in Figure 1 below. As a growing region, Sleman has an increasing number of inhabitants, from 850,176 in 2000 into 1,163,970 in 2014. Its demographic structure is dominated by people in productive age (15-65 years old) by the percentage of 70%. Manufacture and Construction Businesses are the major contributor for Gross Domestic Product (GDP), each of which contributes 13.5% and 10.77% of the total GDP ('Badan Pusat Statistik Kabupaten Sleman', 2015).
Fifty percent of Sleman populations live in six districts which become part of an area called Aglomerasi Perkotaan Yogyakarta/ APY (Yogyakarta Urban Agglomeration Area). Those districts are Depok, Mlati, Ngaglik, Gamping, Ngemplak, and Godean. Urban activities in Yogyakarta city have spilled over and formed these areas. They cover the whole area of Yogyakarta City and several districts on the administrative territory of Sleman and Bantul Regencies. The information of populations in six districts in Yogyakarta Urban Agglomeration Area can be seen in table 1.
Figure 1. Map of Sleman Regency Source: Peta Rupa Bumi Indonesia (2012)
Impact of Land Use Regulation on Land Values
1

As an area with the highest density among other districts in Sleman, those districts have experienced rapid growth. As stated by Sutomo (2011, pp. 22), Depok has become the centre of economic growth in Sleman for the last several decades. Its growing economic activities have pushed the sprawl of urban activities to its surrounding areas. Land use conversion, from agricultural or rural use into urban use have grown rapidly in those six districts. Among those six districts, Ngaglik and Gamping have the highest rates of agricultural land conversion during 1999-2009 (Harini, Yunus, et al., 2012, pp. 126).
As a rapid growing region, APY also has an active land market. Every day more than fifty parcels of land are being traded in the land market. Information about land market could be traced everywhere, either through regional newspapers1 or property trading web-sites2. The value of property in Yogyakarta, especially in Sleman, is increasing every year. This fact is supported by Sleman National Statistical Bureau (Badan Pusat Statistik/BPS) which mentioned that the price of new houses in Sleman are increasing for the average of 5% every year.
1.2.Problem Statement As an area which has been facing rapid urbanization, Sleman is in need for better public service provision. According to the report by the Ministry of Public Works in 2003, the rapid urbanization has taken place in Sleman without being supported by adequate infrastructure development (Departemen Permukiman dan Prasarana Wilayah, 2003, pp.38). Moreover, after the implementation of the National Law number 28/2009 which regulates the function of local government in Indonesia, local government especially at regency and municipality level bears responsibility to provide some type of public infrastructure, which is mostly urban infrastructure. Those two aforementioned reasons have given a great expectation for local government in Sleman to provide urban infrastructure in order to maintain the sustainability of urban growth within their authority.
Not only imposing responsibility to provide urban infrastructure, the implementation of National Law number 28/2009 opens an opportunity for local government in Indonesia to make innovation for generating their own revenue. Up until now, Sleman local government, as many other local governments in Indonesia, rely much on inter-governmental transfer as the main resource of revenue. This inter-governmental transfer comes in terms of revenue transfer from either national government or local government at provincial level. Based on Sleman budget plan in 2015, revenue from inter-governmental transfer contributes 46.95% of total revenue while revenue from local tax only contributes 14.43%.
1 Such as Kedaulatan Rakyat, Harian Jogja, and Tribun Jogja 2 Such as urbanindo.com
Districts Populations Density (people/km2) Depok 186.417 5.244 Mlati 110.276 3.867 Gamping 105.521 3.608 Ngaglik 113.650 2.950 Godean 70.501 2.627 Ngemplak 63.760 1.785
Table 1. Population density in districts that included in APY Source: BPS Kabupaten Sleman (2015)
Impact of Land Use Regulation on Land Values
2
Land value capture policy could be a good alternative for local government, especially in Sleman, to generate revenue for public service provision. There is a great potentiality to exercise land value capture policy in Sleman since it has an active land market and the land values increases, especially in the urbanized area. This increment value of land, which is in many cases resulted from public action by local government, in terms of public infrastructure provision and land use regulation. Hence it is called “unearned increment” (Alterman, 2012) which could be captured back by local government for the purpose of public service provision (Walters, 2013).
However, the problem is that it is often difficult to separate the part of those increments resulted from a public action and the one resulted from investment being made by either private land owners or developers. Some research has been conducted in order to prove that public action in terms of infrastructure development, especially transportation infrastructure, and land use policy gives a positive impact on land price. As argued by Smith and Gihring (2006) transportation infrastructure development has been proven to give a positive impact on land value. Therefore, now is the time to formulate how to capture the increment value of land resulted from this kind of public action. The same evidence is also found by Debrezion, et.al (2007) who did a meta-analysis over 63 research about impacts of railway station development on land price. The result shows that public investment in railway station development gives a positive impact on land and property price around railway stations.
The impact of transportation infrastructure development on land price is more or less clear. However, the impact of land use policy is still debatable. This is because the term of land regulation varies and they may have a different form in different situations and time (Ihlanfeldt, 2007). Land use policy may increase the land values (Cho, et al. (2008) and Zhou, et al. (2008)), but it may also have either negative impact on land values (Ihlanfeldt, 2007) or insignificant impact (Kok, et.al., (2014) and Glaesser and Ward, (2009)).
Regarding the debate on the impact of public action in terms of the impact of land regulation on land values, Sleman Regency provides an interesting case because it has already adopted a new spatial plan in 2012. The new spatial plan, which is called Rencana Tata Ruang Wilayah (RTRW) Kabupaten Sleman 2011-2031 (Sleman Spatial Plan, 2011-2031), is a form of statutory planning and the process of preparing this plan is a top-down process. After seven years of not having a definitive spatial plan, this new spatial plan replaced the outdated spatial plan that expired in 2004. The new spatial plan consists of several main parts which also reflects concern of local government on guiding development in Sleman Regency. Under this new spatial plan, local government put a clear distinction between area which is called an urban area and rural area as one of the most important regulations related to land use in the region.
The distinction between rural and urban area within RTRW Sleman 2011-2031 has brought several consequences regarding to the intensity of activity and scale of development which are allowed for each area. Based on the new spatial plan, the designated urban area will get advantage in terms of possibility of future development and availability of urban infrastructure in the future. Because land use regulation could become one factor that determines land values (Alexander, 2014) and because the regulation stipulated within RTRW Sleman 2011-2031 document may give the designated urban area some advantages, referred to Alterman (2012, pp. 760-761) as the windfall that may cause land values increase, it is interesting to figure out how the enactment of this new spatial plan could affect the land values in Sleman.
In order to investigate the impact of this new spatial plan on land values, a case study is conducted in this research. Due to time limitation and data availability, this case study will be conducted in a district in Sleman in which a comparison could be made. Among sub-districts located inside the urban boundary, Ngaglik district provides a special case. Physical Impact of Land Use Regulation on Land Values
3

development has happened in Ngaglik not only in the area close to city centre but also in the northern part of it because of the existence of some Universities and Academic Campuses in this area. Urban growth within this area happened in a sprawling pattern which causes the land values in the area far away from city centres to be almost the same as the one closer to city centres. However, only the southern part of this district is included into the urban boundary while local government try to limit development that occurs close to the sub-nuclei of urban growth in the northern part of Ngaglik. This district provides a comparable case, between the area delineated as urban area and area beyond urban boundary, in order to figure out the impact of the new land use regulation on land values in Sleman Regency.
Even though it is difficult to generalize the findings of a case study, the result of this research may give indication that the same phenomena might happen regarding to the impact of public action in terms of land use regulation on land values. This case study will give contribution to the academic debate about the impact of government intervention in terms of land regulation on land values and at the same time may give consideration to the local government in Sleman to formulate land value capture policy to finance public service provision.
1.3.Research Objective Based on the problem statement above, the purposes of this research are
- To figure out how public actions by the regional government in Sleman in terms of the enactment of new spatial plan affect land values in the study area
- To give contribution on land policy making process in the future regarding the enactment of RTRW Kabupaten Sleman 2011-2031 in Sleman Regency.
1.4.Research Question Based on the problem statement, the research question could be formulated as:
To what extent does the implementation of RTRW Kabupaten Sleman 2011-203 affect land values in Ngaglik District, Sleman Regency?
To answer the main research question, these following sub-questions are being used:
1. What is the land values difference before and after the implementation of RTRW Kabupaten Sleman 2011-2031?
2. What factors affect land values considering the implementation of RTRW Kabupaten Sleman 2011-2031 and how do those factors affect land values in Ngaglik district, Sleman Regency?
3. How significant is the effect of the implementation of RTRW Kabupaten Sleman 2011-2031 on land values in Ngaglik District?
1.5.Significance of the Study Although it is a case study research whose result is less generalized into a wider circumstance, this research will give contribution to the debate about the impact of public action in terms of land regulation on land values. It is now still debatable as to what extent the government intervention in terms of land use regulation will affect land values. The problem is that the term of land use regulation itself has a different form and meaning, which allows every effort to prove the impact of land use regulation on land values to yield a different result.
Impact of Land Use Regulation on Land Values
4

In the other hand, since it is public action which causes increment value of land and this argument becomes a fundamental on practicing land value capture policy, this research might also contribute into policy making process in Sleman Regency. Local government will face the consequences of delineating urban area, which is their obligation to provide service and infrastructure within urban area and also rural area. By examining the impact of this form of local government intervention on land values, this research could provide a basic for local government in Sleman to consider land value capture policy in the future. The result of this research could also give contribution and feedback for review process of the new land use plan, which will be conducted in 2017.
1.6.Scope and Limitations This study is conducted in order to measure to what extent the new spatial plan by local government in Sleman, which is RTRW Sleman 2011-2031, gives impact on land values. As a case study area, a special case is being selected, which is Ngaglik district. It is one of six districts in Sleman Regency whose parts of their area are included into the urban area delineated by the new land use plan.
Because of the discussion on the impact of the government intervention in terms of land use regulation could be drawn into a broader extend, the researcher limits the discussion only about the impact of RTRW Sleman 2011-2031, which is a form of government intervention, on land values in the case study area. Therefore, this research could not elaborate too much about the level of regulation enforcement and effect of land use regulation itself on other aspects than the land values in the case study area.
This research faces limitation on time and data availability. This research is conducted in a very limited time, with only four weeks are allocated for data collection. Meanwhile the data of land values is not adequately available thus as it will be explained later, the primary data collection method has been selected as the main data collection method. During this limited time, case study area was being selected carefully in order to find an area within Sleman Regency that enables the researcher to do a comparison study for examining the impact of the enactment of new spatial plan on land values. In order to do so, Ngaglik district was being selected thus this research will only cover a part of Sleman Regency, instead of the whole of Sleman Regency area.
Impact of Land Use Regulation on Land Values
5
Chapter 2: Literature Review / Theory
2.1.Modelling urban land values Land values and land use have become a concern in various fields of expertise, such as geography, economy, and social science. In order to understand the dynamic of land values and land use, a model is frequently used. At the very beginning, experts tried to model agricultural land. It is understandable that urban land values model began with a model for the agricultural land. It is because in the early years, agricultural activity was the main concern rather than the urban area itself.
In this chapter, two basic models will be presented. The first one is the classical model, which in the early year was derived from the model for agricultural land values. In the second land values model which is based on the statistical model through Multi Linear Regression will be presented.
2.1.1. Classical Modelling of Urban Land Values Some classical theories could not be neglected in building models of urban land values. David Ricardo in Alonso (1964) proposed that the difference of rent between agricultural lands is due to fertility different. Fertile land tends to have a higher rent to be paid to its owner because it produces more. Although Ricardo also considered distance factor from market into model, but he emphasized more on the land fertility. This effort was continued by Von Thunen, who stated that land rent is the result of total value of an agricultural commodity reduced by cost of transportation and production. the more distant the location, the higher for the transportation cost to the market. Whereas, the closer the agricultural land to the market, the lower the transportation cost. It results in land rent gradient, with the higher rent is on the land located close to the market and it decreases as the distance gets farther, where the land rent is almost zero.
In the beginning of the 19th century, urban land values modelling was being put into consideration. Several efforts have been made until Alonso (1964) proposed an urban land values and land use model. This model was built under several assumptions, namely the hypothetical city is built on a featureless plain, both sellers and buyers are well informed, and transaction occurs in order to maximize profit and satisfaction both for sellers and buyers. When people do a land transaction, they buy two things at the same time, i.e. land and location. It creates a complication since there is only a single transaction and a single price for both things.
Here the actors of the land market, i.e. sellers and buyers, are treated as economic people. It neglects the fact that people may have feelings, interests, and needs. Both actors act under the guidance of economic rationality. The buyers will only buy goods, in this case is land, to maximize their satisfaction. In the hypothetical city, all jobs and goods are only available at city centres. This model also assumes that both buyers and sellers are well informed. It means that information of land market is open, accessible by both parties, and there is no structural constraint.
In the mathematical and static model, it is denoted that individual income is a sum of individual expenditure for daily good, purchasing some square feet or meter of land with a certain price, and cost for commuting into his location. This mathematical model is being used to determine individual equilibrium of location choice. In the model, it is assumed that the price of land will decline as the distance from the city centre increases. Otherwise, the cost for commuting is
Impact of Land Use Regulation on Land Values
6

higher as the distance from the city centre increases. Individual equilibrium of location choice is a location where the combination of quantity of consumable goods, land, and distance for commuting fulfils the individual satisfaction.
In spite of the same principle of utility maximization, there are differences among bid rent curve for agricultural, urban firms, and residential land. For agricultural land its bid rent function relates with the price of different commodity in the market while it is assumed that the profit is constant. On the other hand, for urban firm the bid rent function relates to various levels of profit. For residential use, bid rent becomes negative as the distance from the city centre increases. According to the mathematical modelling by Alonso, there are two factors contributing to the negative sign for distance, which leads to disutility of distance and commuting cost.
Figure 2 Urban land value bid curve model for agricultural and residential Source: Alonso (1964)
Urban rent-bid model by Alonso (1964) as seen in Figure 2 above explains the formation of land price by modelling the competition among individual bid-rent function. Using the condition where there are two actors as consumers, namely “i” as an individual resident and “ag” as the farmer of a certain product, and there are two landlords which each own different location, with landlord 1 (L1) owns a land at a closer distance to the city centre (t1) and landlord 2 (L2) owns a plot of land at the further distance from the city centre (t2), the market equilibrium for the land price could be formulated. As an individual who bids for a residential land will face a high cost of commuting, he is willing to pay P1 for the land which is located closer to city centre (t1). Meanwhile the farmer is willing to pay the same price for both land owned by L1 and L2 (Pag=P2). Because in the location owned by L1, the individual for residential use could bid higher price than the farmer, t1 becomes the best location for residential housing, while the farmer will be located on the t2. The same condition also applies when more players are introduced, such as an urban firm and another farmer with different agricultural products.
The steepness of each bid curve will be determined by different factors. For residential uses, the steepness of bid curve reflects the need for an individual to be closer to city centres. On the other hand, for urban firm the main driving force for bidding a land is their profit maximization. It is a result of production minus cost, including cost for transporting product to city centres. If
Impact of Land Use Regulation on Land Values
7

the sales of an urban firm rapidly drop and it should bear high transportation cost, they will bid more for location at the centre.
2.1.2. Modelling Urban Land values through statistical modelling If within the classical model, the distance from the city centre or economic centre is the main consideration, experts on urban land considers the importance of factors other than distance in determining urban land values. Later, the modelling of urban land values elaborates those factors and uses statistical modelling in order to take into account those complex factors.
In general, according to Alexander (2014) there are three factors that determine land values, which are its relative location, service, and governance. The first factor which is relative location of a site is being said as “expresses the interdependence between activities and land use that gives a particular piece of land its value” (Alexander, 2014, pp. 535). Relative location as the determinant of land price has been discussed since several decades ago, when von Thunen proposed a model to describe the gradient of land values based on plant characteristics and its distance from the market. Another classic theory of land rent was proposed by Alonso which formulates the concept of high use and best use. The main determinant of land values is its accessibility. The higher accessibility a location has the more valuable it is (Alonso, 1964).
The second factor determining land prices according to Alexander is servicing. This factor has a strong correlation with the relative location of the land. Availability of service will determine the land potential for further development. Among several kinds of infrastructures, Alexander argues that transportation infrastructure is the most influential, since it will increase the accessibility of land, thus determines its relative location.
Some evidences may prove the significance of transportation infrastructure development on land and property price. Mulley and Tsai (2016) has studied correlation between transportation infrastructure developments and the property price. They used a multilevel model to measure how significant the development of Bus Rapid Transit System in Sydney, Australia impact on the property price within the catchment area of the project. The result of their study showed that the development of BRT in Sydney happened but only shortly after the commencement date of the project in 2003-2004 (Mulley and Tsai, 2016). In line with Mulley and Tsai, Ibeas, et.al (2012) may prove that the accessibility in terms of access to the nearest public transportation hub may give increment on property prices.
Another suggestion about the impact of infrastructure development on land price has also been formulated by Smith and Gihring (2006), who compiled a literature review under this issue. They argued that evidences may prove the impact of transportation infrastructure development on land price. Thus, it is the time to formulate how the land values capture instrument is being utilized to capture the increment value of land resulted from transportation infrastructure development. In line with both researchers, Debrezion, et al. (2007) concludes that government investment on infrastructure development may give increase on land price. This conclusion was drawn from a meta-analysis study over around sixty-three research papers about the impact of railway infrastructure development on land price.
The third factor which is how land is being governed will be elaborated into more detail later. As stated by Alexander (2014), land governance in terms of predictive planning may give information needed by land market actors to identify relevant externalities and expected neighbourhood effect. This information will be utilized to estimate future development and also to appraise the land values.
Impact of Land Use Regulation on Land Values
8
In order to elaborate factors that determine land values, Hedonic Price Model is often used as a tool for doing analysis. This model is being said by Ibeas et al. (2012) to give a useful tool to estimate value uplift of a property as a result of public investment on infrastructure. Hedonic Price Model proposed by Rosen (1974) is based on the hypothesis that the value of goods is based on its characteristics. Rosen defines the Hedonic Price Model as “the implicit prices of attributes and are revealed to economic agents from observed prices of differentiated products and the specific characteristics associated with them” (1974, pg.34). This model is utilizing econometrically first step regression analysis in order to examine what characterizes the compound value of goods. Land price under the Hedonic Price Model is seen as a function of several characteristics, which are denoted as p(z)= p(z1,z2,z3,……zn). Based on that formula, price is “defined at each point on the plane and guides both consumer and producer locational choices regarding packages of characteristics bought and sold” (Rosen, 1974, pg. 35).
Several analyses either of the impact of land use policy and transportation infrastructure development mentioned above have demonstrated the usefulness of Hedonic Price Model to analyse urban land values. Mulley and Tsai (2016) consider not only the relative location of a property from the transportation hub but also consider the physical characteristic of the property and also the accessibility to the social and economic activities. Another use of this model was demonstrated by Chicoine (1981) who utilized Hedonic Price Model to analyse factors that shape farm land price at the urban fringe area. This model is formulated as a function of “access to points of economic and social attractions, amenity, and physical properties, the availability of public services, and institutional factors that influence the land market and its participants” (Chicoine, 1981, pp. 354). Distance to the city centre and availability of road connections were being used to represent access variable. The land fertility may determine the price of farm land at urban fringes, but when the urban growth pressure is high, this factor may be insignificant. The availability of amenity will also influence farm land price. In this research the researchers use the acres of neighbouring industrial and commercial land use, acres of neighbouring mining, and distance from large body of water in the nearby area. Land values may also be influenced by the implementation of zoning regulation that may increase the possibility of development within an area, thus the researcher also takes this factor into account.
The type of buyer will also determine the land values, since the financial capacity, of a developer for instance, could be higher than if the land is bought by a household. Another factor that makes the type of buyer should be taken into account is regarding to the level of information to make a decision to buy. A big developer could already have information about the future urban use before making decision to buy, while an individual buyer might not be well-informed about this potentiality. One other factor to be considered within this model is the plot size because it may indicate the possibility of future development. If the plot size is small, an extra cost might burden the developer because they have to assemble small plots to achieve optimal plot size for development.
Utilizing the Hedonic Price Model, Chicoine concluded that the variable of distance from social and economic activites has negative coefficients, which confirm that the land values will decrease along with the increase of distance from the city centre. When the location is contiguous with existing neighbourhood, the land values will increase. For the variable of land use zoning, the coefficient is positive if the plot is located within a commercial or industrial zone but it is insignificant if it is located on the residential zone The characteristics of buyer have a negative coefficient for individual buyer, which means that the land values will be lower if the buyer were individual. It may indicate that the participation of land market actors in the land transaction will have different effects to the land price. Otherwise, Chichoine stated that
Impact of Land Use Regulation on Land Values
9

a future research was expected to go deeper into the effect of land market involvement on determining the land price.
2.2. Land use regulation and its impact on land values The way government makes intervention through land use regulation will determine the outcome of land use patterns in a city (Brueckner, J. K., 2006). As stated by Brueckner, this intervention in terms of land use policy somehow creates unexpected effects, which might cause a net social loss and make the condition of urban economy worse than before the intervention took place. On the other hand, this type of government intervention may also create a betterment of land values (Alterman, 2012). As demonstrated by Booth (2012), land regulation, together with infrastructure development, has created land values uplift. In Britain and France, this value uplift is then captured by the government because this betterment came about without any effort of the land owner (Alterman, 2012, Booth, 2012).
There are several types of land use intervention, such as Urban Growth Boundary, Floor Area Ratio (FAR) restriction, cost-increasing regulation, bureaucratic control of development decisions, and racially based land-use interventions. A lot of countries in Asia and Europe impose growth management control in order to protect environment thus maximising urban growth within a certain limit (Cunningham, 2007). In general, there are three common forms of urban growth management being imposed by the governments around the world, those are greenbelt, Urban Growth Boundary, and Urban Service Boundary (Bengston and Youn, 2006). Greenbelt is characterized by the existence of open space, in the form of farmland, forest, or another green space that limits the growth of urban area permanently. The physical barrier created through Urban Growth Boundary is different from the one created through a green belt. It is not a physical space but only a line separating the urban area with its surrounding rural areas. It is not intended to permanently limit the growth of a city; therefore, this boundary would be re-assessed and re-defined over time. Urban Service Boundary comes in the less obvious form compared to the previous type of growth management control. It only limits the provision of service such as water pipeline and sewerage inside a certain urban area, hence leaving the areas outside the boundary being unserved.
The impact of land use regulation on land price is debatable. Measuring the impact of land use regulation into land price is difficult because of difficulties in obtaining data and the land use regulation has various forms (Cheshire and Sheppard, 2004). The same difficulty is also underlined by Jaeger (2013) who formulated three difficulties in measuring the impact of land use regulation on land price as follows:
1. Land use regulation is a complex concept and it is difficult to be quantified,
2. The number of sample is sometimes inadequate to examine the impact of various regulations which are applied in a single town or metropolitan area,
3. Only a few number of study examines the positive impact of land use regulation in that it may give an “amenity effect”, which by the existence of land use regulation it may raise the possibility of some kinds of activity. This amenity effect may increase the demand on land.
Zhou, McMillen, et al (2008) also stated the difficulties of measuring the impact of land use regulation on land values. There are two reasons why difficulties appear in examining the impact of land use plan on land values. First, it is the market competitiveness which already allocates land use into its best and highest use. Second, zoning may be flexible and just repeatwhat competitive market has already done. The second one has a correlation with the
Impact of Land Use Regulation on Land Values
10

selection bias, which happens when a decision maker follows the existing land values to decide the zoning system.
However, several efforts have been made in order to prove the impact of land use regulation on land values. Most of those research concludes that land use regulation impacts on land price. Whether the impact is positive or negative is still debatable. Here several literatures will be reviewed to give a big picture on how land use regulation brings impact on the land values.
2.2.1. Impact of growth control regulation on land values An effort to explain the impact of growth control regulation was made by Brueckner (2006). Using a model of a hypothetical city, Brueckner tries to explain the economic impact of land use intervention by the government, mostly on housing price. Brueckner explains the economic impact of Urban Growth Boundary (UGB). Two imaginary cities are used as models. The first city (A) has x as an existing urban border, while the second (B) has imposed an UGB regulation thus the existing border is xugb. It denotes that xugb < x. In a point in time, city A imposes UGB regulation, which means it would constraint the urban growth outside the boundary and suppose that now the urban border is moved into xugb in city A. It assumes that because of the imposition of UGB, land outside x-ugb should be converted back into a rural use. It would cause reduction on developable land. This situation will create excess on demand of a developable land and increase the competition to acquire a developable land inside the UGB. Excess in demand will move the curve for demand upward; thus the new equilibrium will form a new price, which is higher than before. Since the price of land is expensive and there is an excess in demand, developers then will build more high-rise buildings. As modelled by Brueckner, compared with another city without UGB policy, city A will be characterized by a spatially smaller size, having a more expensive housing, higher land rents, taller buildings, and smaller dwellings. Brueckner suggests that UGB policy is a counter-productive policy that will worsen the living quality of city residents. This model presented by Brueckner is supported by the evidence in the case of UGB policy in Korea, which increases the house price. Urban growth rate is slower after the UGB policy has been imposed while the population and GDP grow. It indicates that the condition is ripe enough for a rapid escalation of housing price in Korea.
Jaeger, Grout, et al. (2008) analysed the impact of UGB on land price from the perspective of both demand and supply sides. Using the case of Portland, Oregon, the researchers at the beginning summarizes and compares the previous study of the impact of UGB imposed in Portland, Oregon. The previous studies used to analyse the impact of UGB on land price yield almost similar results, i.e. the UGB tends to raise the land price within the UGB. From the view point of supply side, UGB restricts the supply of developable land, creating an excess demand for developable lands inside the UGB. Apart from the demand side, UGB causes amenity effects, which also yield the same result: increasing the demand on developable lands inside the UGB.
The theory formulated by Brueckner (2006) regarding the impact of UGB on land values is supported by Ball, et al. (2014), who did a study to measure the impact of Urban Growth Boundary (UGB). They examined the implementation of UGB policy in Melbourne, which was adopted in 2003. This UGB limits the development outside urban areas only for an agricultural activity, while gives a big chance for the development inside the urban boundary. This UGB could be reviewed and revised, but it is not the previous similar policy, which only needs agreement from regional government to change the boundary. Under the new regulation, any change into urban boundary should be agreed by the national government.
Impact of Land Use Regulation on Land Values
11

At first Ball, et al. compare land values fluctuation since 1996-2008. Quarterly data of the average land values in both urban and non-urban areas are compared. It is obvious that after the implementation of the urban boundary in 2003, the land values inside the urban boundary increase drastically compared with the one outside thr urban boundary. This is in line with theory proposed by Brueckner when comparing land values inside and outside urban boundaries.
In order to control other factors that may affect land values, Ball, et al. also make a statistical model. To figure out the impact of UGB into land values the statistical model used an interaction dummy variable. This unique variable is resulted from the interaction between dummy variables which indicates location of a plot whether it is inside or outside the urban boundary and the one that indicates the time of transaction whether a plot was sold before or after the implementation of the new UGB. This binary variable will have value of one if a plot is located inside the urban boundary and was sold after the commencement of the new regulation.
The statistical modelling also draws the same conclusion: the implementation of UGB gives significant effect into land values. This is claimed by some experts in Melbourne as the causal factor for inelasticity in the housing price in the studied area. This regulation also made land owners and farmers who own lands inside urban boundaries overvalue their land, causing them to see it as a “liquid-gold” due to its potentiality for future urban development.
On the other hand, another quantitative measurement to the impact of land use regulation on land price was conducted by Cho, Poudyal, et al. (2008) draws a different conclusion. The researchers were doing a case study in Knoxville, USA to see the impact of UGB policy in different sub-markets within the case study area. A statistical model is used to examine the impact of UGB on several different sub-markets. Some variables were used since UGB is not the only factor that may determine land values. Those variables include the distance from work place, the distance from waterfront area, distance from railways, and distance from several public facilities, such as school and park.
They conclude that UGB regulation may encourage the development in several sub-markets under UGB and also in the rural urban interface area. In addition to drawing conclusion on the impact of UGB on the land values, the model shows that the impact is not significant across different sub-markets. One explanation is that because UGB is addressed to guide the land development in an area for a long period of time while the observation was conducted recently from the start of UGB commencement thus it may give insignificant effect on land values. Although the variability on the effect of UGB into land values in different sub-markets in Knoxville could be explained by the different level of enforcement, Cho, et al., stated that it is not the case. There is no difference in the enforcement across different sub-markets. Therefore, the land values increase mostly because the development pressure, which is shown through the model, gives a more significant effect than the existence of UGB. It is because in the context of study area, the regional government in Knoxville may annex lands which have higher value in order to collect higher amount of property tax. This has been highlighted by Cho, et al., as giving a pressure for the development in the area under UGB.
Measurement on the impact of land use regulation in terms of change on land use zoning regulation has ever been made by Zhou, et al (2008). Zhou, et al conducted a research to examine the impact of amendment on land use zoning in Chicago. In 1957 a new zoning was adopted, replacing the hierarchical land use zoning of 1923. The new zoning is an exclusive zoning, which is different from the previous one. In the 1923 zoning plan, residential zone was on the top of the hierarchy which did not allow any other uses than residential while manufacture zone was at the bottom which means that all higher land uses in the hierarchy, Impact of Land Use Regulation on Land Values
12

residential and commercial, exist. The 1957 zoning plan was made in order to reduce the mixed land use by eliminating non-conforming land use. Mixed use during that time was believed to be ineffective, thus reducing the economic performance of the city. This was the reason why the previous hierarchical zoning was replaced by the exclusive zoning.
Zhou, et al., examine blocks that shape the border between residential and non-residential uses according to the 1923 ordinances and those blocks remained in the same land use zone according to the 1957 ordinances. The formula or modelling was not used in this research, thus comparison was being done by comparing the land values growth between two adjacent blocks, which was zoned as a residential use and the other as a non-residential use. It used an assumption that since the new zoning plan was made in order to eliminate mixed uses, the land price in the non-residential use will increase.
By doing a mean comparison through paired T-test, Zhou, et al. show that the new zoning ordinance increases the land values in a non-residential use. During the target period, which is two years and one year after the commencement of the new zoning ordinance, it is found that the land values in the non-residential increased. There was a temporary jump of land values in non-residential use during the target time. It may provide strong evidence of the impact of land use regulation change on land values.
2.2.2. Impact of stringency of regulation enforcement on land values Another effort to measure the impact of land use regulation on land price has been made by considering the stringency of land use regulation itself. A lot of case studies regarding this issue have been done mostly in American cities. Kok, et al. (2014) conducted a research in San Francisco Bay metropolitan area. The researchers try to examine the impact of land use regulation within a greater scope which is a metropolitan area rather than in a single city. The housing price within San Francisco Bay increases significantly compared with another metropolitan area in USA at least before the recent collapse of USA housing market. Since the land use regulation varies across cities and state governments, the researcher tries to examine the impact of that various stringency of urban land use regulation on land price at the intra-Metropolitan Statistical Area (MSA’s).
Using a bulk set of data, the researcher may conclude that the effect of stringency on land use regulation have a positive relationship with the price of vacant land in the San Francisco Bay Area. As the final conclusion, Kok, et al. concludes that the number of reviews and approval which is needed before the municipality issues a building permit or zoning change may contribute to higher land price (Kok, Monkkonen, et al., 2014, pp. 146).
As the above research may provide a proof that stringency of the land use regulation may increase land values, the research conducted by Ihlanfeldt (2007) yields different result. By using the index of restrictiveness to measure stringency of land use regulation among regions and treating it as endogenous variables in the calculation, he considers the variation of land use regulation that may affect land price. It is different from the research done by Kok, et al. (2014) who treat stringency of regulation as exogenous to land prices variable.
Several variables are used in the statistical modelling, which are Regulation Restrictiveness Index (R), proportion of adults possessing a college degree, the proportion of residents over the age of 55, the proportion of white, the proportion of black, the proportion of households who own their homes, and the average household. In order to measure Regulation Restrictiveness Index, it takes into account variety on land use regulation applied within a county, which may consist of combination among these regulations:
Impact of Land Use Regulation on Land Values
13

1. Farm preservation policies (5.2% jurisdictions in the case study area apply this regulation)
2. Development impact fees (55.4%)
3. Large lot zoning (16%)
4. Open space zoning (19.6)
5. Population/ building caps (5.5%)
6. Environmental preservation zoning (35.5%)
7. Provision of public facilities by developers/ development exactions (33.6%)
8. Urban service boundary (17.1%)
9. Annual limit on building permits (69.4%)
10. Moratorium on growth (8.9%)
11. Time required to review residential projects increasing (11.3%)
12. Environment impact assessment required for small projects (12.2%)
13. Zero lot line housing prohibited (72.5%)
Ihlanfeldt shows that by using regression analysis, impact of Restrictiveness Index is more significant if it is treated as endogenous rather than exogenous (Ihlanfeldt, 2007, pp. 433-434). Increase of stringency on land use regulation, which is indicated by restrictiveness index, may increase house prices while it reduces land price. Stringency on land use regulation may increase the house price because more restrictive regulation will impose a higher cost for developer than increase the house price directly (Ihlanfeldt, 2007).
Since both researches use a different setting and different variable to examine the impact of land use regulation on land price, it is normal that both yield different results. There are two factors that may distinguish both results, namely the setting of case study area and combination of land use regulation being examined. As stated by Kok et al. (2014), the research done by Ihlanfeldt took place in Florida, where the relatively close location for substitution was available. Land regulation may bring more impact on a jurisdiction which does not have a relatively close substitutable area. On the other hand, the way of researcher treat land use regulation itself may produce various results. Kok et al. are limiting the term of land use regulation into a more specific type of regulation while Ihlanfeldt translate the variation on land use regulation into Restrictiveness Index which may give solution to the difficulties in defining the various concepts of land use regulation mentioned by Jaeger (2013). Those two things once again imply that location where the land use regulation is applicable and type of regulation will determine the result. Whether the land use regulation gives a significant effect on land and property values or not will really depend on the setting of the land use regulation.
2.3. Land market and land regulation in developing countries Most literature which attempts to see the connection between land use regulation and land values has a Western setting. However, when it comes to the debates about the impact of land use regulation on land values for developing countries, especially in Indonesia, problem of inadequacy of relevant literatures appear. This is according to Monkkonen (2013), due to the lack of available data on land values. If in many cases, such as has been demonstrated by several researchers highlighted in this chapter, database of land and property value could be openly accessed, or at least in the case of Du and Mulley (2007) and Efthymiou and Antoniou Impact of Land Use Regulation on Land Values
14

(2013) the data on the asking price of property is available, in Indonesia this kind of data is not openly available. There is a lack of international literature about the dynamics of land markets in Indonesia. On the other hand, only a few international literatures about land markets and land regulations in Indonesia will be highlighted here. This literature review about condition of land market and enforcement of land regulation in Indonesia will help readers to understand the context of this study.
Both Struyk, et al (1990) and Monkkonen (2013) highlighted the condition of land market in Indonesia as being dominated by informal markets. The same condition is also highlighted by Sivam (2002) when discussing the condition of land markets in India. Land and housing are often acquired from informal markets rather than relying on the formal supply by the government (Monkkonen, 2013). Monkkonen demonstrated that land markets in Indonesia are typical with the one in other developing countries (Monkkonen, 2013, pp. 255-256). It is characterized by the domination of informal-markets for supplying lands, the gap between definitive land use plans or master plan since they are only a duplication of the Western concept, and the increasing value of land not as a result of economic mechanism but more because of the high cost on administrative process (Sivam, 2002).
In the case of providing land, i.e. land for housing in Indonesia, it is common that developers buy the land not directly from the original land owner (Struyk, Hoffman, et al., 1990). The original land owners inherit their possession from their ancestors or relatives, in some cases have sold their land to a second buyer. The second buyer is usually not a land developer. They often buy the land from its original owner for the speculative purpose, by expecting potential development in the area where the plot is located. This speculative actions may explain why the land price increases drastically unexpectedly for urban activities.
Struyk, et.al. (1990) also underlined the role of an actor namely a land broker, or in the native language is often called as “calo tanah”. Land broker is an intermediary actor who connects sellers and buyers in land markets. The presence of land brokers may add complexities, thus increasing the cost of transaction. This fact is also mentioned by Monkkonen that despite being explicitly mentioned as the “unofficial cost”, it makes the transaction cost of lands sometimes become more expensive than the land price itself (Monkkonen, 2013, pp. 260-261).
The land broker acts on behalf of both sellers and buyers. They have an important role for finding lands which could be developed by developers. On the other hand, in some cases where the land conversion and development happens rapidly, the land owner often lose their trust in the developers or investors, causing them to trust in the land broker to make a deal with the buyer. The reason behind their trust in the land broker is that by relying on land brokers to negotiate with the buyers they tend to have a better deal than if the land owners negotiate with the buyers by themselves. It is also important to underline that the land brokers often have a strong working relationship with regional officials, who may give them information regarding the future land use plan and proposed development projects in the future.
Several literatures tend to be more descriptive than utilizing statistical modelling to measure the impact of urban land use regulation on land values. An important contribution to this issue in the developing country has been made by Monkkonen (2013). He mentioned that Indonesia has a specific case, which is somehow identically similar with cases in several developing countries, where the impact of stringency of land use regulation on land price may deviate from the common practice. As one of countries with the strictest land use regulation, Indonesia “provides counter example to the theoretical predictions of standard economic theory” (Monkkonen, 2013). Several factors such as the dynamics of urban land markets and, especially, lack of law enforcement may result in a different conclusion about land use regulation impact on land price. Impact of Land Use Regulation on Land Values
15

In the case of India, as it was presented by Sivam, land regulation enacted by the government has increased land values in general, but in a different way from what is expected by the general theory (Sivam, 2002, pp. 528-529). Land regulation that limited the supply of land, thus creating land values uplift, happened because of the government’s inability in implementing this regulation. Any intention to enact a land banking programme, whose purpose is to reduce potentiality of speculation in land markets and to make lands available for the poor, has frozen up land supplies, thus making land values increase and not affordable for the poor.
Ineffective land administration system has been highlighted by Sivam (2002, pp. 528) as the main factor causing land values uplift due to limitation on the supply of land. This characteristic of land administration system is also highlighted by Monkkonen when discussing the land market in Indonesia. Land administration system often takes a long time, hence adding more cost to the development. Thirkell (1996) also underlined this problem when talking about informal land market in Cebu, Phillipines. Land development takes a long process and involves a high administration cost, making middle and low income households prefer to buy land and housing from informal markets.
Under the condition where the enforcement of regulation is low, the effect of land use regulation onland values becomes uncertain. As demonstrated by Adebayo (2009), the demand and supply in land markets becomes the main factor in determining the property values rather than the land use regulation. Adebayo used Nigeria as an example of how ineffective enforcement of land regulation will have insignificant effect on land values. The existence of town planning is inadequate when it faces the development pressure that happens in Lagos. At the end of his research, Adebayo highlighted the need for regulation enforcement, something that is repeatedly underlined by other researchers when talking about land use regulation in developing countries.
2.4.Conceptual Framework
Figure 3. Conceptual framework Based on the literatures, there are several factors that may affect land values. Those factors are the physical characteristics, location, service, demographic characteristics where it is located, and the effect of land use regulation . The main focus of this research is to examine the impact of the implementation of new spatial plan RTRW Kabupaten Sleman 2011-2031 on land values in Ngaglik, Sleman. However, conclusion will be made by considering other factors that may influence land values in the case study area.
Impact of Land Use Regulation on Land Values
16

Chapter 3: Research Design and Methods
3.1. Definition 1.Land Use Regulation Land use regulation comes in various terms (Jaeger, 2013). It could be land use zoning as it was examined by Zhou, et.al (2008), Urban Growth Boundary (UGB), FAR restriction, cost-increasing regulation, and bureaucratic control (Brueckner, J. K., 2006). Since it may vary by definition, land use regulation to be examined is the new spatial plan of Sleman Regency (RTRW Kabupaten Sleman) 2011-2031. The new spatial plan issued by local government in Sleman stipulates:
1. Borders between urban and non-urban areas. This new spatial plan has stipulated fourteen villages in six districts as parts of the urban area. This is mentioned in article number 7 point (2) within the RTRW Kabupaten Sleman 2011-2031. In the urban area high intensity of economic activity, housing, and larger scale of social activity is permitted while those activities are limited in the area outside the designated urban area. This type of activity is stipulated under article number 52 point (2) and number 65 point (2) within the RTRW Kabupaten Sleman 2011-2031.
2. Focus on the development of urban infrastructure, such as sewerage and pipes for drinking water in the area designated as urban are. This intention is stipulated under article number 25 points 1-5 in the RTRW Kabupaten Sleman 2011-2031 document.
This will bring some consequences regarding the type of activity to be done and type of amenity to be provided within the area. Based on classification made by Brueckner (2006), this new spatial plan is a kind of growth management control regulation, which intends to guide the future development by indicating the type and intensity of activity to be permitted within a certain period of time.
The effect of the implementation of RTRW Kabupaten Sleman 2011-2031 on land values is explained by three indicators, one of which is an interaction variable used in the statistical modelling between the other two variables. This interaction variable is a result of time of transaction, whether it was before or after the commencement of the new land use plan, multiplied by the location of plot, whether it is located inside or outside urban areas. This variable will have value of one (1) if it was sold after the commencement of new land use plan and it is located inside the designated urban areas. The use of those dummy variables follows what has been demonstrated by Ball, et al. (2014) when they examined effects of UGB in Melbourne.
2.Physical Characteristics Physical characteristics are defined as the attributes of the plot of land under the transaction that may determine its price. The valuation using the Hedonic Price Modelling (HPM) uses this characteristic to determine land values (Des Rosiers and Thériault, 2009). Plot size is the common indicator to measure the physical characteristics of lands, which in the model made by Chichoine (1981) is said to be the significant factor in determining land price, being considered in this research. Another characteristic is its land use. This variable is used by Shonkwiler and Reynolds (1986) and also Chichoine (1981), in which the former researchers did valuation to the potential development of plot under transaction. To measure land use when transaction occurs, this research uses the status based on the land certificates when the plot was under transaction.
Impact of Land Use Regulation on Land Values
17

3.Location Factor Location is defined as the relative location of a site explained by Alexander which “expresses the interdependence between activities and land uses that give a particular piece of land its value”. In many literatures, this factor is always considered as the determining factor of land price. In the classic literature, such as Alonso (1964), the distance from centres of activity is the main determinant of urban land values, especially when it comes to individual rent-bid curves. The distance from centres of social and economic activity, such as the distance from the nearby city and commercial centre is used by Chichoine (1981) while in Glaeser and Ward (2009), the distance from university campuses is also considered in building the model. In order to capture the location factor which could affect land values, two indicators are used, namely the distance from Yogyakarta City Centre and the status of road which shares the borders with the plot under transaction. Because the case study area is categorized as the urban expansion area of Yogyakarta City, the distance from Yogyakarta City Centre is used to indicate location factor of a plot under transaction. Moreover, the indicator “status of road” is used to indicate where the plot is located, whether it is in a main road or in the neighbourhood road.
4.Demographic Characteristics Demographic characteristic is a variable to measure what is so called by Fainstein (2012)(2012) as prestige of an area. To measure this variable, the population density and percentage of population with university degrees is used. As stated by Alonso (1964), urban growth resulted in a paradox, where high income people could afford to live in a low-density neighbourhood but is located far from city centre while low income people should live in a high density neighbourhood in order to get access to the city centre. The same phenomenon also appears in the case study area where middle and low income population should live in a what so called as “kampong”, neighbourhood with high density population while the high income could enjoy their life in a low density neighbourhood surrounded by park and abundant public facilities. Because of the aforementioned reasons, population density is used to measure the demographic characteristics of the area where the land under transaction is located. Another indicator is the percentage of the population with university degrees. Previous studies used the percentage of population based on race as an indicator of demographic characteristics, as demonstrated by Kok, et al. (2014). This indicator was used because there is a tendency of racial segregation in several cities, such as in the USA. An area where black people dominate the population tends to have lower prestige than the contrary (Kok,et al., 2014). Because spatial segregation based on ethnicity or race is not a common phenomenon in the case study area, the percentage of population with university degree is used to reflect the demographic characteristics where the plot under transaction is located. This variable was used by Chichoine (1981) and shows that this factor may determine land values thus the researcher also considers this indicator to build a statistical model.
5.Service Availability Factors Alexander (2014) said that the availability of service is the determinant of the relative location of a plot. In Chicoine (1981) service availability factor is measured by the distance from public facilities, such as hospital and school, availability of sewerage, availability of road, and access to highway. In this research several indicators are used to measure service availability factor. This variable consists of the distance from nearby markets, the distance from nearby elementary schools, the distance from bus terminals, and the quality of roads sharing the borders with the plot as the indicators. Those indicators are used to measure the accessibility of the plot under transaction to several types of public facilities. The distance from markets indicator measures the accessibility of a plot to the traditional markets which become an important place for people to buy their daily needs. The distance from nearby elementary Impact of Land Use Regulation on Land Values
18

schools measures the accessibility to the basic education facilities. Finally, the quality of roads sharing the borders with the plot under transaction reflects whether the plot under transaction is reachable by vehicles. An asphalted road will make a plot more accessible because both carriage and passenger vehicle could easily access the plot which share the border with an asphalted road. Research by Smith and Gihring (2006) and Debrezion, et.al. (2007), and the current research by Efthymiou and Antoniou (2013) and Du and Mulley (2007) mention that the distance to the public transportation node is also an important determinant of land values, this research uses the distance from bus terminals as an indicator. This indicator is chosen because bus is the only public transportation available in the case study area.
3.2.Operationalization Main Research Question: Into what extent local government action in term of new land use plan affect the land value in study area during 2008-2015? Research Sub-Question
Concept Variable Indicator Value of Indicator
What is the land value difference before and after the implementation of RTRW Kabupaten Sleman 2011-2031?
Land Value Land Price Land asking price per square meter
Land asking price per square meter in Rupiah (Rp.) currency
How significant does the implementation of RTRW Kabupaten Sleman 2011-2031 affect land value in Ngaglik District?
Factors Affecting Land Value
Physical Characteristics
Size of plot being transacted
Size of plot denoted in square meter (m2)
Dummy variable of Status of land as it is written in land certificate
This dummy variable will have value of one (1) if it has status of Sertifikat Hak Milik (SHM) Pekarangan, while the other will have value of 0.
Location factor Distance from Yogyakarta City Centre
Distance from Yogyakarta City Centre denoted in kilometres (km)
Dummy variable of Road Status share a side with plot under transaction
This dummy variable will have value of one (1) if a plot is located on the side of Provincial Road, while the others, which are neighbourhood road and local road will be given value 0.
Service Availability Factor
Distance from nearby elementary school
Distance to nearby elementary school both privately and publicly owned school denoted in kilometres (km)
Distance from nearby traditional market
Distance to nearby traditional market which is denoted in kilometres (km)
Distance from nearby bus terminal
Distance to nearby bus terminal denoted in kilometres (km)
Dummy variable for road quality
Dummy variable of road quality, with asphalted road is given value 1 while the others will have value 0
Demographic Factor
Population density Population density in the area where land under transaction is located, denoted in people per hectares (people/ha)
Percent population with university degree
Percent population with university degree in area where the plot is located
Land Use Regulation
Dummy variable indicates plot
Denoted as dummy variable, with plot located inside urban
Impact of Land Use Regulation on Land Values
19

location based on RTRW Kabupaten Sleman 2011-2031
area is scored as 1 and outside urban area is 0
Dummy variable indicates timing of land transaction whether it was before or after the enactment of RTRW Kabupaten Sleman 2011-2031
Denoted as dummy variable, with plot was being under transaction after 2012 is scored as 1 and before is 0
Dummy variable as interaction between dummy indicates location of the plot and dummy year
Denoted as dummy variable, with plot which was under transaction after the enactment of New Spatial Plan and located inside designated urban boundary has value of 1 and the other is 0.
Table 2. Operationalization Source: Made by the author (2016)
3.3.Research Strategy To conduct this research, co-variant case study is being used. Case study itself is defined as “a research strategy that is being used to gain a profound and full insight into one or several objects or processes that are confined in time and space” (Verschuren and Doorewaard, 2010, pg. 178). Yin (1981) emphasizes the importance of context on doing a case study. This research strategy is used to examine a phenomenon within its context, especially when it is not possible to give a boundary between phenomena and its context.
Actually it would produce more robust measurement if the use of econometric model with large existing data set is used. The problem is the database containing the information needed to build a model is not available in Indonesia. National Land Administration Office (BPN) has just built a database of land transaction for a year and not all information needed could be obtained from that database.
This research contains a large number of research unit, which is land price resulting from a land transaction. Based on the conceptual framework, there are several independent variables that may influence the land price. Although this research is conducted to analyse the impact of new spatial plan on land price, the fact that land price is determined by many factors could not be neglected. Moreover, the independent variable that determines the output of the dependent variable, i.e. land price, could not be separated from the context.
Based on the aforementioned reason, this research is conducted using the co-variant case study with comparison over space and over time. As stated by Blatter and Blumme (2008, pp. 320), this type of case study would enable the researcher to draw logical conclusion about the existence of the effect of independent variable to dependent variable by doing data collection about the value of either independent and dependent variable. The sample area for the case study is selected using an approach which is called by Gerring in Blatter and Blumme (2008) as pathway-case approach. Under this approach, a case study sample is selected based on deductive hypothesis from the theory. This type of case study is useful to confirm the theory rather than to prove whether the theory is correct or not. The case study area is selected based on the model built by Brueckner (2006), theory from Alterman (2012) and Alexander (2014). Land use regulation is a factor that could determine land values according to Alexander (2014), and based on the argument by Alterman (2012) and Brueckner (2006), the area which is given advantages in terms of future possibility for development and urban infrastructure availability will experience a windfall, which will increase land values. Ngaglik district provides an
Impact of Land Use Regulation on Land Values
20

appropriate case to be investigated, where there are some parts of it were given treatment as delineated urban area while some parts of it are not. This case enables the researcher to conduct a co-variant case study by comparing the land values in the area with and without treatment in the time before and after the enactment of the new spatial plan. Therefore, the researcher selected Ngaglik district as case study area for this research.
3.4.Validity and Reliability The main challenge into this kind of research is its external validity (Verschuren and Doorewaard, 2010). Since the research is conducted in a little scope, the possible generalisation is the generalisation of causal relationship within the case being studied. A case study will yield more accurate but less generalized result (Yin, 1981). In order to increase the external validity, the researcher has conducted a cross-case analysis to draw a conclusion. A single case study approach may not be adequate to explain the causal relationship between variables being observed. By doing a cross-case analysis, the causal relationship being observed can be generalised among the cases being studied.
Because this research used questionnaire as data collection instrument, one aspect of reliability, which is accuracy, could also be challenged. It is necessary to ensure that all measurement used in this research is collected accurately through the questionnaire. This issue is also related with the challenge into the internal validity aspect of this research, which, according to Thiel (2014, pp. 49), is described as the extent to which the researcher has been able to measure the effect intended to be measured. To cope with those problems, the researcher has carefully made the operationalization based on the previous research. All variables and indicators used in this research has theoretical basis in order to guarantee the internal validity of this research.
To achieve the high level of accuracy, the researcher used official data regarding land values from BPN Sleman for triangulation purpose. It should be acknowledged by the researcher that the data about land transaction collected through the questionnaire has lesser accuracy than if it has its resource from the official data. However, under the condition where this kind of data is not available, the questionnaire method for data collection is the best method to collect data about land transaction in the case study area. However, the measurement of the distance to several public facilities has been conducted by utilizing GIS Software. It ensures that the measurement using this method is accurate.
3.5.Data Collection Method According to research proposal proposed before the researcher conducted a field work, data to be collected for the research purpose would rely on secondary qualitative and quantitative data, and also the primary data from the secondary resource. The researcher tried to obtain data of land transaction from regional governments. First, the researcher visited Land Administration Office (Badan Pertanahan Nasional/ BPN) Kabupaten Sleman. According to the information from Ibu Nurul (Head of Land Regulation and Management Division of BPN), BPN does not have such kind of data. The only available data is the information about Zona Nilai Tanah (Land values zone) used to verify land transactions. For further detailed information, she suggested to go to the Regional Revenue Office (Dinas Pendapatan Daerah/ Dispenda) in order to obtain this data. However, when the researcher went to Dispenda the result was not as it was expected. According to the Head of Governance Division of Dispenda, data about land transactions was not open for public. It is protected under the National Law number28/2009 point 172 which mentions that data about land transactions can only be used by parties involved
Impact of Land Use Regulation on Land Values
21

in land transactions, the regional government, the National Audit Board (Badan Pemeriksa Keuangan/ BPK) and National Committee for Corruption Eradication (Komisi Pemberantasan Korupsi/ KPK). It could not be accessed by public even though it is for the research purpose.
Because the data of land transactions is not available from the government office, the researcher conducted a field survey with questionnaires as data collection method. This means that the researcher has shifted the data collection method from secondary data collection method into primary data collection method. Information about land transactions that occurred from 2008 to 2015 was collected from several land and property agencies, some of which are informal. Based on the information from those land and property agencies, the researcher did a field survey in order to record characteristics of land being transacted. For this purpose, the researcher used questionnaires and Global Positioning System (GPS) Garmin e-trex as the tool. There are fourteen land and property agencies involved for this field survey, half of which has a well-recorded data about land transactions. Under the condition that the land and property agencies did not have an adequate record about land transaction data, triangulation method was being used by asking regional leader in the area for knowing average transaction price that happened. All data obtained from field survey has been triangulated using data of land values zone from National Land Administration Office (BPN) Sleman Regency.
To avoid bias, the researcher tried to spread out the field survey locations. The researcher surveyed land transactions by covering the whole area of Ngaglik district as the case study area. It means that the field survey was being conducted in the whole area in Ngaglik district instead of focusing on a few parts of case study area. A problem occurred when the researcher would like to do a survey in Donoharjo village. The researcher could not get any contact with the main land broker in this area, caused the researcher to contact the government officer at the village office. The problem is that land transactions in this village according to the Head of Community Representative of Donoharjo Village mostly involves community-owned lands. This is a serious matter and is considered as a sensitive case within the community itself. It has caused the data collection to yield an unexpected result.
Questionnaires being used for the survey consists of several questions on the transaction, such as the time and price of the transactions, the physical characteristic data, such as plot size and land use at the transaction time, availability of infrastructure and amenity when transaction occurred, and the location of land being transacted, which is recorded using the GPS tool. Recording using GPS tool provides the researcher information about geographic coordinate of each plot being surveyed. This coordinate is projected in WGS Universal Transverse Mercator (UTM) Zone 49-s. The researcher transferred data from GPS into GIS Software, which enables the researcher to do a spatial analysis to determine the distance of each plot to its nearby public facilities and amenities. Recording the data from the GPS also gives an advantage, which enables the researcher to triangulate information gathered from the field survey about the availability of infrastructure and land use when the land was transacted by matching it with satellite images available in the Google Earth application.
In order to get a general picture of land values fluctuation within the case study area, the researcher collected information of the land being offered for transaction from regional newspaper in Sleman. The researcher compared several notable newspapers in Sleman, namely Tribun Jogja, Harian Jogja, and Kedaulatan Rakyat. Among those newspapers, Tribun Jogja and Kedaulatan Rakyat provide abundant information about lands being offered for transaction in Ngaglik. However, Tribun Jogja is a quite new regional newspaper, published in 2011. Therefore, it could not provide enough information about land price in the year before 2011. For this reason, the researcher chose to collect information from Kedaulatan Rakyat. The researcher could get access to the archive of Kedaulatan Rakyat from 2008-2015 in the
Impact of Land Use Regulation on Land Values
22

Provincial Public Library. The information being collected deals with the lands being offered for transactions on Saturday newspapers during this period of time. The reason for choosing the Saturday edition is because it is the favourable time for land owners and land property agencies to advertise their land. According to the information from the management of Kedaulatan Rakyat, land and property agencies usually use an extra bonus given by the management to advertise on the Saturday edition. Consequently, the Saturday edition is always full of ads on lands being advertised during the week. Using this kind of information, the difficulties appear because sometimes a plot of land could be advertised more than once. Because of that, the researcher treated the data by eliminating a plot of land which was being advertised more than once.
In order to get a complete picture of case study area, the researcher used secondary data collection method. This kind of data consists of characteristics of the case study area, such as its geographic characteristics, demographic characteristics, and economic characteristics. The researcher collected this information from the National Statistics Bureau (BPS) Office. This office has data named “Kecamatan Ngaglik Dalam Angka (Ngaglik Sub-district in Figures)” from 2008-2015. The researcher could easily get access into this kind of data in the BPS Archive Office. Another secondary data resource also consists of reports from previous study and reports from the government and planning authority about the characteristic of the case study area.
3.6.Data Analysis Method There are two main parts of data analysis in this research. First, the researcher will examine land values fluctuation from 2009-2015. This fluctuation is depicted by a continuous diagram to figure out land values fluctuation during that time visually. In order to draw a more valid conclusion, the researcher performs a statistical test using Mann-Whitney test. This test is useful when available data is not normally distributed and does not have identical variances. In the second part, the researcher used statistical modelling using the Ordinary Least Square (OLS) Multiple Linear Regression in order to examine the significance of new land use regulation in influencing land values in the case study area. All aforementioned statistic tests are performed using IBM SPSS Software. All the findings resulted from the inferential statistical analysis will be triangulated by the only available official data about land values, which is data about land values zone by BPN.
Impact of Land Use Regulation on Land Values
23

Chapter 4: Research Findings
4.1. Spatial Plan of Sleman Regency (RTRW Sleman) 2011-2031 Indonesia adopted a hierarchical system of spatial planning based on the National Law number 26/2007. This law stipulates the level of planning, from the National Spatial Plan to Regency Spatial Plan. Every level of spatial plan should refer to the spatial plan at the higher level. Even though the law mentions that every level of regional government is given authority to formulate its own spatial plan, it should be approved by head of government at the higher hierarchical structure. Spatial plan at province level for instance should get an approval from the central government, while the spatial plan at Regency Level should be approved by the head of regional government at the provincial level.
Figure 4 Hierarchy of Spatial Plan in Indonesia Source: National Law 26/2007
In general, there are two types of spatial plan stipulated in the National Law 26/2007. The first one is the general spatial plan and the second one is the detailed spatial plan. Every level of government has an obligation to formulate the general spatial plan. In case the general spatial plan could not be operationalized for implementation, the local government should formulate a detailed spatial plan. The level of detail in each level of spatial plan is regulated by the national government through the national government regulation document.
The Spatial plan of Sleman Regency (Rencana Tata Ruang Wilayah Kabupaten Sleman) 2011-2031, which hereinafter is mentioned as the RTRW Sleman 2011-2031, is a spatial plan at the regency level. The new spatial plan is enacted based on the Regency Regulation number 12/2012. This new spatial plan replaced the outdated spatial plan which was used by regional government in Sleman since 1994. This outdated spatial plan had been expired since 2004 which means that Sleman has ever experienced the absent of valid spatial plan for around eight years. The outdated spatial plan was unable to deal with current situation in Sleman Regency, which is characterized by high intensity of urban activity and rapid increase of urban growth.
As it is regulated by National Law, RTRW Sleman 2011-2031 was formulated based on National Spatial Plan (RTRW Nasional) and Provincial Spatial Plan (RTRW Provinsi). It is categorized as general spatial plan which is formulated and enacted in order to guide and manage development in Sleman Regency. This new spatial plan was formulated to achieve Impact of Land Use Regulation on Land Values
24

several objectives, which are to manage growth in Sleman, maintain the availability of food in the future, resilient from natural disaster, and create a more competitive urban area within the region.
In general, RTRW Sleman 2011-2031 consists of three major parts, in which each part stipulates strategy and policy to deal with local issues faced by local government in Sleman. The first one is local government intention to manage urban growth in the region. The problem of uncontrolled development which jeopardizes productive agricultural activity and ecological balance for the whole province of Daerah Istimewa Yogyakarta has drawn serious attention of local government in Sleman to deal with this problem. Secondly, it stipulates plan for public infrastructure development. As it has ever been criticized by Ministry of Public Works in 2003, urban area in Yogyakarta, especially in Sleman, has grown without any preparation for urban infrastructure. Therefore, infrastructure development, mostly in urban area, becomes priority for local government in Sleman. Third issue to be addressed is due to resilience against natural disaster, which in the case of Sleman Regency is natural disaster caused by Merapi Volcano Eruption. The massive eruption of Merapi Volcano in 2010 has caused serious damage in several parts of Sleman Regency. In order to anticipate the same thing will be happened in the future, local government also put concern on preventive action to deal with the problem caused by natural disaster. The general view of the content of RTRW Sleman 2011-2031 document could be seen at figure 5 which will be explained into detail in the following section.
Figure 5 Content of RTRW Sleman 2011-2031 Source: Diagram by the Author based on RTRW Sleman 2011-2031 document
1.Growth Management Control As stated by Sutomo (2011) and Giyarsih (2010), the path of urban sprawl could be found in Sleman Regency. As a result of population and economic growth, the core city of Yogyakarta has expanded to its periphery. Giyarsih (2010) underlined the role of education and cultural activities which increases from time to time as the generator of the physical growth in Yogyakarta urban area. The increasing number students studying in the Higher Education
Impact of Land Use Regulation on Land Values
25
institutions in Yogyakarta has been followed by the increasing number of student housings, mostly in the areas around notable Universities which are located in the south part of Sleman Regency. Not only student housings, small and medium scale economic activities also grew alongside the rapid development of housings.
In several parts of Sleman, this growing economic activity which is also followed by the physical growth is said to be jeopardizing productive agricultural activities and ecological balance for the whole area of the province. This is because the urban growth sprawled and leap-frogged everywhere, leaving some agricultural lands unproductive. This leads to the problem of ineffective land use in Sleman Regency.
Since 2001, the south part of Sleman has experienced rapid agricultural land conversion. As mentioned by Harini, et al (2012), from 1992-2009, agricultural land conversion happened rapidly in several districts in Sleman which are located next to Yogyakarta city centre. During 1992-2001, the conversion of productive agricultural land happened mostly in districts which were contiguous with Yogyakarta city administrative area, during the period of 2001-2009 this phenomenon happened in the area which did not share borders with Yogyakarta city administrative area.
In the light of this problem, the local government in Sleman is concerned to manage and guide physical growth in Sleman by formulating the RTRW Sleman 2011-2031. Before this new spatial plan was introduced, the local government at the provincial level had already been concerned with this issue. Within the Provincial Spatial Plan document (Rencana Tata Ruang Wilayah Provinsi RTRWP) it was already stipulated that the intention to contain the urban growth in a certain area, which is called Aglomerasi Perkotaan Yogyakarta (Yogyakarta Urban Agglomeration Area/ APY). Local government at the provincial level has stipulated the concept of urban growth boundary in order to contain the development inside APY area in the RTRWP document. Local government in Sleman Regency then operationalizes the spatial plan at the provincial level by creating a clear border between urban and rural areas in the RTRW Sleman 2011-2031.
As stipulated in article number 7 point 2 in the RTRW Sleman 2011-2031, fourteen villages are delineated as an urban area which is mentioned as Kawasan Perkotaan Yogyakarta (Yogyakarta Urban Area). It consists of the whole part of Depok district, and some villages in Mlati, Ngaglik, Ngemplak, Godean, and Gamping districts. This urban area is defined in the RTRW Sleman 2011-2031 document as the area where the main economic activity is not agricultural, as characterized by urban housings, and the area for economic and commercial agglomeration. On the other hand, the rural area is defined as an area where agricultural activity becomes the main economic activity, in which social and economic activities at local scale are allowed. The designated urban area according to the RTRW Sleman 2011-2031 could be seen in figure 6 as follows.
Impact of Land Use Regulation on Land Values
26
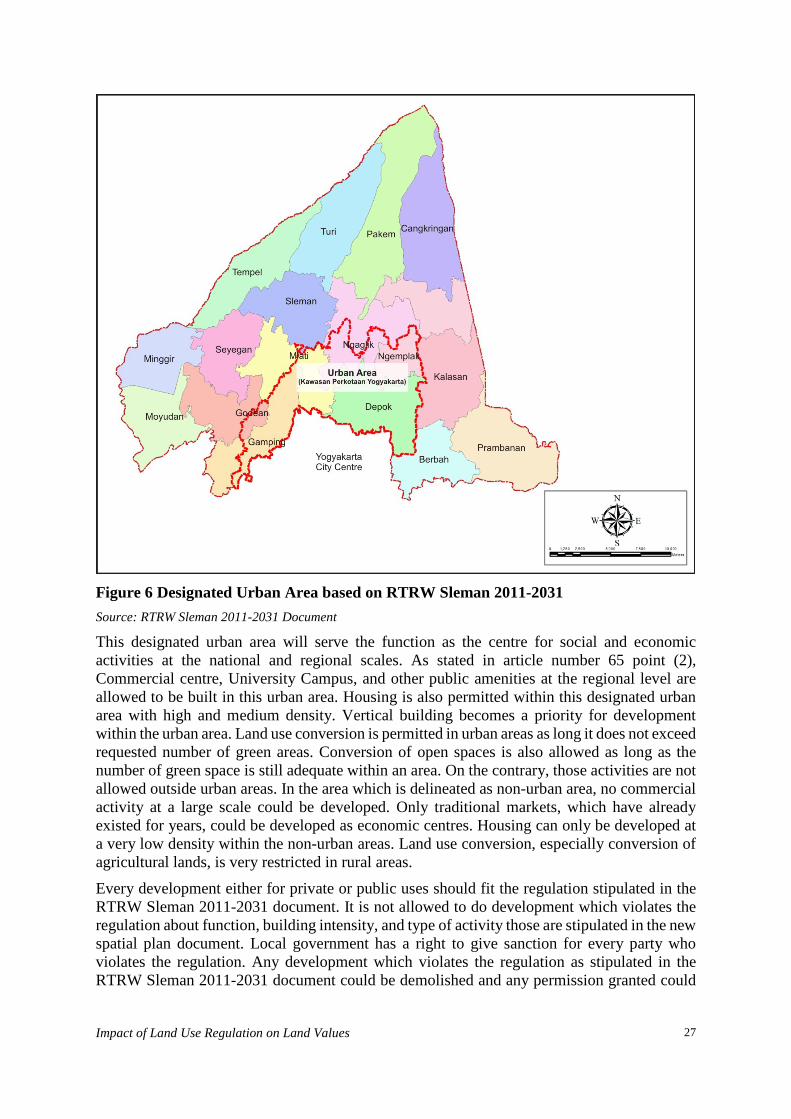
Figure 6 Designated Urban Area based on RTRW Sleman 2011-2031 Source: RTRW Sleman 2011-2031 Document
This designated urban area will serve the function as the centre for social and economic activities at the national and regional scales. As stated in article number 65 point (2), Commercial centre, University Campus, and other public amenities at the regional level are allowed to be built in this urban area. Housing is also permitted within this designated urban area with high and medium density. Vertical building becomes a priority for development within the urban area. Land use conversion is permitted in urban areas as long it does not exceed requested number of green areas. Conversion of open spaces is also allowed as long as the number of green space is still adequate within an area. On the contrary, those activities are not allowed outside urban areas. In the area which is delineated as non-urban area, no commercial activity at a large scale could be developed. Only traditional markets, which have already existed for years, could be developed as economic centres. Housing can only be developed at a very low density within the non-urban areas. Land use conversion, especially conversion of agricultural lands, is very restricted in rural areas.
Every development either for private or public uses should fit the regulation stipulated in the RTRW Sleman 2011-2031 document. It is not allowed to do development which violates the regulation about function, building intensity, and type of activity those are stipulated in the new spatial plan document. Local government has a right to give sanction for every party who violates the regulation. Any development which violates the regulation as stipulated in the RTRW Sleman 2011-2031 document could be demolished and any permission granted could
Impact of Land Use Regulation on Land Values
27

be revoked. This regulation about sanctions for violating the spatial plan is stipulated in article number 99 in the RTRW Sleman 2011-2031 document.
2.Urban Infrastructure Development In 2003, the Ministry of Public Works has ever underlined the problem of urban infrastructure in the whole Urban Agglomeration Area of Yogyakarta. The physical growth that has expanded into Sleman Regency happened without any preparation for urban infrastructure development. The regional government in Sleman was pointed out by the Ministry of Public Works as not prepared enough to manage urban growth in Sleman. This has caused the problem of water shortage, sanitary system, and integrated waste management. Another problem pointed out by the Ministry of Public Works was traffic load in several main roads connecting Sleman and Yogyakarta City Centres. As a consequence of the inadequate number of public transportation infrastructure, traffic jam often happens in those main roads, such as the main road connecting Yogyakarta City Centre with Pakem on the north side and Godean on the west side.
Facing the problem of limited urban infrastructure resulting from urban physical growth, Sleman local government laid out the plan of urban infrastructure development in the RTRW Sleman 2011-2031 document. The infrastructure development plan has been matched with the infrastructure development plan at the provincial and national levels, which include plans for new railway networks connecting Yogyakarta City Centre and Central Java Province, and also plans for new highway development.
Regarding the provision of public infrastructure, Sleman local government would like to focus on providing several essential infrastructure networks in the designated urban areas. As stipulated in article number 25, urban infrastructure such as drainage system, drinking water system, sewerage system and integrated domestic waste management system will be prioritized in the designated urban area. Around 85% of new installation for drinking water system will be put in the designated urban area, as well as the drainage and sewerage system. High intensity of activity within the designated urban area should be followed by the integrated urban drainage and sewerage system because it could not rely more on drainage and sewerage system at the household level, as it now still exists in the rural area with low density neighbourhood.
The development of transportation infrastructure is also stipulated in the RTRW Sleman 2011-2031, with integrated transportation system in the urban area and connectivity of urban areas with several regional activity centres becomes priority. The RTRW Sleman 2011-2031 stipulates the road improvement plan for several roads which have strategic value, such as the roads connecting Yogyakarta City Centres with Pulowatu and Kaliurang on the north part of Sleman Regency and roads connecting Yogyakarta City Centre with Minggir and Nanggulan on the west part of Sleman Regency.
3.Resilience from natural disaster Even though this part of RTRW Sleman 2011-2031 document does not have direct correlation with regulation about urban areas, this part will be explained briefly here. In 2010, Merapi Volcano which is located in the north part of Sleman Regency area erupted. It caused serious damages in several districts located on the north part of Sleman, such as Pakem, Cangkringan, and Turi. Due to bad evacuation plans in the past, this natural disaster caused many victims. In order to prevent the serious impacts of natural disaster in the future, the regional government in Sleman elaborates this issue in the RTRW Sleman 2011-2031. Several plans have been made in order to build resilience against natural disasters. Some existing evacuation routes will be improved. Several areas which are quite far away from the volcano will be prepared for evacuation spaces. The public activity centre in Cangkringan district, which is previously located in the endangered area has been moved to the safer areas. All those efforts are stipulated
Impact of Land Use Regulation on Land Values
28

to ensure that if the eruption happens again in the future, it will not disrupt public services, social, and economic activities in Sleman Regency, and to minimize the number of victims of natural disasters.
4.2. Description of the Case Study Area This research is conducted in Ngaglik district, one of districts in Sleman Regency which is stipulated as the part of urban areas according to the RTRW Sleman 2011-2031. Land values in this district increased significantly in the past twenty years. Compared with other districts in Sleman, the land values increase in Ngaglik is the third highest in Sleman after Depok and Mlati districts. This district provides comparable cases to be used for this research. In Mlati, urban physical growth only happens in the area which is contiguous with Yogyakarta City Centre area. In Depok, the whole area has been urbanized in the past twenty years. However, in the case of Ngaglik, even though the urbanization process happens in the whole area of this district, only half part of Ngaglik is delineated as an urban area, while the other half is delineated as a rural area. As seen in figure 7, the urban physical growth has happened in almost the whole part of Ngaglik. In Sardonoharjo and Sukoharjo areas, as seen in the map, the built area almost has the similar size with the built area in the area designated as an urban area. However, Sardonoharjo and Sukoharjo village, together with Donoharjo villages are not included in the urban area. For research purposes, these situations will be compared.
Figure 7 Map of Ngaglik District with some part delineated as Urban Area in RTRW Sleman 2011-2031 Source: Peta Rupa Bumi Indonesia (RBI) 2013 and RTRW Sleman 2011-2031 document
Impact of Land Use Regulation on Land Values
29

Ngaglik district is located on the north of Yogyakarta City Centre. It does not share borders with Yogyakarta City Centre but it shares border with Depok and Mlati districts. Ngaglik district covers 38.52 km2 area and has 96,380 inhabitants in 2014. Administratively it has six villages, namely Sariharjo, Sinduharjo, Minomartani, Sukoharjo, Sardonoharjo, and Donoharjo. It has a regional government office which is known as Kecamatan (districts) and it is led by an administrator appointed by local government at the Regency level.
Among six villages in Ngaglik District, Minomartani is the village with the highest density. It only covers 1.53 km2 of area but it has 13,845 inhabitants. This village has a high number of population density because it is the location of the National Housing Project, which was commenced in 1980s. Even though Minomartani has the highest number of population density, it has already been densely populated since the beginning of 2000s. The table below shows that the density in Minomartani villages has been growing during the past six years.
No Village 2008 2009 2010 2011 2012 2013 2014 2015
1 Sariharjo 2303 2359 2416 2467 2530 2582 2938 3073
2 Sinduharjo 2384 2449 2516 2561 2630 2690 3162 3333
3 Minomartani 9005 9072 9139 9318 9938 10053 9049 9058
4 Sardonoharjo 1698 1726 1754 1775 1816 1860 2033 2102
5 Sukoharjo 1419 1465 1512 1539 1576 1609 1787 1861
6 Donoharjo 1105 1131 1158 1207 1285 1303 1458 1535 Table 3. Population density in Ngaglik district 2009-2015 Source: Kecamatan Ngaglik dalam Angka by BPS Sleman (2009-2015)
Even though it is not as densely populated as Minomartani, Sinduharjo has been experiencing growth in population density with the rate of 5.41% increase every year. Another village with high average rate of increasing density is Donoharjo. It is located in non-urban area according to the RTRW Sleman. It faced a high increase on population density before the new land use plan was implemented. Before 2012, population density in Donoharjo was increasing higher than other village which is located within urban area. However, its density was then slowly increasing after the new land use plan was commenced in 2012.
No Village 2010 2011 2012 2013 2014 Average
1 Sariharjo 2.41% 2.12% 2.58% 2.03% 13.79% 4.59%
2 Sinduharjo 2.75% 1.79% 2.69% 2.27% 17.55% 5.41%
3 Minomartani 0.74% 1.95% 6.66% 1.16% -9.99% 0.10%
4 Sardonoharjo 1.62% 1.19% 2.32% 2.43% 9.28% 3.37%
5 Sukoharjo 3.26% 1.76% 2.39% 2.13% 11.03% 4.11%
6 Donoharjo 2.37% 4.23% 6.52% 1.36% 11.91% 5.28% Table 4. Increase rate of population density in Ngaglik 2010-2014 Source: Kecamatan Ngaglik dalam Angka by BPS Sleman (2009-2015)
As an urbanized area, Ngaglik district is also characterized by the increasing number of tertiary economic activity. Agricultural activity is not a dominant economic activity in this area. As it is shown in the figure below, the service sector becomes the major contribution of Gross Domestic Product (GDP) in Ngaglik. the contribution of sectors other than agricultural and mining increases every year. The growing economic activity in Ngaglik is also supported by data about the number of commercial buildings in this area. According to the BPS Kabupaten Sleman, the number of commercial buildings in Ngaglik has increased significantly from 2009-
Impact of Land Use Regulation on Land Values
30

2015. In 2009, there were only four commercial clusters and 479 shops, and this number increased to forty commercial clusters and 890 shops in 2015.
Figure 8. Contributor of GDP in Ngaglik 2009-2014 Source: Kecamatan Ngaglik dalam Angka by BPS Sleman (2009-2015)
There are two main roads crossing the area of Ngaglik. the first one is the main road connecting Yogyakarta City Centre and Pulowatu in the north of Sleman Regency. This main road crosses the area of Sariharjo and Donoharjo villages in Ngaglik. Pulowatu itself is located on a country-side, where people would like to spend their weekend or holiday. There are several restaurants, resorts, and amusement parks which are usually congested by visitors during the weekend. The second one is the main road connecting Yogyakarta City Centre and Kaliurang. It crosses three villages in Ngaglik, namely Sinduharjo, Sardonoharjo, and Sukoharjo. Kaliurang is a notable tourism destination in Yogyakarta where people spend their weekends and holidays. On this main road, there is also a notable university campus, i.e. Universitas Islam Indonesia (Islamic University of Indonesia). It has an enormous number of students and is considered as one of major universities in Yogyakarta Province.
4.3.Land Values Fluctuations 2009-2015 As it has been mentioned at the very beginning of this research, Sleman Regency has an active land market. Looking at the advertisement of the land transaction in the regional newspapers, it is obvious that during 2008-2015 the advertisement of land transactions in Sleman is dominated by the proportion of around 56%-68% per edition.
The advertisement of land transactions in Yogyakarta is mostly posted on Saturday edition of local newspaper “Kedaulatan Rakyat”. In this research, land values fluctuation that happened during 2009-2015 in Ngaglik district is examined to observe the change of land values in the case study area before and after the new spatial plan by regional government in Sleman was implemented.
In order to do so, the researcher collected data from the Saturday edition of the local newspapers by using 2012 (the year when the new spatial plan was formally enacted) as the mid-point, thus collecting data about land transaction advertisement three years before and after the commencement of the new land use plan. Since the data from land transaction advertisement is about the asking price, they were then adjusted before they were used in the analysis. According to previous study by Du and Mulley (2007) and Efthymiou and Antoniou (2013), transaction price will not fall below 80% of the asking price as it is mentioned in advertisement. Some interviews with several property agencies involved in the data collection process for this research also support the argument. If a potential buyer bids too low from the
Impact of Land Use Regulation on Land Values
31

asking price they will not release the land for transaction. They had better wait until a new potential buyer comes to make a bid not so far from the asking price. In average, those land and property agencies will agree to do transaction if the transaction price falls at the maximum around 80-85 percent from its asking price. Based on those supporting arguments, all data collected from the newspaper advertisements were then multiplied by 80% in order to get the general image of land values in Ngaglik district during 2009-2015. After making adjustment, the researcher aggregated the data and divided it based on the location of the plot being offered for transaction. The data was then categorized based on location, whether it is located in the area stipulated as an urban area or outside the urban area. The last step is to do a statistical test to see the mean difference of land values between the rural and urban areas before and after the implementation of the new spatial plan. This research will use the Mann-Whitney test to figure out the difference of land values between rural and urban areas in the case study.
From 2009 to 2015, there are 719 parcels of land being offered for transaction. Most of those plots are located in Sinduharjo village which has 188 plots offered for transaction. Meanwhile Minomartani village has the least number of plots being offered for transaction. This is because almost all plots of land in Minomartani have been developed as a result of government housing project in 1980s.
As shown by the figures below, land values in the whole area of Ngaglik districts were fluctuating during 2009 until 2015. From 2009 to 2011 it seemed that there was no significant difference of land values between villages in Ngaglik. However, the land price in two villages which are included in urban areas after the implementation of the new spatial plan is higher compared with another village in Ngaglik. As it is shown by the figure below, the gap of land values per square meter in the village delineated as an urban area with the one outside the urban area became wider after the implementation of the new spatial plan.
Figure 9. Fluctuation of land asking price 2009-2015 Source: Data analysis by author, Kedaulatan Rakyat 2009-2015
When the data is aggregated, by separating data for villages inside and outside the urban boundary, the difference of land values between those two areas becomes more obvious. As it Impact of Land Use Regulation on Land Values
32

can be seen in the figure below, the average price per square meter of land in both rural and urban areas is not so different during the period of 2009-2011. Starting from 2012 the land values difference between both areas became wider. The average price of land in the area inside the designated urban area grows more significantly than the one outside the designated urban area.
Figure 10. Mean comparison of land asking price in rural and urban area Source: Data analysis by author, Kedaulatan Rakyat 2009-2015
To investigate whether the difference of average land values between areas inside and outside the designated urban area is significant or not, the researcher conducted a statistical test. The researcher uses the Mann-Whitney U test to compare the mean between land values per square meter inside and outside the urban boundary. This test is chosen because after the researcher checked for the normal distribution of the data, the result shows that the data was not normally distributed. Variance among groups within the data set each year is also not similar, thus the test will only tell about the significance of the difference of mean between two groups: inside and outside the designated urban areas. The result of the test for normality and variance could be seen in the appendix 3. Since the new land use plan is considered to take effect in 2012, the researcher chose the data from three years before and after the implementation of new land use plan to be compared. This means that only land values data from 2009, 2012, and 2012 will be compared using Mann-Whitney test.
To draw conclusion from the Mann-Whitney test, these hypotheses are used:
Ho: There is no significant difference of means on land asking price
H1: There is significant difference of means on land asking price.
If the test shows the significance value >0.05, the null hypotheses will be accepted. It means there is no significant difference on land asking price between urban and non-urban areas. However, if the significance value is less than 0.05, it means that the null hypotheses should be rejected thus it accepts alternative hypotheses which are stated as there is a significant difference of means on land asking price between urban and non-urban areas.
914949 8737551038285
1580939
2293840 2290327
3133415
555456 459190628010 641840
10592951284447
1558694
2009 2010 2011 2012 2013 2014 2015
Urban Rural
Impact of Land Use Regulation on Land Values
33

Urban Boundary N Mean Rank Sum of Ranks
Price per m2 .00 34 24.93 847.50 1.00 23 35.02 805.50 Total 57
Test Statisticsa Price per m2 Mann-Whitney U 252.500 Wilcoxon W 847.500 Z -2.254 Asymp. Sig. (2-tailed) .024
Table 5. Result of Mann-Whitney test in 2009 Source: Data analysis by author
From the data of land asking price in 2009, the Mann-Whitney test shows the significant value of 0.024 (see Table 5 above). Because of the significance value < 0.05, the null hypotheses should be rejected. This means that there is a statistically significant difference of land asking price mean between urban and non-urban areas. Ranks Urban Boundary N Mean Rank Sum of Ranks
Price per m2 .00 19 14.84 282.00 1.00 25 28.32 708.00 Total 44
Test Statisticsa Price per m2 Mann-Whitney U 92.000 Wilcoxon W 282.000 Z -3.449 Asymp. Sig. (2-tailed) .001
Table 6. Result of Mann-Whitney test in 2012 Source: Data analysis by author
The same procedure is applied in the dataset of land asking price in 2012. As seen in the Table 6 above, the mean rank between the land asking price per square meter inside and outside urban areas is different. The result shows that the difference of the land asking price inside and outside urban areas has a significant value of 0.001, which is lower than 0.005. This means that the null hypotheses should be rejected, thus accepting the alternative hypotheses. Therefore, for the dataset of the land asking price per square meter in 2012, there is a significant difference of mean on the land asking price per square meter between urban and non-urban areas. Ranks Urban Boundary N Mean Rank Sum of Ranks
Price per m2 .00 84 60.16 5053.50 1.00 97 117.71 11417.50 Total 181
Impact of Land Use Regulation on Land Values
34

Test Statisticsa Price per m2 Mann-Whitney U 1483.500 Wilcoxon W 5053.500 Z -7.373 Asymp. Sig. (2-tailed) .000
Table 7. Result of Mann-Whitney Test for 2015 Source: Data analysis by author
Finally, the researcher applied the same procedure for the data set of the land asking price in 2015. As it can be seen in the Table 7 above, the difference on mean ranks between the land asking price inside and outside urban areas becomes wider. Because the result of Mann-Whitney test shows the value of significance of 0.000, which is lower than 0.005, the null hypotheses is also rejected, thus confirming the statistical difference between two groups.
As it has been demonstrated through the Mann-Whitney test, from 2009 to 2015 the land values, which is indicated by land asking price, between areas inside and outside the designated urban area are statistically different. However, by comparing the results of the statistical test from year to year, it is obvious that there is a change on the significance value. The significance value in 2009 shows that the asking land value between areas inside and outside urban boundaries is moderately significant since it has the value of 0.024 which is not far below 0.05. The difference became more significant in 2012, with the significant value of 0.001. Finally, the significance value of land value between those two areas became highly significant in 2015.
The shift of significance value shows that the difference between land value in urban and non-urban areas becomes more significant. This gap has already existed before the commencement of new spatial plan in 2012. The result of the Mann-Whitney test in 2009 provides an evidence that the path of urban sprawl could be found in the whole area of Ngaglik district. This is depicted by the data, which shows that land values in the whole area of Ngaglik increase in the similar way until the new spatial plan was implemented. However, this gap becomes more significant after 2012. In 2012 onward, as it could be seen in Figure 9, it is obvious that the land values in urban areas grow more significantly rather than land values in non-urban areas. This rapid increase of land values in urban areas has created a gap of land values with non-urban areas. This is also supported by the result of the Mann-Whitney test which shows that the difference of land values after the enactment of the RTRW Sleman 2011-2031 in 2012 between urban and non-urban areas becomes more significant.
Even though the significant gap on land values between urban and non-urban areas exist and become wider after the implementation of the new spatial plan, what is causing this drastic land values uplift in the urban area is still questionable. This phenomenon may exist as the result of the enactment of the new spatial plan, but also due to other factors. Therefore, under the following section, the researcher will conduct land values modelling using the statistical model in order to examine what factors that may create the land values uplift in Ngaglik district. More specifically, the land values model will be used to examine whether it is the new spatial plan that caused the significant land values uplift in designated urban areas.
4.4.Sample characteristics for statistical modelling Land values model will be built based on the sample data of land transaction in Ngaglik district from 2008-2015. This data is collected from a field survey. There are 252 samples about land transactions occurring in the case study area during 2008-2015. In order to simplify the
Impact of Land Use Regulation on Land Values
35

analysis, the researcher only used undeveloped land transactions as samples. It did not include transactions of developed lands such as houses and commercial buildings, because developed lands will consist of more complex variables such as the type of property, number of rooms, building materials, etc. The researcher spreads the location for the field survey thus it is not grouped only in one or two specific areas. The detailed map of plot locations being surveyed is available in the appendix.
Samples for this research consist of total 252 samples with 53.6 percent of them is located on Sariharjo, Sinduharjo, and Minomartani villages. Those villages are under the boundary of urban areas according to the new land use plan. Meanwhile, 46.4 percent of transaction is located on the village beyond the delineated urban areas. For the delineated urban area, most transaction occurred in Sariharjo village. It is the village that shares borders with Mlati and Depok districts, which is known as centres of urban growth in Sleman Regency. In the area delineated as a rural area, most transaction occurred in Sukoharjo, which is located close to UII Campus as the centre of urban growth in the north part of Sleman Regency.
Village Name Frequency Percent Valid Percent Cumulative Percent
Valid
Sariharjo 77 30.6 30.6 30.6 Sinduharjo 50 19.8 19.8 50.4 Minomartani 8 3.2 3.2 53.6 Sukoharjo 83 32.9 32.9 86.5 Sardonoharjo 30 11.9 11.9 98.4 Donoharjo 4 1.6 1.6 100.0 Total 252 100.0 100.0
Table 8. Distribution of sample based on administrative location Source: Data analysis by author
Among those samples, 105 samples have the transaction price below Rp. 1,000,000. Plots with value under Rp. 1,000,000 is mostly located on Sukoharjo village. In the urban area itself, the plots have a range of Rp. 1,000,000-Rp. 3,000,000 on its value. There are only fourteen plots which has a value of Rp. 4,000,000 per square meter and more. Those plots with the price of more than Rp. 4,000,000 are mostly located in delineated urban area.
Price Range Total
Under Rp. 1,000,000
Rp.1,000,000-Rp.1,999,999
Rp. 2,000,000-Rp. 2,999,999
Rp. 3,000,000-Rp. 3,999,999
Rp. 4,000,000-Rp. 4,999,999
More than Rp. 5,000,000
Sariharjo 11 34 21 2 5 4 77
Sinduharjo 3 19 15 9 1 3 50
Minomartani 1 5 2 0 0 0 8
Sukoharjo 72 8 2 1 0 0 83
Sardonoharjo 15 9 4 1 0 1 30
Donoharjo 3 1 0 0 0 0 4 Total 105 76 44 13 6 8 252
Table 9 Distribution of sample based on price Source: Data analysis by author
Impact of Land Use Regulation on Land Values
36

The sample mostly has the size of less than 500 m2. This size is the ideal size for middle income housings. According to several land and property agencies, using the assumption that a building could have the Building Coverage Ratio (BCR) of sixty percent, it means that on the plot size between 200-499 m2 a developer can build 120-300 m2 of building. This type of house is only affordable for middle income people. Otherwise, plots with the size of more than 2,000 m2 is potential to be developed as a cluster housing. Developers usually will sub-divide lands with the size of more than 2,000 m2 into smaller size plots in order to be developed and sold to potential buyers.
Using a cross-tab in SPSS, the researcher could get a description of the location and the time of transaction. As it can be seen in the table below, there are 108 transactions occurring during 2008-2012. Meanwhile there are 144 transactions occurring after 2012 to 2015. For land transaction data from 2008 to 2012, fifty-three transactions happened in the area delineated as urban areas while fifty-five transactions were beyond urban area. The number of transaction occurring in urban areas dominating the proportion of samples for land transaction data after 2012, with 82 transactions out of the total 144 transactions.
Data about land status for plots being transacted consists of total 174 plots with the status as “Hak Milik Pekarangan”, 72 plots as “Tanah Sawah”, 4 plots as “Tanah Tegalan”, and 2 plots as “Letter C”. Hak Milik Pekarangan (Pekarangan) is a developable land and its status is written in the land certificate. The administrative procedure to do development on the plot with the status “Pekarangan” is not as complicated as to develop a plot with a status other than “Pekarangan”. A plot with a status of “tanah sawah”, for example, is a productive agricultural land. In order to develop “tanah sawah” either the developer or land owner should get a permission of land use conversion from the regional government. In many cases, developing “tanah sawah” will incur more cost for developers. Because “tanah sawah” is muddy land, developers should bear an extra cost for land preparation before development could be done.
Both before and after 2012 the sale of “pekarangan” is the dominating proportion of the samples. For the data about land transaction before 2012, the sample consists of 67% sales data of “pekarangan” and 28% of “tanah sawah”. Meanwhile, for the land transaction after 2012,
Lot Size Frequency Percent Valid Percent Cumulative Percent
Valid
0-199 m2 45 17.9 17.9 17.9 200-499 m2 95 37.7 37.7 55.6 500-999 m2 48 19.0 19.0 74.6 1000-1999 m2 33 13.1 13.1 87.7 2000 m2 and more 31 12.3 12.3 100.0 Total 252 100.0 100.0
Table 10. Distribution of sample based on lot size Source: Data analysis by author
Year of transaction Total 2012 and before After 2012
Administratif Location
Sariharjo 40 37 77 Sinduharjo 13 37 50 Minomartani 0 8 8 Sukoharjo 43 40 83 Sardonoharjo 11 19 30 Donoharjo 1 3 4
Total 108 144 252
Table 11. Distribution of sample based on location and time of transactions Source: Data analysis by author
Impact of Land Use Regulation on Land Values
37

it consists of 70% data of sales transaction for plot with a status of “pekarangan” and 28% for a plot with a status of “tanah sawah”.
Dummy Year Total
2012 and before After 2012
Status of land
Letter C 0 2 2 Sawah 31 41 72 Tegalan 4 0 4 Pekarangan 73 101 174
Total 108 144 252
Table 12. Distribution of sample based on land status and time of transaction Source: Data analysis by author, Letter C=customary tenure, Sawah=Wet agricultural land, Tegalan=dry agricultural land, pekarangan=developable land
For the purpose of statistical modelling, the researcher assigned the distance of each plot to its nearby public facilities, such as hospital, elementary schools, and bus terminals. The researcher also measured the distance of each plot to Yogyakarta City Centre as the centre of activity within this urban agglomeration area. To assign the distance of each plot to every aforementioned spot, the researcher used a GIS Software. This software enables the researcher to measure the Euclidean distance between each plot with all of those points. Euclidean distance itself is a measurement of the shortest distance between two spots in two-dimensional plains. The summary of measurement using the GIS software is presented in the table below. All measurement is in kilometres (km) unit.
4.5. Land value modelling for land transaction in Ngaglik during 2008-2015 Before drawing a conclusion whether the implementation of the new spatial plan by the local government in Sleman affects land values in Ngaglik or not, a statistical analysis through regression modelling will be conducted. Regression analysis based on Ordinary Least Square (OLS) method has been proven to be useful to isolate another factor that may influence land values rather than the impact of land use regulation itself.
In order to examine the impact of the new spatial plan on land values in the case study area by controlling it from other factors which determine land values, a statistical modelling will be used. The model that will be presented later follows approach proposed by Ball, et al. (2014) when examining the effect of UGB policy in Melbourne, Australia. As stated in the conceptual framework, land regulation is not the only determinant factor of land values. There are several variables that should be considered inn modelling urban land values, which are location factor, service factor, demographic factor, and physical characteristics. The presence of those factors under this statistical model will help the researcher to control the impact of those factors into land values to draw a conclusion about the impact of new spatial plan on land values in the case study area.
Descriptive Statistics N Minimum Maximum Mean Std. Deviation Distance from Elementary School 252 .04 1.03 .4456 .23087 Distance from Bus Terminal 252 .65 5.19 3.0610 1.37105 Distance from Yogyakarta City Centre 252 4.14 12.30 8.6058 2.76153
Valid N (listwise) 252
Table 13. Descriptive statistics for distance variable Source: Data analysis by author
Impact of Land Use Regulation on Land Values
38

Several variables have been derived into indicators to measure the impact on land values. First of all, the plot characteristic will be measured through plot size and land status according to its land certificate when it was under transaction. The Second variable is the availability of service variable, which will be measured through the distance from markets, which hereinafter refers to the traditional market where people usually buy their daily needs and groceries, the distance from bus terminals, as the only one public transportation hub available in the case study area, road quality, and distance from elementary schools. Third variable is location factor variable. This variable will be measured by the distance from Yogyakarta City Centre as the centre of social economic activity in the case study area and the type of road where the plot is located. For the later indicator, a dummy variable will be used. A plot which is located on the side of the provincial road, which since before the enactment of new spatial plan has had the strategic value, will be given value of 1 under the statistical model, while the other will be given the value of 0. the fourth variable is demographic characteristics, which will be explained through two indicators: population density and percentage of population with university degrees. The last variable will be used to explain the impact of enactment of the new spatial plan, which is dummy variable of urban boundary. This variable will have a value of 1 for plots located inside urban boundaries and the transaction happened after the enactment of the new spatial plan. This variable will be useful to explain whether there is or an impact of new spatial plan on land values in the case study area or not. It is expected that if the new spatial plan affects land values, it will have a significant value under the model.
The model is denoted as:
Land value = β0 + β1 Lot size + β2 Status of Land + β3 Distance from Elementary School +β4 Distance from Market + β5 Distance from Bus Terminal + β6 Road Quality + β7 Distance from Yogyakarta City Centre + β8 Road Status +β9 Population Density + β10 Percent of population with university degree + β8 Urban Boundary + ε (1)
After doing an examination, it is known that the dependent variable, which is land price per square meter is not normally distributed. Therefore, when doing a regression analysis using the aforementioned model, it does not fit the normality test. Because of that, the researcher normalized the dependent variable by transforming it into its natural logarithm form. The model (1) above is then denoted into:
eLand value = β0 + β1 Lot size + β2 Status of Land + β3 Distance from Elementary School +β4 Distance from Market + β5 Distance from Bus Terminal + β6 Road Quality + β7 Distance from Yogyakarta City Centre + β8 Road Status +β9 Population Density + β10 Percent of population with university degree + β8 Urban Boundary + ε (2)
This transformation will bring consequences on the interpretation of the model, which will be explained later. This updated model has been checked for normality, heteroscesdasticity, multi-colinearity, and auto-correlation. The result of those tests for this model has shown that this model is BLUE (Best Linear Unbiased Estimator) and thus the estimation resulted in this model is unbiased. This model has adjusted the R square value of 0.584 which means that 58.4% variation of the data set could be explained through the available variable.
Variable Indicator Unstandardized
Coefficients t Sig.
Physical Characteristics
Lot size -2.094E-005 -1.529 .128 Dummy Land Status .341 4.285 .000
Service Availability Factor
Distance from market -.203 -2.183 .030 Distance from Elementary School .414 2.741 .007
Impact of Land Use Regulation on Land Values
39

Distance from Bus Terminal -.209 -3.649 .000
Dummy Road Quality .287 4.039 .000 Location Factor Distance from
Yogyakarta City Centre -.013 -.302 .763
Dummy Road Status .665 4.965 .000 Demographic Characteristics
Density 5.087E-006 .123 .902 Percentage of Population with university degree -2.079 -.670 .504
Land use regulation Dummy Year .639 4.833 .000 Dummy Urban Boundary .770 2.360 .019 DYearXUrbbound -.211 -1.278 .202
(Constant) 13.924 27.209 .000 Table 14 Result of regression analysis Source: Data analysis by author
Result of regression analysis could be seen in Table 14 above.
Because the dependent variable has been transformed into its natural logarithm form, the formula (2) above should be solved before interpreting the model. From formula (2), in order to determine the land price, this formula is then denoted into:
Land value= e β0 + β1 Lot size + β2 Status of Land + β3 Distance from Elementary School + β4 Distance from Bus
Terminal + β5 Road Quality + β6 Distance from Yogyakarta City Centre + β7 Population Density + β8 Urban Boundary + β9 Road
Status + ε (2),
Or it can be also denoted as
Land value= e β0 . e β1 Lot size . e β2 Status of Land . e β3 Distance from Elementary School . e β4 Distance from
Bus Terminal . e β5 Road Quality . e β6 Distance from Yogyakarta City Centre . e β7 Population Density . e β8 Urban
Boundary . e β9 Road Status . e ε (3)
As it can be seen in the Table 14 above, several factors have high significance value on determining land values. Among variables used under this research, only demographic characteristic variable that is totally not significant on determining land values. Using the significance level of five percent, both indicator to explain demographic characteristic variable, which are population density and percentage of population with university degree, do not have significant impact on land values. In Ngaglik, and also in Sleman at general, this result means that the land value difference could not be explained by the difference on demographic characteristic. This result shows a contrast with the characteristic of land market in Western countries, as it has ever been underlined by Cho, et al (2008) and Chichoine (1981) where demographic characteristics may determine land values in a location. Since spatial segregation based on racial composition and income level is not a big issue in Indonesia, it is reasonable that this variable has no significant effect on determining land values in the case study area.
Plot characteristic is the first factor that determine land values in the case study area. Although plot size indicators show insignificant effect on land values, land status indicator has a significant effect on determining land values. This means that the plot size does not matter. A Plot with larger size is not different significantly on value compare with the one with smaller size. In some previous research, such as highlighted by Chichoine (1981) and Ball, et al. (2014), a plot size may determine land values. Land values tend to be higher when the plot is smaller due to the possibility of subdivision as it has been underlined by Chichoine (Chicoine, 1981) and also by Thirkell (1996). However, in the case of land values in Ngaglik, this factor does not significantly affect land values.
Impact of Land Use Regulation on Land Values
40

Land status is considered as a determinant factor of land values in Ngaglik. As stated by Monkkonen (2013), land certificate should be converted into Hak Milik, and especially into Hak Milik Pekarangan, in order to enable it to be developed. Hak Milik status is also important if either the owner or the developer would like to get a mortgage from bank for development purposes. Because this model uses a dummy variable to measure land status, with the value of 1 for land with a status of Hak Milik Pekarangan while the others are given 0, this model shows that a plot with a status of Hak Milik Pekarangan will have 40.6% higher value than the land with another status if other factors are held constant. This finding shows that a developable land will have higher value than the land which could not be developed directly.
This finding is understandable because in the context of the case study area buyer tends to purchase a land that would not require complex administrative procedure to be developed. This result has been confirmed by several land brokers, who express their preference on the land with a status Hak Milik Pekarangan. Some land brokers prefer to offer only the land with this status to the potential buyer. It is due to their effort to minimize unexpected cost when they should propose change of land status to the local authority. Land broker will only offer land with status other than Hak Milik Pekarangan if it is clear that buyer will process the change of status by himself.
All indicators used to explain the availability of service variable are statistically significant on determining land values. This variable consists of two factors that may determine land value, which are factors that is called by Alexander (2014) as relative location and its accessibility. Relative location is one factor that depict the relative location of a plot into its nearby service centre, such as education, social, and economic facilities.
The model shows clearly that the land value in Ngaglik is determined by its relative location into several public facilities, such as market, bus terminal, and elementary school. The model also shows the importance of accessibility which is measured by the indicator of road quality. The statistical model shows that a plot which shares a side with an asphalted road, which is measured using dummy variable, will have 25.4% higher value than the one that does not share a side with an asphalted road.
Among those indicators, the distance from market and the distance from bus terminals have a significant effect and both have negative coefficients. This means that increasing distance from a plot to market and bus terminal will decrease land values. A one unit increase of distance from market will reduce land values up to 18.4% held another factors constant. Meanwhile in the case of bus terminal, a one unit increase of distance from bus terminal will reduce land values up to 18.9% when other factors are constant.
There are several explanations that make land values in the surrounding area of public facilities such as traditional market and bus terminal tend to be higher. First, as it has been highlighted by the previous study, it has a good accessibility. The result from previous studies about the impact of transportation infrastructure development on land values, which are conducted by Ibeas, et al. (2012), Mulley and Tsai (2016), and Efthymiou and Antoniou (2013), show that the existence of transportation hub, such as bus terminal or bus stop, could increase the land values in its surrounding area. The second explanation is due to its potentiality to be developed for economic activities in the future. It is revealed through some small interviews with land brokers who mentioned that land in the surrounding area of a bus terminal and market is potential to be developed for commercial activities, thus it has a higher value than the one located further away from it.
The quite unusual finding from the statistical model is regarding the indicator of distance from elementary schools. It is expected to have the same effect with another availability of service
Impact of Land Use Regulation on Land Values
41

indicator on determining land values. However, it has a positive coefficient, which means that if a location is located close to elementary schools, it will have a lower value than the one located further. This is due to negative externalities of being located too close to elementary schools, as proposed by Des Rosiers and Theriault (2009), and also confirmed by several land brokers. Negative externalities come in terms of noise and traffic congestion. This is also due to the limited possibility of future development if the land is located too close to elementary schools.
Location factor also determines land values. Location factor in this model could be seen as what is called by Alexander (2014) as an absolute location. This means that a plot may have a higher value because its geographical location gives advantage. It should be differentiated from a relative location of a plot which is resulted from the availability of service as it has been mentioned in the previous section. The absolute location of a plot may give it a positive externality which will also give the plot a higher value. However, as it is shown by the model, only one out of two indicators explaining location factor has a significant effect on determining land values, which is the road status.
The distance from Yogyakarta City Centre indicator is considered as not significant on determining land values and has a negative coefficient. This confirms the real condition in the field, where the development occurs in a leap-frog way. This type of development has caused land values gradient modelled by Alonso (1964) unable to explain the land values in Ngaglik. This finding also confirms the fact that the urban sprawl and uncontrolled development has become the main concern of the local government in Sleman.
On the contrary with the distance from Yogyakarta City Centre indicator, the road status indicator has a significant effect on determining land values. This is a dummy variable which has a value of 1 for a plot located on the side of provincial roads. The model shows that if a plot is located on the side of the provincial road it will have 87.1% higher value than the others if other factors remain constant. This means that being located on the side of a provincial road gives a plot an advantage. This finding is also supported by conclusion of research conducted by Wardani and Kurniawan (2012) who highlighted the high intensity of mobility in provincial road which created a great opportunity to develop commercial activity along this provincial road.
This finding depicts the pattern of urban growth in Yogyakarta Urban Agglomeration Area which tends to follow the axial pattern. This pattern according to Balchin, et al. (2000) is a variation from concentric pattern, where the existence of the main transportation road has distorted its original pattern. This finding is also confirmed by several land brokers who pointed out the increase of land values for plots located on the side of the provincial road connecting Yogyakarta City Centres and Kaliurang, and also the one connecting Yogyakarta City Centre and Pulowatu.
Finally, the last variable, land use regulation, is used to examine the impact of enactment of the new spatial plan into land values in the case study area. Result of statistical model above shows that Dummy Year indicator has significant value. This means that actually land values uplift occurs from time to time, with land values after the enactment of the new spatial plan in 2012 is higher than before. This finding from statistical model is supported by the data about land values fluctuation in Ngaglik as it has been presented in previous section. Land values uplift occurs every year both in urban and outside urban areas, with a significant value uplift which occurs after the enactment of the RTRW Sleman 2011-2031 in urban areas. The model also shows that without considering when the new spatial plan was enacted, land values inside and outside urban boundaries have been different significantly. Land values inside urban boundary is higher than the one outside. Again this finding is supported by the result of the Impact of Land Use Regulation on Land Values
42

analysis of land values fluctuation in Ngaglik, which shows that land values in the area delineated as an urban area is always higher than the one outside the urban area.
Despite of high significance value on dummy year and dummy urban boundary variable, the statistical model shows insignificant value on interaction variable DYearxUrbBound. This indicator is used to measure whether the different of land values could be attributed into the enactment of new spatial plan. The use of interaction variable DyearXDurbanboundary follows the one used by Ball, et al (2014) and Mulley and Tsai (2016). If the change is attributable into the implementation of RTRW 2011-2031, this interaction variable will have a highly significant value. However, the statistical model shows that this indicator has a significance value that is far beyond 0.05, which means that this factor could not be considered as the significant factor on determining land values in Ngaglik. This means that the difference in land values before and after the implementation of the new land use plan between area inside and outside urban boundaries could not be attributed into the implementation of the new land use plan.
Land values uplift has occurred from time to time, which is shown by the significant value of Dummy year variable, and actually the land values inside the urban boundary has been higher than the one outside. This result could then be interpreted as with or without the enactment of RTRW 2011-2031, land values in the designated urban area has increased, and naturally it is higher than the land values outside the urban area.
4.6. RTRW Kabupaten Sleman 2011-2031 and its impact into land value in case study area
Land values in Ngaglik is naturally increasing from time to time. Refer to section 4.3, it is obvious that land values either in urban area or non-urban area has increased from 2008 to 2015. The land values in both areas increase steadily from 2008-2011. From 2011-2012, there was a significant increase of land values in the urban area, which created more significant gap with land values in the non-urban area. Even though after 2012 land values in non-urban areas also experienced quite a significant increase, the gap of land values between urban and non-urban areas is still significant and even it becomes more statistically significant in 2015.
In order to examine the impact of a newly enacted regulation, data about land value fluctuation between the area received treatment as a result of the enactment of the new regulation and the area without treatment is usually put in comparison in previous research. Juxtaposing the data about land values fluctuation in areas with a different treatment by the existence of land use regulation was also conducted by Ball, et al. (2014) when they examined the impact of Urban Growth Boundary (UGB) policy in Melbourne and also by Zhou, et al. (2008) when they examined the impact of change on land use regulation. Zhou, et al. (2008) supported their conclusion with Independent T-test, which shows that there was land values uplift in area where the land use regulation may give advantage for future development. The implementation of a new UGB in Melbourne is also being said may give advantage for the area inside urban boundary (Ball, Cigdem, et al., 2014). Under those conditions, the comparison between areas with and without treatment will show a similar result, where the land values in the treatment area shows a significant increase compared with the one without treatment.
In the case of the enactment of the RTRW Sleman 2011-2031, this new spatial plan will give advantage for the future development in the designated urban area. As it is stipulated within the plan, the plan gives possibility for developing social and economic activities with higher intensity in the designated urban area. It is also stipulated that in the future, the designated urban area will be serviced through several urban infrastructures, such as sewerage, road Impact of Land Use Regulation on Land Values
43
improvement, and integrated waste management system. This condition could give what is so called by Brueckner (2006) as amenity effect, which may attract potential buyer to buy land and do development in the designated urban area. The indication of future potential development in designated urban area could give what is so called by Alterman (2012) as windfall for the landowner who has a land in the designated urban area because the amenity effect may increase the demand while the supply of land is static.
If this effect occurs, this means that the land values in the designated urban area, which get all of the aforementioned advantage, will grow more significantly compared with areas which would not get those advantages. RTRW 2011-2031 will give windfall into the plot located inside the urban area, which could be indicated through the increase in land values. When comparing the land values inside and outside designated urban areas, as it has been conducted in section 4.3, it is obvious that the land values in urban area grows more significantly after the enactment of RTRW Sleman 2011-2031. This is also supported by the statistical analysis using Mann-Whitney test. There is a shift on the significance value on the mean difference between land values inside the urban area with the one outside the urban area. Although the mean difference of land values between areas inside and outside urban areas has been significant in 2009, after the enactment of RTRW Sleman 2011-2031 the gap in land values becomes highly significant.
In spite of analysis from the fluctuations of land values in Ngaglik shows that land values inside urban area grows more significantly than the one outside urban area, this result does not automatically confirm the effect of the enactment of RTRW Sleman 2011-2031 on land values. Therefore, a statistical modelling using OLS Regression was conducted. This analysis could control the presence of factors affecting land values other than the impact of land use regulation itself.
When it comes to a statistical modelling, the indicator used to capture the effect of RTRW Sleman 2011-2031 shows an insignificant value. This means that the enactment of RTRW Sleman 2011-2031 is not a factor that significantly determines land values in Ngaglik district. Land values in Ngaglik is more determined by other factors, such as the status of land, availability of service, and its absolute location, rather than the effect of the enactment of RTRW Sleman 2011-2031.The insignificant value of interaction variable used in the statistical model shows that the enactment of RTRW Sleman 2011-2031, which gives several advantages into area designated as urban area does not give significant effect into land value in the designated urban area.
Even though observation from the fluctuation of land value in both urban and non-urban area, supported also by Mann-Whitney Test result, shows that the significant land value uplift occurs in the designated urban area after the enactment of RTRW Sleman 2011-2031, the changes is not attributable to the enactment of RTRW Sleman 2011-2031. This finding is also supported by the only official data about land value in Ngaglik obtained from National Land Administration Office (BPN) Sleman, which shows that the land value uplift only occurs significantly in several part of the designated urban area, not in the whole of the designated urban area.
As it can be seen in the Figure 11 below, the area with a red colour is area where increase of land values happens significantly from 2013-2015 while the red dotted line is the border between urban and non-urban areas with the area below the red dotted line is an urban area. The land value uplift is considered as significant if it increases more than 100% during the period of 2013-2015. This figure shows that several parts in Sariharjo, which is located inside the designated urban area, experience significant increase on land value. Those areas where a significant increase on land values occurs are areas surrounding a big development project that Impact of Land Use Regulation on Land Values
44

happened during 2013-2015. In area number 106, for example, a new apartment building, namely Mataram City Apartment, was constructed in 2014, and land values in its surrounding area show a significant increase. The same phenomena occurred also in area number 101 and 127, where the project of high-income housing, namely Hyarta Residence, has been commenced since 2013. The land values in its surrounding area increased significantly during 2013-2015. Several land brokers expressed this tendency during the field observation. Land values in the area surrounding a big development project tends to increase, even before the project has started.
Figure 11 Land value change in Ngaglik 2013-2015 Source: Data analysis by the author based on Land Value Zone Map by BPN Sleman (2013-2015)
The significant increase of land values in the designated urban area is probably caused by the number of big development projects that recently happens in designated urban area, not by the effect of RTRW Sleman 2011-2031. This increase of land values could be indirectly caused by the enactment of RTRW Sleman 2011-2031 itself, because this regulation allows development of high rise residential and commercial buildings in the urban area. However, this indirect relationship between RTRW Sleman 2011-2031 with the existence of new big development project and land values increase in its surrounding area will need a further examination that could not be covered in this research.
The insignificant effect of the enactment of RTRW Sleman 2011-2031 on land values in Ngaglik could be explained by several factors. These factors may come in terms of the problem of consistency and stringency on the regulation enforcement in Sleman and the time of this study being conducted.
The problem of consistency and stringency of regulation enforcement could lead to a conclusion that the land use regulation has an insignificant impact on land values. It is a basic problem in developing countries, where regulation is not strictly enforced and the responsible Impact of Land Use Regulation on Land Values
45

authority on regulation enforcement lacks capability to do so. Several studies in developing countries, as demonstrated by Sivam (2002) in India, Thirkell (1996) in Phillipines, Adebayo (2009) in Nigeria, and finally by Monkkonen (2013) in Indonesia, highlighted the problem of lack of capability to administer the plan itself. This factor causes many land regulations in developing countries fail to achieve its desirable outcome. Stringency of land use regulation may give significant effect on land values if it is followed by stringency of its enforcement.
This effect of stringency of land use regulation into land values has been examined by Kok, et al (2014) and Ihlanfeldt (2007). One factor should be considered in understanding the result of research conducted by Kok, et al. (2014) and Ihlanfeldt (2007) is that the research took place in developed country, where regulation is well enforced. When the same study is brought to a country where the regulation enforcement is not as well as in developed countries, the result should be understood carefully, as stated by Monkkonen (2013). Finding of this research then confirms what has been said by Chesire and Sheppard (2004) and Jaeger (2013) that measuring the impact of land use regulation brings several challenges because it has various forms, and as stated by Monkkonen (2013), land use regulation may give a different outcome based on the context of the regulation itself.
Problem of inconsistency on the regulation enforcement is underlined by Monkkonen (2013). Although it is said by Monkkonen that theoretically Indonesia has the most stringent land regulation among developing countries, the practice often shows a different situation from what it should be. This problem is also revealed when the researcher made a conversation with several land brokers involved in data collection process. The case of changing land status from agricultural land into developable land in non-urban area could be used as an example. Under the leadership of the current head of Regency, some land brokers express the difficulties on proposing land use status change in the non-urban area to the local authority. However, the change of the Head of Regency in Sleman in the future could change the regulation of land status conversion. This made some land brokers and speculators prefer to wait right now, let their agricultural land unused, until the new head of regency has been elected thus they could propose to change the land use into developable land.
This implies that the regulation enforcement in Sleman is negotiable, something that is also underlined by Monkkonen (2013). There is also unofficial cost, which is called as “thank you money” by Monkkonen, as a compensation for the responsible authority regarding land management in order to break the rule. The existence of “thank you money” is confirmed by several land brokers, especially for major development projects which involve big developers to handle the project. The problem of stringency and consistency of regulation enforcement should be addressed seriously by the regional government. Otherwise, any regulation made by government will fail to achieve its desirable objective.
Regarding the timing of this study, it might be too early to measure the impact of RTRW Sleman 2011-2031 on land values in Ngaglik. The new spatial plan in Sleman has already been enacted in 2012. Previous study, such as the study conducted by Ball, et al. (2014) and Zhou, et al (2008) takes several years after the land regulation has been enacted. Jaeger, et al. (2008) who also drew a conclusion that the new land use regulation has an insignificant impact on land values realized this limitation. Since RTRW Sleman 2011-2031 has an intention to guide future development in the long range of time, its effect has not been obvious only three years after its enactment.
Although the finding through the statistical analysis fails to prove the impact of government intervention in terms of land use regulation on land values in Ngaglik, it could not neglect the fact that there are several forms of public action by local government that may determine land values. As shown by the statistical model, government intervention in terms of public service Impact of Land Use Regulation on Land Values
46

provision and permission to change land status may increase land values. When the government gives permission to change the land use status into “Hak Milik Pekarangan” for example, it may increase land values, which according to the land values model could increase land values up to 40.6%. The increase may also occur when the local government does road upgrading projects. As shown by the model, an asphalted road may have 27% higher value compared with other roads which have not been asphalted. This finding may give contribution to the local government in Sleman when they would like to formulate land values capture policy. The insignificant effect of the new spatial plan on land values in Ngaglik does not mean that the local government intervention in Sleman does not have any effect on land values at all. There are several other forms of local government intervention other than the enactment of RTRW Kabupaten Sleman 2011-2031, as shown by this research, that could be a basic argument to practice land value capture policy in Sleman.
Impact of Land Use Regulation on Land Values
47

Chapter 5: Conclusions and recommendations This research was conducted in order to examine the effect of local government intervention in terms of enactment of new spatial plan, RTRW Kabupaten Sleman 2011-2031, on land values in Ngaglik district. This research was started by the argument of land value capture, which highlighted the right of the government to capture some parts of unearned increment value of land, resulted from the public action (Alterman, 2012). This land value capture policy is a potential resource for financing public service provision (Walters, 2013). However, the problem is that it is difficult to separate which part of this increment is resulted from a public action, and which part should belong to the landowner. This is the main reason to conduct a research regarding the effect of public action on land values in Sleman.
Due to time limitation and problem of data availability, only a small part of Sleman was selected as the case study area. Ngaglik district was chosen because it provides a comparable case. The whole area of Ngaglik district has faced a problem of urban sprawl development and high rate of agricultural land conversion. However, the local government only gave treatment in terms of status of urban area into half part of Ngaglik district, while the other half is given a status as a non-urban area or rural area. This condition enables the researcher to examine the impact of RTRW Sleman 2011-2031 by comparing two areas with almost similar condition but received different treatment by the regulation.
The impact of government intervention in terms of land use regulation is still debatable in the previous literature. When it comes to urban growth boundary (UGB) according to Brueckner (2006), the regulation will bring an increase in land values in the area delineated inside the urban boundary. This is due to the amenity effect, restriction effect, and scarcity effect resulted from the UGB itself. This theory by Brueckner is supported by evidence from Melbourne, through research conducted by Ball, et al (2014) and also case study in Seoul by Bengston and Youn (2006). When it increases the potential development in the future, land regulation will also give positive effect into land values as it was demonstrated by Zhou, et al (2008). Land use regulation may give negative effect into land values, which come in the form of decrease in land values, if the regulation restricts the possibility of development. This finding is demonstrated by Ihlanfeldt (2007) when examining how restrictive regulation may reduce the land values of particular plots.
In the previous literature about the effect of land use regulation in developing countries, several researches pointed out at the problem of regulation enforcement and incapability of local authority in administering the regulation. This problem revealed in many literatures from developing countries, such as demonstrated by Sivam (2002) in India, Thirkell (1996) in Philipines, Adebayo (2009) in Nigeria, and Monkkonen (2013) in Indonesia. This problem has made the regulation fail to meet its desirable outcome. This kind of regulation is pointed out by Sivam (2002) as too Western-oriented, thus it only copied the one implemented in more developed countries without reflecting the actual condition in the developing countries.
Within this research, observation from fluctuation of land values in Ngaglik district shows that land values in the whole part of Ngaglik increase every year. From 2008-2011 land values in both urban area and non-urban area growth at similar rate, although the land values in urban area tend to be higher than the one outside urban area. From 2011-2012 there is a significant increase of land values in urban areas, which has created a more significant gap of land values between urban and non-urban areas. Even though after 2012 there was also quite a significant increase of land values in non-urban areas, the gap of land values between urban and non-urban areas becomes more significant in 2015. This existence of land values gap between urban and non-urban areas was examined through a Mann-Whitney test, which shows that even though
Impact of Land Use Regulation on Land Values
48

since 2009 the mean difference of land values between urban and non-urban areas is statistically significant, this gap becomes more highly significant in 2012 and 2015.
Since RTRW Sleman 2011-2031 promised some advantage for the plot located in urban area, such as possibility of future development and urban infrastructure that will be installed in the future, this regulation could give increase into land values in designated urban area. This regulation may give what is called by Brueckner (2006) as an amenity effect, and also causing what is called by Alterman (2012) as windfall. However, this evidence is not strong enough to attribute this increase to the enactment of RTRW Sleman 2011-2031.
In order to examine the significance of RTRW Sleman 2011-2031, this research utilized land values model. As demonstrated by Chichoine (1981), Ball, et al. (2014), Cho, et al. (2008), Kok, et al. (2014), and Ihlanfeldt (2007), the use of the statistical model could isolate the effect of land use regulation from other factors that may determine land values. This provide a useful tool to ensure whether the land value uplift occurs as the effect of land use regulation or not.
The land values model using the land transaction data in Ngaglik shows that the enactment of RTRW Sleman 2011-2031 is not significant on determining land values in Ngaglik. Compare with other factors, which are plot characteristic, availability of service, and location factor, the enactment of RTRW Sleman 2011-2031 which is measured using an interaction variable fail to results into significant parameter. This finding is also triangulated using land value zone map by BPN Sleman, which is the only official data about land value that is available for this research. It strengthens the conclusion that it is not the enactment of RTRW Sleman 2011-2031 that caused land value uplift in the designated urban area. Therefore, this research fails to provide evidence about the effect of government intervention in terms of land use regulation on land values in Sleman.
There are two possible explanations why RTRW Sleman 2011-2031 does not have a significant effect on land values. the first is due to its stringency and consistency of the regulation enforcement. This is a major problem faced by the government in developing countries. The consistency of regulation enforcement in Indonesia is put under question. Because of this spatial plan is subject to review once every five years, the enforcement of the regulation will rely on who are in the top tier of local leadership. Even though under this current regime it is acknowledged by some land brokers that land use regulation is strictly enforced, the problem of consistency may cause the regulation to not give a significant effect on land values in Ngaglik at the time when this study is being conducted. This finding also repeats the finding from Monkkonen (2013), which mentions that even though theoretically Indonesia has a stringent land use regulation, its impact is undesirable because of the lack of enforcement problem.
Second possible explanation is due to the timing in conducting this research. As already known, RTRW Sleman 2011-2031 was enacted since 2012. It means that this result was conducted just three years after the enactment of this new regulation. Since according to Zhou, et al. (2008) this type of regulation intends to guide the development in the long term, it may be too premature to examine the impact of RTRW Sleman 2011-2031 on land values in Ngaglik. It is probably still the time when actors in land market still adapt the new regulation thus its impact is not obvious enough to be observed.
Several limitations have been faced by the researcher when conducting this research. First of all, it deals with the problem of time limitation and data availability. Given a very limited time and also facing the problem that official data about land transaction is not adequately available has forced the researcher only examine the effect of regulation into land values without considering the complexity regarding the implementation of this newly adopted regulation. The
Impact of Land Use Regulation on Land Values
49

problem of data availability has forced the researcher to shift data collection method from secondary data collection into primary data collection through field survey and questionnaire. This made the researcher unable to elaborate other aspects, such as the level of regulation enforcement, and perception of land market actors regarding the implementation of RTRW Sleman 2011-2031. This research fails to capture the shift of perception among land market actors in the case study area resulted from the enactment of the new spatial plan. Whereas, according to Chichoine (1981) this factor is considered as important on determining land values.
The shift on data collection method also bring consequence into this research. It could not cover the whole part of Ngaglik district due to the limited number of contact persons. Although the researcher has tried to spread out the location of the field survey, it will yield a more exact result if the data may cover the whole part of case study area.
The second limitation is due to its reliability and validity. The primary data method is less accurate than if this research utilized official data from the regional government. However, because the official data from the regional government is insufficient for this research, the data from newspaper advertisement and field survey is the best available data at this time. This research has also demonstrated the usefulness of Google Earth and GIS software for the research purpose. All information about the road quality and land use of plot when it was under transaction from questionnaires has been triangulated by an observation through a satellite imagery provided by Google Earth. Moreover, all measurement used under indicators explaining availability of service and location factors are made using GIS Software. This software has helped the researcher to do a more accurate measurement rather than relying on the estimation from the answers to the questionnaire. All variables being used in land values modelling has been used frequently in the previous research, thus the use of variable and indicator in this research has a theoretical basis and is valid to measure factors that may determine land values.
As stated in chapter 3, the limitation of case study is this type of research is difficult to be generalized into the wider extent. Therefore, the impact of regional government intervention in form of RTRW Sleman 2011-2031 could be generalized within Ngaglik area itself. The result of this research could not be generalized for the whole Sleman Regency. However, from this case study, the result could reveal that the effect of the new spatial plan will also be the same in other districts in Sleman which own almost similar characteristics to Ngaglik district.
Further research is still needed in the future regarding the impact of regional government intervention in a form of land use regulation. Due to the problem of data availability, the researcher has received information from the head of land registration division in BPN Sleman that at this time BPN and BAPPEDA is still preparing for a land valuation project for each parcel in Sleman Regency. This data will be available after around three years from now. This data will be a valuable resource for further research under the field of land management and development in Sleman Regency. Upcoming research could also consider other factors than those used to build the model in this research. This factor may include measurement of the impact of the new big development project on land values in its surrounding areas and also motivation and perception of actors involved in land markets regarding the enactment of the new spatial plan.
Impact of Land Use Regulation on Land Values
50

Bibliography
Adebayo, M. A., 2009. Impact of urban land use change on property values in Metropolitan Lagos. The Social Sciences, 4 (1), pp. 111-117.
Alexander, E. R., 2014. Land-property markets and planning: A special case. Land use Policy, 41 pp. 533-540.
Alonso, W., 1964. Location and Land Use: Toward a General Theory of Land Rent. Cambridge, Massachusets: Harvard University Press.
Alterman, R., 2012. Land-use regul;ations and property values : the "windfall capture" diea revisited. In: N. Brooks, K. Donaghy and G. Knaap eds., 2012. The Oxford handbook of urban economics and planning. Oxford: Oxford University Press. pp. 755-786.
'Badan Pusat Statistik Kabupaten Sleman', 2015. Statistik Daerah Sleman 2015. Sleman: Badan Pusat Statistik Kabupaten Sleman. [Accessed 10/3/2016].
Balchin, P. N., Isaac, D. and Chen, J. 2000. Spatial structure of urban areas. Spatial structure of urban areas. 2000. Urban economics a : a global perspective. Basingstoke: Palgrave. pp. 80-122.
Ball, M., Cigdem, M., Taylor, E. and Wood, G. 2014. Urban growth boundaries and their impact on land prices. Environment and Planning A, 46 pp. 3010-3026.
Bengston, D. N. and Youn, Y. 2006. Urban containment policies and the protection of natural areas: The case of Seoul's greenbelt. Ecology and Society, 11 (1), Available at: http://www.ecologyandsociety.org/vol11/iss1/art3/ .
Blatter, J. and Blume, T. 2008. In search of Co-variance, Causal mechanisms or Congruence? Towards a plural understanding of Case Studies<br />. Swiss Political Science Review, 14 (2), pp. 315-356.
Booth, P. A., 2012. The unearned increment: Property and the capture of betterment value in Britain and France. In: G. K. Ingram and Y. H. Hong eds., 2012. Value Capture and Land Policies. Massachusetts: Lincoln Institute of Land Policy. pp. 74-93.
Brueckner, J. K. (unpublished) 2006. Government Land-Use Interventions: An Economic Analysis. For presentation at the 4th Urban Research Symposium, World Bank, Washington D.C.
Cheshire, P. and Sheppard, S. 2004. Land markets and land market regulation : progress towards understanding. Regional Science and Urban Economics, 34 (6), pp. 619-637. Available at: http://www.sciencedirect.com/science/article/pii/S0166046204000146/pdfft?md5=565fc1fd1bd787137ae89a2b3a0dc859&pid=1-s2.0-S0166046204000146-main.pdf [Accessed 21-01-2016].
Chicoine, D. L., 1981. Farmland Values at the Urban Fringe: An Analysis of Sale Prices. Land Economics, 57 (3), pp. 353-362.
Impact of Land Use Regulation on Land Values
51
Cho, S., Poudyal, N. and Lambert, D. M. 2008. Estimating spatially varying effects of urban growth boundaries on land development and land value. Land use Policy, 25 pp. 320-329. [Accessed 18 April 2016].
Cunningham, C. R., 2007. Growth controls, real options, and land development. The Review of Economics and Statistics, 89 (2), pp. 343-358.
Debrezion, G., Pels, E. and Rietveld, P. 2007. The impact of railway stations on residential and commercial property value: A meta-analysis. Journal of Real Estate, Finance, Economy, 35 pp. 161-180.
Departemen Permukiman dan Prasarana Wilayah, 2003. Buku Profil Penataan Ruang Propinsi Daerah Istimewa Yogyakarta. Jakarta: Departemen Permukiman dan Prasarana Wilayah. [Accessed 13 August 2016].
Des Rosiers, F. and Thériault, M. 2009. Mass Appraisal, Hedonic Price Modelling and Urban Externalities: Understanding Property Value Shaping Processes. Mass Appraisal, Hedonic Price Modelling and Urban Externalities: Understanding Property Value Shaping Processes. 2009. Mass Appraisal Methods. Wiley-Blackwell. pp. 109-147. Available at: http://dx.doi.org/10.1002/9781444301021.ch6.
Du, H. and Mulley, C. 2007. The short-term land value impacts of urban rail transit: Quantitative evidence from Sunderland, UK. Land use Policy, 24 pp. 223-233.
'Efthymiou, D. and 'Antoniou, C. 2013. How do transport infrastructure and policies affect house prices and rents? Evidence from Athens, Greece. Transportation Research Part A, 52 pp. 1-22. Available at: http://dx.doi.org/10.1016/j.tra.2013.04.002 [Accessed 10/3/2016].
Efthymiou, D. and Antoniou, C. 2013. How do transport infrastructure and policies affect house prices and rents? Evidence from Athens, Greece. Transportation Research Part A, 52 pp. 1-22.
Fainstein, S. S., 2012. Land value capture and justice. In: G. K. Ingram and Y. Hong eds., 2012. Value capture and land policies. Cambridge: Lincoln Institute of Land Policy. pp. 21-20.
Giyarsih, S. R., 2010. Urban Sprawl of the City of Yogyakarta, Special Reference to the Stage of Spatial Transformation. Indonesian Journal of Geography, 42 (1), pp. 47-58. Available at: https://jurnal.ugm.ac.id/ijg/article/view/1576/pdf_9 .
Glaeser, E. L. and Ward, B. A. 2009. The causes and consequences of land use regulation: Evidence from Greater Boston. Journal of Urban Economics, 65 pp. 265-278. [Accessed 19 April 2016].
Harini, R., Yunus, H. S., Kasto and Hartono, S. 2012. Agricultural land conversion: Determinants and impact for food sufficiency in Sleman Regency. Indonesian Journal of Geography, 44 (2), pp. 120-133.
Impact of Land Use Regulation on Land Values
52

Ibeas, A., Cordera, R., dell'Olio, L., Coppola, P., et al., 2012. Modelling transport and real estate values interactions in urban systems. Journal of Transport Geography, 24 pp. 370-382. Available at: http://dx.doi.org/10.1016/j.jtrangeo.2012.04.012 [Accessed 10/3/2016].
Ihlanfeldt, K. R., 2007. The effect of land use regulation on housing and land prices. Journal of Urban Economics, 61 pp. 420-435.
Jaeger, W. K., 2013. Determinants of urban land market outcomes: Evidence from California. Land use Policy, 30 pp. 966-973.
Jaeger, W. K., Grout, C. and Plantinga, A. J. 2008. Evidence of the Effects of Oregon's Land Use Planning System on Land Prices. Lincoln Institute of Land Policy Working Paper, .
Kok, N., Monkkonen, P. and Quigley, J. M. 2014. Land use regulations and the value of land and housing: An intra-metropolitan analysis. Journal of Urban Economics, 81 pp. 136-148.
Monkkonen, P., 2013. Urban land-use regulations and housing markets in developing countries: Evidence from Indonesia on the importance of enforcement. Land use Policy, 34 pp. 255-264.
Mulley, C. and Tsai, C. H. 11/1/2016. When and how much does new transport infrastructure add to property values? Evidence from the bus rapid transit system in Sydney, Australia. Transport Policy, pp. 10/3/2016. Available at: http://dx.doi.org/10.1016/j.tranpol.2016.01.011 [Accessed 10/3/2016].
Rosen, S., 1974. Hedonic Prices and Implicit Markets: Product Differentiation in Pure Competition. Journal of Economics, pp. 34-55.
Shonkwiler, J. S. and Reynolds, J. S. 1986. A note on the use of Hedonic Price Models in the analysis of land prices at the urban fringe. Land Economics, 62 (1), pp. 58-63.
Sivam, A., 2002. Constraints affecting the efficiency of the urban residential land market in developing countries: a case study of India. Habitat International, 26 pp. 523-537.
Smith, J. J. and Gihring, T. A. 2006. Financing transit systems through value capture: An annotated bibliography. American Journal of Economics and Sociology, 65 (3), pp. 751-786.
Struyk, R. J., Hoffman, M. L. and Katsura, H. M., 1990. The market for shelters in Indonesian City. Washington D.C.: The Urban Institute.
Sutomo, Y. A. W., (unpublished) Urban development and its impact to agricultural sector in Sleman Regency, D.I. Yogyakarta Province, Indonesia<br />. Master Thesis. Rotterdam: Institute for Housing and Urban Development Studies.
Thiel, S. v., 2014. Operationalization. Operationalization. 2014. Research methods in public administration and public management : an introduction. London: Routledge. pp. 43-53.
Impact of Land Use Regulation on Land Values
53

Thirkell, A. J., 1996. Players in urban informal land markets; who wins? who loses? A case study of Cebu City. Environment and Urbanization, 8 (2), pp. 71-90.
Verschuren, P. and Doorewaard, H. 2010. Research stategies. Research stategies. 2010. Designing a research project. The Hague: Eleven International Publishing. pp. 155-186.
Walters, L. C., 2013. Land Value Capture in Policy and Practice. Journal of Property Tax Assessment and Administration, 10 (2), pp. 5-21.
Wardani, F. and Kurniawan, A. Kinerja koridor jaringan Jalan Kaliurang dan Jalan Parangtritis, Propinsi Daerah Istimewa Yogyakarta. Jurnal Bumi Indonesia, 1 (2), pp. 13 August 2016. Available at: http://lib.geo.ugm.ac.id/ojs/index.php/jbi/article/view/24 .
Yin, R. K., 1981. The case study crisis: some answers. Administrative Science Quarterly, 26 (1), pp. 58-65.
Zhou, J., McMillen, D. P. and McDonald, J. F. 2008. Land Values and the 1957 Comprehensive Amendment to the Chicago Zoning Ordinance. Urban Studies, 45 (8), pp. 1647-1661.
Impact of Land Use Regulation on Land Values
54

Annex 1: Location of sample
Impact of Land Use Regulation on Land Values
55

Annex 2: Questionnaire (Research Instrument)
Questionnaire for Land Transaction Data Questionnaire number: _________
A. Transaction Attribute 1. When the land is being transacted?
Answer: __________________________
2. What is the size of land being transacted? (in m2)
Answer:_______________m2
3. What is the land ownership status when the plot was being transacted?
a. Sertifikat Hak Milik (Certificate of Ownership)
b. Hak Guna Usaha (Right of Use Certificate)
c. Letter C (Right of Use Letter)
4. What was the land use status when being transacted?
a. Sawah (Farmland)
b. Pekarangan (Developable land)
5. How much the price of plot when it was transacted?
Answer: ____________________
B. Location Attribute
1. What is the geographical reference for the land being transacted? (Using projection of
Universal Transverse Mercator/UTM Zone 49S)
a. X :
b. Y :
2. In what area is the plot located?
a. Sariharjo
b. Sinduharjo
c. Minomartani
d. Sukoharjo
e. Sardonoharjo
f. Donoharjo
Impact of Land Use Regulation on Land Values
56

C. Accessibility Attributes
1. Is the plot share side with road?
a. Yes
b. No
2. What type of road share side with the plot?
a. Artery road/National Road
b. Provincial road
c. Local road
3. What is the surface of the road share side with the plot?
a. Not paved
b. Paved
c. Hot mix
d. Asphalted
Impact of Land Use Regulation on Land Values
57
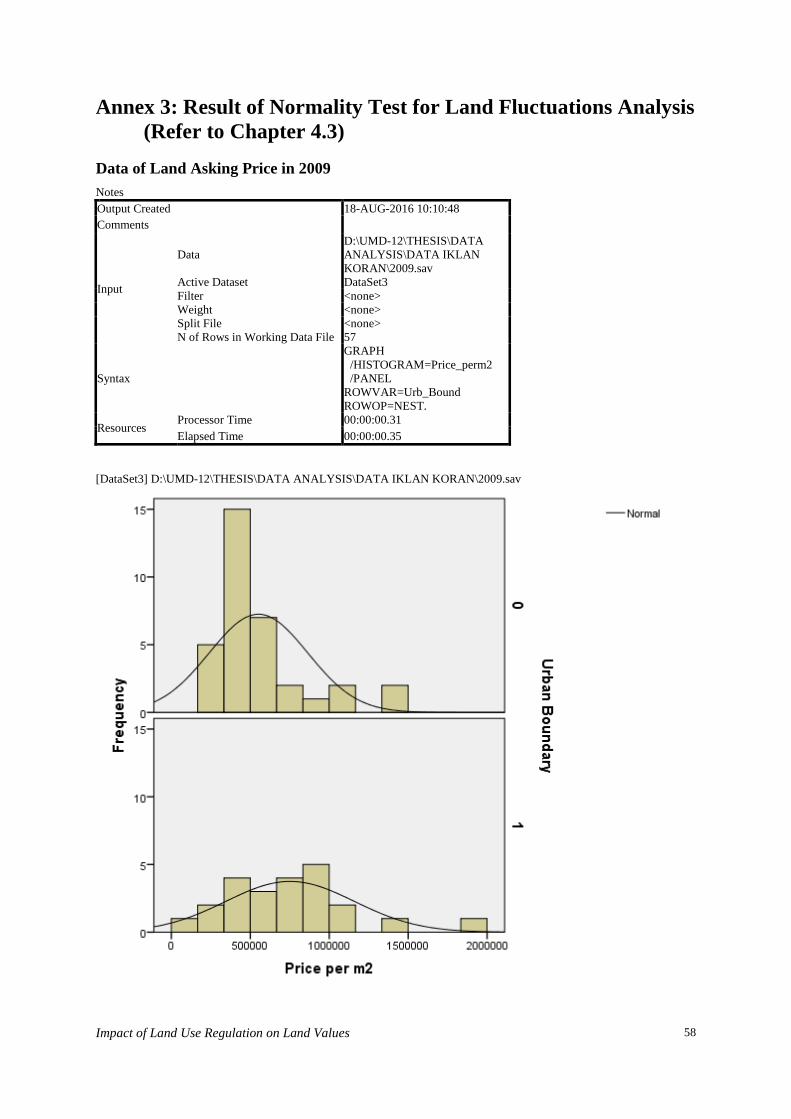
Annex 3: Result of Normality Test for Land Fluctuations Analysis (Refer to Chapter 4.3)
Data of Land Asking Price in 2009 Notes Output Created 18-AUG-2016 10:10:48 Comments
Input
Data D:\UMD-12\THESIS\DATA ANALYSIS\DATA IKLAN KORAN\2009.sav
Active Dataset DataSet3 Filter <none> Weight <none> Split File <none> N of Rows in Working Data File 57
Syntax
GRAPH /HISTOGRAM=Price_perm2 /PANEL ROWVAR=Urb_Bound ROWOP=NEST.
Resources Processor Time 00:00:00.31 Elapsed Time 00:00:00.35
[DataSet3] D:\UMD-12\THESIS\DATA ANALYSIS\DATA IKLAN KORAN\2009.sav
Impact of Land Use Regulation on Land Values
58

Data of land asking price in 2012 Notes Output Created 18-AUG-2016 10:15:21 Comments
Input
Data D:\UMD-12\THESIS\DATA ANALYSIS\DATA IKLAN KORAN\2012.sav
Active Dataset DataSet4 Filter <none> Weight <none> Split File <none> N of Rows in Working Data File 44
Syntax
GRAPH /HISTOGRAM=Price_perm2 /PANEL ROWVAR=Urb_Bound ROWOP=NEST.
Resources Processor Time 00:00:00.28 Elapsed Time 00:00:00.26
[DataSet4] D:\UMD-12\THESIS\DATA ANALYSIS\DATA IKLAN KORAN\2012.sav
Impact of Land Use Regulation on Land Values
59

Data of land asking price in 2015 Notes Output Created 18-AUG-2016 10:17:03 Comments
Input
Data D:\UMD-12\THESIS\DATA ANALYSIS\DATA IKLAN KORAN\2015.sav
Active Dataset DataSet5 Filter <none> Weight <none> Split File <none> N of Rows in Working Data File 181
Syntax
GRAPH /HISTOGRAM=Price_perm2 /PANEL ROWVAR=Urb_Bound ROWOP=NEST.
Resources Processor Time 00:00:00.19 Elapsed Time 00:00:00.20
[DataSet5] D:\UMD-12\THESIS\DATA ANALYSIS\DATA IKLAN KORAN\2015.sav
Impact of Land Use Regulation on Land Values
60
Annex 4: IHS copyright form In order to allow the IHS Research Committee to select and publish the best UMD theses, participants need to sign and hand in this copy right form to the course bureau together with their final thesis.
Criteria for publishing:
A summary of 300 to 500 words should be included in the thesis.
The number of pages for the thesis is about 60.
The thesis should be edited.
Please be aware of the length restrictions of the thesis. The Research Committee may choose not to publish very long and badly written theses.
By signing this form you are indicating that you are the sole author(s) of the work and that you have the right to transfer copyright to IHS, except for items cited or quoted in your work that are clearly indicated.
I grant IHS, or its successors, all copyrights to the work listed above, so that IHS may publish the work in The IHS thesis series, on the IHS web site, in an electronic publication or in any other medium.
IHS is granted the right to approve reprinting.
The author(s) retain the rights to create derivative works and to distribute the work cited above within the institution that employs the author.
Please note that IHS copyrighted material from The IHS thesis series may be reproduced, up to ten copies for educational (excluding course packs purchased by students), non-commercial purposes, providing full acknowledgements and a copyright notice appear on all reproductions.
Thank you for your contribution to IHS.
Date : 17 October 2016
Your Name(s) : A.Yunastiawan Eka Pramana
Your Signature(s) : ______________________________________
Please direct this form and all questions regarding this form or IHS copyright policy to:
The Chairman, IHS Research Committee Burg. Oudlaan 50, T-Building 14th floor, 3062 PA Rotterdam, The Netherlands
[email protected] Tel. +31 10 4089851
Impact of Land Use Regulation on Land Values
61