msc in statistics - lancaster university · pdf file2 section contents page 1 introduction to...
TRANSCRIPT

Lancaster University
Postgraduate Statistics Centre
MSc in Statistics
Course Handbook 2014/2015
Department of Mathematics and Statistics
www.maths.lancs.ac.uk/psc

2
Section Contents Page
1
Introduction to the University and the Mathematics and
Statistics Department
3
2
Introduction to the MSc Programme in Statistics
5
3
The MSc Course Structure
8
4
Department Contacts, Course Applications and Funding
10
5
Module Descriptions
11
6
MSc Assessment Arrangements
25
7
Criteria for Awarding Degrees
27
8
Dissertation Guidelines
29
9
Submission of Coursework
30
10
Society Membership 31
If you are experiencing difficulty in reading this booklet it can be made
available in alternative formats. Please contact:
Jane Hall,
Postgraduate Coordinator,
B76, Postgraduate Statistics Centre, Lancaster University.
Telephone: 01524 593964
e-mail: [email protected]
3
1. Introduction to the University and the Mathematics and
Statistics Department
Lancaster University is a campus-style university, established in the early 1960’s on a partly wooded,
landscaped site at Bailrigg, about three miles south of Lancaster city centre. The campus includes
laboratories and offices, student residences, shops, banks, bars, and indoor and outdoor sports facilities on
a single site. Lancaster itself is a small city, with a rich history going back to Roman times. Relative to its
size (population approximately 50,000) it has a good shopping centre and very lively entertainment. The
surrounding countryside varies between pleasant and superb, including the National Parks of the
Yorkshire Dales to the east and the Lake District to the north. The much larger cities of Manchester and
Liverpool are about 50 miles to the south.
The University was awarded £4.8 million from the Higher Education Funding Learning Council for
England to establish a National Centre for Excellence in Teaching and Learning (CETL) in Postgraduate
Statistics. In February 2008 the Postgraduate Statistics Centre was opened, boasting, amongst other things,
a lecture theatre; seminar rooms; fixed and flexible computer laboratories; teleconferencing facilities;
together with flexible working and ‘break-out’ areas. The facilities for students following the MSc in
Statistics are located in this building and include a dedicated base-room and social area:
www.maths.lancs.ac.uk/psc. Lectures, labs and workshops will typically take place in this purpose-built
environment. The offices of the Department of Mathematics and Statistics are located in the Postgraduate
Statistics Centre and in B floor of Fylde College, to which the PSC is connected by a linking-bridge.
The centre has the core aim of achieving excellence in postgraduate teaching by enhancing and extending
existing excellent practice in quantitative postgraduate training both to specialist statisticians and to users
of statistics in other disciplines. It is an integral part of the Department of Mathematics and Statistics
which boasts one of the UK’s leading research groups in statistics with a world-class reputation for work
at the interface between theory and application, and a vibrant pure mathematics research group
specialising in algebra and analysis.
1.1 History, Research and Teaching Ethos
The Department of Mathematics and Statistics at Lancaster University has an excellent research reputation
and is involved in range of research areas such as Pure Mathematics, Operations Research, Statistics,
Computational Methods, Extremes and Medical and Pharmaceutical Statistics.
Almost all of our statistics research involves the development of new statistical methodology, but is
largely motivated by applied problems arising in the natural, social and biomedical sciences. This position
at the interface between theory and application gives Lancaster’s statistical research a distinctive flavour
and involves frequent and close collaboration with colleagues in other university departments, local
research institutes and hospitals. We currently have links with Biological Sciences, Environmental
Science and The Management School, but also individual contacts with many other departments. Further
details of the research in the department can be found from the list of staff research interests, Section 1.2,
or the research group pages on the web: www.maths.lancs.ac.uk/department/research/statistics.
The Department has a number of active seminar series in statistics: the main Statistics Seminars, at which
visiting researchers present their work, are on Friday afternoons; the internal Statistics Forum series runs
on Thursday lunchtimes; and there are also Royal Statistical Society local group meetings, and various
specialist seminar series in areas such as computational statistics, statistical genetics, extreme value
methods and statistical methods for the pharmaceutical industry.
http://www.lancs.ac.uk/fas/maths/events/

4
Together with a strong reputation for internationally recognised research in statistics, the department has a
proven record in terms of provision of Masters and Postgraduate level courses and teaching. To this end
the Department attracted £4.8 million in Education Council funding (HEFCE) and has established a
Centre of Excellence in Teaching and Learning uniquely specialising in postgraduate statistics.
http://www.lancs.ac.uk/fas/maths/
1.2 Lecturing Staff and Research Interests
Below are the titles, names and research interests of staff who lecture/contribute to the MSc course.
Professors Peter Diggle Spatial statistics, longitudinal data analysis and environmental epidemiology
Paul Fearnhead Computational statistics; applications in population genetics; particle filters;
perfect simulation
Jonathon Tawn Extreme value theory: theory, methods and applications
Readers
Thomas Jaki Bioinformatics; pharmaceutical statistics and statistical education
Peter Neal Stochastic epidemic models; Markov chain Monte Carlo; approximate Bayesian
computation; integer valued time series.
Senior Lecturers
Gillian Lancaster Methodological and applied aspects of statistical epidemiology. Ecological bias.
Clustered observational studies. Child health outcome measures
Chris Sherlock Stochastic processes, MCMC, mixed modelling, geostatistics and veterinary
epidemiology
Lecturers
Deborah Costain Medical statistics; spatial epidemiology; computational methods: MCMC, RJMCMC;
case-control methods
Emma Eastoe Extreme value theory; environmental statistics
Lisa Hampson Medical statistics; clinical trials; causal inference; pharmacological modelling;
Bayesian statistics.
Rebecca Killick Nonstationary time series, wavelets, change points.
Michalis Kolossiatis Bayesian nonparametric modelling, density estimation, econometrics, stochastic
frontier models and machine learning.
Matt Nunes Multiscale methods; wavelets; time series; variance stabilization; ABC.
Tom Palmer Causal inference, epidemiology, instrumental variable methods, medical statistics,
Mendelian randomization studies.
Juhyun Park Nonparametric regression and functional data analysis
Gareth Ridall MCMC, RJMCMC, graphical models, stochastic processes in time
Ben Taylor Computational Statistics, spatial and spatiotemporal statistics, log-Gaussian Cox
processes, exact and Monte-Carlo filtering, Bayesian statistics
Andrew Titman Medical statistics, survival data, multi-state models
Jenny Wadsworth Extreme value theory; dependence modelling; applications in environmental problems

5
2. Introduction to the MSc Programme in Statistics
2.1 Background, Course Aims and the Working Environment
The MSc in Statistics aims to equip graduates with the skills necessary to follow statistical careers, within business,
finance, industry, universities, other research institutes, or for progression to a PhD in statistics. There is currently
an under-supply of well-qualified statisticians, both in the UK and overseas, and we have a strong record of our
graduates progressing to careers which directly use the statistical competencies developed during the MSc,
including a sizeable proportion of our graduates proceeding to PhD’s in statistics.
The MSc course aims to provide a thorough training in statistics via a distinctive blend of leading-edge
methodology and practical techniques. The course comprises the following distinctive features:
A set of core modules covering the theory and methods of statistical inference on which modern applied
statistics relies;
A set of optional modules (five chosen from nine) covering a range of advanced/specialist statistical methods
relevant to the design, analysis and interpretation of observational and experimental data;
A practical statistics module focusing upon the skills necessary for the working statistician including,
statistical computing, oral and written communication and consulting.
An in-depth project applying statistical methods to a substantive problem in applied statistics research, giving
students experience of many aspects of the career of a statistician: problem forming, literature review, data
analysis, interpretation of results, report writing and collaboration;
An option to follow designated pathways in Environmental, Medical or Pharmaceutical Statistics (Section
2.2).
More generally the MSc course provides extensive experience of hands-on statistical computing involving modern
computationally intensive statistical methods available for data analysis. In addition, competence in the analysis of
large and complex data sets; the ability to select appropriate statistical methods for the problem to hand; an
awareness of the need for critical assessment of assumptions and the consequences of model misspecification are
conveyed.
RSS accreditation
‘The course is accredited by the Royal Statistical Society (RSS) as being of the appropriate breadth and depth to
provide a foundation for a career as a professional statistician. Success on the course automatically qualifies you for
the RSS Graduate Statistician (GradStat) award. This award is a stepping stone to full professional membership of
the RSS and the Chartered Statistician (CStat) award. More details can be found at:
www.rss.org.uk/professionalmembership’
2.2 Pathways in Medical Statistics, Pharmaceutical Statistics and Environmental
Statistics
Students can select their optional modules and dissertation topic to follow designated pathways in:
Environmental Statistics (E);
Medical Statistics (M);
Pharmaceutical Statistics (P).
These topics reflect the research interests and expertise within the Department and prepare students for particular
career options in areas with high demand for trained statisticians. Module specific details, by pathway, are provided
in Section 3.1.2.
6
2.3 Careers and Employability
The employability and progression of our students is paramount and our track record has proven to be second to
none. Over 95% of our students over the past three years have found employment/research posts which require their
masters level training. To this end, support regarding accessing information relating to current vacancies/research
opportunities; completing application forms and CV preparation is provided via the Course Tutor. In addition,
representatives from external organisations, academic staff and research students are invited to give careers talks
throughout the year; which in turn assist students in their choice of career.
2.4 The Working Environment
Students are strongly encouraged to make the Department and facilities in the Postgraduate Statistics Centre their
working base. Academic staff, research staff and research students will all be pleased to give informal statistical
advice when asked. Computing and (modest) library facilities are available within the Postgraduate Statistics
Centre, as are flexible working and break-out areas aimed at enriching the learning and teaching experience.
Morning coffee each day in the Postgraduate Statistics Centre provides a valuable opportunity to meet and interact
socially with members of the department. Kitchen facilities, showers and storage lockers are also available.
Seminars and forums, which usually describe recent statistical research by internal or visiting speakers, are held
regularly during term-time. MSc students are encouraged to, and benefit greatly from, attending a selection of them.
2.5 Student Welfare and Support
Academic and pastoral support is provided within the Department by the MSc Course Tutor, the Course Director,
the course lecturers and latterly the dissertation supervisors. The MSc Tutor has a timetabled fortnightly meeting
with the MSc cohort to discuss course issues and is available for personal support and advice throughout the year.
One-to-one sessions are also held at regular intervals. Module tutors provide individual support during scheduled
‘office-hours’.
The University, more generally, operates a layered safety net, with a series of systems in place to offer academic,
administrative and personal advice and support. All Master’s students are automatically members of Graduate
College. Students have access to the facilities offered by the library and the Department postgraduate library.
Students have access to a wide range of University and Department equipment and IT facilities
2.6 Attendance
For each study module all time-tabled lectures, lab sessions and tutorials are compulsory. Tutorials with the MSc
Course Tutor and scheduled career sessions are also compulsory. For all compulsory sessions attendance is
monitored.
2.6.1 Modes of attendance
Full-time: one-year
The academic year runs from October to September and consists of Michaelmas, Lent and Summer terms.
Lectures take place during the Michaelmas (October to December: weeks 1 - 10) and Lent (January to March:
weeks 11 – 20) University terms. Exams are timetabled in May and June, after which the dissertation is prepared
(June to September). Details of the course structure, module descriptions and assessment arrangements are,
respectively, provided in Sections 3, 5 and 6.
Modules delivered during Michaelmas term are typically presented over a five week period (MATH552: GLM’s
four weeks). Excluding Statistics in Practice ( MATH550: see below) each core module consists of twenty five
contact hours (lectures/labs) spread over the 5 week period. Each week coursework exercises are set but are not
assessed. In the final week of the module there is a phase- test and for each module there is also a module specific
project.

7
With the exception of Genomics, modules presented during Lent term (weeks 11 - 20) each run over two weeks and
comprise of an intensive period of lectures and labs (typically 20 hours over four days) followed by a period for
module specific project work.
The Statistics in Practice module (MATH461) has its own structure and is spread over both terms (weeks 1 – 20).
Full-time students are expected to be available for attendance at the University throughout the year. Eight weeks
holiday are permitted of which two weeks are normally taken at the end of September.
2.6.2 Part-time: over two years Arrangements can be made for part-time students (studying over two years) under the general principle that such
students will complete the equivalent of one year of full-time study before completing the degree.
The two year arrangement is designed for students who are able to attend classes at the University on a regular
basis. Such students will typically follow half of the taught modules that are available during each of the
Michaelmas (weeks 1-10) and Lent (weeks 11-21) terms during each of their two years. Assessment will be made
during the respective year of study alongside full-time students studying the module.
Subject to time-tabling and module pre-requisites, a suitable split of the modules will be designed for individual
students; recognising their other time constraints and previous knowledge. Students will begin their dissertation
during the first summer following registration on the course, and complete it and write their dissertation during the
second summer.
2.6.3 Attendance for Examinations, dissertation submission dates, assessment and
awards
Students have to be present at the University for all written examinations.
Part-time students undertake examinations for modules studied during the same examination period as full-time
students. They should submit the dissertation by the same deadline stipulated for full-time students in their second
year of study.
The scheme of credits, assessment and awards described in Sections 3, 6, 7 and 8 apply to both full- and part-time
students.
2.7 Admissions Criteria
Admission to the course is typically based upon a BSc of at least second-class honours standard in a subject with a
substantial component of mathematics and statistics. We welcome well-motivated applicants from other disciplines
who wish to convert to statistics.
Students whose first language is not English should demonstrate competence in English by passing IELS
assessment grade 6.5 (see FAQ for further details and alternative qualifications).
The admission criteria are the same for full-time students and part-time students. Information regarding
funding, applications and course enquiries is provided in Section 4.
8
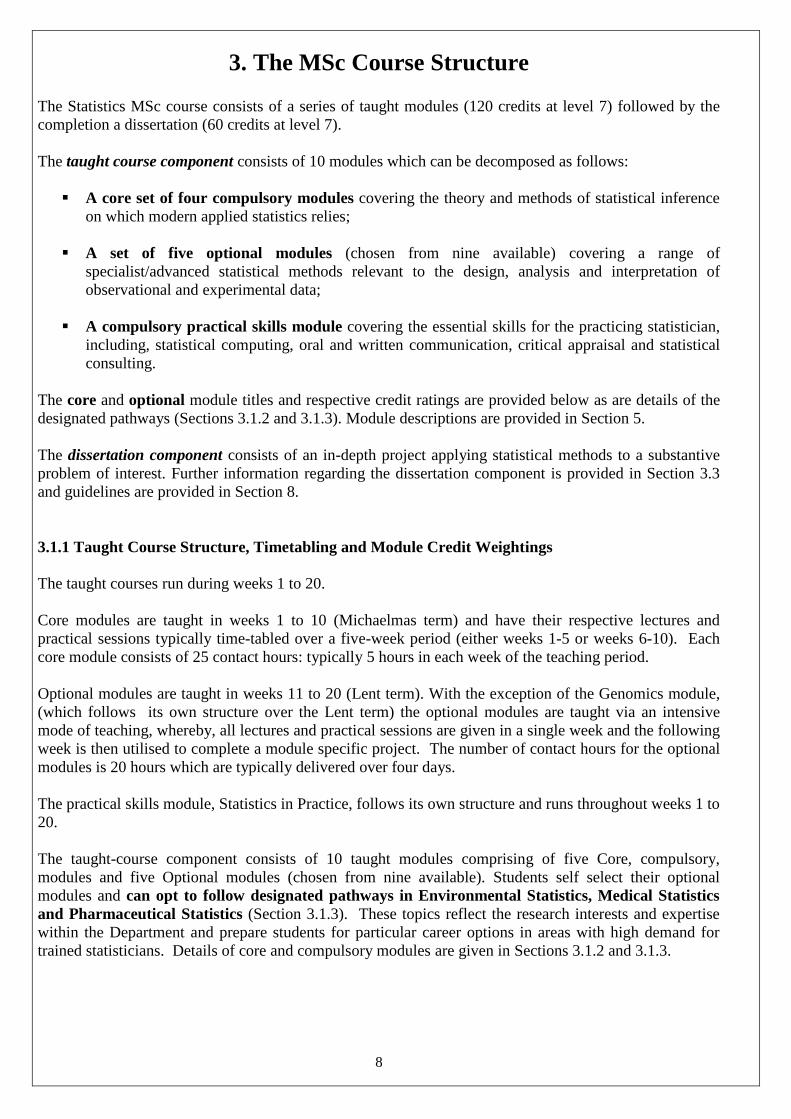
3. The MSc Course Structure The Statistics MSc course consists of a series of taught modules (120 credits at level 7) followed by the
completion a dissertation (60 credits at level 7).
The taught course component consists of 10 modules which can be decomposed as follows:
A core set of four compulsory modules covering the theory and methods of statistical inference
on which modern applied statistics relies;
A set of five optional modules (chosen from nine available) covering a range of
specialist/advanced statistical methods relevant to the design, analysis and interpretation of
observational and experimental data;
A compulsory practical skills module covering the essential skills for the practicing statistician,
including, statistical computing, oral and written communication, critical appraisal and statistical
consulting.
The core and optional module titles and respective credit ratings are provided below as are details of the
designated pathways (Sections 3.1.2 and 3.1.3). Module descriptions are provided in Section 5.
The dissertation component consists of an in-depth project applying statistical methods to a substantive
problem of interest. Further information regarding the dissertation component is provided in Section 3.3
and guidelines are provided in Section 8.
3.1.1 Taught Course Structure, Timetabling and Module Credit Weightings
The taught courses run during weeks 1 to 20.
Core modules are taught in weeks 1 to 10 (Michaelmas term) and have their respective lectures and
practical sessions typically time-tabled over a five-week period (either weeks 1-5 or weeks 6-10). Each
core module consists of 25 contact hours: typically 5 hours in each week of the teaching period.
Optional modules are taught in weeks 11 to 20 (Lent term). With the exception of the Genomics module,
(which follows its own structure over the Lent term) the optional modules are taught via an intensive
mode of teaching, whereby, all lectures and practical sessions are given in a single week and the following
week is then utilised to complete a module specific project. The number of contact hours for the optional
modules is 20 hours which are typically delivered over four days.
The practical skills module, Statistics in Practice, follows its own structure and runs throughout weeks 1 to
20.
The taught-course component consists of 10 taught modules comprising of five Core, compulsory,
modules and five Optional modules (chosen from nine available). Students self select their optional
modules and can opt to follow designated pathways in Environmental Statistics, Medical Statistics
and Pharmaceutical Statistics (Section 3.1.3). These topics reflect the research interests and expertise
within the Department and prepare students for particular career options in areas with high demand for
trained statisticians. Details of core and compulsory modules are given in Sections 3.1.2 and 3.1.3.
9
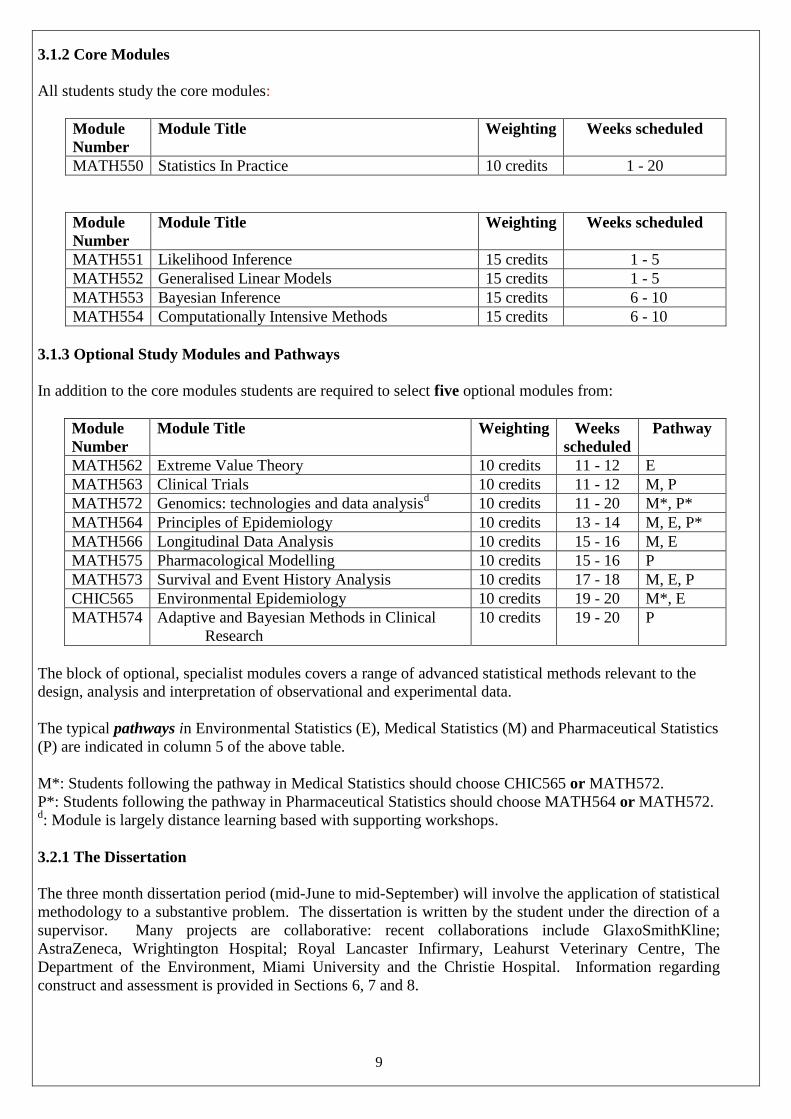
3.1.2 Core Modules
All students study the core modules:
Module
Number
Module Title Weighting Weeks scheduled
MATH550 Statistics In Practice 10 credits 1 - 20
Module
Number
Module Title Weighting Weeks scheduled
MATH551 Likelihood Inference 15 credits 1 - 5
MATH552 Generalised Linear Models 15 credits 1 - 5
MATH553 Bayesian Inference 15 credits 6 - 10
MATH554 Computationally Intensive Methods 15 credits 6 - 10
3.1.3 Optional Study Modules and Pathways
In addition to the core modules students are required to select five optional modules from:
Module
Number
Module Title Weighting Weeks
scheduled
Pathway
MATH562 Extreme Value Theory 10 credits 11 - 12 E
MATH563 Clinical Trials 10 credits 11 - 12 M, P
MATH572 Genomics: technologies and data analysisd 10 credits 11 - 20 M*, P*
MATH564 Principles of Epidemiology 10 credits 13 - 14 M, E, P*
MATH566 Longitudinal Data Analysis 10 credits 15 - 16 M, E
MATH575 Pharmacological Modelling 10 credits 15 - 16 P
MATH573 Survival and Event History Analysis 10 credits 17 - 18 M, E, P
CHIC565 Environmental Epidemiology 10 credits 19 - 20 M*, E
MATH574 Adaptive and Bayesian Methods in Clinical
Research
10 credits 19 - 20 P
The block of optional, specialist modules covers a range of advanced statistical methods relevant to the
design, analysis and interpretation of observational and experimental data.
The typical pathways in Environmental Statistics (E), Medical Statistics (M) and Pharmaceutical Statistics
(P) are indicated in column 5 of the above table.
M*: Students following the pathway in Medical Statistics should choose CHIC565 or MATH572.
P*: Students following the pathway in Pharmaceutical Statistics should choose MATH564 or MATH572. d: Module is largely distance learning based with supporting workshops.
3.2.1 The Dissertation
The three month dissertation period (mid-June to mid-September) will involve the application of statistical
methodology to a substantive problem. The dissertation is written by the student under the direction of a
supervisor. Many projects are collaborative: recent collaborations include GlaxoSmithKline;
AstraZeneca, Wrightington Hospital; Royal Lancaster Infirmary, Leahurst Veterinary Centre, The
Department of the Environment, Miami University and the Christie Hospital. Information regarding
construct and assessment is provided in Sections 6, 7 and 8.
10
4. Department Contacts, Applications and Funding.
4.1 MSc Course Tutor and Secretary
There is a designated MSc Course Tutor, Dr. Chris Sherlock, whose role is to provide academic guidance to
students on the programme together with pastoral support. Tutorials are held on a fortnightly basis to provide a
constant means of communication between staff and students. One-to-one sessions are also held at regular intervals
throughout term-time.
e-mail: [email protected]
The course is supported by a designated secretary, Jane Hall, who can assist students with enquiries about course
materials, class schedules etc. You may also wish to contact Jane Hall to arrange a visit to the
University/Department prior to your application/arrival.
e-mail: [email protected]
4.2 Applications and Funding
A number of studentships (fees and stipend) are available from the Medical Research Council (MRC) and the
National Institute for Health Research (NIHR). In addition, a number of Faculty bursaries are typically available
which help towards fees. Early applications are recommended.
Students eligible for funding will be considered automatically. A series of open/interview days are typically
held during February to April.
Applications for the course should be made online via URL:
http://www.postgraduate.lancs.ac.uk/Pages/default.aspx
In addition to filling in the on-line forms you will need to provide details of two consenting referees, including their
e-mail addresses. You will also need to upload your academic transcript or to make arrangements for the transcript
to be sent in the post.
Detailed information is available on the above web site, or for more information on how to apply you may wish to
contact:
Postgraduate Admissions
Faculty of Science and Technology
Lancaster University
LANCASTER
LA1 4YR
email: [email protected]
Once all the necessary information has been received (application form, academic transcript and references) the
Faculty Admissions Officer will usually make a recommendation within a few days. You will receive an email
informing you that the offer letter from Admissions is available on the online application system.
We encourage successful applicants from the UK to visit the department to discuss the course and the possibilities
for funding, and we are able to provide rail fare to fund a visit.

11
5. MSc Module Descriptions
This section provides descriptions of the Statistics MSc modules, in order of module number, including references
for further reading.
MATH550: Statistics in Practice
Objectives of the module:
The aim of this module is to provide students with a range of skills which are necessary for applied statistical work,
including team-working, oral presentation, statistical consultancy, statistical computing, the preparation of written
reports and professionalism.
Syllabus
Computing
- Core computing skills (e.g. local computing facilities: Microsoft)
- R (R objects and functions, graphs, writing functions, basic simulation & programming)
- SAS (data management, descriptive statistics, graphs, SAS functions, SAS procedures for analysis)
- LaTeX
- Beamer
Scientific writing - LaTeX as a type-setting package
- Scientific writing: style and structure (e.g. IMRAD: journal article)
- Graphical and tabular presentation
- Literature searching and referencing
- Plagiarism
- Planning and time management
Oral presentation - How to communicate orally effectively (e.g. good and bad-habits in public speaking)
- Design of slides/overheads/handouts
- Beamer as a presentation package
Study design, consultancy and communication - Principles of good study design
- Critical appraisal
- The role of the statistician in the research process
- Consolidate the skills necessary to perform as a junior statistical consultant, including professionalism
- Team working
Learning objectives
On successful completion of the module students will be able to use statistical and type-setting software;
demonstrate appropriate report writing structure; present data and results appropriately using graphics and tables,
present work orally and undertake basic statistical consulting.
Assessment: 100% coursework
The assessment consists of two pieces of coursework under the headings:
60%: combined computing and writing assignment: (programming component: wring source code in R and
statistical analysis using R, scientific writing component: using LaTeX and to include mathematical, tabular and
graphical content, report writing structure, clarity and referencing)
40%: written report of an analysis in SAS.
Oral presentation
Students will also give a group presentation and present the work related to their dissertation orally in the Summer.
Bibliography
Chatfield C. (1988) Problem solving. Chapman and Hall, London.
Dalgaard P. (2002) Introductory statistics with R. Springer, New York.
Lamport L. (1994) LaTeX: a document preparation system. Addison Wesley.
Tufte E.R. (2001) The visual display of quantitative information. Graphics Press.

12
MATH551 Likelihood Inference
Prerequisites: Basic probability to the level of Math230
Description:
Statistical theory is the theory of the extraction of information about the unknown parameters of an
underlying probability model from observed data. This underpins all practical statistical applications, such
as those considered in later modules.
This course considers how the likelihood function, the probability of the observed data viewed as a
function of unknown parameters, can be used to make inference about those parameters. This inference
includes both estimates of the values of these parameters, and measures of the uncertainty surrounding
these estimates. We consider multi-parameter models, and models which do not assume the data are
independent and identically distributed. We also cover basic computational aspects of likelihood inference
that are required in many practical applications.
Objectives
On successful completion of this module students will be able to appreciate how information about the
unknown parameters is obtained and summarized via the likelihood function; be able to calculate the
likelihood function for some statistical models which do not assume independent identically distributed
data; be able to evaluate point estimates and make statements about the variability of these estimates;
understand about the interrelationships between parameters, and the concept of orthogonality; be able to
perform hypothesis tests using the generalised likelihood ratio statistic; use computational methods to
calculate maximum likelihood estimates.
Syllabus:
The course presents the key tools for statistical inference, stressing the fundamental role of the likelihood
function. It will cover:
Definition of the likelihood function for multi-parameter models, and how it is used to calculate
point estimates (maximum likelihood estimates).
Asymptotic distribution of the maximum likelihood estimator, and the profile deviance, and how
these are used to quantify uncertainty in estimates.
Inter-relationships between parameters, and the definition and use of orthogonality.
Generalised Likelihood Ratio Statistics, and their use for hypothesis tests.
Calculating likelihood functions for non-iid data.
Simple use of computational methods to calculate maximum likelihood estimates.
Bibliography:
A Azzalini Statistical Inference: Based on the Likelihood. Chapman and Hall 1996
D R Cox and D V Hinkley Theoretical Statistics. Chapman and Hall 1974
Y Pawitan In All Likelihood: Statistical Modeling and Inference Using Likelihood. OUP 2001
13
MATH552: Generalised Linear Models
Pre/co-requisite: MATH551.
Objectives of the module:
Generalised linear models are now one of the most frequently used statistical tools of the applied
statistician. They extend the ideas of regression analysis to a wider class of problems that involves
exploring the relationship between a response and one or more explanatory variables. In this course we
aim to discuss applications of the generalised linear models to diverse range of practical problems
involving data from the area of biology, social sciences and time series to name a few and to explore the
theoretical basis of these models. By the end of the course students should be able to formulate sensible models
for sets of data, taking account of the motivation for data collection; fit and check these models in the statistical
package R; produce confidence intervals and tests corresponding to questions of interest; and state conclusions in
everyday language.
Description:
We introduce a large family of models, called the generalised linear models (GLMs), that includes the
standard linear regression model as a special case and to discuss the theoretical properties of these models.
We learn a common algorithm called iteratively reweighted least squares algorithm for the estimation of
parameters.
We fit and check these models with the statistical package R; produce confidence intervals and tests
corresponding to questions of interest; and state conclusions in everyday language.
Syllabus:
Model specification: choosing a suitable GLM; equivalent models; aliasing.
Fitting models: maximum likelihood estimation using R.
Effects of covariates: confidence intervals and tests of quantities of interest, interaction.
Variable selection: backwards stepwise selection of covariates.
Assessing model fit: deviance and Pearson residuals; leverage; residual deviance test of model fit;
over-dispersion.
Bibliography:
P. McCullagh and J. Nelder. Generalized Linear Models, Chapman and Hall, 1999.
A.J. Dobson, An Introduction to Generalised Linear Models, Chapman and Hall, 1990.
14
MATH553: Bayesian Inference
Prerequisites: MATH551
Objectives of the module:
This course aims to introduce the Bayesian view of statistics, stressing its philosophical contrasts with classical
statistics, its facility for including information other the data into the analysis and its coherent approach toward
inference and model section. By the end of the course the students should be able to formulate an appropriate prior
to a variety of problems, calculate, simulate from and interpret the posterior and the predictive distribution, to carry
out Bayesian model selection using the marginal likelihood and model checking using the predictive distribution.
Students should be able to carry out all of this using the
programming language R.
Syllabus:
Inference by updating belief.
The ingredients of Bayesian inference: the prior, the likelihood, the posterior, the predictive and the
marginal distributions.
Methods for formulating the prior
Conjugate priors for single parameter models
Regression
Sampling from the posterior and the predictive distribution in the case of conjugate priors.
For non-conjugate priors, sampling from the posterior using an approximation and then correcting for the
approximation using importance sampling-resampling methods.
Rejection sampling
Methods for summarising the posterior distribution Model checking using the predictive and model
selection using the marginal likelihood
Bibliography:
Gamerman and Lopez (2006). MCMC statistical simulation for Bayesian inference. Chapman and Hall 2nd Edition
Hoff, P (2008). A first course in Bayesian statistics. Springer.
Petris et al., (2009), Dynamic Linear Models with R, Springer UseR series
15
MATH554: Computationally Intensive Methods
Prerequisites: MATH551, MATH553
Objectives of the module:
To introduce the students to the Expectation-Maximisation (EM) and Markov chain Monte Carlo (MCMC)
algorithms. To introduce the application and implementation of MCMC to Bayesian statistics.
Description:
The first week of the course introduces students to the Expectation-Maximisation (EM) algorithm, an iterative
algorithm for obtaining the maximum likelihood estimate of parameters in problems with intractable likelihoods.
The remainder of the course introduces the use of Markov chain Monte Carlo (MCMC) methods as a powerful
technique for performing Bayesian inference on complex stochastic models. The course will introduce students to
the Metropolis-Hastings algorithm and in particular to special cases such as the Gibbs sampler, independence
sampler and random walk Metropolis. The introduction of the methods will be closely integrated with Bayesian
modelling techniques such as hierarchical modelling, random effects and mixture modelling. A common theme
running through both the discussion of the EM and MCMC algorithms will be data augmentation. The EM and
MCMC algorithms are implemented in the statistical package R.
Syllabus:
Expectation-Maximisation (EM algorithm)
Discrete Markov chains, detailed balance, ergodicity and stationary distributions.
Markov chains with a continuous state-space.
Bayesian inference and conjugacy; conditional conjugacy and Gibbs sampling.
Hierarchical models.
Data augmentation (auxiliary variables)
The random walk Metropolis, the independence sampler and the Metropolis-Hastings algorithm.
Estimation from the chain. Properties of these algorithms and rules of thumb for efficient implementation.
Assessing convergence, the Gelman-Rubin statistics. Efficiency, integrated autocorrelation time and
effective sample size.
Bibliography:
D. Gamerman and H. Lopes, Markov chain Monte Carlo: Stochastic simulation for Bayesian inference, Chapman
and Hall 2nd ed., 2006.
P. Hoff, A first course in Bayesian statistical methods, Springer, 2009.
W. Bolstad, Understanding computational Bayesian Statistics, Wiley, 2010.
W.R. Gilks, S. Richardson and D. Spiegelhalter, Markov chain Monte Carlo methods in Practice, Chapman and
Hall, 1996.
16
MATH562 Extreme Value Theory
Prerequisites: MATH551, MATH552
Objectives of the module:
This module aims to develop the asymptotic theory, and associated techniques for modelling and
inference, associated with the analysis of extreme values of random processes. The course will focus on
the mathematical basis of the models, the statistical principles for implementation and the computational
aspects of data modelling. Students are expected to acquire the following: an appreciation of, and facility
in, the various asymptotic arguments and models; an ability to fit appropriate models to data using
specially developed R software; the ability to understand and interpret fitted models.
Syllabus:
Asymptotic theory for maxima of univariate independent and identically distributed (iid) random
variables: limit distributions, GEV distribution, and domains of attraction.
Extension of asymptotic theory for univariate iid variables to cover top order statistics and
threshold exceedances: Poisson process and GP distribution.
Statistical modelling and inference using maxima and threshold methods.
Statistical modelling of extremes of non-identically distributed random variables.
Asymptotic theory and statistical methods for extreme values of stationary sequences: clustering,
extremal index.
Description:
For many physical processes, especially environmental processes, it is extremes of the process that are of
greatest concern; the highest sea-levels cause floods; the fastest wind-speeds destroy buildings, etc. Most
of the statistical theory is concerned with modelling typical behaviour; in contrast, the analysis of
extremes requires us to model the unusual. This means that we have very little data with which we can
either develop or estimate models. In the absence of alternatives, asymptotic theory is used as the basis for
model development, but the issue of data scarcity leads to interesting challenges for creating models that
make the best use of the data that is available.
Bibliography:
S G Coles, An Introduction to the Statistical Modelling of Extreme Values, Springer-Verlag, London,
2001.
17
MATH563: Clinical Trials
Prerequisites: probability and statistics to the level of MATH230 and MATH235; MATH550.
Description
Clinical trials are planned experiments on human beings designed to assess the relative benefits of one or more
forms of treatment. For instance, we might be interested in studying whether aspirin reduces the incidence of
pregnancy-induced hypertension; or we may wish to assess whether a new immunosuppressive drug improves the
survival rate of transplant recipients.
Objectives of the module:
This course aims to introduce students to aspects of statistics which are important in the design and analysis of
clinical trials. On completion of the module students should understand the basic elements of clinical trials, be able
to recognise and use principles of good study design, be able to analyse trial data appropriately and interpret study
results to make correct scientific inferences. Students will also have basic study design skills including reporting
the sample size specification and analyses plan in a study protocol and the ability to integrate ICH guidelines and
procedures in their work.
Syllabus:
This module combines the study of technical methodology with discussion of more general methodological and
ethical issues. The course begins with a discussion of the relative advantages and disadvantages of different types
of medical studies. Clinical trials as experimental designs are then defined and over viewed including sections on
good design (including: replication, randomisation, bias, control and ethics) and defining outcomes and
estimating treatment effects; both continuous and binary outcome measures are considered. Various topics are
then covered including: cross-over trials, sample size determination, equivalence and non-inferiority trials and
meta-analysis.
Bibliography:
D.G. Altman, Practical Statistics for Medical Research, Chapman and Hall, 1991.
S. Senn, Cross-over trials in clinical research, Wiley, 1993.
S. Piantadosi, Clinical Trials: A Methodological Perspective, John Wiley & Sons, 1997.
ICH Harmonised Tripartite Guidelines.
J.N.S. Matthews, Introduction to Randomised Controlled Clinical Trials, Arnold, 2000.

18
MATH564: Principles of Epidemiology
Prerequisites: Basic probability and statistics to the level of MATH230 and MATH235; MATH550,
computing (in R) and scientific writing (in LaTeX).
Objectives of the module:
Epidemiology is the study of the distribution and determinants of disease in human populations. This course
provides an introduction to the principles and statistical methods of epidemiology. Various concepts and strategies
used in epidemiological studies are examined. Most inference will be likelihood based, although the emphasis is on
conceptual considerations.
Syllabus:
The history of epidemiology and the role of statistics
Measures of health and disease: incidence, prevalence and cumulative incidence risk
Types of epidemiological studies: Randomized controlled trials, cohort studies, case-control studies, cross-
sectional and ecological studies
Causation in epidemiology
Potential errors in epidemiological studies: selection bias, confounding
Remedies for confounding: Standardized rates, stratification and matching
Diagnostic test studies
Bibliography:
R. Beaglehole, R. Bonita and T. Kjellstroem (2006) Basic epidemiology 2nd
edition. Geneva: World Health
Organization.
D. Clayton and M. Hills (1993) Statistical models in epidemiology. Oxford: Oxford University Press.
M. Woodward (2014) Epidemiology: Study design and data analysis, 3rd edition. Boca Raton: Chapman & Hall.
K.J. Rothman, S. Greenland and T.L. Lash. (2013) Modern Epidemiology 3rd
edition. Lippincott Williams &
Wilkins.

19
CHIC565: Environmental Epidemiology
Prerequisites: MATH551, MATH552, MATH564,
Objectives of the module:
This course aims to introduce students to the kinds of statistical methods commonly used by epidemiologists and
statisticians to investigate the relationship between risk of disease with environmental factors. Specifically the
course concentrates on studies with a spatial component. A number of published studies will be used to illustrate
the methods described, and students will learn how to perform similar analyses using the statistical package R. By
the end of the course students should have an awareness of the kinds of methods used in environmental
epidemiology, including an appreciation of their limitations. They should also be capable of conducting a number of
these analyses themselves.
The course will cover methods and theory for analysing point patterns, including univariate and bivariate K-
functions; methods for analysing case-control data including kernel intensity estimation, binary regression and
generalised additive models; spatial generalised linear mixed models including Poisson models for counts of a
disease in regions and the concept of ecological bias; modelling elevated disease risk due to the presence of a point
source; continuous spatial variation including the Gaussian geostatistical model, variograms and spatial prediction.
Syllabus:
Introduction: Motivating examples for methods in course.
Spatial Point Processes: theory and methods for the analysis of point patterns in two-dimensional space.
Clustering of disease: Case-control point-based methods and methods based on counts.
Spatial variation in risk: Case-control and point-based methods; generalised additive models.
Disease mapping: Investigating variation in risk with count data.
Geographical correlation studies: The ecological fallacy; relation with disease mapping.
Point source methods: Investigation of risk associated with distance from a point or line source, for point
and count data.
Geostatistics: Introduction to the analysis of geostatistical data. Kriging and spatial prediction.
Bibliography:
P. J. Diggle, Statistical Analysis of Spatial Point Patterns (2nd. Edition) London: Edward Arnold. 2003.
P. Elliott, J. Cuzick, D. English and R. Stern (eds.), Geographical and environmental epidemiology: methods for
small-area studies, Oxford University Press, Oxford, 1992.
P. Elliott, M. Martuzzi and G. Shaddick, Spatial statistical methods in environmental epidemiology: a critique.
Statistical methods in Medical Research, 4, 137-159, 1995.
P. Elliott, J. Wakefield, N. Best and D. Briggs (eds), Disease and Exposure Mapping. Oxford University Press,
Oxford, 1999.
L. A. Waller and C. A. Gotway. Applied Spatial Statistics for Public Health Data. Wiley. 2004.
20
MATH566: Longitudinal Data Analysis
Prerequisites: MATH551; MATH552
Objectives of the module:
Longitudinal data arise when a time-sequence of measurements is made on a response variable for each of a number
of subjects in an experiment or observational study. For example, a patient's blood pressure may be measured daily
following administration of one of several medical treatments for hypertension. The practical objective of many
longitudinal studies is to find out how the average value of the response varies over time, and how this average
response profile is affected by different experimental treatments. This module presents an approach to the analysis
of longitudinal data, based on statistical modelling and likelihood methods of parameter estimation and hypothesis
testing.
Syllabus:
What are longitudinal data?
Exploratory and simple analysis strategies;
The independence working assumption;
Normal linear model with correlated errors;
Mixed effects models;
Generalised estimating equations;
Dealing with dropout.
Bibliography:
H. Brown and R. Prescott, Applied Mixed Models in Medicine, Wiley, 1999.
P.J. Diggle, P. Heagerty, K.Y. Liang and S.L. Zeger, Analysis of Longitudinal Data (second edition), Oxford
University Press, 2002.
G.M. Fitzmaurice, N.M.Laird and J.H.Ware, Applied Longitudinal Analysis, Wiley, 2004.
G. Verbeke and G. Molenberghs, Linear Mixed Models for Longitudinal Data, Springer, 2000.
R. E. Weiss, Modelling longitudinal data, Springer, 2005.

21
MATH572: Genomics: technologies and data analyses
Prerequisites: Basic probability and statistics to the level of MATH550 computing and scientific writing.
Objectives of the module:
To describe several modern genomics technologies in their biological context, to describe the types of data that are
obtained from these technologies, to describe the statistical methodologies used to analyse such data and to have the
students use statistical packages to perform such analyses on example data sets and interpret the results.
Description:
Genomics is a large field dealing with everything from DNA to metabolites and from evolution to microbiology.
This course focuses on several genomics technologies by first of all putting them into their biological and genetic
context and secondly describing the types of biological questions that can be answered with the data from these
technologies. As an example of technologies that are to be discussed during this course are (i) DNA sequencing (ii)
SNP (iii) microarrays and (iv) blotting and other proteomics methods. The most commonly use statistical analysis
tools for each technology described will be discussed. The types of biological questions that are going to be
addressed relate to issues such as genomic variation, constant genome and changing expression, human evolution
and migration, disease and normality.
Syllabus:
DNA sequencing, Single Nucleotide Polymorphisms (SNPs), transcriptional analysis via microarrays and
Proteomics.
Visual methods, hypothesis testing, multiple testing problems, multivariate methods, regression analyses for
high dimensional data.
Bibliography:
Malcolm Campbell and Laurie J. Heyer. Genomics, Proteomics and Bioinformatics. CSHL Press, 2003.
Lange, K. Mathematical and Statistical Methods for Genetic Analysis, Springer, 2nd ed. 2002.
Wit, E. C. and McClure, J. D. Statistics for Microarrays: Design, Analysis and Inference, John Wiley & Sons, 2004.
22
MATH573: Survival and Event History Analysis
Prerequisites: MATH551, MATH552
Objectives of the module:
To develop the advanced theory and practical skills required for comprehensive analysis of complex medical
survival or recurrent event data sets. By the end of the course students should be competent to carry out
sophisticated analyses of data of this type, should be aware of the variety of statistical models and methods now
available, and in the importance of diagnostic methods and model development.
Description:
In many medical applications interest lies in times to or between events. Examples include time from diagnosis of
cancer to death, or times between epileptic seizures. This advanced course begins with a review of standard
approaches to the analysis of possibly censored survival data. Survival models and estimation procedures are
reviewed, and emphasis is placed on the underlying assumptions, how these might be evaluated through diagnostic
methods and how robust the primary conclusions might be to their violation.
In the latter part of the course an introduction to the use of counting processes for survival data is given and the
analysis of left-truncated and other incomplete data is discussed. The final sessions then cover different modelling
approaches for competing risks data and the analysis of clustered or recurrent event data.
Syllabus:
Survival data. Censoring. Survivor, hazard and cumulative hazard functions. Kaplan-Meier plots. Parametric models and likelihood construction. Cox proportional hazard model, partial likelihood, Nelson-Aalen estimators. Survival time prediction.
Counting processes. Intensity functions. Predictable variation. Event history data. Non-standard observation schemes.
Diagnostic methods. Schoenfeld and other residuals. Testing the proportional hazards assumption. Detecting changes in covariate effects. Aalen plots.
Frailty models and effects. Identifiability and estimation. Competing risks. Marginal models for clustered survival data.
Bibliography:
Collett, D. Modelling Survival Data in Medical Research. Chapman and Hall/CRC, 2003.
Hougaard, P. Analysis of Multivariate Survival Data. Springer, 2000.
Kalbfleisch, JD, Prentice RL. The Statistical Analysis of Failure Time Data. Wiley, 2002.
Therneau, TM and Grambsch, PM. Modelling Survival Data: Extending the Cox Model. Springer, 2000.

23
MATH574: Adaptive and Bayesian Methods in Clinical Research
Prerequisites: None
Objectives of the module:
To describe modern statistical methods that are gaining acceptance within the pharmaceutical industry due to their
potential for increasing the speed and efficiency of drug development. By the end of the course students should
have a good understanding of the issues, opportunities and dangers associated with adapting trial designs during the
conduct of a study. They should know how adaptations can be made without sacrificing the integrity of the final
trial analysis. They should also understand the circumstances in which Bayesian methods are suitable for clinical
research, and how they can be implemented. More generally, the relationship between Bayesian and frequentist
methods, in the context of sequential studies which is where the difference between the two approaches becomes
most marked, will be evaluated and illustrated.
Description:
Modern pharmaceutical trials in therapeutic areas such as cardiovascular disease, cancer and stroke are major
undertakings. They can involve thousands of patients, cost millions of pounds and last for several years. A large
proportion of trials turn out to be negative and do not lead to registration of a new drug. Because of these problems,
there is great interest within the pharmaceutical industry in the use of efficient methods for conducting small early
phase trials to identify the most promising compounds for further study, and in using interim analyses to allow trials
to be stopped as soon as there is sufficient evidence to reach a convincing conclusion, and to make mid-trial
modifications to the design to allow the accumulating data to guide investigators to the most appropriate form of
evaluation. Bayesian methods allow the inclusion of prior information drawn from expert opinion and from
historical data in the interpretation of clinical trials, and this influences the efficiency of drug development. The
study of adaptive designs sharpens understanding of significance testing, study design and the contrast between the
Bayesian and frequentist approaches to inference, which is important regardless of application area.
Syllabus:
Interim analyses, stopping rules and sequential analysis.
Estimation following a sequential trial.
Sample size reviews.
Treatment selection procedures.
Other adaptive designs.
Bayesian methods for phase II and phase III clinical trials.
Bibliography:
Spiegelhalter, D., Abrams, K.R. and Myles, J.P. Bayesian Approaches to Clinical Trials and Health-care
Evaluation. Wiley, 2004.
Jennison, C. and Turnbull, B.W. Group Sequential Methods with Applications to Clinical Trials. Chapman and
Hall, 2000.
Whitehead, J. The Design and Analysis of Sequential Clinical Trials. (Revised 2nd Edition) Wiley, 1997.
24
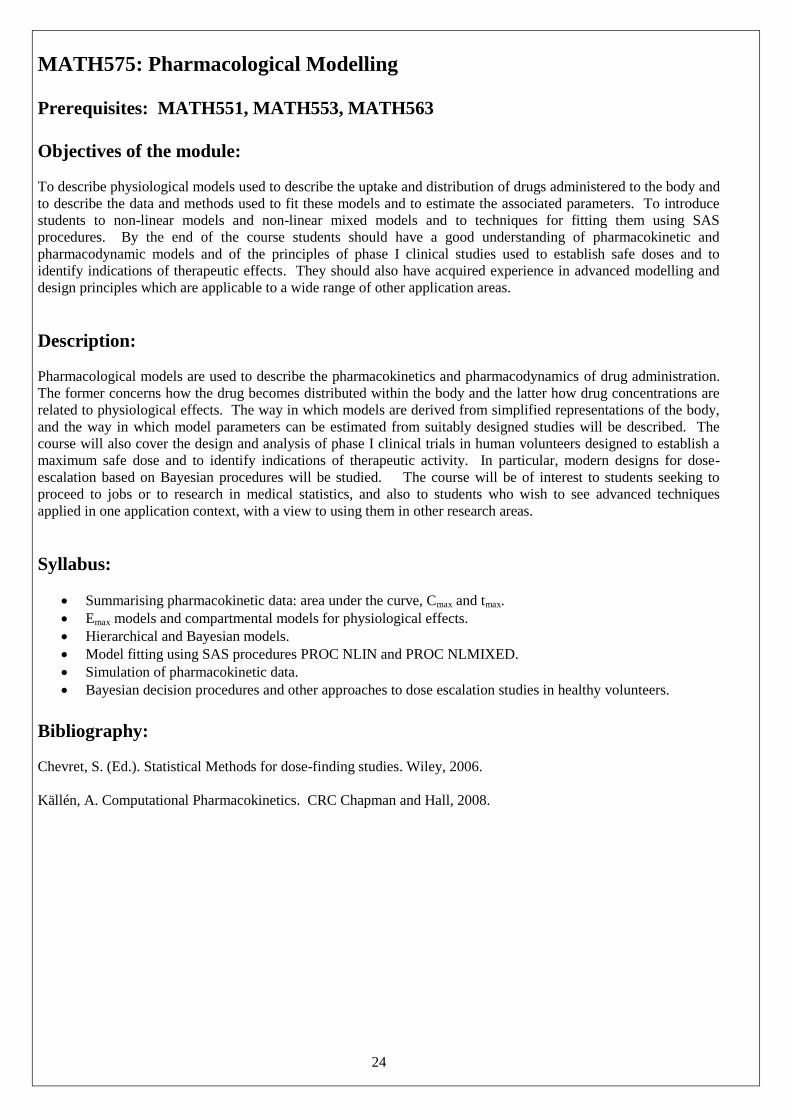
MATH575: Pharmacological Modelling
Prerequisites: MATH551, MATH553, MATH563
Objectives of the module:
To describe physiological models used to describe the uptake and distribution of drugs administered to the body and
to describe the data and methods used to fit these models and to estimate the associated parameters. To introduce
students to non-linear models and non-linear mixed models and to techniques for fitting them using SAS
procedures. By the end of the course students should have a good understanding of pharmacokinetic and
pharmacodynamic models and of the principles of phase I clinical studies used to establish safe doses and to
identify indications of therapeutic effects. They should also have acquired experience in advanced modelling and
design principles which are applicable to a wide range of other application areas.
Description:
Pharmacological models are used to describe the pharmacokinetics and pharmacodynamics of drug administration.
The former concerns how the drug becomes distributed within the body and the latter how drug concentrations are
related to physiological effects. The way in which models are derived from simplified representations of the body,
and the way in which model parameters can be estimated from suitably designed studies will be described. The
course will also cover the design and analysis of phase I clinical trials in human volunteers designed to establish a
maximum safe dose and to identify indications of therapeutic activity. In particular, modern designs for dose-
escalation based on Bayesian procedures will be studied. The course will be of interest to students seeking to
proceed to jobs or to research in medical statistics, and also to students who wish to see advanced techniques
applied in one application context, with a view to using them in other research areas.
Syllabus:
Summarising pharmacokinetic data: area under the curve, Cmax and tmax.
Emax models and compartmental models for physiological effects.
Hierarchical and Bayesian models.
Model fitting using SAS procedures PROC NLIN and PROC NLMIXED.
Simulation of pharmacokinetic data.
Bayesian decision procedures and other approaches to dose escalation studies in healthy volunteers.
Bibliography:
Chevret, S. (Ed.). Statistical Methods for dose-finding studies. Wiley, 2006.
Källén, A. Computational Pharmacokinetics. CRC Chapman and Hall, 2008.
25
6. MSc Assessment Arrangements
Assessment
Testing of knowledge and understanding is achieved through a range of assessment methods.
The practical skills module (MATH550) and the Genomics module (MATH572) are assessed entirely via
coursework. Presentational skills (written and oral) are implicitly assessed in all modules, explicitly in MATH550
and the dissertation.
Core modules MATH551, MATH552, MATH553 and MATH554 are assessed via coursework comprising of: end
of module test (15%), project (35%) and also final written examination (50%). Note weekly exercises are set but
are not formally assessed.
Optional modules, excluding MATH572 as detailed above, are assessed via project (50%) and final written
examination (50%).
The dissertation is marked against criteria: introductory motivation and background; exploratory analysis;
use of standard methods; use of advanced methods; referencing and literature use; written presentation and
structure. Students also present their work orally. A formal marking guideline is provided to students and
supervisors prior to commencement of the dissertation period.
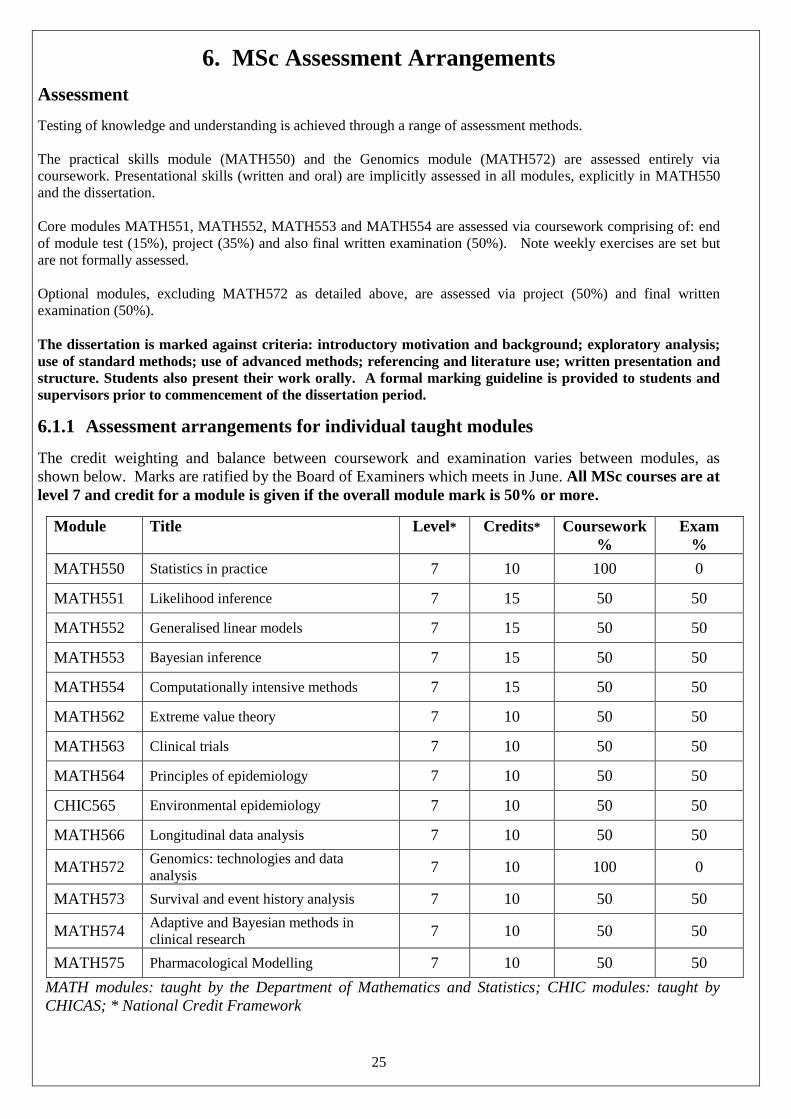
6.1.1 Assessment arrangements for individual taught modules
The credit weighting and balance between coursework and examination varies between modules, as
shown below. Marks are ratified by the Board of Examiners which meets in June. All MSc courses are at
level 7 and credit for a module is given if the overall module mark is 50% or more.
Module Title Level* Credits* Coursework
%
Exam
%
MATH550 Statistics in practice 7 10 100 0
MATH551 Likelihood inference 7 15 50 50
MATH552 Generalised linear models 7 15 50 50
MATH553 Bayesian inference 7 15 50 50
MATH554 Computationally intensive methods 7 15 50 50
MATH562 Extreme value theory 7 10 50 50
MATH563 Clinical trials 7 10 50 50
MATH564 Principles of epidemiology 7 10 50 50
CHIC565 Environmental epidemiology 7 10 50 50
MATH566 Longitudinal data analysis 7 10 50 50
MATH572 Genomics: technologies and data
analysis 7 10 100 0
MATH573 Survival and event history analysis 7 10 50 50
MATH574 Adaptive and Bayesian methods in
clinical research 7 10 50 50
MATH575 Pharmacological Modelling 7 10 50 50
MATH modules: taught by the Department of Mathematics and Statistics; CHIC modules: taught by
CHICAS; * National Credit Framework
26
6.1.2 End of Module Tests
For the core modules running in weeks 1 to 10 (excluding MATH550) 30% of the course work assessment
(i.e. 15% of total module mark) will be the result of a test taken in test conditions at the end of the module.
Tests are typically held during the tutorial session in the final week of the module.
6.1.3 Exam Timetable
All examinations for modules studied in academic year 14/15 will be timetabled during the period May
2015 and June 2015. Provisional exam results will be made available to students in late June 2015. Final
results will be communicated by post by late November 2015.
6.2 Arrangements for the Dissertation
The dissertation component carries a weighting of 60 credits at level 7. Each dissertation will be double-
marked, and a provisional mark agreed between the two markers. A copy of each dissertation and a brief
report (including a provisional mark) agreed between the two internal markers will then be sent to the
external examiner in advance of the final meeting of the Board of Examiners in October. The deadline for
submission of the dissertation is mid-September.
Each student is also required to give a 15-minute oral presentation of the work in their dissertation, at a
meeting of all MSc students and staff. Note it is compulsory for students to attend all MSc Statistics
student presentations.
6.3 The Board of Examiners
The Board of Examiners consists of:
the Head of Department;
the Course Director
the Course Tutor;
academic staff of the university who have lectured a contributory module(s) during the year in
question;
the External Examiner for the MSc.
The External Examiner for the period 2014-2015 is Professor Robin Henderson, University of Newcastle.
The Head of Department will chair this Board. The Course Tutor is responsible for moderating marks
from all lecturers and markers who are not members of the Board. The Course Secretary (Jane Hall) will
service the Board and will liaise with the Departmental Officer (Helen Shaw) as necessary.
27
7. Criteria for Awarding of Degrees
The pass mark for a Masters degree, Postgraduate Diploma and Postgraduate Certificate is 50% with credit for a
module being awarded when the overall mark for the module is 50% or greater.
7.1.1 Degree of MSc in Statistics
The award of MSc in Statistics requires a mark of 50% in each of the 10 modules studied:
5 Core Theory and Methods modules (totalling 70 credits):
( MATH550, MATH551, MATH552, MATH553, MATH554)
5 Specialist Statistical Methods modules from the optional modules (totalling 50 credits):
(MATH562, MATH563, MATH564, CHIC565, MATH566, MATH572, MATH573, MATH574,
MATH575)
together with a mark of 50% or more in the dissertation (60 credits). See also Section 8.
Condonation
Notwithstanding the requirements for the award of MSc, detailed in Section 7.1.1, the Board of Examiners
may at its discretion compensate/condone up to 45 credits providing the module specific mark is not less
than 40% and the average mark over the 10 modules is 50% or more.
7.1.2 Degree of MSc in Statistics with ‘Merit’
In addition to the requirements for the MSc in Statistics an ‘MSc in Statistics with Merit’ shall be awarded
when the weighted average mark over the programme is 60% or more.
7.1.3 Degree of MSc in Statistics with ‘Distinction’
In addition to the requirements for the award of and MSc in Statistics an ‘MSc in Statistics with
Distinction’ shall be awarded when the average weighted mark over the programme (as detailed in 7.1.1)
is 70% or more.
7.1.4 Re-sits
A student who fails to achieve a mark of 50% for a module/element in the MSc programme is entitled to
one opportunity for reassessment in each failed module/element.
A mark of not more than 50% can be awarded for modules retaken and the student cannot achieve
a distinction.
The form of the reassessment is at the absolute discretion of the Examination Board, save that the form of
reassessment must allow the student a realistic chance of achieving 50% in the re-sit.

28
A student intending to re-sit failed modules may proceed to the dissertation.
A student whose dissertation fails may resubmit a revised dissertation on a similar topic within 6 months
or by some deadline that is specified by the examination board.
7.2 Alternative Awards
7.2.1 Postgraduate Diploma
A Postgraduate diploma is awarded to students who achieve a mark of 50% or more in each of the 10
taught modules (yielding 120 credits at level 7) but do not complete the dissertation.
Condonation
Notwithstanding the requirement for the award of Postgraduate Diploma, detailed in Section 7.2.1, the
Board of Examiners may condone, at its discretion, up to 30 credits providing the module specific mark is
not less than 40% and the average mark over the 10 modules is 50% or more.
At the discretion of the Board of Examiners students who do not achieve 120 credits over the 10 taught
modules may be awarded a Postgraduate Diploma provided both the following conditions are satisfied:
a mark of 50% or more is achieved in modules to the value of 60 credits or more;
a mark of 50% or more in the dissertation (60 credits).
7.2.2 Postgraduate Certificate
Students who do not meet the requirements for a Postgraduate Diploma may be awarded a Postgraduate
Certificate providing at least 60 credits have been awarded (>=50%) at the postgraduate level (level 7) .
Condonation
Notwithstanding the requirement for the award of postgraduate certificate, Section 7.2.2, the Board of
Examiners may condone, at its discretion, up to 20 credits.
29
8. Dissertation Guidelines
Programme Weighting
The dissertation carries a weighting of 60 credits at level 7; corresponding to one-third of the Statistics
MSc’s final assessment.
Format
The dissertation should be up to 50 pages of A4 typescript, including all figures, tables and appendices. A
12pt font and standard margins should be used. It should be presented in the style of a formal scientific
report, with chapters and sections, and including an introduction, conclusions and reference list. Figures
and tables should be properly captioned and referenced in the text. Two hard copies of the dissertation
should be submitted together with an electronic copy (in pdf format) uploaded to Moodle (MATH590).
Specific marking criteria are provided by the Dissertation Coordinator to students and supervisors
prior to commencing the dissertation.
General requirements
The dissertation should be presented in a form suitable for transmission to a company or collaborating
department. The student should show understanding of the application area and the purpose of the
analysis. The student should perform exploratory data analysis and the adequacy of underlying modelling
assumptions should be addressed. The student should select and apply appropriate statistical methods and
should report adequate description of non-elementary methods and correct referencing of sources. The
student should demonstrate competence in the application of statistical methods that go beyond the scope
of undergraduate level statistics courses. The dissertation should include a clear statement of conclusions
appropriate to the original aims of the analysis.
Requirements for a distinction in the dissertation
A distinction level mark (70% or more) may be awarded for the dissertation if, in addition to the
requirements for a pass, one or more elements of the following are demonstrated:
– thorough understanding and appropriate application of advanced statistical methods which go beyond
the scope of MSc taught components;
– the development of original statistical methodology or a contribution to fuller understanding of
existing methodology;
– innovative use of the statistical method, leading to substantive findings which would not readily be
obtainable by routine application of standard techniques.
A distinction is typically awarded on the basis that the work is of publishable quality. Specific marking
criteria are provided to students and supervisors prior to commencing the dissertation.
30
9. Submission of Coursework and Dissertation Reports
9.1.1 Deadlines
Deadlines are a crucial part of the University’s organisational structure. They enable students to plan their
work throughout the academic year and also enable administrative and teaching staff to plan their
workloads. In addition, they ensure that all coursework is marked and available for consideration by
external examiners and by Examination Boards. It is expected that all coursework will be submitted by the
given deadline. Extensions to coursework deadlines will only be granted where there is good reason.
Acceptable reasons are ill health or serious personal problems. Computer failure and difficulties in
accessing library resources are normally not considered to be acceptable reasons for requesting extensions.
Work submitted late without an approved extension shall normally be penalised, as follows:
work submitted up to 3 working days after the submission deadline will have 10% of the
maximum mark deducted
work submitted more than 3 working days after the submission deadline will be awarded a
mark of 0.
9.1.2 Coursework submissions
Module Projects
For all module projects one paper copy should be submitted to the MSc submission box and also an
electronic copy uploaded on to the module MOODLE page by the deadline.
All submitted project work should be anonymised: submitted projects should include your library
card number as opposed to your name. You will provide your name on the plagiarism form (see
Section 9.1.3) but this will be removed prior to passing to the tutor for marking.
Submissions will be monitored and a late penalty incurred as detailed in 9.1.1
9.1.3 Plagiarism and Self-certification of Project Reports and Dissertations
Academic integrity is of utmost value and it is expected that all members of the Department will uphold a
common set of values relating to academic malpractice. Plagiarism involves the unacknowledged and
deceitful use of someone else’s work and passing it of as your own. This includes group work being
submitted as if it is your own; duplication of work for more than one module; copying or paraphrasing text
(whether manuscript, electronic or printed form); commissioning or use of work that is not your own.
You must adopt a recognised referencing system for consistent usage in the preparation and presentation
of your work.
Furthermore, whilst we encourage an interactive learning/working environment submitted coursework is
expected to be your own. In this respect all submitted coursework and dissertations must be
accompanied by a self-certification sheet that the submitted work is the student’s own. See
specimen in Appendix A.
Procedures and penalties are available to the University for usage in cases of plagiarism. Cases of
plagiarism will be reported to Board of Examiners. A mark of 0% will be given for any work found to
be plagiarised.

31
Dissertation Reports
Submitted copies of the dissertation will not be returned. Students should keep a copy for their own use.
Feedback will be given in the form of a brief report.
32
10. Society Membership
Additional information/web links for graduates
You have graduated to a professional standard and you should consider joining one of these four societies:
the Royal Statistical Society; Statistician’s in the Pharmaceutical Industry, the London Mathematical
Society; the Institute of Mathematics and its Applications, to ensure continuing support for the discipline
in which you will build your future career and interests.
The Royal Statistical Society:
12 Errol Street
London
EC1Y 8LX
www.rss.org.uk
Statisticians in the Pharmaceutical Industry (PSI)
PSI Executive Office
Association House
South Park Road
Macclesfield
SK11 6SH
www.psiweb.org
The London Mathematical Society:
De Morgan House
57-58 Russell Square
London
WC1B 4HS
www.lms.ac.uk
The Institute of Mathematics and its Applications:
Catherine Richards House
16 Nelson Street
Southend-on-Sea
Essex, SS1 1EF
www.ima.org.uk
Once a graduate of Lancaster University you may also wish to join the alumni:
Lancaster University Alumni:
http://www.alumni.lancs.ac.uk/
Lancaster University Alumni Magazine STEPS Summer 2014:
http://www.alumni.lancs.ac.uk/document.doc?id=94
http://www.lancs.ac.uk/steps/

33
APPENDIX A
MSc in STATISTICS
COVER SHEET FOR PROJECT WORK
SECTION 1
(TO BE COMPLETED BY THE STUDENT IN BALL POINT PEN PLEASE)
NAME: ………………………………………………………………………………..
Library Card No: ………………………
Module Number/Title: …………………………………………………………………
Except for ideas and passages properly referenced and acknowledged in the text, the attached project
report is all my own work. I also confirm that this work has been specifically written for the MSc in
Statistics and has not been submitted for another degree or qualification.
Signed: ………………………………………………
Please complete and sign this form, attach it to your coursework/project and put in the box ‘MSc
submission’, which is located in the pigeon holes opposite room Fylde B4c.
NB: All marks are provisional, until confirmed by the Board of Examiners.
--------------------------------------------------------------------------------------------------------------------
SECTION 2 (FOR DEPARTMENTAL USE)
Date Due: …………………………………..
Date Received: ……………………………..
ONE copy received: YES/NO
Date given to Tutor: …………………………
Date returned by Tutor: ……………………..