ms thesis proposaleprints.kfupm.edu.sa/138589/1/final_one_with_cover_and_signture... · finally, we...
TRANSCRIPT

i
1

ii
1

iii
1
DEDICATION
This Thesis is gratefully
Dedicated
To
My Family

iv
1
ACKNOWLEDGMENTS
I would like to thank my adviser, Dr. Assad Al-Thukair who supported me during this study and
extend my gratitude to all members in remote sensing group in KFUPM research institute
namely, Dr. Nasser Al-Homaid, Mr. Muhammad Asif Khan, and Mr. Abdul Muqtadir. Also,
would like to thank Dr. Baqer Al-Ramadan in Department of City and Regional Planning for his
advice and support of this study.
Finally, we would also like to extend my appreciation to Dr. Mohammed Qurban and Mr. Syed
Imran, center for environment and water, marine studies section in KFUPM research institute,
for their help and assistance to this study.
v
1
TABLE OF CONTENTS
Page Title Page
Final Approval
Dedication
Acknowledgements…………………………………………………………...……………………..…..…iv
Table of content………………………………………………………………………………...........…......v
List of Tables……………………………………………………………………….………….............….vii
List of Figures…………………………………………………………………….…………….………...viii
List of Appendices……………………………………………………………………………............…....ix
Thesis Abstract (English)……………………………………………………….………………………..…x
Thesis Abstract (Arabic)……………………………………………….………………….…………….…xi
CHAPTER 1: Introduction………………………………………………………………………1
1.1 Land reclamation worldwide………………………..……………………………...……....….5
1.2 Land reclamation in Arabian Gulf……………………………………………………..........…6
1.3 Land reclamation in Saudi Arabia…………………………………………...…………….......8
CHAPTER 2: Literature Review………………………………………………..….……...…13
2.1 Land reclamation in Hong Kong……………………………………………………………...13
2.2 Detecting Mangrove Changes Using Landsat Imagery……………………………………....13
2.3 Coastline changes between Kilyos and Kamaburun shoreline………………………….……14
2.4 Environmental changes and infrastructure development…………………………………..…14
2.5 A methodology of characterizing status and trend of land changes in Oases……………...…14
2.6 Evolution of the Sungei Buloh-Kranji mangrove coast in Singapore………………………...15
CHAPTER 3: Research Objectives and Problem Description……………..………16
CHAPTER 4: Data Handling…………………………………………………………………..18
4.1 Data Acquisition………………………………………………………………….....…….….18
4.2 Landsat MSS Scenes…………………………………….………………………...…….........20

vi
1
4.3 Landsat TM Scenes…………………………………………………………...…………...….21
4.4 Landsat SPOT Scenes………………………………………………………….……….....….22
CHAPTER 5: Remote Sensing……………………………………………………..………….23
5.1 Passive Sensors……………………………………………………………………………….23
5.2 Remote Sensing Applications…………………………………………….……………….….24
5.3 Spot Satellite…………………………………………………………………….…….……...24
5.4 Thematic Mapper………………………………………………………...…..…………….…25
5.5 ER Mapper…………………….………………………………………………………...….....25
5.6 ARC.GIS System…………………………………………………………....……………..…26
CHAPTER 6: Methodology……………………………………...……………………………..28
6.1 Image Processing…………………………………………………………..…..…………......28
6.2 Mosaicing different scenes…………………………………………………………………...28
6.3 Defining the Area of Interest……………………..……………………………...………...…32
6.4 Reclaimed area calculation procedure…………………………………………………..…....36
CHAPTER 7: Result and Conclusion……………………………………………………….41
7.1 Result………………………………………………………………....................................…41
7.2 Conclusion………………………………………………………………………...……….....43
References……………………………………………………………………………………………..45
Appendices………………………………………………………………………………………….…49
Appendix-1: 1973 shore line Images of eastern cost of Saudi Arabia…………...……………….50
Appendix-2: 1995 shore line Images of eastern cost of Saudi Arabia……………………………57
Appendix-3: 2007 shore line Images of eastern cost of Saudi Arabia……………………………63
Vita……………………………………………………………………………….……………………...82

vii
1
LIST OF TABLES
Page
Table 1: Summary of 1973 WRS Images Data…………………………………..….……..……......19
Table 2: Summary of 1995 WRS Images Data…………………………………...………….…......20
Table 3: Summary of 2007 WRS Images Data………………………………………...……....…...21
Table 4: Summary of land reclamation quantities and their usage ……………...…………….…41
viii
1
LIST OF FIGURES
Page
Figure 1: The Eastern Province Shore Line………………………………………………………………...3
Figure 2: Mangrove impact due to reclamation activity in Tarut Bay……………………………………...4
Figure 3: Different Land reclamation site in Hong Kong………………………………………………......6
Figure 4: Dubai artificial islands……………………………………………………….……..………..…...7
Figure 5: Land reclamation sites in Tarut Bay in the East Cost of Saudi Arabia………………...………...9
Figure 6: Healthy mangrove habitat in Eastern province of Tarut Bay…………………………………...10
Figure 7: Tarut Bay in 1973, Eastern Province of Saudi Arabia………………………………………….11
Figure 8: Tarut Bay in 2007, Eastern Province of Saudi Arabia………………………………………….12
Figure 9: Mosaic different satellite images of 1973 using ArcViwGIS ………………………………….29
Figure 10: Mosaic different satellite images of 1995 using ArcViwGIS…………………………………30
Figure 11: Mosaic different satellite images of 2007 using ArcViwGIS…………………………………31
Figure12: Landsat scenes covering the area of study and their subset into a new dataset
1973…………………………………………………………………………………………................ ….33
Figure13: Landsat scenes covering the area of study and their subset into a new dataset
1995……………………………………………………………………………………………………......34
Figure14: Landsat scenes covering the area of study and their subset into a new dataset
2007…………………………………………………………………………………………….……….....35
Figure 15: Mangrove impact due to reclamation activities after 1973 and up to 1995……………........39
Figure 16: Mangrove impact due to reclamation activities after 1995 and up to 2007……………........40
Figure 17: Highlight the land reclamation activities since 1973 unto 2007………….…………..…..…...42

ix
1
LIST OF APPENDICES
Page
Appendix 1: 1973 shore line Images of eastern cost of Saudi Arabia…………………….…………...46-48
Appendix 2: 1995 shore line Images of eastern cost of Saudi Arabia……………………….………...49-51
Appendix 3: 2007 shore line Images of eastern cost of Saudi Arabia ………………………….……..52-60

x
1
THESIS ABSTRACT
Name: Tawfiq A. Al-Rowaished
Title: Quantitative Assessments of Land Reclamation along the East
Coast of Saudi Arabia
Major Field: Environmental Sciences
Date of Degree: December 2011
This study identifies the land reclamation activities in eastern cost of Saudi Arabia and quantifies
the reclaimed lands within Tarut Bay from 1970 until 2007. The total land that has been
reclaimed within Tarut Bay area since 1973 up to November 2007 were found to be 84.42 square
kilometers (Km²) most of which were utilized for residential purposes. The research study found
out that most of land reclamation activities were carried before November, 1995. The amount of
reclaimed land due to reclamation activities since 1973 until 1995 was found to be around 83.68
square kilometers (Km²) whereas the reclamation activities after November 1995 were found
very little and the total reclaimed area up to 2007 were only 0.74 square kilometers (Km²). The
study also show some environmental consequences due to reclamation activities within Tarut bay
area. The superimpose of environmental biotype map of Tarut Bay marine life with 1995 and
2007 reclaimed area within that bay, show a clear and destructive impact on mangrove habitats
which Tarut Bay were very rich and famous on it.

xi
1
ملخـص الرسـالــة
من خـالل من أراضي الشواطئ ، صلحهعريف وحساب كميات األراضي المستـت الى توصلت هذه الدراسة
.7119 – 0791و خاصة في خليج تاروت من عـمليات دفـن الشـواطئ وضم أراضيها الى اليابسة
بلغت ما 7119إلى 0791من خـليج تاروت من الفترة صلحهالمستـمجموع األراضي ان الدراسةتوصلت
لغرض االسكان. كما توصلت هذه الدراسة بأن أغلب استخدمت التي ربع ومكيلومتر 24.47ه مجموع
كذلك أوضحت الدراسة أن مجموع األراضي األكـبر .0771حدثت قبل نوفمبر صالحعمليات الدفن و اإلست
األراضي التي ساحاتأما م كيلومترمربع. 21.32قد بلغت 0771إلى 0791من تاريخ صلحتأست
.كيلومـتـرمربع وهذا في خليج تاروت وحده 1.94بلغـت ما مجموعة 7119 إلى 0771ما بعد صلحتاست
المـانجـروف وذلك بعد مطابقتها مع اشجارساهمت في تالشي الدفن عملياتكما أن الرسالة توصلت الى أن
.خريطة األحياء البحرية في خليج تـاروت

1
1
CHAPTER 1
INTRODUCTION
Coastal waters support fish populations that constitute a significant source of protein, sustain
ecosystem stability through conservation of biodiversity, mitigate climate change through carbon
sequestration, act as sinks for by product of industrial or agricultural production, and provide
recreational and aesthetic benefits. Marine and coastal natural resources are, for the most part,
renewable. If properly managed, they should provide continuing returns into the future without
diminishing their productivity. However, increasing human activities in coastal areas exert
growing pressure on the marine and coastal ecosystems. In order to ease the problem of land
shortage, reclaiming land from the sea has become a common approach in many parts of the
world. In fact, large-scale land reclamation has caused significant damage to coastal ecosystems
and the services they provide. Land reclamation occupies coastal space, permanently change the
intrinsic natural quality (e.g., topography, physiognomy and shoreline) of a coastal ecosystem,
and alter the hydrodynamic effect of sediment transport or inshore current systems, as well as
endanger the animals and plants (e.g., benthic organisms and mangroves) in and near the
reclamation area , all of which will directly or indirectly damage the provisioning, regulating,
cultural and supporting services generated by the coastal ecosystem. For example, reclamation
may change seaside and sandy beaches which provide the aesthetic and recreational service; it
would reduce tide-absorbing capacity of a bay, causing damage to waste treatment service; it
may destroy coastal plants and phytoplankton which play an important role in gas regulation

2
1
service through photosynthesis; it may also destroy mangroves(3) and coral reefs which provide
erosion control service as natural coastal defense against storm surges and biodiversity
maintenance service as important habitats for fish and wildlife. Ecosystems maintain their
functional integrity through a natural balance of materials and energy flowing through, cycling
within, and leaving them. This equilibrium is supported by natural, physical, chemical and
biological processes. Land reclamation may disturb the equilibrium or destroy coastal
ecosystems
1
Reclamation can occur both on land and on sea. Land may either be reclaimed for reasons of
raising the level of existing physical ground or for fill purposes of land being mined for resource
extractions. The most common form of reclamation practices is reclamation occurring in the sea
or most simply put, reclamation is the forming of land by filling the sea. The main object of
reclaiming land from the gulf sea in Tarut bay area is to increase the area of ground available for
establishing various physical purposes. These may range from residential and cultivation
purposes to major development projects such as tourism, individual/commercial business
ventures and other infrastructural improvement.

3
1
Figure (1): The Eastern Province Shore Line.
Reclamation can incur both positive and negative impacts on the coastal environment. On the
one hand it helps add resilience to vulnerability of the sea-and-coast’s physical coexistence while
on the other it can incur heavy losses to ecosystems of the immediate coastal environment.
Placing fill in a reclamation area may affect the water quality of the adjacent sea as well as
threatening the thriving existence of fish stocks and habitats found in coastal seas and connecting
lagoons.

4
1
Throughout the history, civilization was born on the banks of large rivers, such as the Nile, the
Euphrates, and Tigris. Protection against flooding and creating deep access to maritime sea
routes were the basic requirement for creating nation prosperity. In the course of many centuries
land reclamation have emerged as means for creating water-bound prosperity and economic
development. More than 60 percent of the world’s population lives less than 100 kilometers from
open water (38). Of the world’s nineteen mega cities with over ten million inhabitants, thirteen of
them are built in coastal zones. Water is both a threat and an opportunity to mankind.
Figure (2): Mangrove impact due to reclamation activity in Tarut Bay.
Land reclamation and its effects on ecological systems have received worldwide attention since
couple of decades. Land reclamation is either of two different practices. One involves creating
new land from sea or riverbeds the other refers to restoring an area to a more natural state and

5
1
rehabilitate it after pollution, salination or desertification. In this paper we will discuss the
history and quantify the reclaimed land from Arabian Gulf particularly in east coast of Saudi
Arabia (figure 1), since 1970 using remote sensing of landsat images technology. An addition,
this study will discuss the environment impact of land reclamation on ecology (figure 2) and the
different usages of the reclaimed land since nineteen seventy.
1.1 Land reclamation worldwide
Generally, creating new land practices serve the communities and countries for different
purposes. The three major reclamation activities worldwide are habitation, agriculture and beach
restoration. Big cities reclaim new land mostly for habitation notable examples in United State
include parts of New Orleans and Washington D. C which is partially built on land that was once
a swamp. In Europe, Helsinki major part of its city center is built on reclaimed land. In Far East,
Japan, the southern Chinese cities, the city-state of Singapore, Shenzhen and Hong Kong where
all land in short supply are famous for their efforts on land reclamation (38). One of the earliest
and famous projects was the Praya Reclamation Scheme which added 50 to 60 acres (240,000
m2) of land in 1890 during the second phase of construction. It was one of the most ambitious
projects ever taken during the Colonial Hong Kong era (4). Marine plankton and benthos have
been affected by reclamation projects in Tianjin Harbor Industrial Zone. The results showed that
the Shannon-Weaver diversity index of phytoplankton and zooplankton decreased from 3.01 to
1.71 and 1.7 to 0.58, respectively. In addition, the diversity index of Shannon-Weaver of benthos
decreased to zero from 1.28.

6
1
The results showed that reclamation projects would change the living environment of marine
organism, decrease the diversity of biology and change the structure of community (2).
Figure (3): Different Land reclamation site in Hong Kong.
1.2 Land Reclamation in Arabian Gulf
In Arabian Gulf, lots of land reclamation activities were developed after the commercial
discovery of crude oil. The most famous reclamation activities are the development project of the
Palm islands, the world, hotel of Burj al-Arab, and Dubai water front in the United Arab

7
1
Emirates are all examples of land reclamation and artificial islands creation. During the past
decades, a number of sites along the coast of Bahrain have been either reclaimed or dredged. A
total area of approximately 34 km2 was gained through these operations. These operations have
drastic effects on the coastal marine ecosystems and environments. They have induced siltation,
increased turbidity of the sea water and of the salinity of the island's ground waters. They have
further degraded the biosystem, with many coral colonies, mangroves and sea grass beds
destroyed (5).
Figure (4): Dubai artificial islands

8
1
1.3 Land reclamation in Saudi Arabia
In Saudi Arabia and particularly Eastern Province, for the last three decades there has been major
and rapid development in infrastructure and life style following the oil discovery in early 1930’s.
Existing cities have expanded and new ones were well planned to cope with such rapid growth in
population. Major construction of oil refineries, industrial cities, and acceleration in building of
infrastructure in the Eastern Province did occur between 1960 to 1990 resulted in vast land
reclamation activities. This type of land reclamation and island creation had destructive effect on
healthy marine life (figure 6) and its ecology especially with rich ecosystem of Arabian Gulf.
These reclamation activities added considerable amounts of flat area for habitation but in the
same time impact environment and destroy marine habitat and its ecology especially the
mangrove (3). When the natural habitat disturbed it will no more support the species originally
present and the biodiversity in those reclaimed site will be reduced and habitats such as
mangrove (figure 2) will be missed up and bury under such reclamation, urbanization, and
dredging activities.

9
1
Figure (5): Land reclamation sites in Tarut Bay.
In this study, I quantify the reclaimed land along the shoreline of eastern province of Saudi
Arabia. I utilized remote sensing images technology together with geographical information
system (ArcView GIS) application software’s to quantify the reclaimed land. In addition, the
study also classified the different usage of the reclaimed land and its impact on environment.

10
1
Figure (6): Healthy mangrove habitat in Eastern province of Tarut Bay.
In order to quantify and estimate the land reclamation activities along the coastal line of Eastern
province of Saudi Arabia and be able to determine its environmental impact on marine habitat
along the Arabia Gulf coastal line, I utilized remote sensing technologies to obtained different
timing of satellite images. In this study and based on images availabilities, I utilized different
timing of spot, Thematic Mapper TM, and Landsat Multi Spectral Senses MSS images for the
coastal line to detect and quantify the reclaimed land from Arabia Gulf since 1973 till 2007. I
acquired the TM and Spot satellite images of 1995 and 2007 from King Abdulaziz City for
Science and Technologies (KACST) and Landsat MSS of 1973 images from King Fahad
University of Petroleum and Minerals (KFUPM).

11
1
Figure (7): MSS of Tarut bay in 1973, Eastern Province of Saudi Arabia.
Since the 1973 Landsat MSS images are not geo-corrected, I utilized 1995 TM images to correct
them using ER Mapper which is a powerful tool and easy-to-use image processing and integrated
mapping software application product. In this study I utilized the ER Mapper applications
software to enhance couples of satellites images and use them to geo-correct the MSS 1973
images with TM 1995 images baths and rows coordinates to make sure that there isn’t any
overlapping in images.

12
1
In order to have good comparison of different dates of images, some of 1973 images were geo-
corrected and co-registered to WGS84/NUTM39 in ER mapper then all images of different dates
(1973, 1995, and 2007) were uploaded in GIS software in which we created different timing of
costal line mosaic images as shown in (figures 10,11 & 12).
After a through revision for land reclamation activities along the Eastern province cost line using
different timing mosaic images, we found out that the most reclamation activities took place in
Tarut bay (figure 8). Since the only environmental biotype map available of marine habitat in
hand for Tarut bay, we limit our reclamation land quantification assessments to Tarut Bay area
only.
Figure (8): Spot of Tarut bay in 2007, Eastern Province of Saudi Arabia

13
1
CHAPTER 2
Literature Review
There were many research studies that used remote senescing technology to calculate land,
water, and vegetation cover changes that subsequently impact the environments and ecosystem.
2.1 Land reclamation in Hong Kong
One of the earliest and famous projects was the Praya Reclamation Scheme which added 50 to
60 acres (240,000 m²) of land in 1890 during the second phase of construction. It was one of the
most ambitious projects ever taken during the Colonial Hong Kong era (4).
2.2 Detecting Mangrove Changes Using Landsat Imagery
This study highlighted that land reclamation activities play big role on destroying marine habitat
such as mangrove as show in (figure 2). The results of this study confirm the dramatic decrease
in mangrove habitat within the Tarut Bay study area. The study has demonstrated the feasibility
of using Remote Sensing techniques, especially the Spectral Angle Mapper to track
environmental phenomena. The decrease in mangrove population during the 1990s was found to
be around 500 acres or roughly 35%. The results of the study indicate that mangrove habitat in
the study area has decreased by about 35% between 1990 and 1999.

14
1
2.3 Coastline changes between Kilyos and Kamaburun shoreline
This study detect the shoreline changes by the amount of area filled with excavated material and
conclude that coastline is being altered dramatically by indiscriminate and uncontrolled open-
surface mining. The study calculates that 160 +/- 10% hectares of coastal water have been filled
up with excavated material and 590 +/- 10% hectares of forest have been destroyed in Istanbul.
2.4 Environmental changes and infrastructure development
This study used Landsat TM data to examine the environmental impact of east Port Said harbor.
The study detect declined in wetland area from 103 km2 in 1984-1991 and 1991-2003.
2.5 A methodology of characterizing status and trend of land changes in the oasis of
Sangong River in Xinjiang, Northwest China
The study monitor the expansion and contraction among various land types and for the entire
oasis of Sangong river in Xinjiang were analyzed for the periods of 1978-1987, 1978-1998 and
1987-1998. It concludes that changes in land use were closely related to a strong economic
growth after the land-reform campaign and adoption of market economy in China in the late
1980s to early 1990s.
15
1
2.6 Evolution of the Sungei Buloh-Kranji mangrove coast, Singapore
The study shows that a time series of photographs covering the period from 1946 to 2001 has
revealed major changes in the distribution of mangroves in the area resulting from development-
induced changes in the local hydrodynamic regime and clearance for aquaculture. Mangroves
covered 117.3 ha in the study area in 1946 and were actively advancing over the coastal mudflats
until 1980. Despite the addition of 6.24 ha from mangrove colonization, the total area covered by
mangroves was reduced by ~50% by 1980 due to clearance for aquaculture.
16
1
CHAPTER 3
Research Objectives
i. To quantify the reclaimed land within Tarut Bay from Arabian Gulf toward the shore line of
Eastern coast of Saudi Arabia from 1973 until 2007.
ii. To identify and classify the land uses of the reclaimed land, and effected marine habitats in the
studied area.
Problem Definition
Arabian Gulf located in the southwest Asian region and it is an extension of Indian Ocean. This
inland sea of some 251,000 km² is connected to the Gulf of Oman in the east by Strait of Hormuz
and its western end is marked by the major river delta of the Shatt al-Arab, which carries the
waters of the Euphrates and the Tigris. Its length is 989 kilometers with Iran occupying most of
the northern coast and Saudi Arabia most of the southern coast. The gulf is about 56 kilometers
wide at its narrowest, in the strait of Hormuz. It is rich with good fishing grounds, extensive
coral reefs, and abundant of pearl oysters but its ecology has come under pressure especially
after the oil discovery in the region and the boom of industrialization and cities expansion.
Shoreline of the Arabian Gulf overall very shallow and make it easy and less expensive to
reclaim land from it. In the last decades, Arabian Gulf was effected by major and numbers of
urban development projects which led to land expansion activities ranging from beach
replenishment up to island creation. The most recent and modernize land reclamation in the gulf

17
1
are the creation of three artificial islands palm, the world, and Dubai waterfront. The islands
located off the coast of the United Arab Emirates and will add 520 kilometers of beaches to the
city of Dubai.
Since the oil discovery in early 1930’s, Saudi Arabia had undergone major and rapid
development in infrastructure and life style. Existing small cities were expanded and new ones
had well planned to cope with such growth in population. Major construction of oil refineries,
industrial cities, and acceleration in building of infrastructure in the Eastern province did occur
between 1960 to 1990 resulted in land expansions especially the Eastern coast shoreline cities
from the most developed one Dammam up to Khafji. These types of land reclamation and island
creation have destructive effect on marine life and its ecology especially with rich ecosystem
such as the Arabian Gulf. Since 1990 little research studies discuss the ongoing land reclamation
activities at the Eastern coast of Saudi Arabia. This study will discuss the land reclamation
activities that took place since 1973 onward to 2007 and provide the current status and total
quantity of land reclaimed from Arabian Gulf. It will also identify the environmental impact on
marine habitats due to such activities.

18
1
CHAPTER 4
DATA HANDLING
To execute our study of land reclamation activities along the eastern coast of Saudi Arabia, we
gathered east cost satellite images for different timing (1973, 1995, and 2007).
4.1 Data Acquisition
Different datasets were obtained for the purpose of this study. Twenty nine main imagery
datasets were obtained from the King Abdulaziz City of Science and Technology (KAUST).
Those were mainly Landsat scenes obtained at different times for the study area. Table 1 shows
the different datasets obtained for the purpose of this study and their characteristics. In addition
to these data, imagery of Tarut bay from KAUST satellite group was provided ready geo-
corrected by KFUPM RI remote sensing unit covering the study area.

19
1
Table 1: Summary of 1973 WRS Image Data
Landsat
MSS
Landsat
MSS
Landsat
MSS
Landsat
MSS
Landsat
MSS
Landsat
MSS
Reference
WRS 175-42 175-43 176-41 176-42 177-40 177-41
Acquisition
Date 04/10/73 04/10/73 04/10/73 04/10/73 04/10/73 04/10/73
Bands 3 3 3 3 3 3
Resolution
(m) 58 58 58 58 58 58
Datum WGS84 WGS84 WGS84 WGS84 WGS84 WGS84
Projection NUTM39 NUTM39 NUTM39 NUTM39 NUTM39 NUTM39
Source KFUPM KFUPM KFUPM KFUPM KFUPM KFUPM

20
1
4.2 Landsat MSS Scenes
Six scenes dating October 04th, 1973 were obtained from KFUPM Table 1. Although the
resolutions of these datasets are not good enough, and not compatible with the later datasets, it
has provided an insight to the situation of shoreline during that period.
Table 2: Summary of 1995 WRS Image Data
Landsat
TM Landsat TM
Landsat
TM
Landsat
TM Landsat TM
Reference
WRS 163-42 163-43 164-41 164-42 165-40
Acquisition
Date 11/11/95 11/11/95 08/04/95 08/04/95 21/08/95
Bands 3 3 3 3 3
Resolution
(m) 30 30 30 30 30
Datum WGS84 WGS84 WGS84 WGS84 WGS84
Projection NUTM39 NUTM39 NUTM39 NUTM39 NUTM39
Source KACST KACST KACST KACST KACST

21
1
4.3 Landsat TM Scenes
Five Landsat 4 Thematic Mapper scenes numbered 163/42,163/43,164/41,164/42, and 165/40
were obtained from KACST dating November 11th, April 08th
, and August 21th 1995. These
scenes were provided orthorectified although further local co-registration was required to ensure
comparability with other dates. As shown in Table 2, it provides higher resolution than that
provided by the MSS scenes obtained for 1973 as mentioned above.
Table 3: Summary of 2007 WRS Image Data
Landsat
SPOT
Landsat
SPOT
Landsat
SPOT
Landsat
SPOT
Landsat
SPOT
Landsat
SPOT
Reference
WRS
147-293
153-297
151-297
148-293
153-298
152-297
149-294
153-299
152-296
149-295
154-299
152-298
150-295
154-300
151-296
151-295
155-300
155-301
Acquisition
Date 2007 2007 2007 2007 2007 2007
Bands 3 3 3 3 3 3
Resolution
(m) 10 10 10 10 10 10
Datum WGS84 WGS84 WGS84 WGS84 WGS84 WGS84
Projection NUTM39 NUTM39 NUTM39 NUTM39 NUTM39 NUTM39
Source KACST KACST KACST KACST KACST KACST
22
1
4.4 Landsat SPOT Scenes
Eighteen Landsat SPOT scenes as numbered above were obtained from KACST during 2007.
These scenes were provided with higher resolution and region of interest was further co-
registered to ensure comparability with other and previous dates. As shown in Table 3, it
provides with higher resolution than that provided by the MSS or TM scenes obtained for 1973
and 1995 as mentioned above.
Other Data acquired for the project included:
Environmental protection biotype map of marine habitat for Tarut Bay obtained from the Center
for Environment and Water at KFUPM.

23
1
CHAPTER 5
Remote sensing
In order to estimate the land reclamation activities along the Tarut bay in Eastern province of
Saudi Arabia and be able to determine its environmental impact on marine habitat, this study has
utilized remote sensing technologies to obtained different timing of satellite images to quantify
the reclaimed land from Arabia gulf toward Tarut bay.
Remote sensing is the small or large-scale acquisition of information of an object by the use of
either recording or real-time sensing devices that are wireless by way of satellite. In practice,
remote sensing is the stand-off collection through the use of a variety of devices for gathering
information on a given object or area.
5.1 Passive Sensors
There are two kinds of remote sensing. Passive sensors detect natural radiation that is emitted or
reflected by the object or surrounding area being observed. Reflected sunlight is the most
common source of radiation measured by passive sensors such as Spot satellite. Examples of
passive remote sensors include film photography, infrared, charge-couple devices and
radiometers. Active collection, on the other hand, emits energy in order to scan objects and areas
whereupon a sensor then detects and measures the radiation that is reflected or backscattered
from the target.

24
1
5.2 Remote sensing applications
Remote sensing makes it possible to collect data on dangerous or inaccessible areas. Remote
sensing applications, include monitoring deforestation in areas such as the Amazon Basin, the
effects of climate change on glaciers and Arctic and Antarctic regions, depth sounding of coastal,
and land reclamation a long coastal area as this research study focus on in which we used one of
remote sensing tools such as Spot, TM, and MSS satellites images to detect and quantify the
reclaimed land from Arabian gulf since 1973 till 2007.
5.3 SPOT Satellite
SPOT (Satellite Pour l'Observation de la Terre), is a high-resolution, optical imaging Earth
observation satellite system operating from space. It is run by Spot Image based in Toulouse,
France. It was initiated by the CNES (Centre national d'études spatiales — the French space
agency) in the 1970s and was developed in association with the SSTC (Belgian scientific,
technical and cultural services) and the Swedish National Space board (SNSB). It has been
designed to improve the knowledge and management of the Earth by exploring the Earth's
resources, detecting and forecasting phenomena involving climatology and oceanography, and
monitoring human activities and natural phenomena. The SPOT system includes a series of
satellites and ground control resources for satellite control and programming, image production,
and distribution. The satellites were launched with the ESA rocket launcher Ariane 2, 3, and

25
1
4.The company SPOT Image is marketing the high-resolution images, which SPOT can take
from every corner of the Earth.
5.4 Thematic Mapper
Thematic Mapper (TM) is one of the Earth observing sensors introduced in the Landsat program.
TM was first placed aboard Landsat 4 (decommissioned in 2001), and one is still operational
aboard Landsat 5 as of May 2007. Its sensors feature seven bands of image data (three in visible
wavelengths, four in infrared) most of which have 30 meter resolution. Thematic Mapper has
become a useful tool in the study of albedo and its relationship to global warming and climate
change. The TM on the Landsat 5 has proven useful in determining the amount of ice loss on
glaciers due to melting.
5.5 ER Mapper
In this study and based on images availabilities, we utilized different timing of spot, TM, and
Landsat MSS images for the coastal line of Eastern province of Saudi Arabia to detect and
quantify the reclaimed land from Arabian Gulf since 1973 till 2007. I acquired the TM and Spot
satellite images of 1995 and 2007 from King Abdulaziz City for Science and Technologies
(KACST) and Landsat MSS of 1973 images from King Fahad University of Petroleum and
Minerals. Since the 1973 Landsat MSS images are not geo-corrected we utilized 1995 TM
images to correct them using ER Mapper, which is a powerful tool and easy-to-use image
processing and integrated mapping software product. It is used worldwide for resource
management, urban planning, mineral/oil exploration, and many other applications.

26
1
In this study I utilized the ER Mapper applications software to enhance different satellites images
to use them to geo-correct the MSS 1973 images with TM 1995 images baths and rows
coordinates. In order to have good comparison of different dates of images, some of 1973 images
were geo-corrected and co-registered to WGS84/NUTM39 in ER mapper then all images of
different dates (1973, 1995, and 2007) were uploaded in GIS software to draw the boundary of
Eastern Province cost line and then quantify the reclaimed land for different period of time.
5.6 ARC GIS System
The GIS system, is basically geographic information system that integrates, stores, edits,
analyzes, shares, and displays geographic information data.GIS applications are tools that allow
users to analyze spatial information, edit data, maps, and present the results of all these
operations. New versions of GIS technologies use digital information, for which various
digitized data creation methods are used. The most common method of data creation is
digitization, where a hard copy map or survey plan is transferred into a digital medium through
the use of a computer-aided design program, and geo-referencing capabilities.
The GIS program can also convert existing digital information, which may not yet be in map
form, into forms it can recognize and use. For example, digital satellite images generated through
remote sensing such as different images of Eastern Province costal line can be analyzed to
produce a map-like layer of digital information about sea reclaimed area.

27
1
I selected three subsection sets for the area of interest for different timing starting from 1973,
1995 and till 2007. Then those subsection images where registered, geo-coded, and enhanced
using the ER Mapper software. Then the different subsection images uploaded as layers in ARC
GIS software where the reclaimed area digitized and quantified.

28
1
CHAPTER 6
METHODOLOGY
6.1 Image Processing
In order to achieve the final goal of extracting land reclamation areas in different satellite scenes,
I had to manipulate, enhance, and analyze the images at hand. The steps involved in this
processing are explained in the sections below.
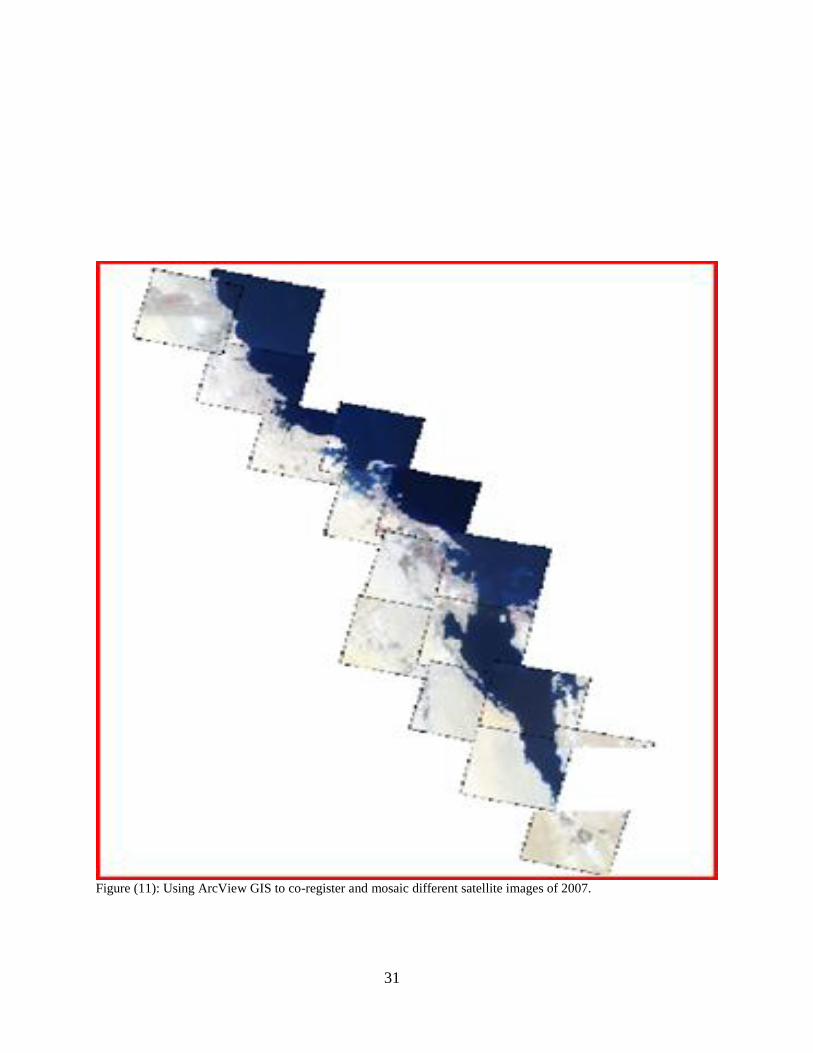
6.2 Mosaicing Different Scenes to Create Single Datasets
In order to be able to deal with study area as a single dataset, different scenes were mosaiced
together using histogram matching techniques to conduct color balancing after the initial
atmospheric effects correction. The mosaicing operation created three single, atmospherically
corrected, color-balanced datasets out of the main costal mosaic Landsat images (figures 9, 10 &
11).

29
1
Figure (9): Using ArcView GIS to co-register and mosaic different satellite images of 1973.

30
1
Figure (10): Using ArcView GIS to co-register and mosaic different satellite images of 1995.
31
1
Figure (11): Using ArcView GIS to co-register and mosaic different satellite images of 2007.

32
1
6.3 Defining the Area of Interest
The definition of the study area boundaries was derived from the understanding that this area has
to cover the same coast line in a zone that overlaps with each different timing costal images and
the environmental Biotype map of Tarut bay.
A subset operation was conducted on the Landsat scenes covering the area of interest to produce
only these portions covering the area of interest. Figure (12, 13, & 14) shows the original three
scenes as well as the color resultant subset covering the area of interest.

33
1
917.29 km²
Figure (12): Landsat scenes covering the area of study and their subset into a new dataset 1973.

34
1
Figure (13): Landsat scenes covering the area of study and their subset into a new dataset 1995.

35
1
Figure (14): Landsat scenes covering the area of study and their subset into a new dataset 2007.
36
1
6.4 Reclaimed Area Calculation Procedure
In this study we utilized different software to quantify the reclaimed land within Tarut Bay area
and below points summarize the calculation procedure steps.
The pictures for all satellite images were uploaded into the ERDAS ER mapper software
version 7.0.
Geo-correction is made for uncorrected images.
Images were aligned with each other to construct whole coastline seen to eliminate any
overlapping.
Every image was uploaded to the ESRI Arc GIS version 9.0 as single layer.
Images were aligned again in GIS to construct whole coastline seen and prepare the area
of interest for area digitizing.
The area of interest was digitized to contain the area as polygon using GIS tools.
The polygon area for different images data were calculated in square kilometers and the
reclaimed area for different dates were determined.

37
1
The below points summarize the exact procedure steps that being followed to calculate reclaimed
land using the software’s:
Using the ER Mapper software:
1. 2007 Spot images already geo-corrected.
2. 1973 images need geo-correction.
a. Open both images (one of coast line 2007 and same coordinates from 1973 or 1995
image).
b. From the ER mapper tool bar choose “process icon”, then Geocoding wizard.
c. Open file of any image (ex; 176-42-1973).
d. From polynomial setup, choose Linear as calculated.
e. From GCP setup, select or mark Geocoded image, then open file and get spot image
(ex; 152-297-2007) then press ok.
f. Then do GPC edit (five widows of corrected and uncorrected images will pop up on
the screen).
g. Select two points from each image (2007 and 1973).
h. To add extra points tap on “GPC +” button (select at least 15 points).
i. Then choose Rectify button and specify the output and save the file as (ex; 176-42
geo-corrected).
j. Then choose rectification process and after that cancel.
k. After rectification save section picture 73-sub-section tarut as geo tiff/tiff.
Save them in G:\satellite data 73, 1995, 2007-subsection tarut.

38
1
Using GIS Application software:
1. Open ARC map.
2. Go to file; then add data 73.
3. Open data 2007.
4. Then you can switch between two layers or images.
5. You need to draw polygon for the images;
a. Under tools choose Arc catalog.
b. Then from file tool bar choose “new” then “shape file” take 73 image.
c. Name; 73 images as 73-sub-tarut.
d. Feature shape; polygon.
e. Description; edit and import the same image file the “add”, then Apply, OK.
f. Take 2007 image and repeat steps one to five.
g. From file “add data” of arc catalog for 73.
a. Start editing by marking the land then, from editor stop editing if you need,
then save it.
b. Then both polygons are ready for area calculation.
c. From arc tool, then spatial statistical tools, then utilities, we can calculate the
area.
d. The area of polygon of the example in hand is as follow:
Area (polygon) 1973= 917.29 km²
Area (polygon) 2007= 1001.71 km²
Result= 917.29 – 1001.71= 84.42 km²

39
1
Figure (15): The mangrove impact due to reclamation activities after 1973 and up to 1995.

40
1
Figure (16): The mangrove impact due to reclamation activities after 1995 and up to 2007.

41
1
CHAPTER 7
7.1 RESULTS
The quantification assessments of land reclamation along the east cost of Saudi Arabia was
limited to the cost area toward Tarut Bay because of the major reclamation activities that took
place since 1970 and also due to the availability of the environmental Biotype map for that area.
Table 4 summarizes the area reclamation quantities and their usage for different period of time.
Table 4: Summary of land reclamation quantities and their usage.
Reclamation
Area
Year of land
reclaimed
Land added
Km²
Marine
Habitat
affected
Land use
Remarks
(digitized
subsection
area Km²)
Tarut Bay 1973 0 None None 917.29
Tarut Bay 1973---1995 83.68 Mangrove Residential 1000.97
Tarut Bay 1995---2007 84.42 Mangrove Residential 1001.71

42
1
Figure (17): Highlight the land reclamation activities from 1973 to 2007

43
1
7.2 CONCLUSION
This study shows and quantifies the amount of reclaimed land at the study area site of Tarut bay
of the Arabian Gulf in the eastern province of the Kingdom of Saudi Arabia. The total land that
has been reclaimed within Tarut Bay area since 1973 up to November 2007 were found to be
84.42 square kilometers (Km²) which most of it were utilized for residential purposes.
The reclaimed land quantities were calculated base on subsection of couple of image datasets for
Tarut bay, in which we first calculated the 1973 subsection then subtracted from the calculated
subsections areas of the following 1995 and 2007 timing. And as tabulated above, the research
study found out that the most of land reclamation activities were carry out before November,
1995.
The amount of reclaimed land due to reclamation activities since 1973 to 1995 was found to be
around 83.68 square kilometers (Km²) whereas the reclamation activities after November 1995
were found very little and the total reclaimed area up to 2007 were only 0.74 square kilometers
(Km²). In the other hand, the study also show some environmental consequences due to
reclamation activities within Tarut bay area.
The superimpose of environmental biotype map of Tarut bay marine life with 1995 and 2007
reclaimed area show a clear and destructive impact on mangrove habitats that Tarut bay were
very famous about as marked in (figures15 & 16). The results of the thesis study were aligned
and confirmed with the recent study conducted by environmental protection department in Saudi

44
1
Aramco in which it indicated the destruction in mangrove habitat was estimated to 90% of the
original mangrove ecosystems along the Gulf coast have been lost mostly as a result of coastal
urban development. Also it indicated that the current estimate of mangrove habitat within the
Saudi Arabian territories of the Gulf is 412 ha, comprising 55 ha of plantation (1).

45
1
References
1. Loughland Ronald, Al-Abdulkader Khaled, Alexander Wyllie, and Burwell Bruce (2011)
Anthropogenically Induced Geomorphological Change of the Western Arabian Gulf Coast.
Environmental Protection Department, Saudi Aramco, pp2-28.
2. Kunyu LI, Xianbin LIU, Xinggui ZHAO, and Weihua GUO (2010) Procedia Environmental
Sciences. Effects of Reclamation Projects on Marine Ecological Environment in Tianjin
Harbor Industrial Zone v2, pp792-799.
3. Tarut Bay pilot project report (2004) Detecting mangrove changes using landsat imagery.
Environmental engineering, Saudi Aramco, pp2-25.
4. Liming Jiang and Hui Lin (2010) Engineering Geology. Integrated analysis of SAR
interferometric and geological data for investigating long-term reclamation settlement of
Chek Lap Kok Airport, Hong Kong pp, 77-92.
5. Al-Madany Ismail, Abdalla Mohamed, and Abdu Anwar (1991) Journal of Environmental
Management. Coastal zone management in Bahrain: An analysis of social, economic and
environmental impacts of dredging and reclamation pp, 335-348.
6. Humood Naser (2011) Marine Pollution Bulletin. Effects of reclamation on macro benthic
assemblages in the coastline of the Arabian Gulf: A microcosm experimental approach pp.
520-524.
7. Jihua Wu, Cuizhang Fu, Fan Lu, Jiakuan Chen (2005) Applied Soil Ecology. Changes in
free-living nematode community structure in relation to progressive land reclamation at an
intertidal marsh, pp.47-58.
8. Suzuki Takeshi (2003) Marine Pollution Bulletin. Economic and geographic backgrounds of
land reclamation in Japanese ports, pp.226-229.
9. Myung Woo Han and Yong Chul Park (1999) The Development of Anoxia in the Artificial
Lake Shihwa, Korea, as a Consequence of Intertidal Reclamation. Marine Pollution Bulletin,
pp. 1194-1199.
46
1
10. Shin’ichi Sato and Mikio Azuma (2002) Palaeoecology Ecological and paleoecological
implications of the rapid increase and decrease of an introduced bivalve Potamocorbula sp.
after the construction of a reclamation dike in Isahaya Bay, western Kyushu, Japan,pp.369-
378.
11. Santin C., de la Rosa J., Knicker H., Otero X., Alvarez M., Gonzalez-Vila F. (2009) Organic
Geochemistry. Effects of reclamation and regeneration processes on organic matter from
estuarine soils and sediments, pp.931-941.
12. Suraj De Silva (2005).Implementation and Performance of Stone Columns at Penny's Bay
Reclamation in Hong Kong, chapter 22, pp.639-663.
13. Xinjiang, China G., Luo, Zhou C., Chen X., and Li Y. (2009) A methodology of
characterizing status and trend of land changes in oases: A case study of Sangong River
watershed,pp.192-196.
14. Kaiser M. (2009) Environmental changes, remote sensing, and infrastructure development:
The case of Egypt's East Port Said harbor. Applied geography 29, pp.280-288.
15. Bird Michael, Chua Stephen, Fifield Keith, Tiong Teh, Joseph Lai (2004) Evolution of the
Sungei Buloh–Kranji mangrove coast, Singapore. Applied geography 24, pp.181-198.
16. Verburg Peter, Steeg Jeannette, Veldkamp A., and Louise Willemen (2009) From land cover
change to land function dynamics: A major challenge to improve land characterization.
Journal of environmental management 90, pp.1327-1335.
17. Gazioglu Cem, Yucel Zeki , Selmin Burak, Erdogan Okas, and Bedri Aipar (1997).Coastline
changes and inadequate management between kilyos and karaburun shoreline. Turkish
J.mar.sci3 (2), pp.111-122.
18. Manley Patricia, Parks Sean, Campbell Lori, and Schlesinger Matthew (2009) Modeling
urban land development as a continuum to address fine-grained habitat heterogeneity.
Landscape and urban planning89, pp.28-36.
19. Nielsen Eric, Prince Stephen, Koeln Gregory (2008). Wetland change mapping for the U.S.
mid-Atlantic region using an outlier detection technique. Remote sensing of environment,
v.112, and pp.4061-4074.

47
1
20. Hussin Y., Zuhair M., and Weir M. (1999) Monitoring Mangrove Forests using Remote
Sensing and GIS, Proceedings of ACRS 1999, pp.251-257.
21. Al-Abdulkader Khaled, Blundell Stuart and Farrand William (2002). Marine Habitat
Mapping Using High Spatial Resolution Multispectral Satellite Data, in Saudi Aramco
Journal of Technology, fall 2002,pp. 1-12.
22. Alkolibi F. (2002) possible effects of global warming on agriculture and water resources in
Saudi Arabia-Impacts and responses. Climate change, V.54, PP 225-245.
23. Alleng, G. (1998) Historical development of the port Royal mangrove wetland, Jamaica.
Journal of Coastal Research, v.143 (3), pp.951-959.
24. Blasco F., Saenger P., and Janodet E. (1996) Mangrove as indicators of coastal change.
School of environmental science and management, pp.1-12.
25. Burke E., Brown S., and Christidis N (2006) Modeling the recent evolution of global drought
and projections for the twenty-first century with the Hadley Centre Climate model. Journal of
Hydrometeorology, v.7 (5), pp.1113-1125.
26. Chavez, P., Berlin, G., and Mitchell W (1977) Computer enhancement techniques of Landsat
MSS images for land use/land cover assessments. Remote Sensing Earth Resources,
University of Tennessee, v.6, pp.259.
27. Crane R. (1971) preprocessing techniques to reduce atmospheric and sensor variability in
multispectral scanner data. Proceedings of the 7th
International Symposium on Remote
Sensing of Environment (Ann Arbor: University of Michigan), pp.1345.
28. Xuan Wang, Weiqi Chen, Luoping Zhang, Di Jin, Changyi Lu. (2010) Estimating the
ecosystem service losses from proposed land reclamation projects: A case study in Xiamen.
Journal of Ecological Economics,pp 2549-2556.
29. KFUPM/IR (1990d) Final Report: Aramco Sustaining Research Project – marine
Environmental Studies, vol IV, Tarut Bay Biotopes Investigation – Mangrove Communities.
Prepared for Saudi Aramco by the Water Resources and Environment Division. Research
Institute, King Fahd University of Petroleum and Minerals, Dhahran, Saudi Arabia, Reportt
Project No.24079.

48
1
30. Khan A. and Al-Homaid N (2003) Remote sensing study on mangrove depletion Tarut Bay,
Saudi Arabia. In: Alsharhan et al. (eds.), Desertification in the Third Millennium.
Proceedings of an international Conference, Dubai, February 12-15, 2000.A.A. Balkema
Publishers, The Netherlands, pp.227-233.
31. Kumar, A. (2009) Reclaimed islands and new offshore townships in the Arabian Gulf:
potential natural hazards. Current Science, v.96 (4), pp.480-485.
32. Long G. and Skewes D (1996) A technique for mapping mangroves with Landsat TM
satellite data and Geographic Information System. Estuarine Costal and Shelf Science, v.43
(3), pp. 373-381.
33. Ong E. (1995) The Ecology of Mangrove Conservation and management. Hydrobiologia,
v.295 (1-3), pp.343-351.
34. Riaza A., Martinez-Torres L., Ramon-Liuch, R., Alonso J. and Heras,P (1998) Evolution of
equatorial vegetation communities mapped using Thematic Mapper images through a
geographical information system(Guinea, Equatorial Africa). International Journal of Remote
Sensing, V.19 (1), pp.43-54.
35. Richardson J. and Evert H. (1992) Using spectral vegetation indices to estimate rangeland
productivity. Geocarto International, v.1, pp. 63-69.
36. Spalding, D., Blasco, F. and Field D. (1997) world Mangrove Atlas. The international
Society for Mangrove Ecosystems, Okinawa, Japan.Journal of tropical ecology 14, pp.723-
724.
37. Spiess, A. (2008) Developing adaptive capacity for responding to environmental change in
the Arab Gulf States: Uncertainties to linking ecosystem conservation, sustainable
development and society in authoritarian rentier economics. Global and Planetary change, v.
64, pp. 244-252.
38. http://en.wikipedia.org/wiki/Main_Page

49
1
APPENDICES

50
1
Appendix 1
Worldwide Reference System Images (WRSI) of Eastern Cost of Saudi
Arabia, 1973 Shore Line

51
1
WRSI: Path 175- Row 42
October 1973

52
1
WRSI: Path 175- Row 43
January 1973

53
1
WRSI: Path 176- Row 41
January 1973

54
1
WRSI: Path 176- Row 42
January 1973

55
1
WRSI: Path 177- Row 40
January 1973

56
1
WRSI: Path 177- Row 41
January 1973

57
1
Appendix 2
Worldwide Reference System Images (WRSI) of Eastern Cost of Saudi
Arabia, 1995 Shore Line

58
1
WRSI: Path 163- Row 42
November 1995

59
1
WRSI: Path 163- Row 43
November 1995

60
1
WRSI: Path 164- Row 41
April 1995

61
1
WRSI: Path 164- Row 42
April 199
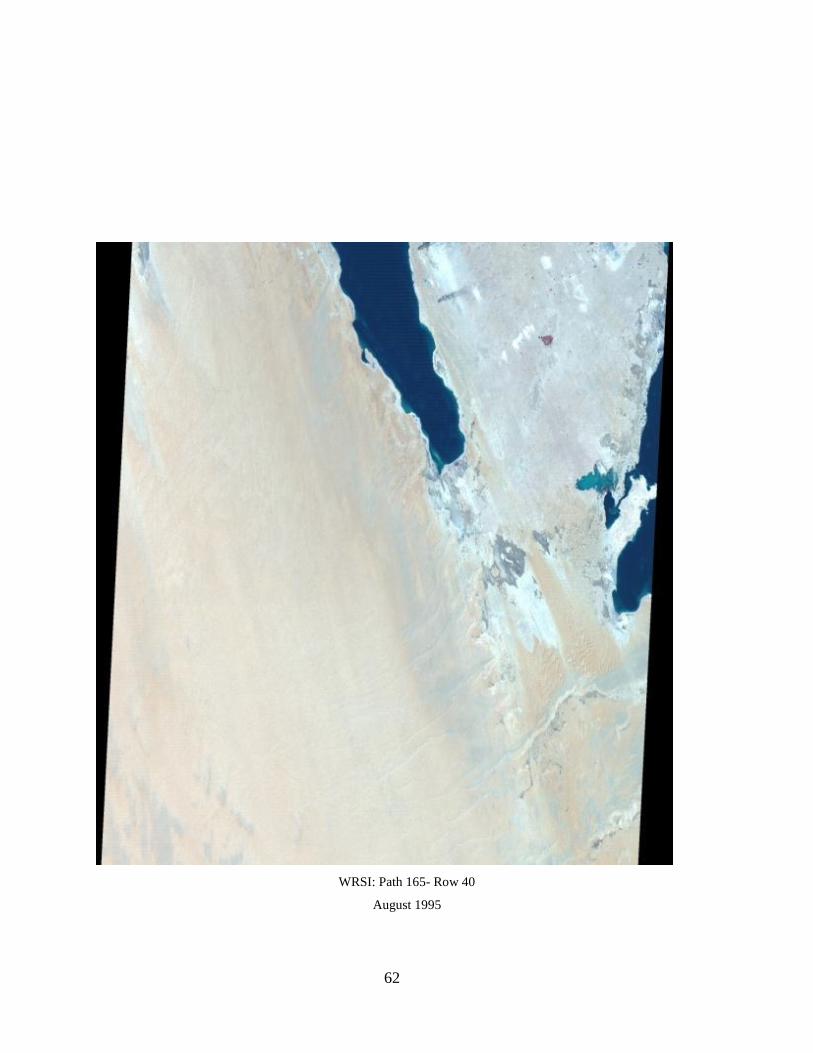
62
1
WRSI: Path 165- Row 40
August 1995

63
1
Appendix 3
Worldwide Reference System Images (WRSI) of Eastern Cost of Saudi
Arabia, 2007 Shore Line

64
1
WRSI: Path 147- Row 293
2007

65
1
WRSI: Path 148- Row 293
2007
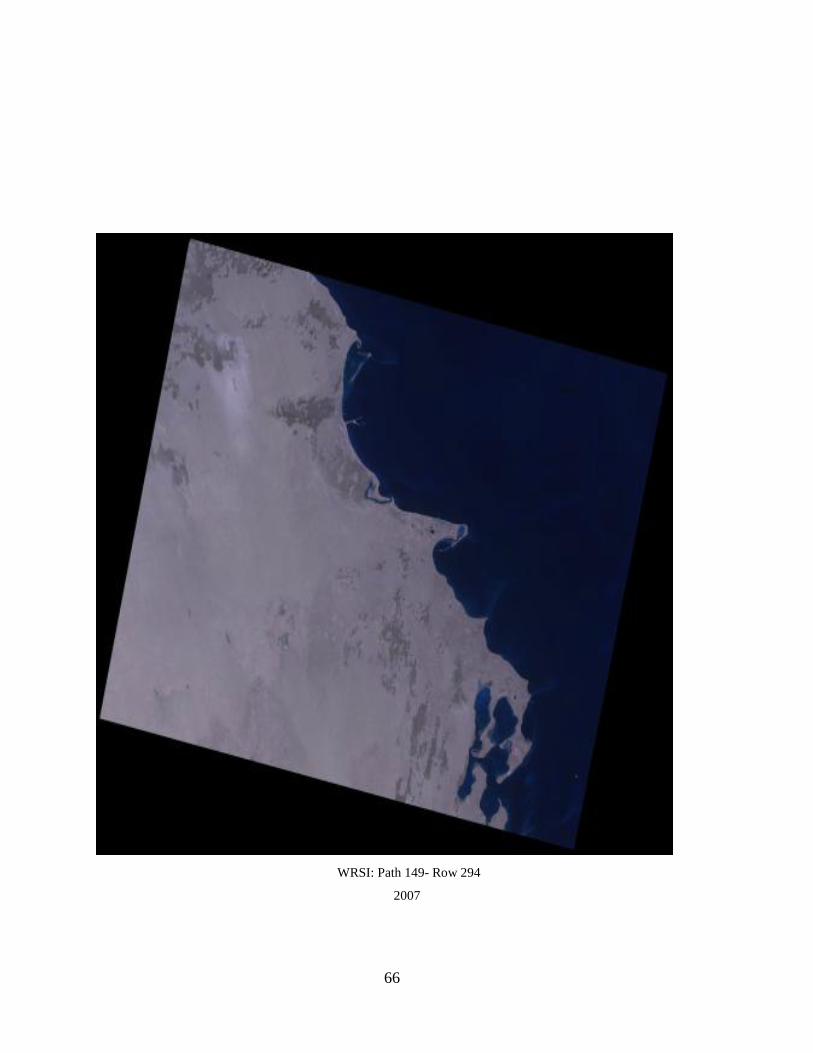
66
1
WRSI: Path 149- Row 294
2007

67
1
WRSI: Path 149- Row 295
2007

68
1
WRSI: Path 150- Row 295
2007

69
1
WRSI: Path 151- Row 295
2007

70
1
WRSI: Path 151- Row 296
2007
71
1
WRSI: Path 151- Row 297
2007
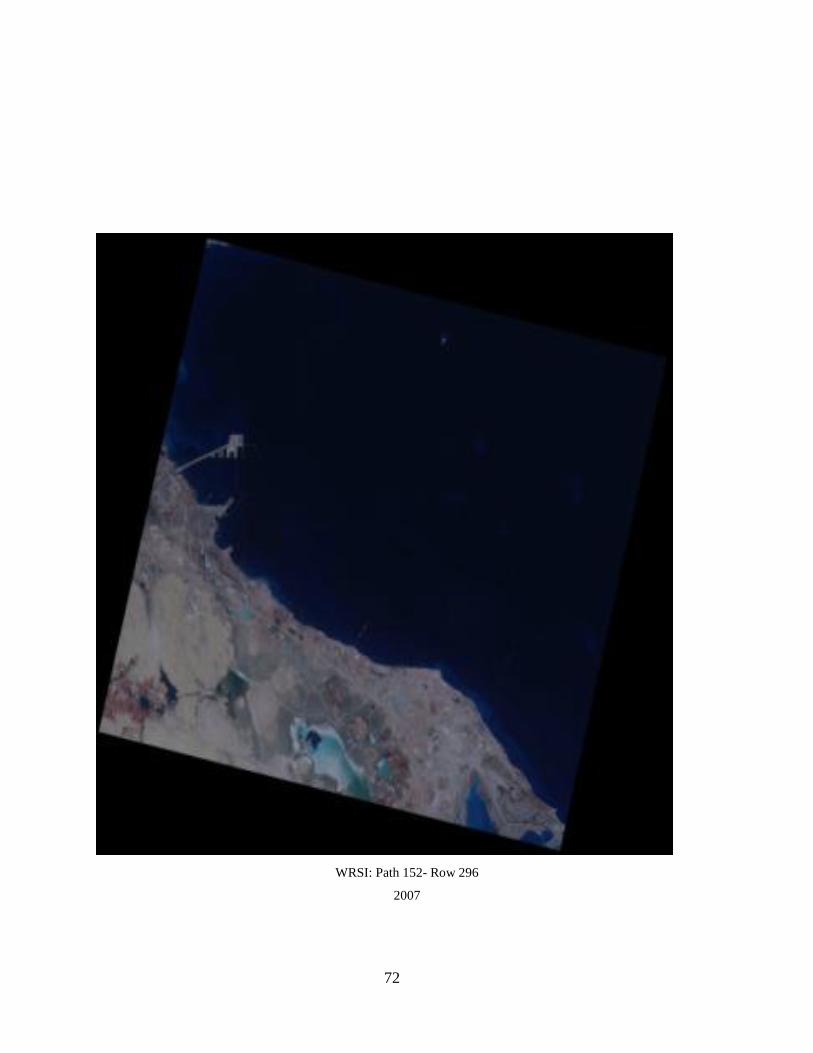
72
1
WRSI: Path 152- Row 296
2007

73
1
WRSI: Path 152- Row 297
2007
74
1
WRSI: Path 152- Row 298
2007

75
1
WRSI: Path 153- Row 297
2007
76
1
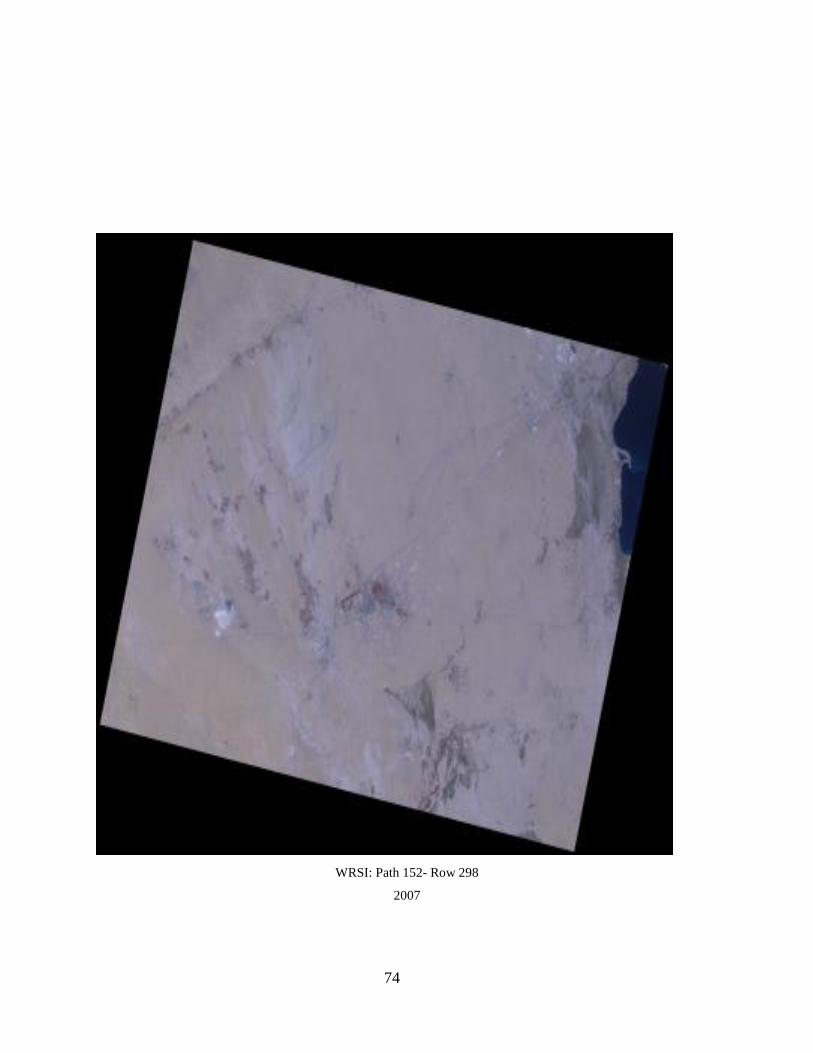
WRSI: Path 153- Row 298
2007

77
1
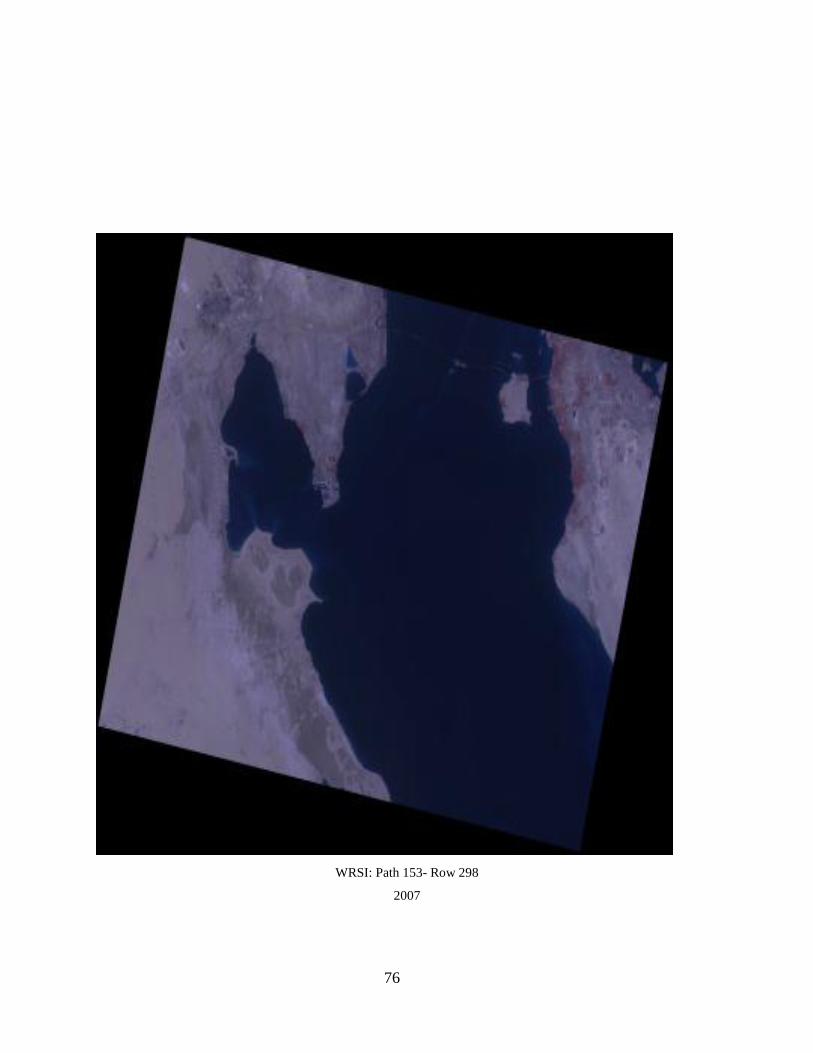
WRSI: Path 153- Row 299
2007
78
1
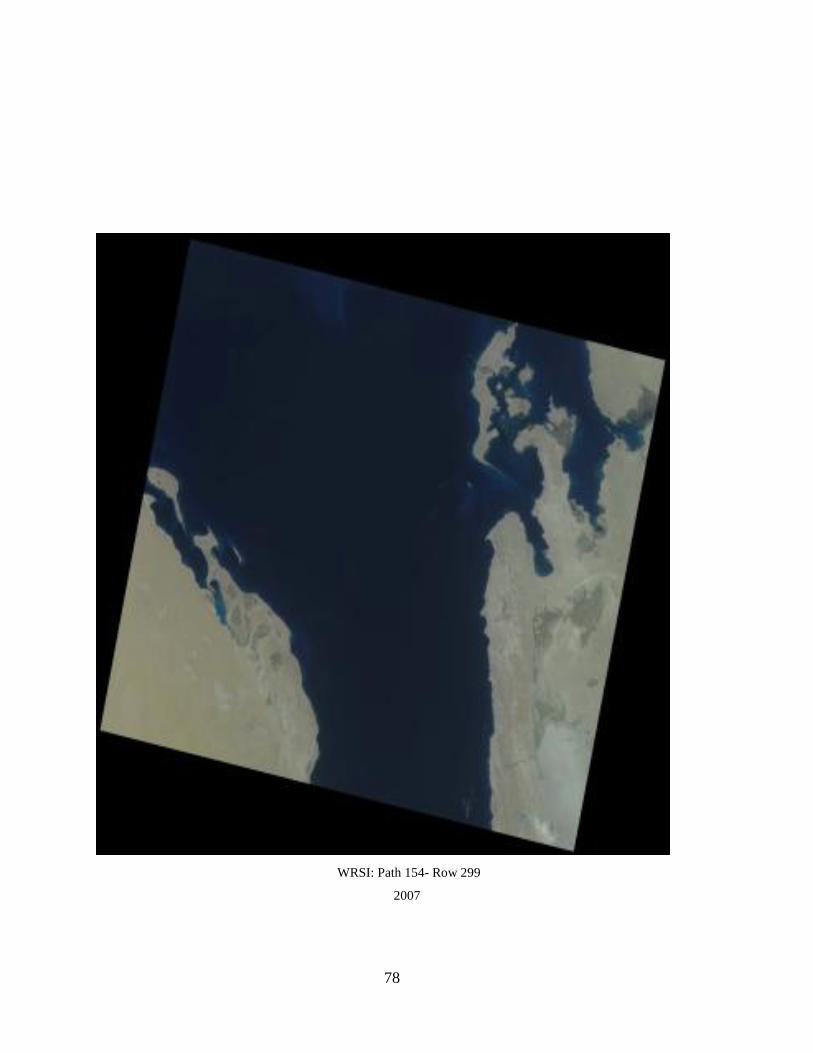
WRSI: Path 154- Row 299
2007

79
1
WRSI: Path 154- Row 300
2007

80
1
WRSI: Path 155- Row 300
2007

81
1
WRSI: Path 155- Row 301
2007

82
1
VITA
Tawfiq received his associated Diploma in industrial Laboratory Operation from AL-Jubail
collage (89-92) and his BS in Chemical Science from University of Toledo, Ohio, USA (1994-
1997).
Tawfiq Al-Rowaished is Saudi national joined Saudi Aramco in May, 2001 and worked in
Southern Area Producing Engineering Department (SAPED) as a lab scientist in Hydrocarbon
Analysis Unit. He was responsible to monitor the quality of lube oil used for rotating
equipment’s companywide under Saudi Aramco corporate program “oil conditioning
monitoring” (OCM). Tawfiq started his career as lab technician handling the analysis of ethylene
glycol and polyethylene process and product samples in “Sharq” one of Sabic Affiliates from
April, 1992 till August, 1994. After earning his bachelor degree in chemical science end of 1997
from the university of Toledo, Ohio (USA), he join Al-Jubail petrochemical company (Kemya),
as lab chemist responsible about the quality of polyethylene and ethylene product till May 2001.
When join Saudi Aramco in 2001 till the end of 2009, Tawfiq handle the quality of lube oil for
companywide rotating equipments under OCM program. And during his assignment with
Dhahran research center he assists in technical service projects and crude characterization
activities in which he provided technical support for the ongoing oil sales & marketing and
refining operations technical issues. Tawfiq currently live in Dammam (Ohod District) and can
be contacted by Tele: +966(03)872-2490 or via email: [email protected].

83
1