ms. janet a. encarnacion philippine stock...
TRANSCRIPT

Main Office: Maharlika Hi-Way, Banga 1stPlaridel, Bulacan Manila Office: Level 5, Tower 2, The Enterprise Center, 6766 Ayala Avenue Corner Paseo de Roxas, Makati City Telephone: (044) 670-1492 / 670-0693 / 795-0136 Fax: (044) 795-1979 Website: www.calatacorp.com
November 19, 2012 MS. JANET A. ENCARNACION Head, Disclosure Department Philippine Stock Exchange, Philippine Stock Exchange Plaza Ayala Triangle, Ayala Avenue, Makati City
Dear Ms. Encarnacion, Pursuant to the Revised Disclosure Rules of the Philippine Stock Exchange, we are attaching herewith the Third Quarter Report (SEC Form 17-Q) covering the period ended September 30, 2012 of Calata Corporation (the “Corporation”) which was filed with the Securities and Exchange Commission (“SEC”) on 19 November 2012. Very truly yours,
Atty. Jose Marie E. Fabella
Corporate Secretary / Corporate Information Officer / Compliance Officer


1 7 - Q
A 1 9 9 9 1 1 6 6 6 SEC Registration Number
C A L A T A C O R P O R A T I O N
(Company’s Full Name)
M C A R T H U R H I - W A Y B A N G A 1 S T
P L A R I D E L B U L A C A N
(Business Address: No. Street City/Town/Province)
Benison Paul B. De Torres 044-795-1979 (Contact Person) (Company Telephone Number)
1 2 3 1 Month Day (Form Type) Month Day
(Fiscal Year) (Annual Meeting)
(Secondary License Type, If Applicable)
Dept. Requiring this Doc. Amended Articles Number/Section
Total Amount of Borrowings
Total No. of Stockholders Domestic Foreign
To be accomplished by SEC Personnel concerned
File Number LCU
Document ID Cashier
S T A M P S
Remarks: Please use BLACK ink for scanning purposes.


SECURITIES AND EXCHANGE COMMISSION
SEC FORM 17-Q
QUARTERLY REPORT PURSUANT TO SECTION 17 OF THE SECURITIES REGULATION CODE AND SRC RULE 17(2)(b) THEREUNDER
1. For the quarterly period ended September 30, 2012.
2. Commission identification number A199911666 3. BIR Tax Identification No 005-712-797-000
4. Exact name of issuer as specified in its charter
Calata Corporation
5. Province, country or other jurisdiction of incorporation or organization Philippines
6. Industry Classification Code: (SEC Use Only)
............................................................................................................................. ..
...........
7. Address of issuer's principal office Postal Code
McArthur Highway, Banga 1st, Plaridel, Bulacan 3004 8. Issuer's telephone number, including area code
(044) 795 – 0136
9. Former name, former address and former fiscal year, if changed since last report
Not applicable
10. Securities registered pursuant to Sections 8 and 12 of the Code, or Sections 4 and 8 of the RSA
Title of each Class Number of shares of common
stock outstanding and amount
of debt outstanding
Common shares 360,112,000 shares
11. Are any or all of the securities listed on a Stock Exchange?
If yes, state the name of such Stock Exchange and the class/es of securities listed therein:
Philippine Stock Exchange Common shares


CALATA CORPORATION AND ITS SUBSIDIARY
(formerly Planters Choice Agro Products, Inc.)
CONSOLIDATED FINANCIAL STATEMENTS
AS OF SEPTEMBER 30, 2012 (UNAUDITED) AND DECEMBER 31, 2011 (AUDITED)
AND FOR THE NINE-MONTH PERIODS ENDED SEPTEMBER 30, 2012 AND 2011 (UNAUDITED)
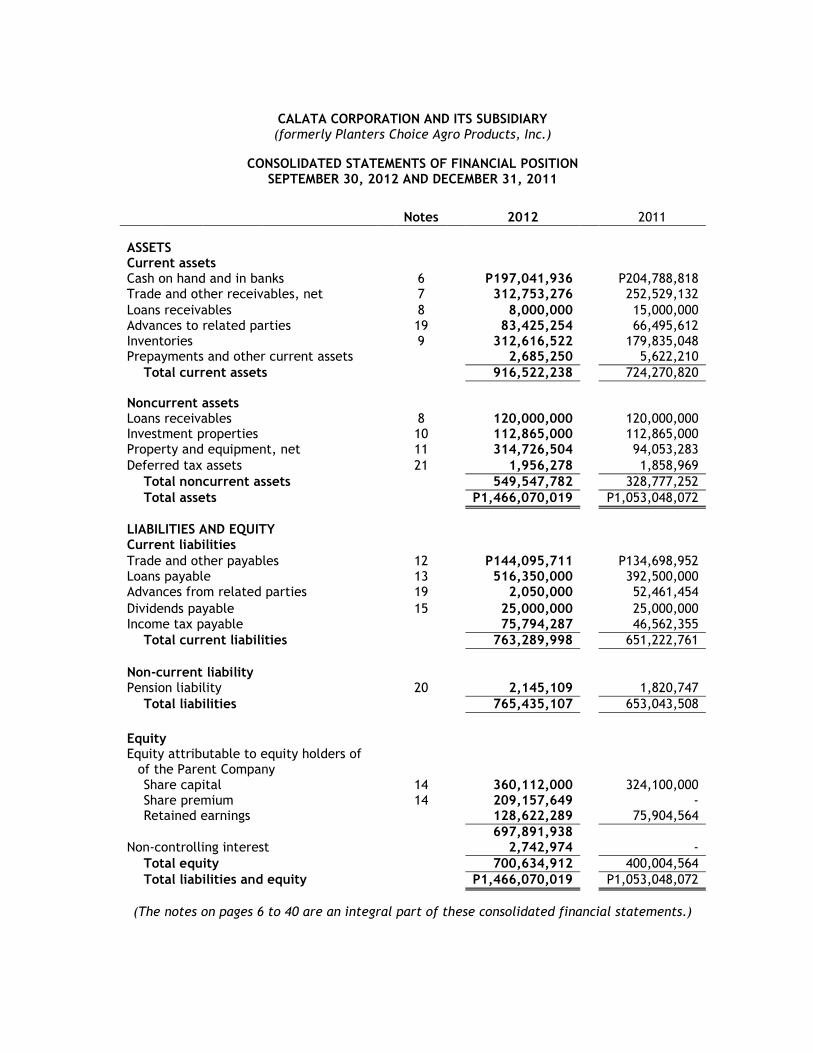
CALATA CORPORATION AND ITS SUBSIDIARY (formerly Planters Choice Agro Products, Inc.)
CONSOLIDATED STATEMENTS OF FINANCIAL POSITION SEPTEMBER 30, 2012 AND DECEMBER 31, 2011
Notes 2012 2011
ASSETS Current assets Cash on hand and in banks
6
P197,041,936
P204,788,818 Trade and other receivables, net
7
312,753,276
252,529,132
Loans receivables
8
8,000,000
15,000,000 Advances to related parties
19
83,425,254
66,495,612
Inventories
9
312,616,522
179,835,048 Prepayments and other current assets
2,685,250
5,622,210
Total current assets
916,522,238
724,270,820
Noncurrent assets Loans receivables
8
120,000,000
120,000,000 Investment properties
10
112,865,000
112,865,000
Property and equipment, net
11
314,726,504
94,053,283
Deferred tax assets
21
1,956,278
1,858,969
Total noncurrent assets
549,547,782
328,777,252
Total assets
P1,466,070,019
P1,053,048,072
LIABILITIES AND EQUITY Current liabilities Trade and other payables
12
P144,095,711
P134,698,952 Loans payable
13
516,350,000
392,500,000
Advances from related parties
19
2,050,000
52,461,454
Dividends payable
15
25,000,000
25,000,000 Income tax payable
75,794,287
46,562,355
Total current liabilities
763,289,998
651,222,761
Non-current liability Pension liability
20
2,145,109
1,820,747
Total liabilities
765,435,107
653,043,508
Equity Equity attributable to equity holders of of the Parent Company Share capital
14
360,112,000
324,100,000 Share premium
14
209,157,649
-
Retained earnings
128,622,289
75,904,564
697,891,938
Non-controlling interest
2,742,974
-
Total equity
700,634,912
400,004,564
Total liabilities and equity
P1,466,070,019
P1,053,048,072
(The notes on pages 6 to 40 are an integral part of these consolidated financial statements.)

CALATA CORPORATION AND ITS SUBSIDIARY (formerly Planters Choice Agro Products, Inc.)
CONSOLIDATED STATEMENTS OF INCOME FOR THE NINE-MONTH PERIODS ENDED
SEPTEMBER 30, 2012 AND 2011
Notes
For the nine-month period
ended September 30,
2012
For the three-month
period ended September 30,
2012
For the nine-month period ended
September 30, 2011
For the three-month period ended
September 30, 2011
Sales
16
P2,070,869,262
P900,543,672
P1,231,929,537
P397,160,551 Cost of sales
17
(1,853,761,771)
(815,270,685)
(1,078,634,986)
(347,086,841)
Gross profit
217,107,491
85,272,987
153,294,550
50,073,710 Operating expenses
18
(94,457,612)
(59,949,342)
(45,915,168)
(13,588,499)
Other operating income
415,128
107,164
30,279
(4,678)
Profit from operations
123,065,007
25,430,809
107,409,660
36,480,533 Finance income
6, 8
1,381,834
330,704
6,176,973
5,754,081
Finance costs
13
(23,576,118)
(9,221,541)
(20,621,836)
(8,132,022)
Profit before tax
100,870,723
16,539,972
92,964,797
34,102,593 Provision for income tax
21
(30,017,669)
(4,903,706)
(26,800,748)
(9,216,620)
Profit for the year
P70,853,054
P11,636,266
P66,164,050
P24,885,973
Basic and diluted earnings per share 23
P0.21
P0.03
P0.59
P0.22
Profit (loss) for the year attributable to:
Equity holders of the parent
P70,916,681
P11,699,893
P66,164,051
P24,885,972
Non-controlling interest
(63,627)
(63,627)
-
-
P70,853,054
P11,636,266
P66,164,051
P24,885,972
(The notes on pages 6 to 40 are an integral part of these consolidated financial statements.)

CALATA CORPORATION AND ITS SUBSIDIARY
(formerly Planters Choice Agro Products, Inc.)
CONSOLIDATED STATEMENTS OF COMPREHENSIVE INCOME FOR THE NINE-MONTH PERIODS ENDED
SEPTEMBER 30, 2012 AND 2011
Notes
For the nine-month period
ended September 30,
2012
For the three-month period
ended September 30,
2012
For the nine-month period ended
September 30, 2011
For the three-month period ended
September 30, 2011
Profit for the year
P70,853,054
P11,636,266
P66,164,050
P24,885,973 Other comprehensive income
-
-
-
-
Total comprehensive income
P70,853,054
P11,636,266
P66,164,050
P24,885,973
Basic and diluted earnings per share 23
P0.21
P0.03
P0.59
P0.22
Profit (loss) for the year attributable to:
Equity holders of the Parent Company
P70,916,681
P11,699,893
P-
P-
Non-controlling interest
(63,627)
(63,627)
-
-
P70,853,054
P11,636,266
P-
P-
(The notes on pages 6 to 40 are an integral part of these consolidated financial statements.)

CALATA CORPORATION
(formerly Planters Choice Agro Products, Inc.)
STATEMENTS OF CHANGES IN EQUITY
FOR THE NINE-MONTH PERIODS ENDED SEPTEMBER 30, 2012 AND 2011
Notes Share capital Share
premium Retained earnings
Total equity attributable to equity holders of the parent
Non-controlling
interest Total
Balance at January 1, 2011
P1,000,000
P-
P730,876
P1,730,876
P-
P1,730,876
Issuance of additional shares
323,100,000
-
-
323,100,000
-
323,100,000 Net income
-
-
66,164,051
66,164,051
-
66,164,051
Other comprehensive income
-
-
-
-
-
-
Balance at September 30, 2011
P324,100,000
P-
P66,894,927
P390,994,927
P-
P390,994,927
Balance at January 1, 2012
P324,100,000
P-
P75,904,564
P400,004,564
P-
P400,004,564
Issuance of additional shares
14
36,012,000
209,157,649
-
245,169,649
-
245,169,649 Gain from bargain purchase
6,801,044
6,801,044
-
6,801,044
Equity attributable to equity
holders of non-controlling interest
-
-
-
-
2,806,601
2,806,601
Net income
-
-
70,916,681
70,916,681
(63,627)
70,853,054 Other comprehensive income
-
-
-
-
-
-
Cash dividends declared
15
-
-
(25,000,000)
(25,000,000)
-
(25,000,000)
Balance at September 30, 2012
P360,112,000
P209,157,649
P128,622,289
P697,891,938
P2,742,974
P700,634,912
(The notes on pages 6 to 40 are an integral part of these financial statements.)

CALATA CORPORATION (formerly Planters Choice Agro Products, Inc.)
CONSOLIDATED STATEMENTS OF CASH FLOWS FOR THE NINE-MONTH PERIODS ENDED
SEPTEMBER 30, 2012 AND 2011
Notes 2012 2011
Cash flows from operating activities Profit before tax
P100,870,723
P92,964,797 Adjustments for:
Depreciation
11, 18
5,829,823
3,960,426
Pension costs
18, 20
324,362
353,382
Impairment loss on receivables
4,375,816
Finance income
6, 8
(1,381,834)
(6,176,973) Finance costs
13
23,576,118
20,621,836
Operating income before working capital changes
129,219,192
116,099,286
Decrease (increase) in:
Trade and other receivables
(60,224,144)
63,223,223
Advances to related parties
(41,929,642)
(29,479,641)
Inventories
(132,781,473)
30,068,786
Prepayments and other current assets
2,053,915
(6,772,846)
Increase (decrease) in:
Trade and other payables
9,396,760
(66,206,513)
Advances from related parties
(50,411,454)
14,208,940
Cash (used in)/provided by operations
(144,676,847)
121,141,235 Finance income received
6
1,381,834
6,176,973
Net cash (used in)/provided by operating activities
(143,295,013)
127,318,208
Cash flows from investing activities Increase in related party loans receivable
8
7,000,000
(120,021,190) Acquisition of investment property
(150,029,860)
Acquisition of property and equipment
11
(226,503,044)
- Disposal of property and equipment
-
2,114,101
Net cash used in investing activities
(219,503,044)
(267,936,949)
Cash flows from financing activities Issuance of additional shares
14
245,169,649
323,100,000 Net availments (payments) of short-term
loans payable
13
123,850,000
(73,500,000)
Acquisition of subsidiary
9,607,644
- Finance cost paid
13
(23,576,118)
(20,621,836)
Net cash provided by generated from financing activities
355,051,175
228,978,164
Net increase (decrease) in cash
on hand and in banks
(7,746,882)
88,359,423
Cash on hand and in banks
January 1
204,788,818
19,106,061
September 30
P197,041,936
P107,465,484
(The notes on pages 6 to 40 are an integral part of these consolidated financial statements.)

CALATA CORPORATION AND ITS SUBSIDIARY (formerly Planters Choice Agro Products, Inc.)
NOTES TO CONSOLIDATED FINANCIAL STATEMENTS
AS OF SEPTEMBER 30, 2012 AND DECEMBER 31, 2011 AND FOR THE NINE-MONTH PERIODS ENDED SEPTEMBER 30, 2012 AND 2011
NOTE 1 – CORPORATE INFORMATION Calata Corporation (formerly Planters Choice Agro Products, Inc.) (the Parent Company) and its subsidiary (collectively referred herein as the Group) was organized under the laws of the Republic of the Philippines. The Parent Company was registered with the Philippine Securities and Exchange Commission (SEC) per Registration No. A199911666 on July 23, 1999 primarily to conduct, engage in and carry on, as principal or otherwise, all lawful business activities involving livestock and agricultural business, corporate or otherwise, such as but not limited to the business of acquiring, raising, breeding, slaughtering, preserving, processing, packing, canning, enveloping, storing, commercially distributing, marketing, exporting, and selling at wholesale or retail livestock such as chicken, fowl, cattle, calves, hogs, goats, sheep, lambs, all kinds of livestock and other animals, as may be permitted by law, for food purposes; the business of cultivating, planting, growing, producing, buying, preserving, processing, packing, canning, enveloping, storing, commercially distributing, marketing, exporting, and selling at wholesale or retail food and agricultural products including all kinds of goods, commodities, wares and merchandise of every kind and descriptions whether natural or artificial as may be permitted by law; the business of manufacturing, preparing stocking, packing, buying, selling, importing and exporting, dealing in and delivering all kinds of livestock and agricultural products such as but not limited to poultry, livestock, marine feeds, feed additives, fertilizers, pesticides, all types of chemicals and substance used for livestock and agriculture, and/or whatsoever materials which may be necessary or incidental to their manufacture or preparation inside or outside the Philippines and all kinds of materials and products and by-products arising out of or used in the breeding and slaughtering of poultry and livestock and all other agricultural activities for food purposes; and to direct, establish, construct, acquire, sell, lease operate and maintain slaughterhouse, dressing plants, processing plant, refrigerating plants, cold storage, warehouses, sheds, silos, bodegas, storage bins, and other buildings, facilities, structures and equipment necessary or expedient for the carrying out of the purposes aforesaid. The Parent Company’s registered address and principal place of business is at McArthur Highway, Banga 1st, Plaridel, Bulacan. On January 5, 2010, the Parent Company’s Board of Directors (BOD) amended its By-laws to change the corporate name from Planters Choice Agro Products, Inc. to Calata Corporation. On February 22, 2010, the SEC issued a Certificate of Amendment approving the said amendment. On August 5, 2011, the Parent Company’s BOD amended its article of incorporation to increase its authorized capital stock from P1,000,000 to P345,400,000 with par value of P100 to P1, respectively (see Note 14). On August 17, 2011, the SEC issued a Certificate of Amendment approving the said amendment. On August 18, 2011, the Parent Company’s BOD amended its article of incorporation to increase its authorized capital stock from P345,400,000 to P845,400,000 (see Note 14). On August 25, 2011, the SEC issued a Certificate of Amendment approving the said amendment. On December 28, 2011, with the approvals by the Philippine Stock Exchange (PSE) for the Parent Company’s application for listing and by the SEC for the Registration Statement, a total of 360,112,000 common shares, with P1 par value, representing 10% of outstanding capital stock, was offered and subscribed through an initial public offering at P7.50 per share on May 10-16, 2012 (see Note 14). The common shares comprise of 360,112,000 new shares issued by the Company by way of a primary offer. The Company’s common shares were listed and commenced trading on the PSE on May 8, 2012.
7
On August 2012, the Parent Company’s BOD approved the execution of the Memorandum of Agreement pertaining to the Parent Company’s acquisition of 95.69% of Agri Phil Corporation (APC). Under this agreement, in exchange for 95.69% equity ownership of APC, the advances of the Parent Company to APC amounting to P55,455,249 will be converted to equity of APC. APC is a corporation established to engage in import/export, buying, selling, distributing and marketing at wholesale and retail all kinds of goods of every kind and description such as but not limited to agricultural products. APC has been included in the consolidated financial statements by the time the Parent Company gained control. NOTE 2 - SUMMARY OF SIGNIFICANT ACCOUNTING POLICIES 2.1 Basis of preparation The principal accounting policies applied in the preparation of these consolidated financial statements are set out below. These policies have been consistently applied to the years presented, unless otherwise stated. Statement of compliance The consolidated financial statements of the Group have been prepared in compliance with Philippine Financial Reporting Standards (PFRS). Basis of measurement and presentation The consolidated financial statements have been prepared on a historical cost basis. The consolidated financial statements are prepared in Philippine Peso (P), which is the Group’s functional and presentation currency. All values are rounded off to the nearest peso, unless otherwise indicated. Use of judgments and estimates The preparation of consolidated financial statements in compliance with PFRS requires the use of certain critical accounting estimates. It also requires the Group’s management to exercise judgment in applying the Group’s accounting policies. The areas where significant judgments and estimates have been made in preparing the consolidated financial statements and their effects are disclosed in Note 3. Changes in accounting policies a. New standards, interpretations and amendments effective from January 1, 2012
The accounting policies adopted are consistent with those of the previous financial year except for the following new standards, amendments and interpretations effective for the first time from January 1, 2012 of which none have had a material effect on the consolidated financial statements:
PAS 12 Income Taxes - Recovery of Underlying Assets
PFRS 7 Financial Instruments: Disclosures - Enhanced Derecognition Disclosure Requirements

8
The adoption of the standards or interpretations is described below:
PAS 12 Deferred Tax: Recovery of Underlying Assets (Amendment): This standard requires an entity to measure the deferred tax relating to an asset depending on whether the entity expects to recover the carrying amount of the asset through use or sale. It can be difficult and subjective to assess whether recovery will be through use or through sale when the asset is measured using the fair value model in PAS 40, Investment Property. The amendment provides a practical solution to the problem by introducing a presumption that recovery of the carrying amount will, normally be through sale.
As a result of the amendments, PIC-21 Income Taxes - Recovery of Revalued Non-Depreciable Assets would no longer apply to investment properties carried at fair value. The amendments also incorporate into PAS 12 the remaining guidance previously contained in PIC-21, which is accordingly withdrawn.
PFRS 7 Financial Instruments: Disclosures - Enhanced Derecognition Disclosure Requirements: The amendment requires additional disclosure on financial assets that have been transferred but not derecognized to enable the user of the Group’s consolidated financial statements to understand the relationship with those assets that have not been derecognized and their associated liabilities. In addition, the amendment requires disclosures about continuing involvement in derecognized assets to enable the user to evaluate the nature of, and risks associated with, the Group’s continuing involvement in those derecognized assets. The amendment affects disclosures only and has no impact on the Group’s financial position or performance.
Improvement to PFRS (Issued in 2011) The following amendments have been adopted as they become effective for annual periods on or after January 1, 2011:
Classification of Rights Issues (Amendment to PAS 32)
Amendment to PFRS 1 First-time Adoption of International Financial Reporting Standards
Amendments to PAS 24 Related Party Disclosures
PIC 19 Extinguishing Financial Liabilities with Equity Instruments
Amendments to PIC 14 Prepayments of a Minimum Funding Requirement Improvement to PFRS (Issued in May 2010) The FRSC issued improvements to PFRS, an omnibus of amendments to its PFRS. The following amendments have been adopted as they become effective for annual periods on or after either July 1, 2010 or January 1, 2011:
PFRS 3 Business Combination;
PFRS 7 Financial Instruments: Disclosures;
PAS 1 Presentation of Consolidated financial statements;
PAS 27 Consolidated and Separate Consolidated financial statements; and
PIC Interpretation 13 Customer Loyalty Programs.
The Group, however, expects no significant impact from the adoption of the amendments on its financial position or performance. b. New standards, interpretations and amendments issued but not yet effective Standards issued but not yet effective up to the date of issuance of the Group’s consolidated financial statements are listed below. This listing of standards and interpretations issued, which the Group reasonably expects to be applicable at a future date. The Group intends to adopt those standards when they become effective.

9
PFRS 9 Financial Instruments: Classification and Measurement: PFRS 9 as issued reflects the first phase of the FRSC work on the replacement of PAS 39 and applies to classification and measurement of financial assets as defined in PAS 39. The standard is effective for annual periods beginning on or after January 1, 2013. In subsequent phases, the FRSC will address classification and measurement of financial liabilities, hedge accounting and derecognition. The completion of this project is expected in early 2011. The adoption of the first phase of PFRS 9 will have an effect on the classification and measurement of the Group’s financial assets. The Group did not conduct an evaluation on the possible financial impact of an early adoption of the new standard as the Group will not early adopt the standard. However, initial indications show that adoption of PFRS 9 will have no significant impact on its financial position or performance.
PFRS 10 Consolidated financial statements: This standard was developed to eliminate perceived conflict on concept of consolidation between PAS 27, Consolidated and Separate Consolidated financial statements (amended in 2008) and PIC-12, Consolidation – Special Purpose Entities. PAS 27 (amended in 2008) requires consolidation of entities based on control whereas PIC-12 mandates consolidation of entities based on risks and rewards. It provides a new definition of control based on three elements: power over the investee, exposure or rights to variable returns from involvement with the investee, ability to use power over the investee to affect the amount of investor’s return.
The new standard is applicable to annual periods beginning on or after
January 1, 2013. Earlier application is permitted.
PFRS 11 Joint Arrangements: This standard requires an entity to account joint arrangement based on its rights and obligations arising from the arrangement rather than based on the structure of the arrangement as required by PAS 31, Interests in Joint Ventures. The new standard has removed the option to account jointly controlled entities using either proportionate consolidation or equity method.
The new standard is applicable to annual periods beginning on or after January 1, 2013. Earlier application is permitted.
PFRS 12 Disclosures of interests in Other Entities: This standard prescribes all of the disclosure requirements for subsidiaries, joint arrangements, associates and unconsolidated structured entities.
The new standard is applicable to annual periods beginning on or after January 1, 2013. Earlier application is permitted.
PFRS 13 Fair Value Measurement: This standard was developed to eliminate inconsistencies of fair value measurements dispersed in various existing PFRSs. It clarifies the definition of fair value, provides a single framework for measuring fair value and enhances fair value disclosures.
The new standard is applicable to annual periods beginning on or after January 1, 2013. Earlier application is permitted.
PAS 27 Separate Consolidated financial statements: This completes the consolidation project. The standard was amended to contain requirements relating only to separate consolidated financial statements.
The amended standard is applicable to annual periods beginning on or after
January 1, 2013. Earlier application is permitted.
PAS 28 Investments in Associates and Joint Ventures: The new standard on joint arrangements is applied to determine the type of joint arrangement in which an entity is involved. With this, PAS 28 was amended to incorporate accounting requirements for joint ventures. Once an entity has determined that it has an interest in a joint venture,

10
it accounts for the investment using the equity method in accordance with PAS 28 (amended in 2011).
The amended standard is applicable to annual periods beginning on or after
January 1, 2013. Earlier application is permitted.
Amendments to PAS 1 Presentation of Items of Other Comprehensive Income: The presentation of Items of Other Comprehensive Income (Amendments to PAS 1) amended paragraphs 7, 10, 82, 85-87, 90, 91, 94, 100 and 115, added paragraphs IN 17-IN 19, 10A, 81A, 81B, 82A and 139J and deleted paragraphs 12, 81, 83 and 84.
Entities shall apply those amendments for annual periods beginning on or after July 1, 2012. Earlier application is permitted.
PAS 19 Employee Benefits (Amendment): Significant changes to this standard include: removal of corridor approach in recognizing actual gains and losses, presentation of remeasurements on defined benefit plans in other comprehensive income and improved disclosure requirements.
The amended standard is applied retrospectively with limited exceptions. Entities shall apply the amended PAS 19 for annual periods beginning on or after
January 1, 2013. Earlier application is permitted.
2.2 Basis of consolidation
The consolidated financial statements comprise the financial statements of the Parent Company and its subsidiary. A subsidiary is an entity over which the Parent Company has the power to govern the financial operating policies generally accompanying a shareholding giving rise to a majority of voting rights. The subsidiary is fully consolidated from the date of acquisition, being the date on which the Parent Company obtains control, and continues to be consolidated until the date when such control ceases. The financial statements of the subsidiary are prepared for the same reporting period as the Company, using consistent accounting policies. All intra-group balances, transactions, unrealized gains and losses resulting from intra-group transactions and dividends are eliminated in full. A change in the ownership interest of a subsidiary, without a loss of control, is accounted for as an equity transaction. If the Parent Company loses control over the subsidiary, it:
derecognizes the assets (including goodwill) and liabilities of the subsidiary
derecognizes the carrying amount of any non-controlling interest
derecognizes the cumulative translation differences recorded in equity
recognizes the fair value of the consideration received
recognizes the fair value of any investment retained
recognizes any surplus or deficit in profit or loss
reclassifies the parent’s share of components previously recognized in other comprehensive income to profit or loss or retained earnings, as appropriate.
Losses within a subsidiary are attributed to the non-controlling interest even if that results in a deficit balance. 2.3 Financial instruments Initial recognition Financial assets and financial liabilities are recognized in the consolidated statements of financial position when the Group becomes a party to the contractual provisions of the instrument. In the
11
case of a regular way purchase or sale of financial assets, recognition is done at trade date, which is the date on which the Group commits to purchase or sell the asset. Financial instruments are recognized initially at fair value plus transaction costs except for financial instruments measured at fair value through profit or loss (FVPL). Classification of financial instruments The Group classifies its financial assets as financial assets at FVPL, held-to-maturity (HTM) financial assets, loans and receivables or available for sale (AFS) financial assets. The Company’s financial assets as of September 30, 2012 and December 31, 2011 comprise of loans and receivables, which include cash on hand and in banks, trade and other receivables, loans receivable and advances to related parties. Financial liabilities are classified as financial liabilities at FVPL and other financial liabilities. The Group’s other financial liabilities as of September 30, 2012 and December 31, 2011 comprise of trade and other payables, short term loans payable, advances from related parties and dividends payable. The classification depends on the purpose for which the investments were acquired or whether they are quoted in an active market. Management determines the classification of its financial assets and liabilities at initial recognition and, where allowed and appropriate, re-evaluates such designation at every financial reporting date. Classification of financial instruments between debt and equity Financial instruments are classified as liability or equity in accordance with the substance of the contractual arrangement. Interest, dividends, gains and losses relating to a financial instrument or a component that is a financial liability is reported as expense or income. Offsetting of financial instruments Financial assets and financial liabilities are offset and the net amount is reported in the consolidated statements of financial position if, and only if, there is a currently enforceable legal right to offset the recognized amounts and there is an intention to settle on a net basis, or to realize the asset and settle the liability simultaneously. This is not generally the case with master netting agreements, and the related assets and liabilities are presented gross in the consolidated statements of financial position. Determination of fair value The fair value of financial instruments traded in active markets is based on their quoted market price or dealer price quotation (bid price for long positions and ask price for short positions). When current bid and asking prices are not available, the price of the most recent transaction provides evidence of the current fair value as long as there has not been a significant change in economic circumstances since the time of the transaction. If the financial instruments are not listed in an active market, the fair value is determined using appropriate valuation techniques which include recent arm’s length market transactions, net present value techniques, comparison to similar instruments for which market observable prices exist, options pricing models, and other relevant valuation models. Derecognition of financial instruments A financial asset or, where applicable, a part of a financial asset or part of a group of similar financial assets is derecognized when: a) the rights to receive cash flows from the asset have expired; b) the Group retains the right to receive cash flows from the asset, but has assumed an obligation to pay them in full without material delay to a third party under a ‘pass-through’ arrangement; or c) the Group has transferred its rights to receive cash flows from the asset and either has transferred substantially all the risks and rewards of the asset, or has neither transferred nor retained substantially all the risks and rewards of the asset, but has transferred control of the asset.
12
When the Group has transferred its rights to receive cash flows from an asset and has neither transferred nor retained substantially all the risks and rewards of the asset nor transferred control of the asset, the asset is recognized to the extent of the Group’s continuing involvement in the asset. A financial liability is derecognized when the obligation under the liability is discharged or cancelled or has expired. When an existing financial liability is replaced by another from the same lender on substantially different terms, or the terms of an existing liability are substantially modified, such an exchange or modification is treated as a derecognition of the original liability and the recognition of a new liability, and the difference in the respective carrying amounts is recognized in the consolidated statement of comprehensive income. Financial assets Financial assets at FVPL
This category comprises only in-the-money derivatives which are carried in the consolidated statements of financial position at fair value with changes in fair value recognized in the consolidated statement of comprehensive income in the finance income or cost line item. The Group does not have any assets held for trading nor does it voluntarily classify any financial assets as being at FVPL. Loans and receivables These assets are non-derivative financial assets with fixed or determinable payments that are not quoted in an active market. They arise principally through the provision of goods and services to customers (e.g. trade receivables), but also incorporate other types of contractual monetary asset. They are initially recognized at fair value plus transaction costs that are directly attributable to their acquisition or issue, and are subsequently carried at amortized cost using the effective interest rate (EIR) method, less provision for impairment.
Impairment provisions are recognized when there is objective evidence (such as significant financial difficulties on the part of the counterparty or default or significant delay in payment) that the Company will be unable to collect all of the amounts due under the terms receivable, the amount of such a provision being the difference between the net carrying amount and the present value of the future expected cash flows associated with the impaired receivable. For trade receivables, which are reported net; such provisions are recorded in a separate allowance account with the loss being recognized within operating expenses in the consolidated statement of comprehensive income. On confirmation that the trade receivable will not be collectable, the gross carrying value of the asset is written off against the associated provision. The Group's loans and receivables comprise cash on hand and in banks, trade and other receivables, loans receivable and advances to related parties in the consolidated statements of financial position. HTM investments HTM investments are quoted non-derivative financial assets with fixed or determinable payments and fixed maturities for which the Group’s management has the positive intention and ability to hold to maturity. After initial measurement, these investments are measured at amortized cost using the EIR method, less impairment in value. Amortized cost is calculated by taking into account any discount or premium on acquisition and fees that are an integral part of the EIR. Gains and losses are derecognized or impaired, as well as through the amortization process. The Group does not have any assets under this category.
13
AFS investments AFS investments include equity and debt securities. Equity investments classified as AFS are those, which are neither classified as held for trading nor designated at FVPL. Debt securities in this category are those which are intended to be held for an indefinite period of time and which may be sold in response to needs for liquidity or in response in the market conditions. After initial measurement, AFS investments are subsequently measured at fair value with unrealized gains or losses recognized as other comprehensive income in the available-for-sale reserve until the investment is derecognized, at which time the cumulative gain or loss is recognized in other operating income or expense, or determined to be impaired, at which time the cumulative loss is reclassified to the consolidated statement of comprehensive income in finance costs and removed from the AFS reserve. The Group evaluated its AFS assets whether the ability and intention to sell them in the near term is still appropriate. When the Group is unable to trade these financial assets due to inactive markets and management’s intention to do so significantly changes in the foreseeable future, the Group may elect to reclassify these assets for the foreseeable future or until maturity. Reclassification to the HTM category is permitted only when the entity has the ability and intention to hold the financial asset accordingly. For a financial asset reclassified out of the AFS category, any previous gain or loss on that asset that has been recognized in equity is amortized to profit or loss over the remaining life of the investment using the EIR. Any difference between the new amortized cost and the expected cash flows is also amortized over the remaining life of the asset using the EIR. If the asset is subsequently determined to be impaired, then the amount recorded in equity is reclassified to the consolidated statement of comprehensive income. The Group does not have any asset under this category. Financial liabilities Financial liabilities at FVPL This category comprises only out-of-the-money derivatives. They are carried in the consolidated statements of financial position at fair value with changes in fair value recognised in the consolidated statement of comprehensive income. The Group does not have any liabilities held for trading nor has it designated any financial liabilities as being at FVPL. Other financial liabilities Other financial liabilities include trade and other payables, advances from related parties and short-term loans, which are initially recognised at fair value and subsequently carried at amortised cost using the EIR method. Fair value measurement hierarchy PFRS 7 requires certain disclosures which require the classification of financial assets and financial liabilities measured at fair value using a fair value hierarchy that reflects the significance of the inputs used in making the fair value measurement (see Note 3). The fair value hierarchy has the following levels: a) quoted prices (unadjusted) in active markets for identical assets or liabilities (Level 1); b) inputs other than quoted prices included within Level 1 that are observable for the asset or
liability, either directly (i.e. as prices) or indirectly (i.e. derived from prices) (Level 2); and c) inputs for the asset or liability that are not based on observable market data (unobservable
inputs) (Level 3).

14
The level in the fair value hierarchy within which the financial asset or financial liability is categorized is determined on the basis of the lowest level input that is significant to the fair value measurement. Financial assets and financial liabilities are classified in their entirety into only one of the three levels. Impairment of financial assets Assessment of impairment The Group assesses at each financial reporting date whether a financial asset or group of financial assets is impaired. It assesses whether objective evidence of impairment exists individually for financial assets that are individually significant, or collectively for financial assets that are not individually significant. If it is determined that no objective evidence of impairment exists for an individually assessed financial asset, whether significant or not, the asset is included in a group of financial assets with similar credit risk characteristics and that group of financial assets is collectively assessed for impairment. Assets that are individually assessed for impairment and for which an impairment loss is or continues to be recognized are not included in a collective assessment of impairment. The determination of impairment losses for financial assets is inherently subjective because it requires material estimates, including the amount and timing of expected recoverable future cash flows. These estimates may change significantly from time to time, depending on available information. Evidence of impairment Objective evidence that financial assets are impaired can include default or delinquency by a borrower, restructuring of a loan or advance by the Group on terms that the Group would not otherwise consider, indications that a borrower or issuer will enter bankruptcy, the disappearance of an active market for a security, or other observable data relating to a group of assets such as adverse changes in the payment status of borrowers or issuers in the Group, or economic conditions that correlate with defaults in the Group. Impairment on assets carried at amortized cost If there is objective evidence that an impairment loss on loans and receivables carried at amortized cost has been incurred, the amount of loss is measured as the difference between the asset’s carrying amount and the present value of estimated future cash flows (excluding future credit losses) discounted at the financial asset’s original EIR (i.e. the EIR computed at initial recognition). The carrying amount of the asset shall be reduced either directly or through use of an allowance account. The amount of loss shall be recognized in “Other operating income or expenses” in the consolidated statement of comprehensive income. Impairment on assets carried at cost If there is objective evidence of an impairment loss on an unquoted equity instrument that is not carried at fair value because its fair value cannot be reliably measured, or of a derivative asset that is linked to and must be settled by delivery of such an unquoted equity instrument, the amount of the loss is measured as the difference between the asset’s carrying amount and the present value of estimated future cash flows discounted at the current market rate of return for a similar financial asset. Reversal of impairment loss If, in a subsequent period, the amount of the impairment loss decreases and the decrease can be related objectively to an event occurring after the impairment was recognized, the previously recognized impairment loss is reversed. Any subsequent reversal of an impairment loss is recognized in “Other operating income or expenses” in the consolidated statement of

15
comprehensive income, to the extent that the carrying value of the asset does not exceed its cost or amortized cost at the reversal date. 2.4 Inventories
Inventories are initially recognised at cost, and subsequently at the lower of cost and net realizable value (NRV). Cost comprises all costs of purchase, costs of conversion and other costs incurred in bringing the inventories to their present location and condition. Cost is calculated using the first-in, first-out method. NRV represents the estimated selling price less all estimated costs to be incurred in marketing, selling and distributing the goods. When the NRV of the inventories is lower than the cost, the Group provides for an allowance for the decline in the value of the inventory and recognizes the write-down as an expense in the consolidated statement of comprehensive income. When inventories are sold, the carrying amount of those inventories is recognized as an expense in the period in which the related revenue is recognized. 2.5 Prepayments and other current assets Prepayments represent expenses not yet incurred but already paid in cash. Prepayments are initially recorded as assets and measured at the amount of cash paid. Subsequently, these are charged to the consolidated statement of comprehensive income as they are consumed in operations or expire with the passage of time. Prepayments are classified in the consolidated statements of financial position as current assets when the cost of goods or services related to the prepayment are expected to be incurred within one year or the Group’s normal operating cycle, whichever is longer. Otherwise, prepayments are classified as non-current assets. Other current assets are recognized when the Group expects to receive future economic benefit from it and the amount can be measured reliably. 2.6 Investment properties Investment property, which pertains to land held to earn rentals and/or for capital appreciation, is measured initially at cost, including transaction costs. Subsequent to initial recognition, investment property is measured at cost less accumulated impairment loss, if any. Transfers to, or from, investment property shall be made only when there is a change in use. Investment property is derecognized by the Group upon its disposal or the investment property is permanently withdrawn from use and no future economic benefits are expected from its disposal. Any gain or loss on the retirement or disposal of investment properties is recognized in the consolidated statement of comprehensive income in the year of retirement or disposal. Expenditures incurred after the investment properties have been put into operations, such as repairs and maintenance costs, are charged to the consolidated statement of comprehensive income in the year the costs are incurred. Gains or losses on disposals are determined by comparing the proceeds with the carrying amount and are recognized in the consolidated statement of comprehensive income. 2.7 Property and equipment Property and equipment are initially measured at cost. At the end of each reporting period, items of property and equipment are measured at cost less any subsequent accumulated depreciation, amortization and impairment losses. Cost includes expenditure that is directly attributable to the acquisition of the asset and the estimated present value of any future unavoidable costs of dismantling and removing items. The corresponding liability is recognized within provisions.

16
Subsequent expenditures relating to an item of property and equipment that have already been recognized are added to the carrying amount of the asset when it is probable that future economic benefits, in excess of the originally assessed standard of performance of the existing asset, will flow to the Group. All other subsequent expenditures are recognized as expense in the period in which those are incurred. Depreciation is computed on the straight-line method based on the estimated useful lives of the assets as follows:
Office equipment 5 years Transportation equipment 5 years Leasehold improvement 5 years
Properties in the course of construction for production, rental or administrative purposes, or for purposes not yet determined, are carried at cost, less any recognized impairment loss. Cost includes professional fees and for qualifying assets, borrowing costs capitalized in accordance with the Group’s accounting policy. Leasehold improvements are amortized over the terms of the lease or the estimated useful life of the leasehold improvement, whichever is shorter. Depreciation of these assets, on the same basis as other property assets, commences at the time the assets are ready for their intended use. The estimated useful lives and depreciation method are reviewed periodically to ensure that the periods and method of depreciation are consistent with the expected pattern of economic benefits from items of property and equipment. When assets are retired or otherwise disposed of, the cost and the related accumulated depreciation and any impairment in value are removed from the accounts and any resulting gain or loss arising on the disposal or retirement of an asset, determined as the difference between the sales proceeds and the carrying amount of the asset, is recognized in the consolidated statement of comprehensive income. 2.8 Impairment of non-financial assets The carrying amounts of the Group’s non-financial assets such as investment properties and property and equipment are reviewed at each financial reporting date to determine whether there is any indication of impairment or an impairment loss previously recognized no longer exists or may have decreased. If any such indication exists, the Group makes a formal estimate of the asset’s recoverable amount. The recoverable amount is the higher of an asset or its cash generating unit’s (CGU) fair value less costs to sell and its value in use. The fair value less costs to sell is the amount obtainable from the sale of the asset in an arm’s length transaction. In assessing value in use, the estimated future cash flows are discounted to their present value using a pre-tax discount rate that reflects current market assessments of the time value of money and the risks specific to the asset. For an asset that does not generate cash flows independent of those from other assets, the recoverable amount is determined for the CGU to which the asset belongs. Whenever the carrying amount of an asset or its CGU exceeds its recoverable amount, the asset is considered impaired and is written down to its recoverable amount and an impairment loss is recognized in the consolidated statement of comprehensive income. An impairment loss is reversed if there has been a change in the estimates used to determine the recoverable amount. An impairment loss is reversed only to the extent that the asset’s carrying amount does not exceed the carrying amount that would have been determined, net of depreciation, if no impairment loss had been recognized. Reversals of impairment are recognized in the consolidated statement of comprehensive income.

17

18
2.9 Provisions and contingencies Provisions are recognized when: (a) the Group has a present obligation (legal or constructive) as a result of a past event; (b) it is probable that an outflow of resources embodying economic benefits will be required to settle the obligation; and (c) a reliable estimate can be made of the amount of the obligation. If the effect of the time value of money is material, provisions are determined by discounting the expected future cash flows at a pre-tax rate that reflects current market assessments of the time value of money and, where appropriate, the risks specific to the liability. Where discounting is used, the increase in the provision due to the passage of time is recognized as finance cost. When the Group expects a provision or loss to be reimbursed, the reimbursement is recognized as a separate asset only when the reimbursement is virtually certain and its amount is estimable. The expense relating to any provision is presented in the consolidated statement of comprehensive income, net of any reimbursement. Contingent liabilities are not recognized in the Group’s consolidated financial statements. They are disclosed unless the possibility of an outflow of resources embodying economic benefits is remote. Contingent assets are not recognized in the Group’s consolidated financial statements but disclosed in the notes to Group’s consolidated financial statements when an inflow of economic benefits is probable. 2.10 Pension benefits Pension cost is determined using the projected unit credit method. This method reflects the services rendered by the employees up to the date of valuation and incorporates assumptions concerning employees’ projected salaries. Actuarial valuations are conducted with sufficient regularity, with option to accelerate when significant changes to underlying assumptions occur. Pension expense includes current service cost, interest cost, recognized actuarial gains and losses, the effect of any curtailment or settlements and amortization of transitional liability at the date of adoption of PAS 19. The defined benefit liability / defined benefit asset recognized in the consolidated statements of financial position is the present value of the defined benefit obligation at the financial reporting date less the fair value of plan assets, together with adjustments for unrecognized actuarial gains or losses and past service costs. The defined benefit obligation is calculated by an actuary using the projected unit credit method. The present value of the defined benefit obligation is determined by discounting the estimated future cash outflows using interest rates of government bonds that are denominated in the currency in which the benefits will be paid, and that have terms to maturity approximating the terms of the related retirement liabilities. Cumulative unrecognized actuarial gains and losses arising from experience adjustments and changes in actuarial assumptions in excess of the greater of 10% of the value of plan assets or 10% of the defined benefit obligation are spread to income over the expected average remaining working lives of employees. Past-service costs are recognized immediately in income, unless the changes to the pension plan are conditional on the employees remaining in service for a specified period of time (the vesting period). In this instance, the past-service costs are amortized on a straight-line basis over the vesting period. 2.11 Equity Financial instruments issued by the Group are classified as equity only to the extent that they do not meet the definition of a financial liability or financial asset. The Group’s ordinary shares are classified as equity instruments. Share capital is determined using the nominal value of shares that have been issued. Share premium arises when the amount subscribed for share capital is in excess of nominal value.
19
2.12 Retained earnings Retained earnings include all current and prior period results as disclosed in the consolidated statement of comprehensive income. 2.13 Dividends
Dividends are recognized when they become legally payable. Dividend distribution to equity shareholders is recognized as a liability in the Group’s consolidated financial statements in the period in which the dividends are declared and approved by the Group’s BOD. 2.14 Revenue recognition Revenue is recognized to the extent that it is probable that the economic benefits will flow to the Group and the revenue can be measured reliably. Revenue is measured at the fair value of the consideration received or receivable and represents amounts receivable for goods and services provided in the normal course of business. Revenue from the sales of goods is recognised when the Group has transferred the significant risks and rewards of ownership to the buyer and it is probable that the Group will receive the previously agreed upon payment. These criteria are considered to be met when the goods are delivered to the buyer. Revenue from the sale of goods in the course of ordinary activities is measured at the fair value of the consideration received or receivable, net of returns, trade discounts and volume rebates. Interest income is accrued on a time proportion basis, by reference to the principal outstanding and at the EIR applicable, which is the rate that exactly discounts estimated future cash receipts through the expected life of the financial asset to that asset’s net carrying amount. 2.15 Cost and expense recognition Costs and expenses are recognized in the consolidated statement of comprehensive income when decrease in future economic benefit related to a decrease in an asset or an increase in a liability has arisen that can be measured reliably. Costs and expenses are recognized in the consolidated statement of comprehensive income: on the basis of a direct association between the costs incurred and the earning of specific items of income; on the basis of systematic and rational allocation procedures when economic benefits are expected to arise over several accounting periods and the association with income can only be broadly or indirectly determined; or immediately when an expenditure produces no future economic benefits or when, and to the extent that, future economic benefits do not qualify, or cease to qualify, for recognition in the consolidated statements of financial position as an asset. Costs and expenses in the consolidated statement of comprehensive income are presented using the function of expense method. Costs of sales are expenses incurred that are associated with the goods sold and includes purchases of goods and distribution costs. Operating expenses are costs attributable to administrative, marketing and other business activities of the Group. 2.16 Leases Leases are classified as finance leases whenever the terms of the lease transfer substantially all the risks and rewards of ownership to the lessee. All other leases are classified as operating leases. The Group does not have any leases under finance lease. Operating lease payments are recognized as an expense on a straight-line basis over the lease term, except when another systematic basis is more representative of the time pattern in which economic benefits from the leased asset are consumed. Contingent rentals arising under operating leases are recognized as an expense in the period in which they are incurred.

20
In the event that lease incentives are received to enter into operating leases, such incentives are recognized as a liability. The aggregate benefit of incentives is recognized as a reduction of rental expense on a straight-line basis, except when another systematic basis is more representative of the time pattern in which economic benefits from the leased asset are consumed. 2.17 Borrowing costs Borrowing costs directly attributable to the acquisition, construction or production of qualifying assets, which are assets that necessarily take a substantial period of time to get ready for their intended use or sale, are added to the cost of those assets, until such time as the assets are substantially ready for their intended use or sale. Investment income earned on the temporary investment of specific borrowings pending their expenditure on qualifying assets is deducted from the borrowing costs eligible for capitalization. Borrowing costs that are not directly attributable to the acquisition, construction or production of a qualifying asset are recognized in profit or loss in the period in which they are incurred. 2.18 Income taxes Income tax expense represents the sum of the current income tax and deferred income tax. Current income tax Current income tax assets and liabilities for the current and the prior periods are measured at the amount expected to be recovered from or paid to the taxation authorities. The tax currently payable is based on taxable profit for the year. Taxable profit differs from net profit as reported in the consolidated statement of comprehensive income because it excludes items of income or expense that are taxable or deductible in other years and it further excludes items that are never taxable or deductible. The Group’s liability for current tax is calculated using the applicable tax rate for the years presented. Deferred income tax Deferred income tax is recognized on differences between the carrying amounts of assets and liabilities in the consolidated financial statements and the corresponding tax base used in the computation of taxable profit and are accounted for using the liability method, except for differences arising on:
the initial recognition of goodwill;
the initial recognition of an asset or liability in a transaction that is not a business combination and that affects neither accounting nor taxable profit; and
investments in subsidiaries, associates and jointly controlled entities to the extent that the Group is able to control the timing of the reversal of the temporary differences and it is probable that the difference will not reverse in the foreseeable future.
Deferred tax liabilities are generally recognized for all taxable temporary differences, while deferred tax assets are generally recognized for all deductible temporary differences. Deferred tax assets are recognized for unused tax losses, tax credits and deductible temporary differences to the extent that it is probable that future taxable profits will be available against which they can be utilized. The carrying amount of deferred tax assets is reviewed at the end of each reporting period and reduced to the extent that it is no longer probable that sufficient taxable profits will be available to allow all or part of the asset to be recovered. Deferred tax assets and liabilities are offset if there is a legally enforceable right to offset current tax assets against current tax liabilities and they relate to income taxes levied by the same taxation authority and the Company intends to settle its current tax assets and liabilities on a net basis.

21
Current and deferred tax are recognized as an expense or income in the consolidated statement of comprehensive income, except when they relate to items that are recognized outside profit or loss (whether in other comprehensive income or directly in equity), in which case the tax are also recognized outside profit or loss. 2.19 Earnings per share (EPS) The Group computes its basic EPS by dividing profit or loss for the year attributable to ordinary equity holders of the Company by the weighted average number of ordinary shares outstanding during the period. For the purpose of calculating diluted EPS, profit or loss for the year attributable to ordinary equity holders and the weighted average number of shares outstanding are adjusted for the effects of all dilutive potential ordinary shares. 2.20 Related parties Parties are considered to be related if one party has the ability, directly or indirectly, to control the other party or exercise significant influence over the other party in making financial and operating decisions. Parties are also considered to be related if they are subject to common control. Related parties may be individuals or corporate entities. The key management personnel of the Group and post–employment benefit plans for the benefit of the Group’s employees are also considered to be related parties. 2.21 Events after the reporting date Post year-end events up to the date of the auditors’ report that provide additional information about the Group’s position at financial reporting date (adjusting events) are reflected in the consolidated financial statements. Post year-end events that are not adjusting events are disclosed in the notes to the consolidated financial statements when material. 2.22 Segment reporting An operating segment is a component of the Group that engages in business activities from which it may earn revenues and incur expenses, including revenues and expenses that relate to transactions with any of the Group’s other components. Operating segments are reported in a manner consistent with the internal reporting provided to the chief operating decision-maker. The chief operating decision-maker, who is responsible for allocating resources and assessing performance of the operating segments, has been identified as the CEO that makes strategic decisions. Segment results that are reported to the CEO include items directly attributable to a segment as well as those that can be allocated on a reasonable basis. Unallocated items comprise mainly corporate assets, head office expenses, interest income and expenditures and income tax assets and liabilities. Segment capital expenditure is the total cost incurred during the period to acquire property, and equipment, and intangible assets other than goodwill. NOTE 3 – SIGNIFICANT ACCOUNTING ESTIMATES AND JUDGMENTS The preparation of the consolidated financial statements in conformity with PFRS requires the Group’s management to make estimates, assumptions and judgments that affect the amounts reported in the consolidated financial statements.

22
The estimates and associated assumptions are based on historical experiences and other various factors that are believed to be reasonable under the circumstances including expectations of related future events, the results of which form the basis of making the judgments about carrying values of assets and liabilities that are not readily apparent from other sources. Actual results may differ from these estimates. The estimates, assumptions and judgments are reviewed and evaluated on an ongoing basis. Revisions to accounting estimates are recognized in the period in which the estimate is revised if the revision affects only that period or in the period of the revision and future periods if the revision affects both current and future periods.
Judgments
Determination of functional currency Based on the economic substance of the underlying circumstances relevant to the Group, the functional currency is determined to be the Philippine Peso. It is the currency that mainly influences the Group’s operations.
Classification of financial instruments
The Group classifies a financial instrument, or its component parts, on initial recognition as a
financial asset, a financial liability or an equity instrument in accordance with the substance of
the contractual agreement and the guidelines set by PAS 39 on the definitions of a financial asset,
a financial liability or equity. In addition, the Group also determines and evaluates its intention
and ability to keep the investments until its maturity date.
The substance of a financial instrument, rather than its legal form, and the management’s
intention and ability to hold the financial instrument to maturity generally governs its
classification in the consolidated statements of financial position. The classification of financial assets and liabilities is presented in Note 4. Determination whether an arrangement contains a lease The determination whether an arrangement contains a lease, is based on its substance. An arrangement is, or contains a lease when the fulfillment of the arrangement depends on a specific asset or assets and the arrangement conveys the right to use the asset. The Group has entered into operating lease arrangement as a lessee. The Group, as a lessee, has determined that the lessor retains substantial risks and rewards of ownership of these properties, which are on operating lease agreements. Leases accounted for as operating leases are disclosed in Note 22. Determination of fair value of financial instruments The Group carries certain financial assets and liabilities at fair value, which requires use of accounting estimates and judgment. While significant components of fair value measurement were determined using verifiable objective evidence, the amount of changes in fair value would differ if the Group utilized different valuation methodologies and assumptions. Any changes in fair value of these financial assets and liabilities would affect profit and loss and equity. The carrying values of financial assets and financial liabilities as of September 30, 2012 and December 31, 2011 are disclosed in Note 4.
23
Estimates Impairment of loan and trade and other receivables The Group reviews its loans and receivables at each financial reporting date to assess whether a provision for impairment should be recognized in its consolidated statement of comprehensive income or loans and receivables balance should be written off. In particular, judgment by management is required in the estimation of the amount and timing of future cash flows when determining the level of allowance is required. Such estimates are based on assumptions about a number of factors and actual results may differ, resulting in future changes to the allowance. Moreover, management evaluates the presence of objective evidence of impairment which includes observable data that comes to the attention of the Group about loss events such as but not limited to significant financial difficulty of the counterparty, a breach of contract, such as a default or delinquency in interest or principal payments, probability that the borrower will enter bankruptcy or other financial re-organization. The carrying value of loans receivable amounted to P128,000,000 and P135,000,000 as of September 30, 2012 and December 31, 2011, respectively (see Note 8).The carrying value of trade and other receivables amounted to P312,753,276 and P252,529,132 as of September 30, 2012 and December 31, 2011, respectively (see Note 7). The Group provided for an allowance for impairment on trade receivables amounting to P4,375,816 in 2011. Impairment of inventories At each reporting date, inventories are assessed for impairment by comparing the carrying amount of each item of inventory (or group of similar items) with its selling price less costs to sell. If an item of inventory (or group of similar items) is impaired, its carrying amount is reduced to selling price less costs to sell, and an impairment loss is recognized immediately in profit or loss. Estimation of useful lives of property and equipment The Group reviews annually the estimated useful lives of property and equipment based on the period over which the assets are expected to be available for use. It is possible that future results of operations could be materially affected by changes in these estimates. A reduction in the estimated useful lives of property and equipment would increase recorded depreciation expense and decrease the related asset accounts. The estimated useful lives of property and equipment are discussed in Note 2.7 to the consolidated financial statements, which showed no changes in 2012 and 2011. The Group’s property and equipment, net of accumulated depreciation, amounted to P314,726,504 and P94,053,283 as of September 30, 2012 and December 31, 2011, respectively (see Note 11). Impairment of non-financial assets The Group assesses at each financial reporting date whether there is an indication that the carrying amount of all non-financial assets may be impaired. If any such indication exists, or when annual impairment testing for an asset is required, the Group makes an estimate of the asset’s recoverable amount. At the financial reporting date, the Group assesses whether there is any indication that previously recognized impairment losses may no longer exist or may have decreased. If such indication exists, the recoverable amount is estimated. Based on management’s assessment, non-financial assets are fairly stated, thus, no impairment loss needs to be recognized as of September 30, 2012 and December 31, 2011 (see Notes 10, 11).

24
Realizability of deferred tax assets
Management reviews the carrying amount of deferred tax assets at each financial reporting date. The carrying amount of deferred tax assets is reduced to the extent that it is no longer probable that sufficient taxable profit will be available against which the related tax assets can be utilized. Management believes that sufficient taxable profit will be generated to allow all or part of the deferred tax assets to be utilized. The Group’s recognized deferred tax assets amounted to P1,956,278 and P1,858,969 as of September 30, 2012 and December 31, 2011, respectively (see Note 21). Estimation of retirement benefits The determination of the obligation and retirement benefits is dependent on management’s assumptions used by actuaries in calculating such amounts. Those assumptions are described in Note 20 and include, among others, discount rates per annum and salary increase rates. Actual results that differ from the Group’s assumptions are accumulated and amortized over future periods and therefore, generally affect the recognized expense and recorded obligation in such future periods. While the Group believes that the assumptions are reasonable and appropriate, significant differences in the actual experience or significant changes in the assumptions may materially affect the retirement obligations. The details of the Company’s pension are provided in Note 20. Pension liability amounted to P2,145,109 and P1,820,747 as of September 30, 2012 and December 31, 2011, respectively. Net pension costs presented under operating expenses amounted to P324,362 and P353,382 in September 30, 2012 and 2011, respectively (see Note 18). NOTE 4 – FINANCIAL RISK MANAGEMENT OBJECTIVES AND POLICIES The Group is exposed through its operations to the following financial risks:
Credit risk
Liquidity risk
Market risk
In common with all other businesses, the Group is exposed to risks that arise from its use of financial instruments. This note describes the Group's objectives, policies and processes for managing those risks and the methods used to measure them. Further quantitative information in respect of these risks is presented throughout these consolidated financial statements. The following table shows the classification, carrying values and fair values of the Group’s financial assets and financial liabilities as of September 30, 2012 and December 31, 2011:
2012 2011
Carrying value Fair value Carrying Value Fair value
Financial assets:
Loans and receivables Cash on hand and in banks
(Note 6) P197,041,936 P197,041,936 P204,788,818 P204,788,818 Trade and other receivables
(Note 7)
312,753,276
312,753,276 252,529,132 252,529,132 Loans receivable (Note 8) 128,000,000 128,000,000 135,000,000 135,000,000 Advances to related parties
(Note 19)
83,425,254
83,425,254 66,495,612 66,495,612
P721,220,465 P721,220,465 P658,813,562 P658,813,52
25
2012 2011
Carrying value Fair value Carrying value Fair value
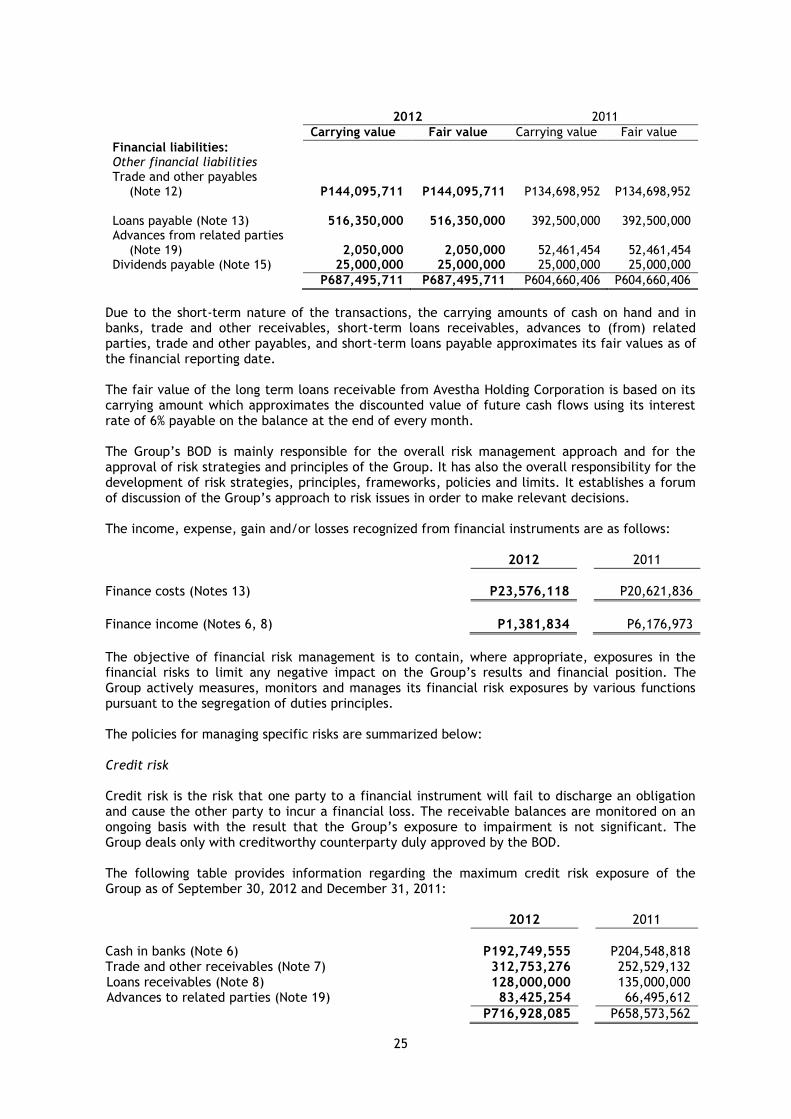
Financial liabilities: Other financial liabilities Trade and other payables
(Note 12) P144,095,711 P144,095,711 P134,698,952 P134,698,952
Loans payable (Note 13)
516,350,000
516,350,000 392,500,000 392,500,000 Advances from related parties
(Note 19) 2,050,000
2,050,000
52,461,454
52,461,454 Dividends payable (Note 15) 25,000,000 25,000,000 25,000,000 25,000,000
P687,495,711 P687,495,711 P604,660,406 P604,660,406
Due to the short-term nature of the transactions, the carrying amounts of cash on hand and in banks, trade and other receivables, short-term loans receivables, advances to (from) related parties, trade and other payables, and short-term loans payable approximates its fair values as of the financial reporting date. The fair value of the long term loans receivable from Avestha Holding Corporation is based on its carrying amount which approximates the discounted value of future cash flows using its interest rate of 6% payable on the balance at the end of every month. The Group’s BOD is mainly responsible for the overall risk management approach and for the approval of risk strategies and principles of the Group. It has also the overall responsibility for the development of risk strategies, principles, frameworks, policies and limits. It establishes a forum of discussion of the Group’s approach to risk issues in order to make relevant decisions. The income, expense, gain and/or losses recognized from financial instruments are as follows: 2012 2011
Finance costs (Notes 13) P23,576,118 P20,621,836
Finance income (Notes 6, 8) P1,381,834 P6,176,973
The objective of financial risk management is to contain, where appropriate, exposures in the financial risks to limit any negative impact on the Group’s results and financial position. The Group actively measures, monitors and manages its financial risk exposures by various functions pursuant to the segregation of duties principles. The policies for managing specific risks are summarized below: Credit risk Credit risk is the risk that one party to a financial instrument will fail to discharge an obligation and cause the other party to incur a financial loss. The receivable balances are monitored on an ongoing basis with the result that the Group’s exposure to impairment is not significant. The Group deals only with creditworthy counterparty duly approved by the BOD. The following table provides information regarding the maximum credit risk exposure of the Group as of September 30, 2012 and December 31, 2011: 2012 2011
Cash in banks (Note 6) P192,749,555 P204,548,818 Trade and other receivables (Note 7) 312,753,276 252,529,132 Loans receivables (Note 8) 128,000,000 135,000,000 Advances to related parties (Note 19) 83,425,254 66,495,612
P716,928,085 P658,573,562

26
The following table provides information regarding the Group’s analysis of the age of financial assets by class as at the financial reporting date:
Past due but not impaired
Total
Neither past due nor impaired 31-60 days 61-90 days
Over 90 days Impaired September 30, 2012
Loans and receivables Cash in banks 192,749,555 192,749,555 P- P- P- P-
Trade and other receivables 312,753,276 285,113,138 12,899,632 3,211,957 15,904,365 4,375,816
Loans receivable 128,000,000 128,000,000 Advances to related
parties 83,425,254 83,425,254 - - - -
P716,928,085 P689,287,947 P12,899,632 P3,211,957 P15,904,365 P4,375,816
Past due but not impaired
December 31, 2011 Total
Neither past due nor impaired 31-60 days 61-90 days Over 90 days Impaired
Loans and receivables
Cash in banks P204,548,818 P204,548,818 P- P- P- P-
Trade and other
receivables 252,529,132 224,888,994 12,899,632 3,211,957 15,904,365 4,375,816
Loans receivable 135,000,000 135,000,000
Advances to
related parties 66,495,612 66,495,613 - - - -
P658,573,562 P630,933,425 P12,899,632 P3,211,957 P15,904,365 P4,375,816
The credit quality of the Group’s financial assets is considered to be of good quality. Financial assets are expected to be collectible without incurring any credit losses. The Group’s loans receivable from Avestha Holdings Corporation amounting to P120,000,000 is fully secured by the borrower’s real estate properties independently valued by Cuervo Appraisers, Inc. at P166,549,000. Credit quality per class of financial assets The Group’s bases in grading its financial assets are as follows: High grade - These are receivables which have a high probability of collection (the counterparty has the apparent ability to satisfy its obligation and the security on the receivables are readily enforceable). Standard - These are receivables where collections are probable due to the reputation and the financial ability of the counterparty to pay but have been outstanding for a certain period of time. Substandard - These are receivables that can be collected provided the Group makes persistent effort to collect them.
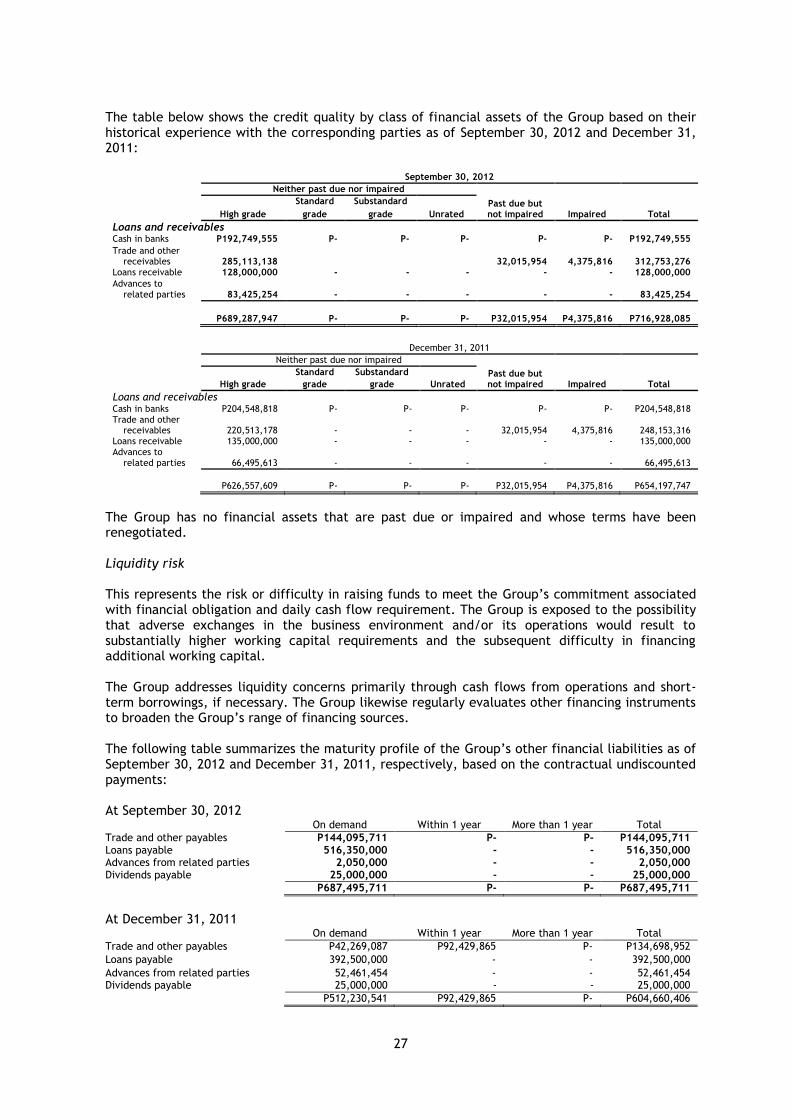
27
The table below shows the credit quality by class of financial assets of the Group based on their historical experience with the corresponding parties as of September 30, 2012 and December 31, 2011:
September 30, 2012
Neither past due nor impaired
High grade
Standard Substandard
Unrated Past due but not impaired Impaired Total grade grade
Loans and receivables
Cash in banks P192,749,555 P- P- P- P- P- P192,749,555
Trade and other receivables 285,113,138
32,015,954
4,375,816 312,753,276
Loans receivable 128,000,000 - - - - - 128,000,000
Advances to related parties 83,425,254 - - - - - 83,425,254
P689,287,947 P- P- P- P32,015,954 P4,375,816 P716,928,085
December 31, 2011
Neither past due nor impaired
High grade
Standard Substandard
Unrated Past due but not impaired Impaired Total grade grade
Loans and receivables Cash in banks P204,548,818 P- P- P- P- P- P204,548,818
Trade and other receivables
220,513,178 - - -
32,015,954
4,375,816
248,153,316
Loans receivable 135,000,000 - - - - - 135,000,000 Advances to
related parties
66,495,613 - - - - -
66,495,613
P626,557,609 P- P- P- P32,015,954 P4,375,816 P654,197,747
The Group has no financial assets that are past due or impaired and whose terms have been renegotiated. Liquidity risk This represents the risk or difficulty in raising funds to meet the Group’s commitment associated with financial obligation and daily cash flow requirement. The Group is exposed to the possibility that adverse exchanges in the business environment and/or its operations would result to substantially higher working capital requirements and the subsequent difficulty in financing additional working capital. The Group addresses liquidity concerns primarily through cash flows from operations and short-term borrowings, if necessary. The Group likewise regularly evaluates other financing instruments to broaden the Group’s range of financing sources. The following table summarizes the maturity profile of the Group’s other financial liabilities as of September 30, 2012 and December 31, 2011, respectively, based on the contractual undiscounted payments: At September 30, 2012
On demand Within 1 year More than 1 year Total
Trade and other payables P144,095,711 P- P- P144,095,711 Loans payable 516,350,000 - - 516,350,000 Advances from related parties 2,050,000 - - 2,050,000 Dividends payable 25,000,000 - - 25,000,000
P687,495,711 P- P- P687,495,711
At December 31, 2011
On demand Within 1 year More than 1 year Total
Trade and other payables P42,269,087 P92,429,865 P- P134,698,952
Loans payable 392,500,000 - - 392,500,000
Advances from related parties 52,461,454 - - 52,461,454 Dividends payable 25,000,000 - - 25,000,000
P512,230,541 P92,429,865 P- P604,660,406

28
Interest rate risk Interest rate risk is the risk that the fair value or future cash flows of a financial instrument will fluctuate because of changes in market interest rates. The Group’s exposure to the risk of changes in market interest rates relates primarily to the Group’s bank loans payable. Interest rate sensitivity
The following table demonstrates the sensitivity to a reasonably possible change in interest rates on that portion of loans payable with all other variables held constant, the Group’s profit before tax is affected as follows: Increase/decrease Effect on profit interest rate before tax
2012 +1% (P235,761) -1% P235,761 2011 +1% (P206,218) -1% P206,218
Capital risk management
The Group manages its capital structure (total equity) and makes adjustments to it, in light of changes in economic conditions. To maintain or adjust the capital structure, the Group may adjust or delay the dividend payment to shareholders and appropriate a percentage of retained earnings towards expansion and capital expenditures. The Group through the Finance function sets operational targets and performance indicators in order to assure that the capital and returns requirements are achieved. Appropriate monitoring and reporting systems accompany these targets and indicators to assess the achievement of Group goals and institute appropriate action. No changes were made in the objectives, policies and processes in 2012 and 2011. The Group has no externally imposed capital requirements. NOTE 5 – SEGMENT REPORTING The CEO is the Group’s chief operating decision-maker. Management has determined the operating segments based on the reports reviewed by the CEO that are used to make strategic decisions. The CEO considers the business from a geographic perspective. Geographically, management considers the performance of the distributorship of agro-products in Bulacan (Main), Nueva Ecija – North, Nueva Ecija – South, Pangasinan and Pampanga. The reportable operating segments derive its revenue primarily from different agro-products such as feeds, seeds, chemicals and fertilizers. All revenue of the reportable segments arises from external customers. The operating segments are organized and managed separately according to the different geographical areas of operations, with each segment representing a strategic business unit that offers the same types of products but serves different locations. These divisions are the basis on which the Group reports its primary segment information. All operating business segments used by the Group meet the definition of a reportable segment under PFRS 8. The CEO assesses the performance of the operating segments based on a measure of Earnings Before Interests, Taxes and Depreciation and Amortization (EBITDA). This measurement basis excludes the effects of non-recurring expenditure from the operating segments and common operating expenses. Interest expense is not allocated to segments, as this type of activity is

29
driven by the central treasury function, which manages the cash position of the Group. Transfer prices between operating segments, if any, are on an arm’s length basis in a manner similar to transactions with third parties. Segment assets and liabilities Segment assets include all operating assets used by a segment and consist principally of operating cash, receivables and inventories. Segment liabilities include all operating liabilities and consist principally of trade and other payables. Segment assets and liabilities do not include deferred income taxes. Segment transactions Segment sales, expenses and performance include sales and purchases with third parties. Intercompany loans between segments, if any, are eliminated during the preparation of the Company’s consolidated financial statements.

30
The segment information provided to the CEO for the nine-month periods ended September 30, 2012 and 2011 is as follows (amounts in thousands):
Bulacan Nueva Ecija - South Nueva Ecija - North
2012 2011 2012 2011 2012 2011
Sales P1,758,416 P830,544 P146,467 P198,023 P75,619 P93,132 Cost of sales (1,570,840) (720,446) (132,333) (176,156) (68,618) (84,025) Other operating income 52 (94) 104 35 92 62 Operating expenses (83,073) (30,101) (3,391) (5,168) (1,744) (3,938) Finance income 1,382 6,075 - - - - Finance costs (23,576) (20,622) - - - - Provision for income tax (30,845) (26,801) - - - -
Profit (loss) for the year P51,516 P38,555 P10,847 P16,734 P5,350 P5,230 Interest 23,576 20,622 - - - - Taxes 30,845 26,801 - - - - Depreciation 5,777 3,869 11 20 11 20
EBITDA P111,714 P89,847 P10,858 P16,754 P5,361 P5,250
Pampanga Pangasinan Unallocated expense
2012 2011 2012 2011 2012 2011
Sales P34,720 P34,478 P55,647 P75,753 P- P- Cost of sales (30,968) (30,941) (51,003) (67,067) - - Other operating income 59 27 108 - - - Operating expenses (1,063) (1,950) (2,430) (4,758) - - Finance income - - - 102 - - Finance costs - - - - (23,576) (20,622) Provision for income tax - - - - - -
Profit (loss) for the year P2,748 P965 P2,322 P4,030 (23,576) (20,622) Interest - - - - 23,576 20,622 Taxes - - - - - - Depreciation 7 12 24 39 - -
EBITDA P2,755 P977 P2,346 P4,069 P- P-

31
A reconciliation of the total EBITDA of the reportable segments to the Group’s profit for the year is provided as follows (amounts in thousands):
Total
2012 2011
Sales P2,070,869,262 P1,231,929,537 Cost of sales (1,853,761,771) (1,078,634,986) Other operating income 415,128 30,279 Operating expenses (91,700,772) (45,915,168) Finance income 1,381,834 6,176,973 Finance costs (23,576,118) (20,621,836) Provision for income tax (30,017,669) (26,800,748)
Profit (loss) for the year P70,853,053 P66,164,051 Interest 23,576,118 20,621,836 Taxes 30,017,669 26,800,748 Depreciation 5,829,822 3,960,426
EBITDA P130,276,664 P117,547,060
The segment assets and liabilities as of September 30, 2012 and December 31, 2011 are as follows (amounts in thousands):
Bulacan Nueva Ecija - South Nueva Ecija - North
2012 2011 2012 2011 2012 2011
Segment assets P977,316 P567,225 P87,698 P72,267 P42,251 P38,882
Segment liabilities P202,952 P149,861 P2,562 P7,862 P8,294 P14,755 Additions to
property and equipment P226,384
P53,295 P9 P- P9 P-
Pampanga Pangasinan Unallocated
2012 2011 2012 2011 2012 2011
Segment assets P14,954 P16,426 P17,604 P20,740 P326,247 P337,508
Segment liabilities P3,539 P6,886 P2,543 P1,897 P545,545 P471,782 Additions to
property and equipment P42
P10 P59
P21 P- P-
The total reportable segments’ assets are reconciled to the Company’s total assets as follows:
2012
2011
Reportable segments' assets
P1,139,823,488
P736,828,490
Unallocated: Loans receivable (Note 8)
128,000,000
135,000,000 Advances to related parties (Note 20) 83,425,254
66,495,613
Investment properties (Note 10) 112,865,000
112,865,000 Deferred tax assets (Note 22) 1,956,278
1,858,969
Total assets per consolidated statements of financial position
P1,466,070,019
P1,053,048,072

32
The total reportable segments’ liabilities are reconciled to the Group’s total liabilities as follows:
2012
2011
Reportable segments' liabilities
P219,889,998
P181,261,307
Unallocated: Loans payable (Note 13)
516,350,000
392,500,000
Advances from related parties (Note 20) 2,050,000
52,461,454 Dividends payable (Note 15)
25,000,000
25,000,000
Pension benefit (Note 21)
2,145,109
1,820,747
P765,435,107
P653,043,508
The amounts provided to the CEO with respect to total assets and total liabilities are measured in a manner consistent with that of the consolidated financial statements. The reportable segments’ assets are allocated based on the operations of the segment and the physical location of the assets. The Group’s loans receivable, advances to related parties, investment properties and deferred tax assets are not considered as segment assets. The reportable segments’ are allocated based on the operations of the segment. The Group’s loans payable, advances from related parties and pension liability are not considered as segment liabilities. Unallocated assets and liabilities are managed by the central treasury function. The Group does not have revenues from transactions with a single external customer amounting to ten percent (10%) or more of the Group’s total revenues. NOTE 6 - CASH ON HAND AND IN BANKS The account consists of:
2012 2011
Cash on hand P4,292,381 P240,000 Cash in banks 192,749,555 204,548,818
P197,041,936
P204,788,818
Cash in banks earns interest at the respective bank deposit rates. Interest income earned from bank deposits amounted to P1,381,384 and P6,176,973 for the nine-month periods ended September 30 2012 and 2011, respectively.

33
NOTE 7 – TRADE AND OTHER RECEIVABLES, NET The account consists of:
2012
2011
Trade receivables
P302,567,825
P247,081,567 Advances to suppliers
2,186,678
3,656,215
Accrued interest on loans receivable (Note 8)
2,855,000
2,855,000 Advances to employees
1,088,996
810,066
Other receivables
8,430,593
2,502,100
317,129,092
256,904,948
Allowance for impairment loss (Note 18)
(4,375,816)
(4,375,816)
P312,753,276
P252,529,132
Trade receivables are from dealers and customers of the Group and are not interest-bearing. Normal credit terms of trade receivables are 30 days and 60 days. NOTE 8 – LOANS RECEIVABLES On September 26, 2011, the Company granted a loan to Avestha Holding Corporation, a related party (see Note 19), amounting to P120,000,000 for a term of three (3) years. The principal of the loan will be payable after two (2) years in which an interest at the rate of six percent (6%) will be payable on the balance at the end of every month. The loan is fully secured by the borrower’s various real estate properties independently valued by Cuervo Appraisers, Inc. at P166,549,000. This loans receivable is presented under noncurrent assets in the consolidated statements of financial position. On November 4, 2010, the Company granted a loan to Andres Lipana amounting to P15,000,000 for a term of one (1) year, renewable annually upon mutual agreement of both parties. The principal of the loan is subject to an interest at the rate of 6 percent (6%) payable at the end of every month. In 2011, the loan is renewed with the same terms and conditions. This loans receivable is presented under current assets in the consolidated statements of financial position. NOTE 9 – INVENTORIES 2012 2011
Chemicals P163,554,217 33,242,031 Feeds 20,671,237 P123,429,837 Fertilizers 17,453,820 6,456,864 Seeds 6,189,031 16,706,316
P207,868,305 P179,835,048
The above inventories are carried at the lower of cost and NRV. The Group has no unusual purchase commitments or inventories pledged as security for liabilities. NOTE 10 – INVESTMENT PROPERTIES During 2011, the Group acquired various lands amounting to P112,865,000. The acquisition value is based on the valuation report dated June 2011 conducted by an independent appraiser. The Group applies the cost model in its investment properties. Management believes that the carrying amounts of the said properties approximate the fair values as of financial reporting date.

34
NOTE 11 – PROPERTY AND EQUIPMENT, NET The details of and movements in this account are as follows: Office Transportation Leasehold Construction
Equipment Equipment improvement Farms In progress Total
Cost
At January 1, 2011 1,841,453 P29,682,038 P- P- P- P31,523,491
Additions 505,266 2,444,447 - 21,287,963 50,376,897 74,614,573
Disposals (160,280) (5,037,845) - - - (5,198,125)
At December 31, 2011 2,186,439 27,088,640 - 21,287,963 50,376,897 100,939,939
Additions
11,766,684 8,057,547
31,602,134
175,076,679 -
226,503,044
At September 30, 2012
13,953,123 35,146,187
31,602,134
196,364,642
50,376,897
327,442,983
Accumulated depreciation
At January 1, 2011 368,290 5,936,408 - - - 6,304,698 Depreciation 421,854 5,358,229 - - - 5,780,083 Disposals (160,280) (5,037,845) - - - (5,198,125)
At December 31, 2011 629,864 6,256,792 - - - 6,886,656
Depreciation
791,407 298,096
4,740,320 - -
5,829,823
At September 30, 2012
1,421,271 6,554,888
4,740,320 - -
12,716,479
Net book values
September 30, 2012 P12,531,852 P28,591,299 P26,861,814 P196,364,642 P50,376,897 P314,726,504
December 31, 2011 P1,556,575 P20,831,848 P- P21,287,963 P50,376,897 P94,053,283
During the nine-month period ended September 30, 2012 and for the year ended December 31, 2011, the Group capitalized expenditures amounting to P50,376,897, respectively, related to properties under construction. These expenditures consist of farm equipments, materials, labor and overhead directly related to the construction of the asset. The Group had not capitalized any borrowing costs attributable to the construction of such assets. During the year ended December 31, 2011, the Group disposed fully-depreciated property and equipment to a related party that resulted to a gain on disposal amounting to P1,914,123 (see Note 19). There are neither restrictions on title on the Group’s property and equipment nor was any of it pledged as security for liability. The Group has no contractual commitment for the acquisition of property and equipment. Depreciation expense amounted to P5,829,823 and P3,960,426 for the nine-month periods ended September 30, 2012 and 2011, respectively. Management has reviewed the carrying values of the Group’s property and equipment as of September 30, 2012 and December 31, 2011 for impairment. Based on the results of its evaluation, there were no indications that the property and equipment were impaired. NOTE 12 – TRADE AND OTHER PAYABLES The account consists of: 2012 2011
Trade payables P137,918,024 P124,120,187 Others 6,177,687 10,578,765
P144,095,711 P134,698,952
Trade payables are from suppliers of agro-products and are non-interest-bearing. Normal credit terms are 30 to 60 days.

35
Other payables mainly consist of the one percent (1%) tax withheld by the Group on its collections from customers. NOTE 13 – LOANS PAYABLE The loans payable as of September 30, 2012 and December 31, 2011 consist of secured short-term peso denominated loans obtained from local banks with interest rate of 6.25% in 2012 and 2011. The terms of the loans are six months or less and are subject for renewal. 2012 2011
Loans payable, Beginning P392,500,000 P469,500,000
Availments during the period 123,850,000
-
Payments during the period -
(77,000,000)
Loans payable, Ending P516,350,000
P392,500,000
Interest expense arising from these loans amounted to P23,576,118 and P20,621,836 in September 30, 2012 and 2011, respectively. There were no loan payments made during the nine-month period ended September 30, 2012. NOTE 14 - SHARE CAPITAL The account consists of: 2012 2011
Authorized:
845,400,000 shares at P1 par value each in 2011, and 10,000 shares at P100 par value each in 2010
P845,400,000 P845,400,000
Issued and outstanding at January 1: 324,100,000 shares at P1 par value each in 2012, and 10,000 shares at P100 par value each in 2011
P324,100,000 P1,000,000 Issued during the year:
323,100,000 shares at P1 par value each in 2011
36,012,000 323,100,000
Issued and outstanding at December 31: 324,100,000 shares at P1 par value each
P360,112,000 P324,100,000
On May 23, 2012, the Group issued an additional 36,012,000 shares of stock at a premium which resulted to a share premium of P206,400,089. Share premium arises when the amount subscribed for share capital is in excess of nominal value. On August 18, 2011, the Group has increased its authorized capital stock from three hundred forty five million, four hundred thousand pesos (P345,400,000) divided into three hundred forty five million, four hundred thousand (345,400,000) shares with par value of one peso (P1) per share, to eight hundred forty five million, four hundred thousand pesos (P845,400,000) divided into eight hundred forty five million, four hundred thousand (845,400,000) shares with par value of one peso (P1) per share. Subscriptions and full payment of stocks during the period were made on the following dates:
August 15, 2011 P86,100,000 August 23, 2011 125,000,000 September 9, 2011 112,000,000
P323,100,000

36
On August 5, 2011, the Group has increased its authorized capital stock from one million pesos (P1,000,000) divided into ten thousand (10,000) shares with par value of one hundred peso (P100) per share, to three hundred forty five million, four hundred thousand pesos (P345,400,000) divided into three hundred forty five million, four hundred thousand (345,400,000) shares with par value of one peso (P1). NOTE 15 – DIVIDENDS On a meeting held on November 18, 2011, the BOD unanimously approved the declaration of cash dividends in the amount of Twenty Five Million Pesos (P25,000,000) to stockholders of record as of November 8, 2011, subject to the condition on the availability of unrestricted retained earnings to cover said dividend declaration. NOTE 16 – SALES The account consists of: 2012 2011
Feeds P446,608,560 P301,667,981
Chemicals 434,110,370 271,946,645
Fertilizers 246,551,319 242,453,698
Seeds 9,884,772 14,475,159
Others 933,714,241 401,386,054
P2,070,869,262 P1,231,929,537
The Group has an existing Complementary Feeds Distributorship Agreement (the Agreement) with San Miguel Foods, Inc. (SMFI) wherein the parties agreed that the Group will exclusively distribute B-MEG Feeds. The Agreement is valid for one year and shall be automatically renewed upon expiry with the same terms and conditions except as may be agreed by the parties in writing, unless SMFI notifies the Group in writing of its intent to terminate the Agreement within 60 days prior to the end of the term. The Group has other distributorship agreements but on a non-exclusive basis. The agreements are valid for one year and shall be automatically renewed for another year, subject to the right of either party to terminate. The Group’s revenue may be affected by any program developed or supported by the Department of Agriculture of the Philippines. The Group’s revenue comes primarily from the sale of agricultural products. Any agricultural program that the Department of Agriculture develops for the farmers of the country may affect the Group’s revenue. In the event that the government is unable to effectively implement its programs, this might result in a slowdown of the Group’s business as farmers might not have the required resources to purchase the Group’s products. There is no guarantee that the Philippine government will not change or prioritize programs for agriculture in the coming years. To mitigate this risk, the Group updates itself regularly with the Department of Agriculture’s policies or programs developed for the agricultural product industry. This allows the Group to react quickly to government programs relating to agricultural products. It also enables the Group to plan ahead to meet the Department of Agriculture’s ongoing or future policies or programs. The Group also conducts its own marketing activities to promote the use or consumption of its product. The Company intends to strengthen its marketing efforts nationwide.

37
Risk of natural calamities The Group’s revenues are highly dependent on the weather conditions in the Philippines. Severe drought or flooding in a certain agricultural region will significantly affect the productivity of the farmers. This will highly affect the demand for fertilizers, pesticides and other agricultural chemicals. To mitigate this risk, the Group in partnership with its key suppliers would distribute new products manufactured through the use of modern technology to withstand if not totally resist the devastating effects brought by forces of nature. In addition, the Group distributes other agricultural products which are unaffected by natural calamities such as animal feeds for poultry, hogs and ducks. Risk of outbreak of animal diseases The Group’s revenues may be affected by the outbreak of swine and poultry diseases because the demand for animal feeds decreases in case an outbreak happens. To mitigate this risk the Group, in partnership with its key suppliers, currently deploys farm assistant technicians in the field to prevent and/or treat swine and poultry diseases. In addition, the Group also distributes veterinary medicines that help prevent or treat the said diseases. NOTE 17 – COST OF SALES The account consists of: 2012 2011
Inventories, beginning P179,835,048 P224,244,569 Net purchases 1,986,543,245 1,048,566,200
Cost of goods available for sale 2,166,378,294 1,272,810,769 Inventories, ending (Note 9) 312,616,522 194,175,783
P1,853,761,771 P1,078,634,986
NOTE 18 – OPERATING EXPENSES The account consists of:
2012
2011
Salaries, wages and benefits P41,080,599
P14,708,220
Rental (Note 19) 9,988,003
1,203,840
Professional fees 8,949,018 5,578,758 Depreciation (Note 8) 5,829,823
3,960,426
Transportation and travel 5,604,209
3,884,624
Taxes and licenses 4,176,009
2,545,857
Communication 3,620,112
1,320,246
Repairs and maintenance 2,761,403
1,278,205
Insurance 2,281,016
1,021,941
Representation and entertainment 1,896,307
698,305
Marketing 1,892,309
1,210,810
Office supplies 1,052,579
894,377
Pension costs (Note 16) 324,362
353,382
Impairment loss on receivables -
4,375,816
Others 5,001,863
2,880,361
P94,457,612
P45,915,167
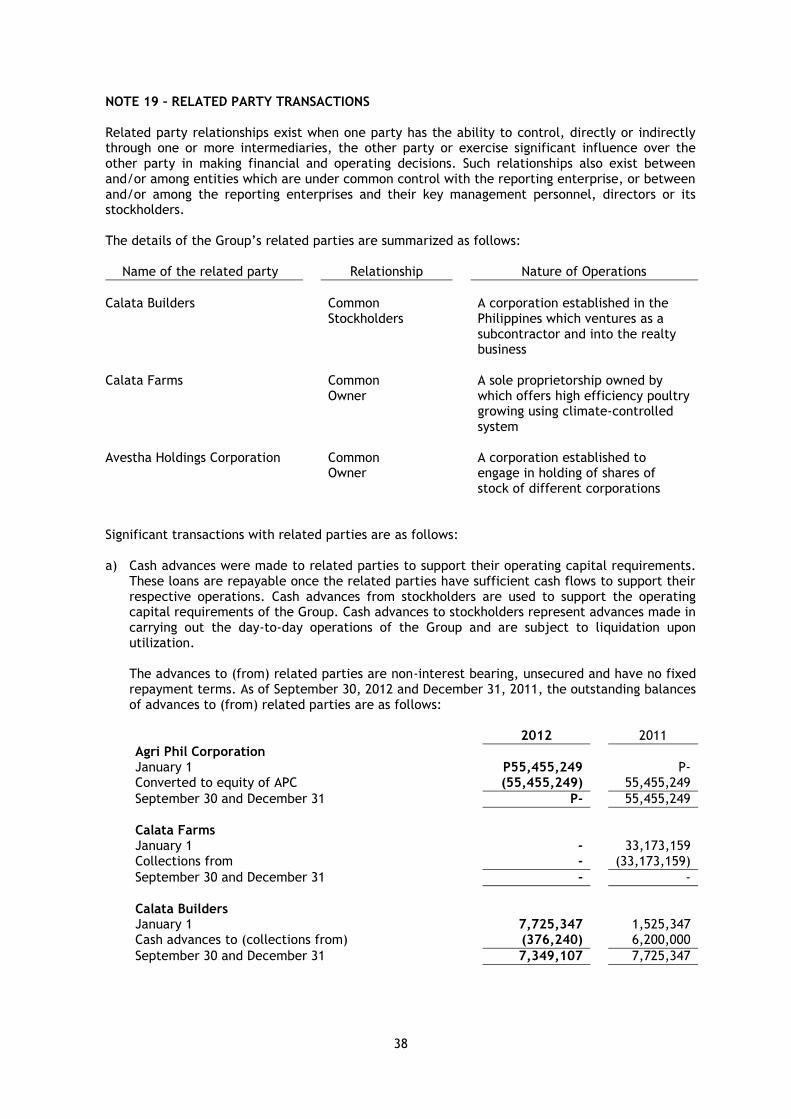
38
NOTE 19 – RELATED PARTY TRANSACTIONS Related party relationships exist when one party has the ability to control, directly or indirectly through one or more intermediaries, the other party or exercise significant influence over the other party in making financial and operating decisions. Such relationships also exist between and/or among entities which are under common control with the reporting enterprise, or between and/or among the reporting enterprises and their key management personnel, directors or its stockholders. The details of the Group’s related parties are summarized as follows:
Name of the related party Relationship Nature of Operations
Calata Builders Common
Stockholders A corporation established in the
Philippines which ventures as a subcontractor and into the realty business
Calata Farms Common Owner
A sole proprietorship owned by which offers high efficiency poultry growing using climate-controlled system
Avestha Holdings Corporation Common Owner
A corporation established to engage in holding of shares of stock of different corporations
Significant transactions with related parties are as follows: a) Cash advances were made to related parties to support their operating capital requirements.
These loans are repayable once the related parties have sufficient cash flows to support their respective operations. Cash advances from stockholders are used to support the operating capital requirements of the Group. Cash advances to stockholders represent advances made in carrying out the day-to-day operations of the Group and are subject to liquidation upon utilization. The advances to (from) related parties are non-interest bearing, unsecured and have no fixed repayment terms. As of September 30, 2012 and December 31, 2011, the outstanding balances of advances to (from) related parties are as follows:
2012 2011
Agri Phil Corporation January 1 P55,455,249 P- Converted to equity of APC (55,455,249) 55,455,249
September 30 and December 31 P- 55,455,249
Calata Farms January 1 - 33,173,159 Collections from - (33,173,159)
September 30 and December 31 - -
Calata Builders January 1 7,725,347 1,525,347 Cash advances to (collections from) (376,240) 6,200,000
September 30 and December 31 7,349,107 7,725,347

39
Stockholders January 1 3,315,016 174,325 Cash advances to 77,856,136 3,306,148 Cash advances from (5,095,005) (165,457)
September 30 and December 31 76,076,147 3,315,016
Total advances to related parties P83,425,254 P66,495,612
2012 2011
Stockholders January 1 (P52,461,454) P- Cash advances from - (67,869,405) Cash advances to 50,411,454 15,407,951
Total advances from related parties (P2,050,000) (P52,461,454)
b) An operating lease agreement was executed between the Group and the stockholders whereby
the latter granted the former with the rent-free use of office premises and various warehouses located in Bulacan.
c) A loan agreement was executed between the Group and Avestha Holdings Corporation whereby the former granted the latter a loan amounting to P120,000,000 for a term of three (3) years subject to interest at the rate of six percent (6%) payable on the balance at the end of every month (see Note 8).
d) During 2011, the Group disposed fully-depreciated property and equipment to a related party that resulted to a gain on disposal amounting to P1,914,123 (see Note 11).
e) The short term compensation of key management personnel amounted to P3,524,187 and P2,249,056, for the nine-month periods ended September 30, 2012 and 2011, respectively. There are no long term compensation of key management personnel for the nine-month periods ended September 30, 2012 and 2011, respectively.
f) For the years ended September 30, 2012 and December 31, 2011, the Company has not recorded any impairment of receivable relating to the amounts owned by the related parties. The assessment is undertaken through examining the financial position of the related parties and the market in which they operate.
NOTE 20 - PENSION COSTS The Group maintains an unfunded, non-contributory defined benefit retirement plan covering all qualified employees. Normal retirement benefits are equal to the employee’s retirement pay as defined in Republic Act No. 7641 multiplied by his years of service. Normal retirement date is the attainment of age 60 and completion of at least five years of service. The following tables summarize the components of net pension cost recognized in the consolidated statement of comprehensive income and the amounts recognized in the consolidated statements of financial position:
Net pension costs presented under operating expense are as follows: 2012 2011
Current service cost P260,678 P260,678 Interest cost 63,684 92,704
P324,362 P353,382

40
Components of net pension liability and the amounts recognized in the consolidated statements of financial position are as follows: 2012 2011
Present value of defined benefit obligation P2,333,194 P1,794,287 Unrecognized actuarial gain (188,085) (188,085)
P2,145,109 P1,606,202
Present value of defined benefit obligation is as follows: 2012 2011
Balance at January 1 P2,008,832 P1,558,699 Interest cost 63,684 92,704 Current service cost 260,678 260,678
Balance at September 30 P2,333,194 P1,912,081
There were no movements in unrealized actuarial gains for the nine-month period ended September 30, 2012 and 2011. The principal assumptions used in determining pension liability of the Group are shown below: 2012 2011
Discount rates 4.23% 6.58% Future salary increase rates 5.00% 5.00% NOTE 21 – INCOME TAXES a. The components of the Group’s provision for income tax are as follows:
2012 2011
Current
P30,114,978
P28,219,507 Deferred (97,309) (1,418,759)
P30,017,669 P26,800,748
b. The components of the Group’s deferred tax assets are as follows:
Balance at
January 1, 2011
Charged to operations during the
period
Balance at December 31, 2011
Charged to
operations during the
period
Balance at September 30, 2012
Allowance for impairment losses on trade receivables
P-
P1,312,745
P1,312,745
-
P1,312,745 Pension liability 411,184 135,040 546,224 97,309 643,533
P411,184 P1,447,785 P1,858,969 P97,309 P1,956,278
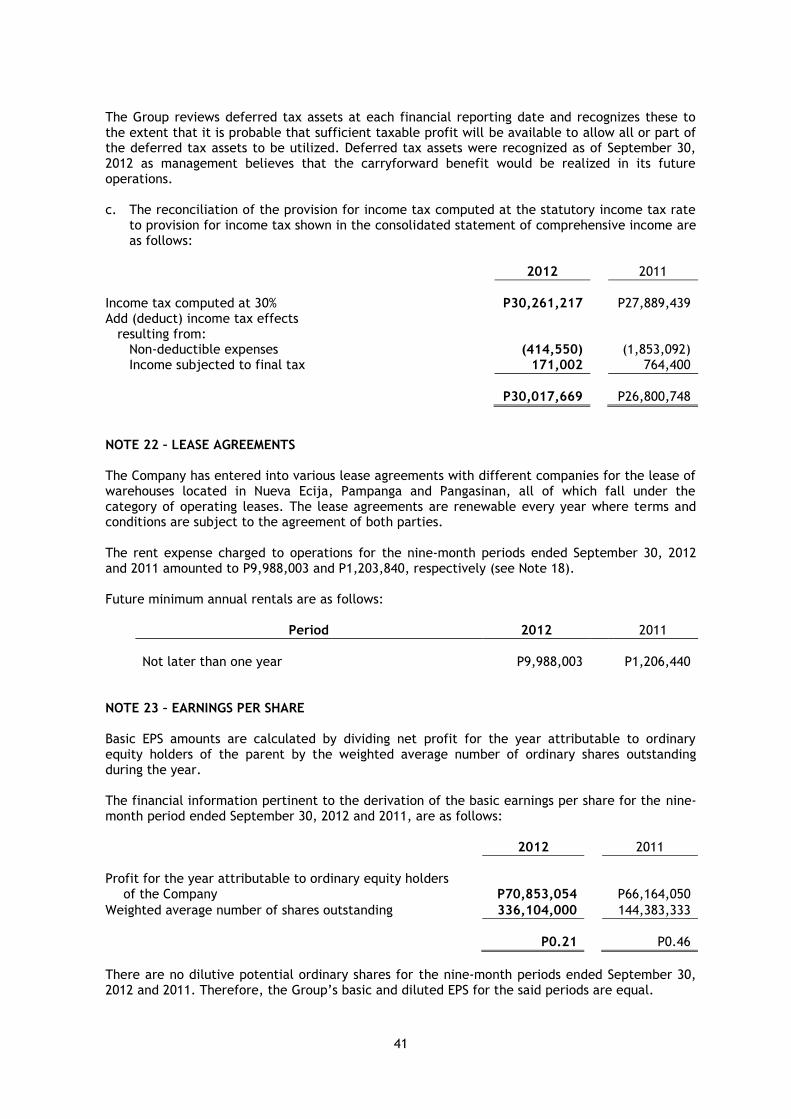
41
The Group reviews deferred tax assets at each financial reporting date and recognizes these to the extent that it is probable that sufficient taxable profit will be available to allow all or part of the deferred tax assets to be utilized. Deferred tax assets were recognized as of September 30, 2012 as management believes that the carryforward benefit would be realized in its future operations. c. The reconciliation of the provision for income tax computed at the statutory income tax rate
to provision for income tax shown in the consolidated statement of comprehensive income are as follows:
2012 2011
Income tax computed at 30% P30,261,217 P27,889,439 Add (deduct) income tax effects
resulting from: Non-deductible expenses (414,550) (1,853,092) Income subjected to final tax 171,002 764,400
P30,017,669 P26,800,748
NOTE 22 – LEASE AGREEMENTS The Company has entered into various lease agreements with different companies for the lease of warehouses located in Nueva Ecija, Pampanga and Pangasinan, all of which fall under the category of operating leases. The lease agreements are renewable every year where terms and conditions are subject to the agreement of both parties. The rent expense charged to operations for the nine-month periods ended September 30, 2012 and 2011 amounted to P9,988,003 and P1,203,840, respectively (see Note 18). Future minimum annual rentals are as follows:
Period 2012 2011
Not later than one year P9,988,003 P1,206,440
NOTE 23 – EARNINGS PER SHARE Basic EPS amounts are calculated by dividing net profit for the year attributable to ordinary equity holders of the parent by the weighted average number of ordinary shares outstanding during the year. The financial information pertinent to the derivation of the basic earnings per share for the nine-month period ended September 30, 2012 and 2011, are as follows: 2012 2011
Profit for the year attributable to ordinary equity holders
of the Company
P70,853,054 P66,164,050
Weighted average number of shares outstanding 336,104,000 144,383,333
P0.21 P0.46
There are no dilutive potential ordinary shares for the nine-month periods ended September 30, 2012 and 2011. Therefore, the Group’s basic and diluted EPS for the said periods are equal.

42
Financial soundness indicators in two comparative periods
September 30, 2012
December 31, 2011
(i) CURRENT/LIQUIDITY RATIOS
Current ratio =
Current assets
1.20
1.11
Current liabilities
Quick ratio =
Current assets - Inventories - Prepayments and other current
assets
0.79 0.83
Current liabilities
(ii) SOLVENCY RATIOS/ DEBT-TO-EQUITY RATIOS
Debt-to-equity ratio =
Total debt (i.e. Loans payable) 0.74 0.98
Total equity
(iii) ASSET-TO-EQUITY RATIOS
Net asset value per share =
Net asset value 1.95 1.23
Number of shares outstanding
(iv) INTEREST RATE COVERAGE RATIOS June 30, 2012
June 30, 2011
Interest cover =
EBIT 5.28 8.01
Interest expense
(v) PROFITABILITY RATIOS
Return on equity =
Net income 10.11% 7.88%
Shareholders’ equity
Gross profit margin =
Gross profit 10.48% 11.44%
Sales
Net profit margin =
Net income 3.42% 5.25%
Sales
(vi) OTHER RATIOS
Basic earnings per share Net income
P0.21
P4,128
Weighted-average common shares

43
Item 2. Management's Discussion and Analysis of Financial Condition and Results of
Operations.
M A N A G E M E N T ’ S D I S C U S S I O N & A N A L Y S I S O F F I N A N C I A L C O N D I T I O N
The following management's discussion and analysis of the Company's financial condition and results of operations should be read in conjunction with the Company's audited and unaudited financial statements, including the related notes, contained in this Prospectus. This Prospectus contains forward-looking statements that involve risks and uncertainties. The Company cautions investors that its business and financial performance is subject to substantive risks and uncertainties. The Company's actual results may differ materially from those discussed in the forward-looking statements as a result of various factors, including, without limitation, those set out in "Risk Factors." In evaluating the Company's business, investors should carefully consider all of the information contained in "Risk Factors." Overview The Company has been posting significant increases in its revenues consistent since 2003. The revenues increased from PhP200 Million in 2003 to PhP2.00 Billion in 2011 or an increase of PhP1.80 Billion or 1,000%. The Company is in the agriculture sector which in management’s view is one of the most stable industries and with a lot of opportunities for growth. The Company has been recording significant revenue growths and has not been negatively affected by the economic crisis that hit the global economy hard in 2008. In fact the Company recorded the biggest jump in its revenues in 2008 when the global economic crisis was at its strongest. The Company recorded PhP1.61 Billion in revenues in 2008 against PhP1.08 Billion in 2007 or an increase of PhP530 Million or an increase of 33%. RESULTS OF OPERATIONS Results for the period ended Sept. 30, 2012 compared to results for the period ended June 30, 2011 including Material Changes to the Company’s Audited Income Statement (increase/decrease of 5% or more) Sales for the period ended Sept. 30, 2012 amounted to P2.07 Billion which is already more than the whole year revenues of 2011. This represents an increase of P838.94 Million or 40.51% compared to the same period last year. The increase in sales is mainly brought about by the sales contribution of the Company’s wholly owned chain of stores under Agri Phil Corporation. The retail store chain allowed the Company to sell its products on a significantly larger area than it has previously access to. Gross Profit for the period ended Sept. 30, 2012 amounted to P217.10 Million compared to P153.29 Million for the same period last year. This is an increase of P63.81 Million or 29%. The increase in gross profit is mainly brought about by the increase in sales. The operating expenses amounted to P94.46 Million and P45.92 Million for the periods ended Sept. 30, 2012 and 2011 respectively. This is an increase of P48.54 Million or 51%. The increase is mainly due to the consolidation of the operating expenses of Agri Phil. Agri Phil with its numerous branches and significantly higher number of employees than Calata Corp has high operating expenses. And since its still in its early stages of operation have high start up costs which become lower over time.

44
Finance costs amounted to P23.58 Million and P20.62 Million for the periods ended Sept. 30, 2012 and 2011 respectively. This is an increase of P2.95 Million or 12.53%. The higher finance costs is mainly due to the higher borrowing incurred to support the expanded operations from the Company’s farming and retail operations. Net income amounted to P70.92 Million and P66.16 Million for the periods ended Sept. 30, 2012 and 2011 respectively. This is an increase of P4.75 Million or 6.70%. The increase is mainly due to the increase in sales which is partly offset by the increase in operating expenses. Results for the first half ended June 30, 2012 compared to results for the first half ended June 30, 2011 including Material Changes to the Company’s Audited Income Statement (increase/decrease of 5% or more) The first half of 2012 provided very good results for the Company. The revenues and operating income were the highest the Company has ever recorded for a half year period. The better than expected results was mainly due to the Company’s expansion to new markets primarily thru its affiliate “AGRI” stores. The good weather with ample rainfall and no typhoon that Luzon experienced in the first half also contributed to the Company’s good results. The sales thru the affiliates stores also earns a higher margin for the Company which contributed significantly to the Company’s bottom line. The relatively more stable price of hog and broilers during the first half also encouraged farmers to continuously raise their animals throughout the first half. This contributed to significantly more revenues by the Company from feeds for the first half of this year compared to last year. The revenues amounted to PhP1,170 Million and Php834.77 Million for the half year ended June 30, 2012 and June 30, 2011 respectively. This represents an increase of PhP335.56 Million or 40%. The increase in revenues is as mentioned above primarily due to the increased penetration to new markets. And the more stable hog and poultry prices. The operating expenses amounted to PhP34.51 Million and Php32.33 Million for the half year ended June 30, 2012 and June 30, 2011 respectively. This represents an increase of PhP2.18 Million or 7%. The increased operating expenses is primarily due to the Company’s expansion efforts which resulted in increased expenditures. Although, some of the expenditures in the expansion is incurred by the affiliate “AGRI”stores which resulted in a not so significant increase in expenses when compared to the very significant increase in revenues. Finance costs amounted to PhP14.35 Million and Php12.49 Million for the half year ended June 30, 2012 and June 30, 2011 respectively. This represents an increase of PhP1.86 Million or 15%. Finance costs increased because of the increased capital expenditures incurred by the Company. Primarily for the construction of farms of the Company. Net income amounted to PhP59.22 Million and Php41.28 Million for the half year ended June 30, 2012 and June 30, 2011 respectively. This represents an increase of PhP17.94 Million or 7%. The increase in net income is primarily due to the significant increase in revenues. Audited results for the fiscal year ended December 31, 2011 compared to Audited results for the fiscal year ended December 31, 2010 The year 2011 saw the highest recorded revenues and net income in the Company’s history. The Revenues amounted to P2.00 Billion in 2011 from P1.80 Billion in 2010 or an increase of P203.65 Million or 11%. The net income amounted to P100.17 Million in 2011 from P33.84 Million in 2010 or an increase of P66.34 Million or 196%.

45
The increase in sales is mainly attributed to increased market penetration primarily through the affiliate “AGRI” retail store chain which allowed to Company to sell in markets not previously accessible. The fertilizer business also had a bigger contribution this year compared to the previous years as the Company saw favorable price movements in fertilizer products. The increase in net income is aside from the increased revenues, mainly due to the increase in the Company’s margins. The Company’s gross profit amounted to P227.31 Million and P142.65 Million in 2011 and 2010 respectively, or an increase of P84.66 Million or 59%. The Company’s operating expenses decreased, for 2011 it amounted to P63.30 Million from P67.33 Million in 2010. The decrease amounted to P4.53 Million or 7%. The decrease is mainly due to the Company’s austerity measures which has resulted in decreasing expenses for the past several years. The Company recorded finance income amounting to P3.83 Million in 2011. This is the interest from the loans receivable of the Company. The Company’s finance cost had no significant movement. Material Changes to the Company’s Audited Income Statement as of Fiscal Year ended December 31, 2011 compared to the Audited Income Statement as of Fiscal Year ended December 31, 2010 (increase/decrease of 5% or more) Sales amounted to P2.00 Billion in 2011 from P1.80 Billion in 2010 or an increase of P203.65 Million or 11%. The increase is primarily due to increased market penetration mainly due to the affiliate “AGRI” retail store chain which allowed the Company to access markets that were not accessible to it before. Cost of sales increased by P118.96 Million or 7%. It amounted to P1.77 Billion in 2011 and P1.66 Billion in 2010. The increase in this account is due to the increase in sales. Gross Profit increased by P84.66 Million or 59%. It amounted to P227.31 Million in 2011 and P142.65 Million in 2010. The increase is mainly due to the Company’s availment of cash discounts and the best possible volume deals. Operating expenses decreased by P4.53 Million or 7%. It amounted to P63.30 Million from P67.33 Million in 2010. This is due to the Company’s implementation of austerity measures. Finance income increased by P3.83 Million. It amounted to P3.83 Million in 2011. This is the interest from the Company’s loans receivable. Audited Results for the fiscal year ended December 31, 2010 compared to Audited results for the fiscal year ended December 31, 2009 The year 2010 was another record breaking year for the Company in terms of net income with PhP33.84 Million recorded in 2010 from PhP7.50 Million in 2009 or an increase of PhP26.34 Million or 350%. The huge jump in net income was achieved through the successful policies implemented by the Company intended to increase its margins. This included price increases, and the availment of the lowest possible costs from suppliers through cash discounts and volume deals. To counteract the expected negative impact these measures will bring, the Company intensified its existing marketing programs putting particular emphasis on those programs targeting end users (pull strategies). The pull strategies were focused on the price increases’ immediate impact on the dealers, whose natural tendency is to resist and possibly adversely affect our sales. The programs’ focus on end users will make the end users buy products from dealers that the dealers should have bought from us. The Sales of the Company was relatively unchanged amounting to PhP1.80 Billion and PhP1.81 Billion in 2010 and 2009 respectively or a decrease of only PhP10 Million or 0.5%.

46
Operating expenses amounted to PhP88.02 Million in 2010 and 2009 respectively, or a decrease amounting to PhP20.19 Million or 23%. The decrease was in line with the Company’s austerity measures implemented in 2010. Finance cost increased with recorded amounts of PhP26.73 Million and PhP20.90 Million in 2010 and 2009 respectively, an increase of PhP5.82 Million or 27.85%. The increase is primarily due to the increased availment of loans to fund early payments to suppliers to take advantage of cash discounts. Material Changes to the Company’s Audited Income Statement as of Fiscal Year ended December 31, 2010 compared to the Audited Income Statement as of Fiscal Year ended December 31, 2009 (increase/decrease of 5% or more) The Company’s recorded Gross Profit amounted to PhP142.65 Million and PhP119.41 Million in 2010 and 2009 respectively, or an increase amounting to PhP23.24 Million or 20%. The increase was primarily due to the price increases implemented the Company and the negotiation of the lowest possible costs from suppliers. Operating expenses amounted to PhP88.02 Million in 2010 and 2009 respectively, or a decrease amounting to PhP20.19 Million or 23%. The decrease was in line with the Company’s austerity measures implemented in 2010. Finance cost increased with recorded amounts of PhP26.73 Million and hPP20.90 Million in 2010 and 2009 respectively, an increase of PhP5.82 Million or 27.85%. The increase is primarily due to the increased availment of loans to fund early payments to suppliers to take advantage of cash discounts. FINANCIAL POSITION Financial position as of Sept. 30, 2012 compared to December 31, 2011 including discussion on Material Changes to the Balance Sheet as of Sept. 30, 2012 compared to Audited Balance Sheet as of Fiscal year ended December 31, 2011 (increase/decrease of 5% or more). Total assets increased by PhP413.02 Million or 39%. The total assets amounted to PhP1.47 Billion and PhP1.05 Billion for Sept. 30, 2012 and December 31, 2011 respectively. The increase in total assets is primarily due to the increase in trade receivables and property and equipment. Trade receivables increased by PhP60.22 Million or 23%. The amounts recorded were PhP312.75 Million and PhP252.53 Million for Sept. 30, 2012 and December 31, 2011 respectively. The increase in receivables is mainly brought about by the increase in the Company’s sales. Loans receivables decreased by PhP7.0 Million or 47%. The loans receivables amounted to PhP7.00 Million and PhP15.00 Million for Sept. 30, 2012 and December 31, 2011 respectively. Inventories increased by PhP132.78 Million or 73%. The inventories amounted to PhP312.61.00 Million and PhP173.83.00 Million for Sept. 30, 2012 and December 31, 2011 respectively. The increase in inventories is mainly due to the increased operations of the Company. The significantly higher sales this year along with the retail store chain requiring its own inventory has brought about the need for the increased level of inventory. Property and equipment increased by PhP220.67 Million or 234%. The Property and equipment amounted to PhP314.72 Million and PhP94.05 Million for Sept. 30, 2012 and December 31, 2011 respectively. The increase in property and equipment is due to the construction of the Company’s farms which amounted to P246 Million as of Sept. 30, 2012.

47
Loans payable increased by PhP123.85 Million or 31%. The loans payable amounted to PhP516.35 Million and PhP392.50 Million for Sept. 30, 2012 and December 31, 2011 respectively. The increase in loans is for the increased funding requirements brought about by the construction of the Company’s farms which already amounts to P246 Million. As well as to fund the Company’s expanded operations. Advances from related parties decreased by PhP50.41 Million or 96%. The advances amounted to PhP2.05 Million and PhP52.46 Million for Sept. 30, 2012 and December 31, 2011 respectively. Financial position as of June 30, 2012 compared to December 31, 2011 including discussion on Material Changes to the Balance Sheet as of June 30, 2012 compared to Audited Balance Sheet as of Fiscal year ended December 31, 2011 (increase/decrease of 5% or more). Total assets increased by PhP367.48 Million or 35%. The total assets amounted to PhP1.42 Billion and PhP1.05 Billion for June 30, 2012 and December 31, 2011 respectively. The increase in total assets is primarily due to the increase in cash and property and equipment. Cash on hand and in banks increased by PhP248.12 Million or 121%. The amounts recorded were PhP452.91 Million and PhP204.79 Million for June 30, 2012 and December 31, 2011 respectively. The increase in cash is primarily due to the proceeds of the Company’s IPO in May 23. Accounts receivables increased by PhP20.73 Million or 8%. The amounts recorded were PhP273.26 Million and PhP252.53 Million for June 30, 2012 and December 31, 2011 respectively. The increase in accounts receivable is mainly due to the increase in the Company’s sales. The increase in accounts receivable is not that high when compared to the huge increase in the Company’s sales. This is due to increased sales being mainly brought about by the sales thru the affiliate stores which are on cash basis and no credit terms are given. Loans receivables decreased by PhP6.00 Million or 40%. The amounts recorded were PhP9.00 Million and PhP15.00 Million for June 30, 2012 and December 31, 2011 respectively. The decrease is due to the payments received by the Company. Property and equipment increased by PhP110.96 Million or 118%. The amounts recorded were PhP205.01 Million and PhP94.05 Million for June 30, 2012 and December 31, 2011 respectively. The increase is due to the construction of the Company’s farms. Loans payable increased by Php87.50 Million or 22%. The amounts recorded were PhP480.00 Million and PhP392.50 Million for June 30, 2012 and December 31, 2011 respectively. The increase is mainly due to the increased financing needed for the construction of the Company’s farms as well as to fund the Company’s increased expansion into new markets. Advances from related parties decreased by PhP39.66 Million or 76%. The amounts recorded were PhP12.81 Million and PhP52.46 Million for June 30, 2012 and December 31, 2011 respectively. Audited financial position as of December 31, 2011 compared to December 31, 2010 including discussion on Material Changes to the Company’s Audited Balance Sheet as of Fiscal year ended December 31, 2011 compared to Audited Balance Sheet as of Fiscal year ended December 31, 2010 (increase/decrease of 5% or more) Total assets increased by P391.74 Million or 59%. Recorded amounts were P1.05 Billion and P661.31 Million as of year end 2011 and 2010 respectively. The increase in assets is primarily due to the Company’s income from operations and the infusion of P323.10 Million additional capital by stockholders during the year. The infused capital shall be used for general corporate purposes and expansion of the business such as but not limited to contract growing and breeding of hogs and

48
poultry. These aforementioned projects, however, is not the target for the use of proceeds of the Company’s application for listing and initial public offering of its shares to the public. Total liabilities had no significant movement, it only decreased by P6.54 Million or 1%. There was no significant movement because the reduction in the amounts of trade payables and short term loans were offset by the increase in amounts owed to stockholders and the increased provision for income tax. Cash increased by P185.68 Million or 972%. It amounted to P204.79 Million in 2011 up from P19.11 Million in 2010. This is primarily due to the additional cash invested by the stockholders. Trade receivables decreased by P88.36 Million or 26%. It amounted to P252.53 Million in 2011 down from P340.86 Million in 2010. The decrease is mainly due to the normalization of our terms, the 2010 balance is high because we extended terms to our dealers to encourage them to book their orders. We did this in 2010 because of the effects of the El Nino phenomenon on our sales. In year end 2011, we no longer offered the extended terms. The advances to related parties increased by P31.62 Million or 91%. It amounted to P66.50 Million in 2011 up from P34.87 Million in 2010. This is due to the expansion of operations of affiliates which necessitated the increase in funds needed for investment and operations. Inventories decreased by P44.41 Million or 20%. It amounted to P179.84 Million in 2011 down from P224.44 Million in 2010. This is mainly due to the favorable weather and market conditions for our products in 2011. Our products were fast moving especially in the year-end which is our peak season. This contrasts to the situation in 2010 when the El Nino phenomenon affected the sales of our products which resulted in higher than anticipated levels of inventory in year-end 2010. Loans receivable amounted to P120.00 Million in 2011, there was no amount recorded in 2010. This account represents the amount loaned to Avestha Holding Corporation, which is an affiliate of the Company. The loan is intended as an advance for the planned purchase of the Company of Avestha’s properties. The loan is provided with a market rate of interest set at 6%, so as to compensate the Company for the loan until the purchase of the properties is finalized. Investment properties amounted to P134.15 Million in 2011, there was no amount recorded in 2010. These are the properties purchased by the Company, which are being used as collateral by the Company for loans. Property and equipment increased by P47.55 Million or 189%. It amounted to P72.77 Million in 2011 up from P25.22 Million in 2010. The increase represents amounts spent for the Company’s construction of Hog and Broiler farms. Trade payables decreased by P34.66 Million or 20%. It amounted to P134.70 Million in 2011 down from P169.36 Million in 2010. The decrease is mainly due to the fact that the Company takes advantage of cash discounts as much as possible. Loans payable decreased by P77.00 Million or 16%. The decrease is mainly due to the increased cash infusion from stockholders and also from cash internally generated from operations which has allowed the Company to lower its debt levels, while at the same time having enough funds for current operations and also pursue its expansion programs in Hog and Broiler farms. To clarify, the intended target expansion program for part of the additional cash infusion is the Hog and Broiler Farms. On the other hand, the expansion program relating to the establishment of a chain of Calata Retail Stores will be funded by the net proceeds of the Initial Public Offering. Advances from related parties amounted to P52.46 Million in 2011, there was no amount recorded in 2010. This represents the amount loaned from stockholders which is intended to offset the amounts advanced by the Company to its affiliates with the intention that the Company’s funds are intact for its own operations and expansion programs.

49
Dividends payable amounted to P25.00 Million, there was no amount recorded in 2010. This is the accrual of the dividend declared by the Company’s board of directors from the Company’s unrestricted retained earnings. Capital stock increased by P323.10 Million or 32,310%. The increase is due to the additional investment in the Company from the stockholders. As previously explained said capital infusion was useful in decreasing the loans payable by 16% and partially funding the Hog and Broiler Farm construction. Debt to equity decreased from 271.25 in 2010 to 0.98 in 2011 or a decrease of 270.27 or 27,579%. The increase is mainly due to the increase in stockholders’ equity from P1.73 Million in 2010 to P400.00 Million in 2011. The increase in stockholders’ equity came from the additional investment infused by stockholders amounting to P323.10 Million which increased the paid up capital stock to P324.10 Million from only P1.00 Million the year before. The stockholders’ equity also increased due to the increase in retained earnings brought about by the net income earned by the Company during the year which amounted to P100.17 Million after taxes. The increase in retained earnings from the net income was partially offset by the declaration of dividend in 2011 amounting to P2.00 Million. Material Changes to the Company’s Audited Balance Sheet as of Fiscal year ended December 31, 2010 compared to Audited Balance Sheet as of Fiscal year ended December 31, 2009 (increase/decrease of 5% or more) Trade and other receivables increased by 17%. Trade and other receivables amounted to PhP355.86 Million and PhP304.03 Milion as of 2010 and 2009 respectively or an increase of PhP51.83 Million or 17%. Inventories decreased by 17%. Inventory amounted to PhP224.24 Million and PhP269.14 Million as of 2010 and 2009 respectively, or a decrease of PhP44.90 Million or 17%. Property and equipment increased by 1,200%. Property and equipment amounted to PhP25.22 Million and PhP1.94 Million as of 2010 and 2009 respectively or an increase of PhP23.28 Million or 1200%. Advances to related parties increased by PhP31.50 Million or 934%. Advances to related parties amounted to PhP34.87 Million and PhP3.37 Million as of 2010 and 2009 respectively. Trade and other payables decreased by PhP66.96 Million or 28%. The amounts recorded are PhP169.36 Million and PhP236.32 Million as of 2010 and 2009 respectively. Short-term loans increased by PhP127.99 Million or 37%. The amounts recorded are PhP469.50 Million and PhP341.51 Million as of 2010 and 2009 respectively. Debt to equity ratio increased from 22.93 in 2009 to 271.25 in 2010 or an increase of 1,083%. The increase is mainly due to the decrease in stockholders’ equity from P13.89 Million in 2009 to P0.73 Million in 2010 or a decrease of P13.16 Million or 1,803%. The decrease in stockholders is due to declaration of dividends in 2010 amounting to P47.00 Million. Discussion and Representation on both Interim and Year End Audited Financial Statements There are no known trends or demands, commitments, events or uncertainties that will result in or that are reasonably likely to result in increasing or decreasing the Company’s liquidity in any material way. The Company does not anticipate having any cash flow or liquidity problems within the next twelve (12) months. The Company is not in default or breach of any note, loan, lease or other indebtedness or financing arrangement requiring it to make payments. No significant amount of the Company’s trade payables have not been paid within the stated trade terms.

50
The Company does not foresee any event that will trigger direct or contingent financial obligation that is material to it, including any default or acceleration of an obligation. There are no material commitments for capital expenditures, events or uncertainties that have had or that are reasonably expected to have a material impact on the continuing operations of the Company. There are no known trends, events or uncertainties that have had or that are reasonably expected to have a material favorable or unfavorable impact on net sales or revenues or income from continuing operations. No significant elements of income or loss had arisen from the Company’scontinuing operations. There are no other material changes in the Company’ financial position (5%) or more and condition that will warrant a more detailed discussion. Further, there are no material events and uncertainties known to management that would impact or change reported financial information and condition of the Company. There were no seasonal aspects that had a material effect on the financial condition or results of operations of the Company. LIQUIDITY AND CAPITAL RESOURCES In the years 2009, 2010 and 2011 up to the end of the first half of 2012, the Company’s primary source of liquidity was proceeds from sales and bank financing activities and also the proceeds of the Company’s IPO. Net cash from operating and financing activities were sufficient to cover the Company’s working capital and capital expenditure requirements in the years 2009, 2010, 2011 and 2012. The Company has credit lines with several of the top banks of the Philippines which gives it financial flexibility in its operations. The Company’s cash position as of June 30, 2012 amounted to P452.91 Million, this is a decrease of 121% from the December 31, 2011 recorded amount. The Company’s cash position has been steadily increasing since 2009. From only PhP20.21 Million in December 31, 2009 to PhP204.79 Million in Dec. 31, 2011, an increase of PhP184.58 Million or 913%. The increase is primarily due to earnings from the Company’s operations and the additional capital infusion from stockholders in 2011. The following table sets forth information from the Company’s pro forma statements of cash flows for the periods indicated: Cash Flows
Sept. 30, 2012 Dec. 31, 2011 Dec. 31, 2010
Dec. 31, 2009
Net cash provided by (used in) operating activities
(143,295,013) 302,478,444 (73,335,053) 8,414,870
Net cash provided by (used in) investing activities
(219,503,044) (335,961,664) (29,032,075) (816,542)
Net cash provided by (used in) financing activities
355,,051,175 219,165,977 101,262,787 (3,542,629)
Beginning Cash 204,788,818 19,106,061 20,210,402 16,154,703
Ending Cash 197,041,936 204,788,818 19,106,061 20,210,402
Indebtedness
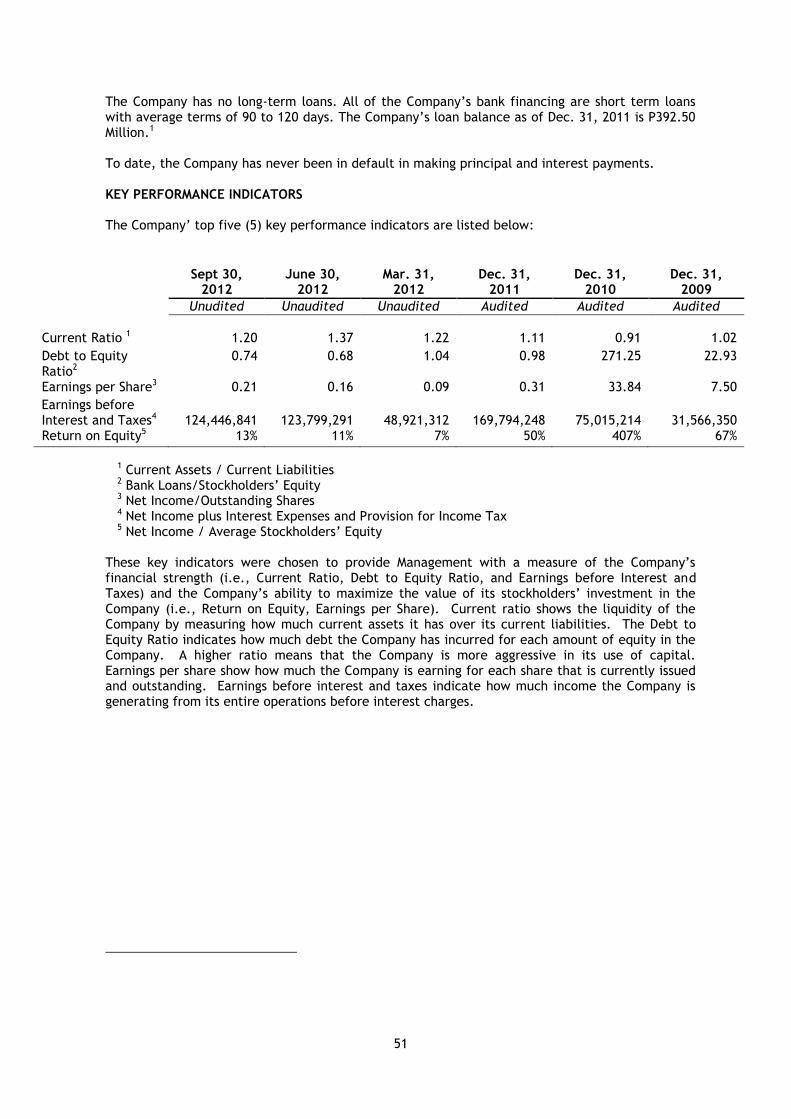
51
The Company has no long-term loans. All of the Company’s bank financing are short term loans with average terms of 90 to 120 days. The Company’s loan balance as of Dec. 31, 2011 is P392.50 Million.1 To date, the Company has never been in default in making principal and interest payments. KEY PERFORMANCE INDICATORS The Company’ top five (5) key performance indicators are listed below:
Sept 30, 2012
June 30, 2012
Mar. 31, 2012
Dec. 31, 2011
Dec. 31, 2010
Dec. 31, 2009
Unudited Unaudited Unaudited Audited Audited Audited
Current Ratio 1 1.20 1.37 1.22 1.11 0.91 1.02
Debt to Equity Ratio2
0.74 0.68 1.04 0.98 271.25 22.93
Earnings per Share3 0.21 0.16 0.09 0.31 33.84 7.50
Earnings before Interest and Taxes4
124,446,841
123,799,291
48,921,312 169,794,248 75,015,214 31,566,350
Return on Equity5 13% 11% 7% 50% 407% 67%
1 Current Assets / Current Liabilities 2 Bank Loans/Stockholders’ Equity 3 Net Income/Outstanding Shares 4 Net Income plus Interest Expenses and Provision for Income Tax 5 Net Income / Average Stockholders’ Equity
These key indicators were chosen to provide Management with a measure of the Company’s financial strength (i.e., Current Ratio, Debt to Equity Ratio, and Earnings before Interest and Taxes) and the Company’s ability to maximize the value of its stockholders’ investment in the Company (i.e., Return on Equity, Earnings per Share). Current ratio shows the liquidity of the Company by measuring how much current assets it has over its current liabilities. The Debt to Equity Ratio indicates how much debt the Company has incurred for each amount of equity in the Company. A higher ratio means that the Company is more aggressive in its use of capital. Earnings per share show how much the Company is earning for each share that is currently issued and outstanding. Earnings before interest and taxes indicate how much income the Company is generating from its entire operations before interest charges.