philippine stock exchange ms. janet a. encarnacion · fli is studying the incorporation of a new...
TRANSCRIPT

27 April 2012
Philippine Stock Exchange 3rd Floor, Philippine Stock Exchange Plaza Ayala Triangle, Ayala Avenue Makati City Attention: Ms. Janet A. Encarnacion Head, Disclosure Department Gentlemen: Please find attached Annual Report of Filinvest Land, Incorporated for the calendar year ended December 31, 2011. Thank you.
Very truly yours, ATTY. CONRAD P. CERENO Corporate Information Officer
173 P. GOMEZ ST. SAN JUAN, METRO MANILA, PHILIPPINES TEL. 727-0431 TO 39

1
SEC Registration No. 170957
F I L I N V E S T L A N D , I N C . A N D S U B S I D I A
R I E S
(Company’s Full Name)
1 7 3 P . G o m e z S t r e e t , S a n J u a n , M e
t r o M a n I l a
(Business Address: No. Street City/Town/Province)
Venus A. Mejia 727-0431 (local 363) (Contact Person) (Company Telephone Number)
1 2 3 1 2 0 1 1 1 7 - A 0 4 2 7 Month Day (Form Type) Month Day
(Fiscal Year) (Annual Meeting)
(Secondary License Type, If Applicable)
Dept. Requiring this Doc. Amended Articles Number/Section Total Amount of Borrowings
Total No. of Stockholders Domestic Foreign
To be accomplished by SEC Personnel concerned
S T A M P S Remarks: Please use BLACK ink for scanning purposes.
COVER SHEET
File Number LCU
Document ID Cashier

2
SECURITIES AND EXCHANGE COMMISSION
SEC FORM 17-A
ANNUAL REPORT PURSUANT TO SECTION 17 OF THE SECURITIES REGULATIONS CODE AND SECTION 141 OF THE CORPORATION CODE OF THE PHILIPINES
For the calendar year ended
December 31, 2011
SEC Identification Number 170957 BIR Tax ID
000-533-224
Exact name of registrant as specified in its charter
FILINVEST LAND, INC.
Province, Country or other jurisdiction of incorporation or organization Philippines
173 P. Gomez St., San Juan, Metro Manila Address of principal office Postal Code
1500
Registrant ‘s telephone number, including area code 02-727-04-31 to 39
Former name, former address, and former fiscal year, if changed since last report Not Applicable
Securities registered pursuant to Section 8 and 12 of the SRC
Number of shares of Amount of Long-Term Title of Each Class Common Stock Outstanding Debt Outstanding
Common Stock, P 1.00 par value 24,249,759,506 16,488,016,621 Are any or all of these securities listed on the Philippine Stock Exchange Yes No
x

3
Check whether the issuer:
(a) has filed reports required to be filed by Section 17 of the SRC Rule 17 thereunder or Section 11 of the RSA Rule 1(a)-1 thereunder, and Sections 26 and 141 of the Corporation Code of the Philippines during the preceding twelve (12) months (or for such shorter period that the registrant was required to file such reports);
Yes No (b) has been subject to such filing requirements for the past 90 days.
Yes No State the aggregate market value of the voting stock held by non-affiliates. P
11.13 Billion
APPLICABLE ONLY TO ISSUERS INVOLVED IN INSOLVENCY/SUSPENSION OF PAYMENTS PROCEEDINGS DURING THE PRECEDING FIVE YEAR:
Check whether the issuer has filed all documents and reports required to be filed by Section 17 of the Code subsequent to the distribution of securities under a plan confirmed by a court of the Commission. Not Applicable
Yes No If any of the following documents are incorporated by reference, briefly describe them and identify the part of SEC Form 17-1 into which the document is incorporated.
a) Any annual report to security holders; b) Any proxy or information statement filed pursuant to SRC Rule 20 and 17.1(b); c) Any prospectus filed pursuant to SRC Rule 8.1-1
Part 1 - BUSINESS AND GENERAL INFORMATION Item 1. BUSINESS 1. 1. Brief Description and Recent Developments Filinvest Land Inc. (“FLI” or the “Company”) was incorporated on November 24, 1989 and began commercial operations in August 1993 after Filinvest Development Corporation (“FDC”) spun off its real estate operations and transferred all related assets and liabilities to FLI in exchange for shares of FLI. FLI was listed in the PSE on October 25, 1993. FLI is one of the leading real estate developers in the country, providing a wide range of real estate products to residential and commercial customers. FLI (including its predecessor’s operations) has over 40 years of real estate expertise and has developed over 2,000 hectares of land, having provided home sites for more than 120,000 families.
x
x

4
In 2006, FLI acquired three strategic investment properties, Festival Supermall and a 60% ownership interest in each of Filinvest Asia Corp. (FAC) and Cyberzone Properties, Inc. (CPI). Festival Supermall is a four-story premier shopping complex with a gross leasable area (GLA) of approximately 135,163 sq.m. It is situated on a total land area of 10 hectares and is located within Filinvest Corporate City, a development of Filinvest Alabang, Inc. (FAI) in Alabang, Muntinlupa City. FLI has leased from FAI the 10 hectares of land on which the mall and its adjoining structures (such as parking lots) are situated. The lease is for a term of 50 years from October 1, 2006, renewable for another 25 years, with FLI required to pay monthly rent equivalent to 10.0% of the monthly gross rental generated by the mall. Festival Supermall was designed to allow the construction of an additional wing to the current two-wing structure on two adjacent hectares of land available for development, which would increase the mall’s gross floor area (GFA) by up to 50,000 sq.m. The lease between FAI and FLI allows FLI to construct additions or extensions to the current mall structure, which will revert to FAI upon termination of the lease. Festival Supermall is approximately 15 kilometers south of the Makati City central business district and is near the juncture of three major road networks – the South Expressway, the old National Highway and the Alabang-Zapote Road which links the South Expressway to the Coastal Road that connects Metro Manila to Cavite province. Its location allows it to attract customers from offices located in the Filinvest Corporate City, the subdivision developments of southern Metro Manila such as the high-end Ayala Alabang subdivision, and from nearby provinces such as Batangas, Cavite and Laguna. Festival Supermall’s current anchor tenants include stores operated by some of the Philippines’ largest retailers, such as the J.G. Summit group of companies (Robinsons Department Store and Handyman Do It Best), SM Investments Corporation, (SaveMore Supermarket and Ace Hardware) and the Rustan’s Group (Shopwise Supercenter). Festival Supermall also has a group of tenants that are well-known international and domestic retailers, restaurant chains and service companies, such as Bose, Levi’s, Bench, Giordano, The Body Shop, National Bookstore, Starbucks, Seattle’s Best Coffee, McDonald’s, Chowking, Jollibee and KFC. In addition to having over 600 retail stores and outlets, Festival Supermall also features amenities such as a ten-theater movie multiplex with digital surround sound systems and two themed amusement centers. The mall also has exhibit, trade and music halls, which are leased out to organizers of events such as trade fairs sponsored by the Philippine Department of Trade and Industry. To strengthen the mall’s position as southern Manila’s biggest mall that offers the most diverse shops and services, FLI has started the development of the mall’s expansion on another 10 hectares of land wherein an additional 57,000 square meters of gross leasable area (GLA) will be added to the current mall’s 135,163 square meter GLA. Land development on the expansion started in late 2011 and construction is expected to be completed in stages, starting in 2014. Plans are also being finalized to renovate the existing mall in phases, which is targeted to start before end of 2012, and should be completed before end-2016.
he Festival Supermall. In this acquisition, FLI assumed certain debts amounting to P2.5 billion and issued a total of 5.6 billion common shares to Filinvest Development Corporation (FDC) and Filinvest Alabang, Inc.(FAI). The valuations for the three properties and businesses involved in the said property-to-share swap were provided by an independent, internationally-known third party appraiser, Colliers International Philippines.
Festival Supermall is Southern Manila's premier 200,000 sqm regional shopping center located at the heart of Filinvest Corporate City, right on the South Luzon Expressway; making it easily accessible. At present, it has over 600 tenants. Among others, its major anchor tenants include 2 supermarkets, 2

5
department stores, 2 hardware centers, 10 cinemas and 2 amusement theme parks. FLI expects continuous growth in retail revenues due to the increasing OFW remittances, the increasing middle-class population as well as the continuing development within Filinvest Corporate City. FLI leased from FAI the 10 hectares of land on which the mall and its adjoining structures (such as parking lots) are situated. Day-to-day operations of the Festival Supermall are currently handled by Festival Supermall, Inc. (“FSI”), an affiliate of FLI, pursuant to a management contract. FAC owns 50% of the PBCom Tower, a 52 floor, Grade A, PEZA-designated I.T./office building in Ayala Avenue, Makati City, Metro Manila. FLI shares 60% of revenues from the 36,000 sqm. leasable space owned by FAC in this building. FAC’s principal tenants include Citibank N.A., Citigroup Business Process Solutions Pte., Ltd., East West Banking Corporation, FDC Utilities, Inc., Thiacom, Stellent Services, Linde Gas, IBM Daks Eservices, Bayer Philippines, Huawei Technology, Diversified Technology Systems and Chartis Technology. CPI owns and operates the IT buildings in Northgate Cyberzone, a PEZA registered BPO park within Filinvest Corporate City. FLI generates revenues from leasable space in twelve office buildings with a gross leasable area of 131,011 sq.m. as of December 31, 2011. Among others, Northgate’s major tenants are HSBC, Convergys, APAC, GenPact Services LLC, eTelecare Global Solutions, Inc., and ICICI Bank Limited. Its day-to-day operations are handled by FAI. A significant amount of leasable space is planned to be made available so as to meet some of the significant demand of the BPO industry in the next few years. In addition to the acquisition of these three strategic investments, FLI also entered into a joint venture agreement with Africa Israel Investments (Philippines) Inc. (“AIIPI”) in September 2006 to jointly develop the Timberland Sports and Nature Club (“TSNC”) and approximately 50 hectares of land comprising Phase 2 of FLI’s Timberland Heights township project in 2006. TSNC started its commercial operations in October 2008. On February 8, 2010, FLI acquired the 40% interest in its joint ventures – CPI and FAPI, from Africa-Israel Properties (Phils.), Inc. and from Africa-Israel Investments (Phils.), Inc., respectively. The acquisition resulted in CPI and FAPI becoming wholly owned subsidiaries of FLI. The acquisition of the joint ventures’ interests was accounted for as a business combination. Prior to the acquisition, FLI accounted for its investments in the joint ventures under the proportionate consolidation. The sale by Africa-Israel of its interests in the two companies was part of Africa-Israel’s global portfolio rebalancing and consolidation activity. On the other hand, the acquisition of Africa-Israel’s interests will enable FLI to consolidate its share in the strong and stable recurring revenue streams from the two companies as well as provide incremental development potential to FLI’s existing revenue streams. With a more diversified portfolio, FLI expects to generate stable recurring revenue from its retail and office investment properties. These recurring revenues can, in turn, be used to provide internally generated funding for other projects. The Company is not and has never been a subject of any bankruptcy, receivership, or similar proceedings. As aforementioned, there were significant amounts of assets purchased by the Company as part of the transactions which were consummated in 2006. 1.2. Form and Date of Organization

6
FLI was incorporated in the Philippines on 24th November 1989 as Citation Homes, Inc. and later changed its name to FLI on 12th July 1993. It started commercial operations in August 1993 after Filinvest Development Corporation (FDC), the Parent Company, spun off its real estate operations and transferred all related assets and liabilities to FLI in exchange for shares of stock of FLI. FLI was listed on the PSE on October 25, 1993. As of December 31, 2011, FDC FLI’s parent company owns 53.485% of Common Stock and 100% of Preferred Stock of FLI. FDC is the holding company for real estate and other business activities of the Gotianun Family. FDC traces its origin to the consumer finance business established by Mr. Andrew Gotianun Sr. and his family in 1955. The shares of FDC and FLI are both listed in the Philippine Stock Exchange. The ultimate parent company of FLI is ALG Holdings Corporation. In February 2007, the Company achieved a record-breaking success with its follow-on offering where it listed up to 3.7 billion new common shares at the Philippine Stock Exchange. The follow-on offering was more than five times oversubscribed, raising around $204 million for both the primary and secondary offerings. The offering raised additional funds for the Company’s capital expenditures for the fast track development of targeted projects. On November 19, 2009, FLI issued Fixed Rate Retail Bonds with aggregate principal amount of P 5 billion comprised of P 500 million Three (3)-Year Fixed Rate Bonds due in November 2012 and P 4.5 billion Five (5)-Year Fixed Rate Bonds due in November 2014. The Three Year Bonds carry a fixed interest rate of 7.5269% p.a. Interest on the Bonds is payable quarterly in arrears starting on February 19, 2010. On the other hand, the Five Year Bonds have a fixed interest rate of 8.4615% p.a. and is payable quarterly in arrears starting on February 20, 2010. As part of the Company’s fund raising activities, on June 27, 2011, FLI offered to the public five-year and three-month fixed-rate retail bonds with an aggregate principal amount of Three Billion Pesos (P 3,000,000,000.00) due on October 07, 2016. The bonds were issued on July 07, 2011 with a fixed interest rate of 6.1962% per annum. The interest on the bond is payable quarterly in arrears starting on October 07, 2011. The bonds shall be repaid at 100% of their face value on October 07, 2016. 1.3. Subsidiaries FLI has six wholly owned subsidiaries. The following four subsidiaries are engaged in real estate marketing business and handle the marketing and sale of socialized, affordable, middle income, high-end and farm estate property development projects of FLI. 1. Property Maximizer Professional Corp. (PROMAX) incorporated on October 3, 1997. 2. Property Specialists Resources, Inc. (PROSPER) incorporated on June 10, 2002 and started commercial operations on January 01, 2004. 3. HomePro Realty Marketing, Inc. incorporated on May 16, 2003 and started commercial operations on January 01, 2004. 4. Leisurepro, Inc. (Leisurepro) incorporated on April 21, 2004 and started commercial operations on January 01, 2006. In addition, the following two companies had become wholly-owned subsidiaries of FLI in February 2010:

7
1. Cyberzone Properties, Inc. (CPI). CPI was incorporated on January 14, 2000 and began commercial operations on May 1, 2001. CPI is registered with the PEZA as an Economic Zone Facilities Enterprise, which entitles CPI to certain tax benefits and non-fiscal incentives such as paying a 5.0% tax on its modified gross income in lieu of payment of national income taxes. CPI is also entitled to zero percent value-added tax on sales made to other PEZA-registered enterprises. CPI operates the Northgate Cyberzone, which is located on a 10-hectare parcel of land within Filinvest Corporate City owned by FLI. Of the 10 hectares, approximately six hectares are available for future development. CPI’s current buildings are as follows:
• Plaza A: This is a six-story building with an approximate GFA of 11,575 sq.m. and an approximate GLA of 10,860 sq.m. Plaza A was completed in June 2006 and was substantially fully leased to GenPact Services LLC and eTelecare Global Solutions, Inc.
• Plaza B and Plaza C: Plaza B and Plaza C are four-story buildings, each with an
approximate GFA of 7,150 sq.m. and an approximate GLA of 6,540 sq.m. for a combined GLA of 13,080 sq.m. Plaza B and Plaza C were both completed in 2001. Each of Plaza B and Plaza C was substantially fully leased. Tenants for Plaza B include goFluent, AMS Express, Team Asia, Outboundphil, APPCO Direct Int’l., Treadyne and Seven Seven Global Services, Inc. All of Plaza C has been leased by APAC Customer Services, Inc.
• Plaza D: This is a six-story building with the same specifications as Plaza A and with an
approximate GFA of 11,575 sq.m. and an approximate GLA of 10,860 sq.m. Plaza D had been leased to ICICI First Source Ltd., a 100% owned subsidiary of India’s largest private sector bank, and Verizon Communications Phils Inc, the Philippine branch of Verizon Business solutions, a leading communications company in the United States of America.
• Convergys Building: This is a three-story building with an approximate GFA of 6,466 sq.m.
and an approximate GLA of 5,839 sq.m. Completed in 2004, it was one of the first buildings completed in the Northgate Cyberzone and was “built-to-suit” (BTS) to meet the requirements of Convergys. Recently Convergys signed a contract to extend the lease for another five years.
• HSBC Building: This is another building that was constructed on a BTS basis to meet the
requirements of HSBC. Completed in 2005, the HSBC building has an approximate GLA of 18,000 sq.m.
• IT School: This is a three-story building with an approximate GFA of 3,297 sq.m. and an
approximate GLA of 2,595 sq.m. Its major tenant is currently Genpact Services LLC.
• Building 5132: This is a six-story building with an approximate GFA of 10,560 sq.m. and an approximate GLA of 9,408 sq.m. Building 5132 has been fully taken up by GenPact Services LLC.
• iHub I and iHubII: This is a two-tower complex (one with six stories and the other with nine
stories) iHub 1 has an approximate GLA of 9,474 sq.m. and has been leased out to numerous tenant which includes GenPact, HSBC, W.R. Grace Philippines and Lattice Semiconductor.

8
IHub 2 has an approximate GLA of 14,166 sq.m. and has been leased out primarily to Convergys and Integra.
• Vector One : an 11- story building with an approximate GFA of 19,545 sq.m. and an
approximate GLA of 17,951 sq.m. It was completed in 2010. Filinvest Alabang, Inc. (FAI) was its first tenant, occupying the fifth to seventh floors for its corporate headquarters. Other tenants of the building are Convergys and Flour Daniel.
• Vector Two: This building has the same configuration as with Vector One. It is also 11
stories high with an approximate GLA of 17,914 sq.m. It was completed in October 2011. Tenants of the building include Infosys and Flour Daniel.
• Filinvest Building: This building is targeted for completion within the third quarter of 2012.
This five-storey BPO building located Along EDSA in Mandaluyong City will have approximately 7,000 sq.m. of GLA. This is FLI’s first BPO office building outside Northgate Cyberzone.
Considering the five hectares of land available for the construction of additional buildings within the Northgate Cyberzone, FLI expects to be able to provide an additional 195,510 sq.m. of leasable office space to accommodate expected increases in demand from BPO companies. These BPO companies usually require significant amounts of office space for their operations. FLI, through CPI, plans to focus on attracting their businesses, including custom-designed office space with call center and BPO design requirements in mind. Before completion of a new building, CPI evaluates whether the anticipated demand for office space among BPO firms would likely allow it to lease out space in the building while it is being constructed. For example, office space at Plaza A and Plaza D were tendered for lease after construction began on these buildings but before completion. FLI expects to continue this practice. Office space leases at the Northgate Cyberzone are typically for periods ranging from three to five years, although HSBC has entered into a ten-year lease. The lease agreements generally require tenants to make a three-month security deposit. Rent is paid on a fixed per square meter basis, depending on unit size and location.
1. FAC was incorporated on January 22, 1997. FAC is 60.0%-owned by FLI and 40.0%-owned by Reco Herrera Pte Ltd (RHPL), an affiliate of Government of Singapore Investment Corporation PTE Ltd.(GIC). FAC owns 50.0% of the 52-storey PBCom Tower, equivalent to 36,000 square meters of leasable office space. The remaining 50.0% of PBCom Tower is owned by the Philippine Bank of Communications. Two development projects in Northgate Cyberzone are on-going, with details as follows:Building 5132: This is a six-storey building expected to be completed in the first quarter of 2007. Negotiations with several prospective tenants for this building are on-going. iHub I and iHub II: These are two contiguous towers(one with six storeys and the other with nine storeys) in one complex. iHub I is scheduled to be completed by mid-2007 while iHub II is scheduled to be completed in the third quarter of 2007.(FAPI)
2. Filinvest AII Philippines, Inc. (FAPI) FAPI was incorporated on September 25, 2006 as a joint venture corporation with Africa Israel Investments (Philippines), Inc (AIIPI) to develop the Timberland Nature & Sports Club and Phase 2 of Timberland Heights. On February 08, 2010, FAPI became a wholly owned subsidiary of FLI with FLI’s acquisition of the 40% interest of AIIPI.. FLI acquired 60.0% ownership interest in FAPI by contributing

9
50 hectares of land for Phase 2 of Timberland Heights, all of the Class “A” member shares in the Timberland Sports and Nature Club held by FLI and development costs of approximately P100.0 million. AIIPI contributed P250.0 million to FAPI and has a 40.0% ownership interest in FAPI. FLI has also granted AIIPI a five-year option to participate in the development of the remaining areas of Timberland Heights. Timberland Heights is a 677-hectare township project anchored by the Timberland Sport and Nature Club, which was designed to be a world-class family country club in a mountain resort setting. Timberland Heights is situated at an elevation of 320 meters above sea level and provides panoramic views of the north of Metro Manila. The master plan for Timberland Heights includes Banyan Ridge, a middle income subdivision; Mandala Farm Estates; the Ranch and Banyan Crest, a high end subdivision; and, a 50-hectare linear greenway that straddles the entire development which will provide a large outdoor open space for residents.
1.4. Joint Ventures FLI hads also 60% interest in arrangements to form the following companies: Filinvest Asia Corporation (FAC) which is accounted for as a joint venture. FAC was incorporated on January 22, 1997 and as of the date of this report is 60.0%-owned by FLI and 40.0%-owned by Reco Herrra Pte.Ltd. (RHPL). RHPL is 100% beneficially owned by Government of Singapore Investment Corporation Pte. Ltd (GIC). FAC owns 50.0% of the 52-story PBCom Tower, which is strategically located at the corner of Ayala Avenue and V. A. Rufino (formerly Herrera) Street in the Makati City Central Business District. FAC owns 36,000 sq.m. of leasable office space. The remaining 50.0% of PBCom Tower is owned by the Philippine Bank of Communications. The PBCom Tower is designated as an information technology building by PEZA. Consequently, tenants occupying space in PBCom Tower are entitled to avail of certain fiscal incentives, such as a 5% tax on modified gross income in lieu of the regular corporate income tax of 30%. As of December 31, 2011, FAC’s principal tenants include Citibank N. A., Citigroup Business Process Solutions Pte. Ltd., East West Banking Corporation, FDC Utilities, Inc., Thiacom, Stellent Services, Linde Gas, IBM Daksh Eservices, Bayer Philippines, Huawei Technology, Diversified Technology Systems and Chartis Technology. Leases at the PBCom Tower are typically for periods ranging from three to five years, with the lease agreements generally requiring tenants to make a three-month security deposit. Rent is paid on a fixed rate per square meter basis depending on unit size and location. PBCom Tower, a PEZA designated I.T. building, is currently the tallest building in the Philippines. It is strategically located at the corner of Ayala Avenue and Herrera Street in the Makati City central business district. Some of its present tenants are Citibank, HSBC Electronic Data Processing, IBM Daksh eservices, ESS Manufacturing, New York Life Insurance and East West Bank, an affiliate of FLI.Cyberzone Properties, Inc.(CPI)
CPI owns and operates the buildings in the Northgate Cyberzone, a PEZA-approved BPO office park which is approximately 15 kilometers south of the Makati City central business district. The Northgate Cyberzone is located on a 10-hectare parcel of land owned by FLI in the Filinvest Corporate City and which CPI leases from FLI. Of the 10 hectares of land on which the Northgate Cyberzone is situated, approximately seven hectares are available for future expansion. As of December 2006, seven office buildings have been completed, with details as follows:
CPI was incorporated on January 14, 2000. It began commercial operations on May 1, 2001. CPI is 60.0%-owned by FLI and 40.0%-owned by Africa Israel Investment (Philippines) Limited (“AIIPL”).

10
• Two build-to-suit buildings (BTS) occupied for the backroom unit requirement of British bank HSBC Ltd. and Convergys, one of the biggest call centers.
An IT School building leased out to Informatics International College, a Singapore-headquartered information technology (“IT”) school, and YBM Philippines, which operates language schools in the Philippines. Plaza A, six-storey building which was completed in June 2006, substantially fully leased to GenPact Services LLC and eTelecare Global Solutions, Inc.. Plaza B and Plaza C, both four-storey buildings, completed in 2001. Tenants for Plaza B include Deutsche Bank, Globe Innove, Global Access Inc. and NDE Digitech. All of Plaza C has been leased by APAC. Plaza D, a six-storey building with approximately 50.0% of the gross leasable area leased to ICICI Bank Limited, India’s largest private sector bank; and the balance leased to Verizon. 1.5. Equity Investment in Filinvest Alabang, Inc. (FAI) FAI was incorporated on 25th August 1993 and started commercial operations in October 1995. FLI has a 20.0% equity interest ownership in FAI. The primary project of FAI is the Filinvest Corporate City (FCC), a 244-hectare development project which has been designed as a satellite city using modern, ecological, urban planning and design. The said project is under a joint venture agreement with the Government. Located at the southern end of Metro Manila and adjacent to the South Expressway, Filinvest Corporate City is surrounded by over 2,800 hectares of developed high-end and middle-income residential subdivisions and commercial developments. Other developments in FCC include residential condominiums, a driving range, sports club, office buildings, low-density retail developments and medical centers. 1.6. Business Groups, Product Categories, Target Markets and Revenue Contribution As a result of the recent business developments, FLI is now composed of two business segments with corresponding product categories, target markets and revenue contributions as follows: 1.6.1 Real Estate Segment FLI’s main real estate activity since it started operations has been the development and sale of residential property, primarily housing units and subdivision lots. and in certain cases, provision of financing for unit sales. Residential Projects FLI is able to tap the entire residential market spectrum with the following range of housing units catering to various income segments: • Socialized housing: These developments are marketed and sold under FLI’s Pabahay brand and
consist of projects where lots typically sell for P 160,000 or less per lot and housing units typically sell for P 400,000 or less per unit. Buyers for these projects are eligible to obtain financing from the Government-mandated Pag-IBIG Fund. Any income realized from the development and improvement of socialized housing sites are exempt from taxation.
• Affordable housing: These developments are marketed and sold under FLI’s Futura Homes brand
and consist of projects where lots are typically sold at prices ranging from above P160,000 to P 750,000 and housing units from above P 400,000 to P 1,500,000. Affordable housing projects are

11
typically located in provinces bordering Metro Manila, including Bulacan, Laguna, Batangas and Cavite, and in key regional cities such as Pampanga, Tarlac, Cebu and Davao.
• Middle-income housing: These developments consist of projects where lots are typically sold at
prices ranging from above P 750,000 to P 1,200,000 and housing units from above P 1,500,000 to P 4,000,000. Middle-income projects are typically located within Metro Manila, nearby provinces such as Rizal, Cavite, Pampanga and Laguna, and major regional urban centers in Cebu, and Davao and Zamboanga..
• High-end housing: Marketed under Filinvest Premiere brand, these developments consist of
projects where lots are sold at prices above P 1,200,000 and housing units for above P4,000,000. FLI’s high-end project are located both within Metro Manila and in areas immediately outside Metro Manila.
Other Real Estate Projects In order to achieve product and revenue diversification, FLI has added the following projects so as to cater to other market niches: a. Entrepreneurial Communities Because of the anticipated growth of small and medium-sized businesses as well as the Government support for entrepreneurial programs, FLI has launched its entrepreneurial communities under its “Asenso Village” brand. The first project is in Laguna province, which forms part of the Company’s Ciudad de Calamba township development. Asenso Village currently consists of three phases, with its land being “dual-zoned” to allow both residential and commercial use. The Company has also cooperated with the Government by providing venues for various livelihood and small business seminars and programs conducted by government agencies in the Asenso Village. At present, sales in Asenso Village consist of subdivision lot sales only, Although FLI intends to develop housing units for Asenso Village that incorporate living quarters and an area for buyers to set up and operate their small enterprises and home-based businesses. Subject to market conditions, FLI plans to develop additional “Asenso Villages” in other locations. b. Townships Townships are master-planned communities to include areas reserved for the construction of anchor facilities and amenities. FLI believes that these facilities and amenities will help attract buyers to the project and will serve as the nexus for the township’s community. Anchor developments could include schools, hospitals, churches, commercial centers, police stations, health centers and some other government offices; or in the case of Timberland Heights, a private membership club. FLI has master-planned and developed the Ciudad de Calamba, Timberland Heights and Havila (formerly, Filinvest East County) township projects which are respectively located along the southern, northern and eastern boundaries of Metro Manila. FLI has started in 2010 its fourth township project called Citta di Mare located in Cebu. Each township development is designed to include a mix of residential subdivisions from the affordable to the high-end sectors. Ciudad de Calamba

12
Ciudad de Calamba is a 350-hectare development located in Calamba, Laguna. This township project is a PEZA-registered special economic zone anchored by the Filinvest Technology Park-Calamba, which provides both industrial-size lots and ready-built factories to domestic and foreign enterprises engaged in light to medium non-polluting industries. As of December 31, 2006, 14 companies had either purchased lots or leased factories in the Filinvest Technology Park-Calamba. FLI also recently donated to the city government of Calamba a parcel of land located within the Ciudad de Calamba, which will be used for a city health center and police station. The Company also intends to develop the Ciudad de Calamba Commercial Center as part of this township project. The master plan for Ciudad de Calamba includes a mix of affordable and middle-income subdivisions as set out below:
Aldea Real, an affordable subdivision project which has a total developed area of approximately
16.9 hectares. Development for Phase 1 & 2 has been completed. Montebello, a middle-income subdivision project that is expected to have a total developed area
of approximately 12.9 hectares. Three phases have been launched and developed. Punta Altezza, an affordable subdivision project consisting of 3 phases has a total developed area
of approximately 9.7 hectares. Development work for Punta Altezza has been completed. Vista Hills, an affordable subdivision project which has a total developed area of approximately
5.2 hectares. Development work for Vista Hills has been completed. FLI’s first “Asenso Village” entrepreneurial community development is located within the
Ciudad de Calamba and is expected to have a total developed area of approximately 20.2 hectares. Development work for this project is almost complete.
La Brisa Townhomes, La Brisa, which literally means “ The Breeze” in Spanish, is located at
Brgy. Punta, Calamba City. With its Spanish Mediterranean theme, La Brisa is the first townhouse development at Ciudad De Calamba that offers not just an affordable and quality home to families but also a worthy investment for those who would like to establish a “House for Rent” business. La Brisa is very accessible to industrial estates operating in the vicinity, definitely a valuable venture for companies that provide housing privilege to employees.
Pueblo Solano, this is a 68 hectare portion of Ciudad de Calamba that has been earmarked for
low-affordable and socialized housing. Valle Dulce will offer low-affordable housing units and the first phase will cover 12.4 hectares. Valle Allegre subdivision offers socialized housing units and the first phase will cover 10.6 hectares. Land development is ongoing at Pueblo Solano.
Havila (formerly, Filinvest East County) Havila, or formerly, Filinvest East County is a 335-hectare township along the eastern edge of Metro Manila, which traverses the municipalities of Taytay, Antipolo and Angono. It is anchored by two educational institutions: San Beda College – Rizal and the Rosehill School. The master plan for Havila provides for a mix of affordable, middle-income and high-end subdivisions on rolling terrain overlooking Metro Manila at an elevation of 200 meters above sea level. This project is divided into three areas:
Mission Hills is located in the municipality of Antipolo and consists of seven subdivision projects
which are expected to have a total developed area of approximately 77.7 hectares. Three subdivisions (Santa Barbara, Santa Monica and Santa Catalina) were developed as high-end projects while another four (Santa Isabel, Santa Cecilia, Santa Clara and Sta. Sophia) have been

13
developed as middle-income projects. Development works for all seven subdivisions have been completed. The newest addition to the Mission Hills community, Sta. Sophia, a mid-income development was launched in July 2008.
Three subdivision projects are being developed in the municipality of Taytay which are expected
to have a total developed area of approximately 56.1 hectares. Development works for one high-end subdivision (Highlands Pointe) and for an affordable-segment subdivision (Villa Montserrat) have been completed. Development work for a middle-income subdivision (Manor Ridge) has also been completed. These subdivision projects are almost sold out. The newest project in Highlands Pointe, The Terraces was launched in October 2008. The Terraces is a mid-income development which targets young couples starting a family.
Forest Farms Estate, which is situated in the municipality of Angono, is a farm estate subdivision
project which is expected to have a total developed area of 39.2 hectares. Development work for this project is almost complete.
Timberland Heights Timberland Heights is a 677-hectare township project anchored by the Timberland Sport and Nature Club. It is located in the municipality of San Mateo, which is just across the Marikina river from Quezon City, and has been designed to provide residents with leisure facilities and resort amenities while being located near malls, hospitals and educational institutions located in Quezon City. In addition to the Timberland Sports and Nature Club, Timberland Heights currently includes:
Banyan Ridge, a middle-income subdivision which has a total developed area of approximately
6.4 hectares. Mandala II Farm Estates is a farm estate subdivision which has a total developed area of
approximately 39.7 hectares. Land development has been completed. The Ranch, a high-end subdivision which has a total developed area of approximately 5.7
hectares. Banyan Crest, a 14.8 hectare high-end subdivision. Land development for Banyan Crest has been
completed. Around 73 hectares has been earmarked for middle-income housing within Timberland Heights. The first phase covering 10 hectares will be launched within 2012. A condotel, located right across the Timberland Sports and Nature Club, will also be launched in 2012. It will cover approximately one hectare of land. Città di Mare In August 2010, FLI gave Cebu a preview of its most ambitious seaside development when it launched Città di Mare at the Grand Ballroom of Crimson Resort and Spa in Mactan, Cebu. In late 2011, FLI started the land development of the first two phases of Il corso, covering seven hectares. Phase 1, which is targeted for partial completion by the end of 2013, will have a gross leasable area (GLA) of approximately 22,506 sq. m. Phase 2, which is targeted for completion in 2014, will have a GLA of approximately 12,680 sq.m.

14
Inspired by the world’s best-loved coastal cities, Città di Mare, which is Italian for “City by the Sea”, spans 50.6 hectares at Cebu’s South Road Properties. It is a master-planned development composed of three different zones catering to a wide array of lifestyles and activities - Il Corso, the 10.6 hectare waterfront lifestyle strip, the 40-hectare residential clusters and The Piazza, nestled at the heart of the residential enclaves, puts lifestyle essentials such as a school, church, shops and restaurants within the neighborhood. Citta di Mare is envisioned to be a destination in itself, takes full advantage of the coastal ambience featuring seaside shopping, dining, beach and water sports and more, right by the water’s edge. Città di Mare has four resort-themed residential enclaves inspired by world-class resorts, with each 10-hectare development flaunting a distinct architectural character. With over 65% of the property allocated for wide, open areas and landscaped greens, Città di Mare provides the generous amenity of breathing space and a refreshing dose of nature throughout the site. Residences are spread out over the sprawling development, maximizing the abundant sunlight and allowing the invigorating sea air to circulate freely.
Amalfi Oasis features clusters of five-storey buildings with luxuriant gardens, resort-style
amenities and pedestrian-friendly environs, bask in fresh air, radiant sunshine and charming landscapes. In November 2010, groundbreaking rites for Amalfi Oasis were held, the first residential enclave at Città de Mare. The first building will be completed in 2012, while two more buildings are scheduled for completion in 2013.
San Remo Oasis, the second residential enclave in Città di Mare involves the development of 3.4
hectares of land with well-planned living spaces with numerous choice units to suit anyone’s lifestyle. Construction is ongoing on the first two buildings and are targeted for completion in 2013.
c. Leisure projects FLI’s leisure projects consist of its residential farm estate developments, private membership club and residential resort development. 1. Residential farm estates In 2003, FLI began marketing its residential farm estate projects which may serve as alternative primary homes near Metro Manila to customers, such as retirees and farming enthusiasts. Customers can purchase lots (with a minimum lot size of 750 square meters) on which they are allowed to build a residential unit (using up to 25.0% of the total lot area). The remaining lot area can be used for small-scale farm development, such as fish farming or vegetable farming. Residential farm estates are sold on a lot-only basis, with buyers being responsible for the construction of residential units on their lots. To help attract buyers, FLI personnel are available on site to provide buyers with technical advice on farming as well as to maintain demonstration farms. At present, FLI has three residential farm estates: • Nusa Dua Farm Estate (“Nusa Dua”) located in Cavite province just south of Metro Manila. The
amenities at the Nusa Dua development include a two-storey clubhouse and a 370 square meter swimming pool. 90% of the first two phases had been sold. Its third phase is now open for sale.

15
• Mandala Residential Farm Estate (“Mandala”) located in Rizal province as part of the FLI’s Timberland Heights township project. It offers hobby farmers generous lot cuts and Asian-inspired homes that complement the mountain lifestyle. Three Five phases have already been opened in response to the strong market demand.
• Forest Farms Residential Farm Estate (“Forest Farms”) located in Rizal province as part of
Company’s Havila township project. It is an exclusive mountain retreat and nature park, nestled between the hills of Antipolo and forested area of Angono. Sales are now on-going.
2. Private membership club FLI, through FAPI, has developed the Timberland Sports and Nature Club. This Club is expected to includes sports and recreation facilities, fine dining establishments and function rooms that can be used to host corporate and social events. The Company expects that sales of subdivision lots in the high-end subdivision components of Timberland Heights may be tied with the sale of shares in the Timberland Sports and Nature Club, with some lot buyers also acquiring membership shares as part of the purchase of their lots. The Timberland Sports and Nature Club was designed to be a world-class family country club in a mountain resort setting. The Club aims to become a social hub with 2,000 sq.m. of full-range of indoor sports, nature oriented amenities, spa, dining, banquet and room facilities with world class standard club management on an 8-hectare elevated and rolling terrain. It started commercial operations in October 2008. 3. Residential resort development Kembali Coast on Samal Island, Davao is a beachfront residential resort development. This 50-hectare Asian-Balinese inspired island getaway offers low-density exclusivity and comes with a 1.8 km beach line that offers unobstructed view of the sea. Three overnight facilities were completed in 2008 while land development for the first residential phase has been completed. To enable buyers and guest to enjoy the facilities at an early stage, a multi purpose hall, changing and shower areas, welcome huts and the guardhouse have been constructed. Kembali Horizons, three-storey residential buildings, are currently being offered. Lauena de Taal (“Lauena”) located in Talisay Batangas with a view of the Taal lake and a lakeside residential community, about ten minutes drive from the popular tourist destination of Tagaytay. now under construction with estimated completion in the third quarter of 2007. d. Medium Rise Buildings Medium Rise Buildings (MRB) projects are five-storey to ten-storey buildings clustered around a central amenity area. Marketed under the “Oasis” brand, FLI’s MRBs are intended to provide a quiet environment within the urban setting. The buildings occupy 30% to 35% of the land area, providing a lot of open spaces. Currently, FLI has the following ongoing MRB projects: One Oasis Ortigas – Comprised of 13 MRBs Located along Ortigas Extension in Pasig City. Bali Oasis – Comprised of 4 MRBs located along Marcos Highway, Pasig City. Bali Oasis 2 – Comprised of 4 MRBs also located along Marcos Highway, Pasig City.

16
Capri Oasis – Consist of 6 MRBs Located along Dr. Sixto Antonio Ave., in Pasig City Sorrento Oasis – Consist of 15 MRBs along C. Raymundo Ave., in Pasig City Maui Oasis – Comprised of 3 MRBs along Sta. Mesa, Manila One Oasis Davao – Comprised of 5 MRBs in Davao City One Oasis Cebu – Consist of 10 MRBs in Mabolo, Cebu City Amalfi Oasis – Consist of 9 MRBs in Citta di Mare, South Road Properties, Cebu City San Remo Oasis – Comprised of 13 MRBs in Citta di Mare, South Road Properties, Cebu City The Company is targeting to launch two new MRB projects in 2012. Girin Oasis, located in Cainta, Rizal and Pasig City, as well as its first MRB project in Quezon City. e. High Rise Building The Linear FLI started to develop in 2009 The Linear, is a master-planned residential and commercial hub in Makati City. Two-L-shaped towers, each 24 storeys high, comprise this dynamic condo community that perfectly caters to the needs of young urban professionals. The construction of Tower 1 is ongoing and is scheduled for completion in mid-2013, while Tower 2 is expected to be delivered in 2014. Studio City Studio City is a community composed of five-tower residential condominium complex within the Filinvest Corporate City to serve the demand for housing of the growing number of professionals working within FCC and in the nearby Madrigal Business Park. Since it is located within the Filinvest Corporate City, residents will enjoy proximity to Festival Supermall, Westgate Center, Northgate Cyberzone, Asian Hospital and Medical Center, and other commercial, educational and medical institutions. The development consists of 18 storeys per building with commercial units at the ground floor. All residential floors will have 25 studio units per floor. Site development works are ongoing and the first building is targeted for completion in 2014. The Levels Located at one of the highest points of Filinvest Corporate City at around 23 meters above sea level, The Levels is a one-block, four-tower residential condominium development that features laidback suburban living inside a fast-paced business district. The residential development is set in a tropical landscape, with its four towers uniquely designed with terracing levels, giving it a castle-effect look. high-rise sections will be set in lush greenery, providing residents with views of the gardens. The first building, “Anaheim” is expected to be completed in 2014. Vinia Residences Vinia is a 25-storey condominium development located along EDSA in Quezon City, right across TriNoma and just steps away from the MRT-North Avenue station. With its coveted location, it offers a world of ease and convenience to yuppies and families looking for quality homes, as well as budding entrepreneurs who want to start a home-based business at the heart of the city. Studio Zen Studio Zen is a 21-storey condominium development located along Taft Avenue in Metro Manila. Student-oriented amenities, Zen-inspired features, and functional building facilities makes it an ideal residence for students living independently and a great investment opportunity for entrepreneurs who want to take advantage of the ready rental market in the area.

17
f. Condotel Grand Cenia The Grand Cenia Hotel and Residences is a 25-story development located along Archbishop Reyes Avenue in Banilad, Cebu, on the 4,211 sq.m. property strategically located close to the Cebu Business Park. Grand Cenia features two products – “condotel” and residential condominium units. Starting November 2011, units were turned over to the condotel buyers in preparation for hotel operations. In January 2012, the hotel started operating as the Quest Hotel and Conference Center, a three-star hotel complete with business and conference facilities. The 25-storey structure has 432 condotel rooms and 119 residential condominium units. One and a half floors have been earmarked for BPO office space with gross leasable area of 3,227 sq.m. FLI is studying the incorporation of a new subsidiary that will provide management services to the clubs the Company has developed and is developing. Club management, operations and maintenance costs are covered by revenues from club operations (such as revenue from food and beverage sAnalysis of Real Estate Sales (In thousands) Years ended December 31 2 0 1 1 2 0 1 0 Category Amount % to total Amount % to total Residential Lots and House & Lot Packages Socialized 1,014,265 14.59% 966,823 17.10% Affordable 888,183 12.77% 522,726 9.25% Middle income 4,419,887 63.56% 3,687,300 65.23% High end & Others 376,285 5.41% 223,504 3.95% Industrial Lots 26,074 0.37% 93,975 1.66% Residential Farm Lots 213,352 3.07% 139,907 2.48% Leisure 15,425 0.22% 18,139 0.32% Total 6,953,469 100.00% 5,652,374 100.00% The table above shows a comparative breakdown of FLI’s journalized real estate sales into various product categories for the years ended December 31, 2011 and 2010. 1.6.2. Leasing Segment Starting 2007, FLI’s acquired investment properties, which are categorized as retail and office, started to generate rental revenues for a full year operations. Festival Supermall The Festival Supermall is a four-storey shopping complex located within FAI’s Filinvest Corporate City development near the juncture of three major road networks – the South Expressway, the old National

18
Highway and the Alabang-Zapote. In addition to having over 600 retail stores and outlets, the Festival Supermall also features amenities such as a ten-theater movie multiplex with digital surround sound systems, and two themed amusement centers. The mall also has exhibit, trade and music halls which are leased out to organizers of events such as trade fairs sponsored by the Philippine Department of Trade and Industry.Its current anchor tenants include stores operated by some of the Philippines’ largest retailers, such as the J.G. Summit group of companies (Robinsons Department Store and Handyman Do It Best), SM Prime Holdings, Inc. (SaveMore Supermarket and Ace Hardware) and the Rustan’s Group (Shopwise Supercenter). As of December 31, 2006, the Festival Supermall’s anchor tenants leased approximately 28.4% of the mall’s total leasable space. The Festival Supermall also has a group of tenants that are well-known international and domestic third-party retailers, restaurant chains and services companies, such as Bose, Levi’s, Bench, Giordano, The Body Shop, National Bookstore, McDonald’s, Jollibee and KFC. FLI leased from FAI the 10 hectares of land on which the mall and its adjoining structures (such as parking lots) are situated. The lease is for a term of 50 years from October 1, 2006, renewable for another 25 years, with FLI required to pay monthly rent equivalent to 10.0% of the monthly gross rental revenue from the mall. The Festival Supermall was designed to allow the construction of an additional wing to the current two-wing structure on two adjacent hectares of land available for development, which would increase the mall’s total floor area by up to 50,000 square meters. The lease between FLI and FAI allows FLI to construct additions or extensions to the current mall structure, which will revert to FAI upon termination of the lease. FLI will determine if or when construction for the third wing will be undertaken based on market conditions and its perception of the demand for additional retail space in the areas served by the mall. Day-to-day operations at the Festival Supermall are currently managed by Festival Supermall, Inc. (“FSI”), an affiliate of FLI, pursuant to a management contract that entitles FSI to a management fee of P200,000 per month. FLI also pays for the salaries and benefits of FSI’s officer and employees who are assigned to manage the Festival Supermall. Engineering, maintenance, security and janitorial services for the mall are outsourced to reputable third-party service providers on an annual contractual basis. These contracts can usually be terminated at any time, such as if the contractor fails to perform at an acceptable level. PBCom Tower The PBCom Tower, the tallest building in the Philippines, is a 52 floor, Grade A, PEZA-designated I.T. office building in Ayala Avenue, Makati City, Metro Manila. FLI owns part of the PBCom Tower thru Filinvest Asia Corporation. FLI earns 60% of revenues from the 36,000 sq.m. leasable space owned by Filinvest Asia Corp. in this building. Colliers International had been hired to provide day-to-day property management services for PBCom Tower. In addition, pursuant to a management agreement, FAI provides the following services: general management services, accounting services, operations, legal review and documentation, office rental services and recruitment and training services. Northgate Cyberzone Northgate Cyberzone is a PEZA registered BPO park within Filinvest Corporate City. FLI earns revenues from approximately 131,000 sq.m. leasable space with Convergys, APAC, Genpact, e-telecare Global Solutions, ICICI Bank Ltd., Flour Daniel and Infosys as major tenants, among others. Of the 10 hectares of land on which the Northgate Cyberzone is situated, approximately five hectares are available for future development. Two build-to-suit buildings (BTS) are being occupied for the backroom unit requirement of British bank HSBC Ltd. and Convergys, one of the biggest call centers. An IT School building is leased out to Informatics International College, which is a Singapore-headquartered information technology (“IT”) school, and YBM Philippines, which operates language schools in the

19
Philippines. Plaza A, six-storey building which was completed in June 2006, is substantially fully leased to GenPact Services LLC and eTelecare Global Solutions, Inc.. Plaza B and Plaza C, both four-storey buildings, were completed in 2001. Tenants for Plaza B include Deutsche Bank, Globe Innove, Global Access Inc. and NDE Digitech. All of Plaza C has been leased by APAC. There are three projects involving four buildings under development in Northgate Cyberzone. These are all expected to be completed in 2007. These include Plaza D, Building 5132, iHub I and iHub II. All of Plaza D has been leased to ICICI Bank Limited, India’s largest private sector bank, and Verizon. There are still seven hectares available for the construction of additional buildings within the Northgate Cyberzone. The table below shows a breakdown of FLI’s recorded gross leasing revenues for 2011 & 2010. Leasing Revenues (Amounts in thousands) Years ended December 31 2 0 1 1 2 0 1 0 Amount % to total Amount % to total Festival Supermall 809,862 52.99% 776,956 55.05% Northgate Cyberzone 542,440 35.49% 455,888 32.30% PB Com Tower 163,573 10.70% 136,721 9.69% Others 12,416 0.81% 41,705 2.96% Total 1,528,290 100.00% 1,411,269 100.00%
1.7. Marketing and Sales
1.7.1 Real Estate Segment The Company develops customer awareness through marketing and promotion efforts and referrals from satisfied customers. The Company has a real estate marketing team and a network of sales offices located in the Philippines and tie-ups with independent brokers in Europe, Hongkong, the Middle East and Japan. FLI’s marketing personnel, together with in-house sales agents and accredited agents, gather demographic and market information to help assess the feasibility of new developments and to assist in future marketing efforts for such developments. The Company conducts advertising and promotional campaigns principally through print and broadcast media, including billboards, fliers, and brochures designed specifically for the target market. Advertising and promotional campaigns are conceptualized and conducted by FLI’s marketing personnel and by third-party advertising companies. These campaigns are complemented with additional advertising efforts, including booths at shopping centers, such as Festival Supermall, and other high traffic areas, to promote open houses and other events. The Company also believes that the OFW population, as well as expatriate Filipinos, constitute a significant portion of the demand for affordable and middle-income housing either directly or indirectly by remitting funds to family members in the Philippines to purchase property. To this end, the Company has appointed and accredited independent brokers in countries and regions with large concentrations of OFWs and expatriate Filipinos, such as Italy, Japan, the United Kingdom and the Middle East. These brokers act as the Company’s marketing and promotion agents in these territories to promote the Company and its products. The Company also sponsors road shows to promote its projects, including

20
road shows in Europe and the United States of America, targeting the OFW and Filipino expatriate markets. FLI also markets its properties on the Internet. FLI caters to a wide customer base spanning the different income segments of the real estate market - from socialized, to affordable, to middle and to high-end. FLI also serves the industrial and leisure markets through its entrepreneurial communities, township projects, farm estates and private membership clubs. It does not have a single or a few customers accounting for 20% of its sales. FLI develops customer awareness through its marketing and promotion efforts and referrals from satisfied customers. FLI conducts advertising and promotional campaigns principally through print media, including billboards, fliers, and brochures designed specifically for the target market. Advertising and promotional campaigns are conceptualized and conducted by FLI’s marketing personnel and by third-party advertising companies. These campaigns are complemented with additional advertising efforts, including booths at shopping centers, such as the Festival Supermall, and other high traffic areas, to promote open houses and other events. FLI also relies on positive word-of-mouth from satisfied customers. FLI has appointed and accredited independent brokers in countries and regions such as North America, Italy, Japan, the United Kingdom and the Middle East. These areas have large concentrations of OFWs and expatriate Filipinos who constitute a significant portion of the demand for its affordable and middle-income housing and land development projects. The said brokers act as FLI’s marketing and promotion agents in these territories.Sales for FLI’s housing and land development projects are made through both in-house sales agents and independent brokers. Both FLI’s in-house sales agents and independent brokers are compensated through commissions on sales. In-house sales agents also receive a monthly allowance and are provided administrative support by FLI, including office space and expense allowances. In addition to in-house sales agents and independent brokers, FLI also employs representatives who staff its sales offices and provide customers with information about FLI’s products, including financing and technical development characteristics. FLI also assigns each project a sales and operations coordinator who will provide customers with assistance from the moment they make their sales reservation, during the process of obtaining financing, and through the steps of establishing title on their new home. FLI also has personnel who can advise customers on financing options, collecting necessary documentation and applying for a loan. FLI also helps design down payment plans for its low-cost housing customers that are tailored to each customer’s economic situation. Further, once a house is sold and delivered, FLI has customer service personnel who are available to respond to technical questions or problems that may occur after delivery of the property. 1.7.2 Leasing Segment Various professional, multinational commercial real estate leasing agents (including, but not limited to Jones Lang LaSalle, CB Richard Ellis and Colliers) are accredited to find tenants for its PBCom Tower and Northgate Cyberzone office space. These brokers work on a non-exclusive basis and earn commissions based on the term of the lease. FLI also maintains, through its subsidiaries, an in house sales team to market its office & commercial spaces. 1.8. Customer Financing for Real Estate Projects The ability of customers to obtain financing for purchases of subdivision lots or housing units is a critical element in the success of FLI’s housing and land development business. Customer financing is

21
particularly important in relation to sales of FLI’s socialized housing projects, where most prospective buyers require financing for up to 100% of the purchase price. FLI therefore assists qualified homebuyers in obtaining mortgage financing from government-sponsored mortgage lenders, particularly for its socialized housing projects, and from commercial banks. FLI also provides a significant amount of in-house financing to qualified buyers. In-house financing FLI offers in-house financing to buyers who chose not to avail of Government or bank financing. FLI typically finances 80.0% of the total purchase price, which is secured primarily by a first mortgage over the property being sold. The loans are then repaid through equal monthly installments over periods ranging from five to 100 years. The interest rates charged by FLI for in-house financing typically range from 15.011.5% per annum to 19.0% per annum, depending on the term of the loan. Pag-IBIG Fund
A substantial portionumber of buyers of the Company’s socialized housing units finance their purchasers through the Home Development Mutual Fund, or Pag-IBIG Fund. To provide a liquidity mechanism to private developers, the Pag-IBIG Fund has instituted a take-out mechanism for conditional sales, installment contract receivables and mortgages and repurchases of receivables from housing loans of its members.
Mortgage loans Mortgage loans from commercial banks are usually available to individuals who meet the credit risk criteria set by each bank and who are able to comply with each bank’s documentary requirements. In addition to taking security over the property, a bank may also seek repayment guarantees from the Home Guaranty Corporation (“HGC”). To assist prospective buyers obtain mortgage financing from commercial banks, FLI also has arrangements with several banks to assist qualified customers to obtain financing for housing unit purchases. Deferred cash purchases In recent years, in addition to the aforementioned financing arrangements, FLI has offered so-called “deferred cash” purchases, particularly for its high-end and leisure developments. Under this arrangement, the entire purchase price is amortized in equal installments over a fixed period, which is typically 24 months. Title to the property passes to the buyer only when the contract price is paid in full or when the buyer executes a real estate mortgage in favor of the Company which can be annotated on the title to the property. 1.9. Real Estate Development FLI’s real estate development activities principally include the purchase of undeveloped land or entering into joint venture agreements covering undeveloped land, the development of such land into residential subdivisions or other types of development projects, the sale of lots, the construction and sale of housing units and the provision of financing for some sales.

22
The development and construction work is contracted out to a number of qualified independent contractors on the basis of either competitive bidding or the experience FLI has had with a contractor on prior project. FLI weighs each contractor’s experience, financial capability, resources and track record of adhering to quality, cost and time of completion commitments. FLI maintains relationships with over 100 independent contractors and deals with them on an arm’s length basis. FLI does not enter into long-term arrangements with contractors. Construction contracts typically cover the provision of contractor’s services in relation to a particular project or phase of a project. FLI also provides, in certain cases, financial guarantees of payment to FLI-specified suppliers for purchases of construction materials. Progress payments are made to contractors during the course of a project development upon the accomplishment of pre-determined project performance milestones. Generally, FLI retains 10% of each progress payment in the form of a guarantee bond or cash retention for up to one year from the date the contracted work is completed and accepted by FLI to meet contingency costs. FLI is not and does not expect to be dependent upon one or a limited number of suppliers or contractors. Its agreements with its contractors are in the nature of supply of labor and materials for the development and/or construction of its various real estate projects. During 2011, the Company launched a total of 33 new projects and phases with an estimated sales value of P 12.1 billion. This brought to 111 the number of ongoing projects FLI has as of the end of 2011. The Company’s operational highlights in property development in 2006 were the launch of 14 new projects. New projects launched include: three affordable projects - Aldea Real in Calamba, Laguna, Palmridge and Summerbreeze Townhomes in Sto. Tomas, Batangas; two middle income projects in Quezon City; three regional middle-income projects - Villa Mercedita II in Davao City,a project in Laguna and one in Zamboanga City; two high-end projects - St.Isabel in Mission Hills, Antipolo and The Ranch in Timberland Heights in San Mateo, Rizal; two Asenso Villages in Calamba, Laguna and Tanza, Cavite.1.10. Competition 1.10.1. Real Estate Segment Real estate development and selling is very competitive. The Company believes it is strongly positioned in the affordable housing income to middle income residential subdivision market and in the farm estates. Success in these market segments depends on acquiring well-located land at attractive prices often in anticipation of the direction of urban growth. The Company believes that its name and reputation it has built in the Philippine property market contributes to its competitive edge over the other market players. On the basis of publicly available information and its own market knowledge, FLI’s management believes that it is among the leading housing and land project developers in the Philippines, particularly in the socialized to middle-income housing sectors. FLI’s management also believes that FLI is able to offer competitive commissions and incentives for brokers, and that FLI is able to compete on the basis of the pricing of its products, which encompasses products for different market sectors, as well as its brand name and its track record of successful completed quality projects. The Company directly competes with other major real estate companies positioned either as a full range developer or with subsidiary companies focused on a specific market segment and geographic coverage. Its direct competitors include Ayala Land Inc., Vista Land, Robinsons Land, DMCI and Landco.

23
The Company faces significant competition in the Philippine property development market. In particular, the Company competes with other developers in locating and acquiring, or entering into joint venture arrangements to develop, parcels of land of suitable size in locations and at attractive prices. This is particularly true for land located in Metro Manila and its surrounding areas, as well as in urbanized areas throughout the Philippines.
The Company’s continued growth also depends in large part on its ability either to acquire quality land at attractive prices or to enter into joint venture agreements with land-owning partners under terms that can yield reasonable returns. Based on the Company’s current development plans, the Company believes that it has sufficient land reserves for property developments for the next several years. If the Philippine economy continues to grow and if demand for residential properties remains relatively strong, the Company expects that competition among developers for land reserves that are suitable for property development (whether through acquisitions or joint venture agreements) will intensify and that land acquisition costs, and its cost of sales, will increase as a result. 1.10.2. Leasing Segment With regard to the Company’s recently acquired assets dedicated to office space leasing and shopping mall operations, the Company competes with property companies such as Ayala Land Inc, Robinsons Land Corp. and SM Prime Holdings in retail space leasing. In office space leasing, particularly to call centers and other BPO operators, the Company competes with companies such as Robinsons Land, Inc., Ayala Land, Inc., Eton Corporation and Megaworld Corporation. 1.11. Related-Party Transactions The Company is a member of the Filinvest Group. The Company and its subsidiaries, in their ordinary course of business, engage in transactions with FDC and its subsidiaries. The Company’s policy with respect to related-party transactions is to ensure that these transactions are entered into on terms comparable to those available from unrelated third parties. The Company’s major related-party transactions include: FDC has guaranteed the Company’s obligations under a P2.25 billion credit facility extended by the
International Finance Corporation. As of December 31, 2011, the Company had fully availed of P1.125 billion of this facility with principal balance outstanding amounting to P 1,575.00 million.
Interest and non-interest bearing cash advances made to and received from FDC, FAI, FAPI, CPI and other affiliates in order to meet liquidity and working capital requirements. Interest rates on these cash advances are determined on an arm’s-length basis and are based on market rates.
Sharing jointly with other members of the Filinvest Group, expenses relating to common facilities and services used by each member of the Filinvest Group, such as payroll services, supplies and utilities.
A 50-year lease agreement with FAI for the 10-hectare property on which the Festival Supermall and its related structures are located.
FAC and CPI have each entered into contracts with FAI pursuant to which FAI provides accounting, business development and other management services to FAC and CPI.
The Company has a contract with FSI, which provides services relating to the operation of the Festival Supermall. Under the terms of the contract, FSI is entitled to receive monthly management fees.
Savings and current accounts and time deposits with East West Bank (“EWB”), a member of the Filinvest Group.

24
EWB also leases from an FLI joint venture, Filinvest Asia Corporation (“FAC”), a total of approximately 2,800 square meters of office space in PBCom Tower in Makati City.
A development agreement with GCK Realty Corp. (“GCK”), in which members of the Gotianun family has shareholdings, for the development by FLI of Grand Cenia Hotel and Residences building on certain parcels of land owned by GCK in Bgry. Camputhaw, Cebu City.
A development agreement with Fernandez Hermanos, Inc., which is owned and managed by an officer and stockholder, Mr. Luis T. Fernandez, and his siblings, for the subdivision development of parcels of land owned by the latter company in Brgy. Matanos, Kaputian, Samal Island in the province of Davao.
A development agreement with FAI for the development of a condominium project known as “The Levels” on a parcel of land owned by FAI located in Filinvest Corporate City.
1.12. Intellectual Property
The Company has applications pending for the registration of intellectual property rights for the “Filinvest” name, as well as for names of its properties and for various trademarks associated with its use of the “Filinvest” and “FLI” brands. The Company has pending applications with the Intellectual Property Office for the following trademarks:
• Artisans’ Business Park; • Artisans’ Village; • Cottage Industry Center; • Cottage Industry Community; • Cottage Industry Village; • Craftsmen’s Village; • Entrepinoy Village; • Entrepreneurs’ Village; • Micro Business Community; • MSME Business Center; • MSME Business Community; and • MSME Business Park.
Although these registrations are not complete, the Company believes that it has sufficient protection over the “Filinvest” name from long-term use and widespread recognition of the name in the market.
The Company has also registered “Filinvest Land, Inc.” as a business name with the Department of Trade and Industry. A registration of a business name shall be effective for five years from the initial date of registration and must be renewed within the first three months following the expiration of the five-year period from the date of original registration. 1.13. Government and Environmental Regulations The real estate business in the Philippines is subject to significant Government regulations over, among other things, land acquisition, development planning and design, construction and mortgage financing and refinancing. After the project plan for subdivision is prepared, FLI applies for a development permit with the local government. If the land is designated agricultural land, FLI applies with the Department of Agrarian Reform (DAR) for a Certificate of Conversion or Exemption, as may be proper. A substantial majority of FLI’s existing landbank is subject to the DAR conversion process.

25
Approval of development plans is conditioned on, among other things, completion of the acquisition of the project site and the developer’s financial, technical and administrative capabilities. Approvals must be obtained at both the national and local levels. Evidently, the Company’s results of operations are expected to continue to be affected by the nature and extent of the regulation of its business, including the relative time and cost involved in procuring approvals for each new project, which can vary from project to project. The Company is also subject to the application of the Maceda Law, which gives purchasers of real property purchased on an installment basis certain rights regarding cancellations of sales and obtaining refunds from developers. FLI believes that it has complied with all applicable Philippine environmental laws and regulations. Compliance with such laws, in FLI’s opinion, is not expected to have a material effect on FLI’s capital expenditures, earning or competitive position. 1.14. Employees and Labor As of December 31, 2011, FLI had a total of 814 employees, including 173 permanent full-time managerial employees, 634 support employees and 7 consultants. Management believes that FLI’s current relationship with its employees is generally good and neither FLI nor any of its subsidiaries have experienced a work stoppage or any labor related disturbance as a result of labor disagreements. None of FLI’s employees or any of its subsidiaries belongs to a union. FLI currently does not have an employee stock option plan. FLI does not anticipate any substantial increase in the number of its employees in 2012. FLI provides managers, supervisors and general staff the opportunity to participate in both in-house and external training and development programs which are designed to help increase efficiency and to prepare employees for future assignments. FLI has also provided a mechanism through which managers and staff are given feedback on their job performance, which FLI believes will help to ensure continuous development of its employees. FLI also offers employees benefits and salary packages that it believes are in line with industry standards in the Philippines and which are designed to help it compete in the marketplace for quality employees. 1.15. Major Risk Factors There are major risk factors that may affect the Company. Property values in the Philippines are influenced by the general supply and demand of real estate as well as political and economic developments in the country. In the event new supply exceeds demand as a result of economic uncertainty or slower growth, political instability, increased interest rates may affect the financial condition and results of operations of FLI. Demand for, and prevailing prices of, developed land and house and lot units are directly related to the strength of the Philippine economy (including overall growth levels and interest rates), the overall levels of business activity in the Philippines and the amount of remittances received from overseas Filipino workers (“OFWs”). Demand for the Company’s housing and land developments is also affected by social trends and changing spending patterns in the Philippines, which in turn are influenced by economic,

26
political and security conditions in the Philippines. The Philippine residential housing industry is cyclical and is sensitive to changes in general economic conditions in the Philippines such as levels of employment, consumer confidence and income, availability of financing for property acquisitions, construction and mortgages, interest rate levels, inflation and demand for housing. The demand for the Company’s projects from OFWs and expatriate Filipinos may decrease as a result of the following possibilities, i.e. reduction in the number of OFWs, the amount of their remittances and the purchasing power of expatriate Filipinos. Factors such as economic performance of the countries and regions where OFWs are deployed, changes in Government regulations such as taxation on OFWs’ income, and, imposition of restrictions by the Government/other countries on the deployment of OFWs may also affect the demand for housing requirements. There are risks that some projects may not attract sufficient demand from prospective buyers thereby affecting anticipated sales. Stringent government requirements for approvals and permits of new projects may take substantial amount of time and resources. In addition, the time and the costs involved in completing the development and construction of residential projects can be adversely affected by many factors, including unstable prices and supply of materials and equipment and labor, adverse weather conditions, peso depreciation, natural disasters, labor disputes with contractors and subcontractors, accidents, changes in laws or in Government priorities and other unforeseen problems or circumstances. Further, the failure by the Company to substantially complete construction of a project to its planned specifications or schedule may result in contractual liabilities to purchasers and lower returns. The Company’s cost of sales is affected by volatility in the price of construction materials such as lumber, steel and cement. While the Company, as a matter of policy, attempts to fix the cost of materials component in its construction contracts, in cases where demand for steel, lumber and cement are high or when there are shortages in supply, the contractors the Company hires for construction or development work may be compelled to raise their contract prices. As a result, rising costs for any construction materials will impact the Company’s construction costs, and the price for its products. Any increase in prices resulting from higher construction costs could adversely affect demand for the Company’s products and the relative affordability of such products as compared to competitors’ products. This could reduce the Company’s real estate sales. The Company is also exposed to risks associated with the ownership and operation of its recently acquired investment properties. Financial performance of the Company’s leasing segment, which consist of interests in leasable office space in PBCom Tower and the Northgate Cyberzone, and in retail commercial space in Festival Supermall, could be affected by a number of factors, including:
1. the national and international economic climate; 2. changes in the demand for call center and other BPO operations in the Philippines and around the
world; 3. trends in the Philippine retail industry, insofar as the Festival Supermall is concerned; 4. changes in laws and governmental regulations in relation to real estate, including those governing
usage, zoning, environment, taxes and government charges; 5. the inability to collect rent due to bankruptcy of tenants or otherwise; 6. competition for tenants; 7. changes in market rental rates; 8. the need to periodically renovate, repair and re-let space and the costs thereof; 9. the quality and strategy of management; and, 10. the Company’s ability to provide adequate maintenance and insurance.

27
2.1. Land Bank Since its incorporation, the Company has invested in properties situated in what the Company believes are prime locations across the Philippines for existing and future housing and land development projects. It is important for the Company to have access to a steady supply of land for future projects. In addition to directly acquiring land for future projects, the Company has also adopted a strategy of entering into joint venture arrangements with landowners for the development of raw land into future project sites for housing and land development projects. This allows FLI to reduce its capital expenditures for land and substantially reduces the financial holding costs resulting from owning land for development. Under the joint venture agreements, the joint venture partner contributes the land free from any lien, encumbrance, tenants or informal settlers and the Company undertakes the development and marketing of the products. The joint venture partner is allocated either the developed lots or the proceeds from the sales of the units based on pre-agreed distribution ratio. Potential land acquisitions and participation in joint venture projects are evaluated against a number of criteria, including the attractiveness of the acquisition price relative to the market, the suitability or the technical feasibility of the planned development. The Company identifies land acquisitions and joint venture opportunities through active search and referrals.
On February 03, 2009 FLI signed an agreement with the Cebu City government to develop 50.6 hectares of the 300-hectare reclaimed property in Cebu. The agreement is divided into two contractual arrangements. One is the purchase of 10.6 hectares valued at around P 1.6 billion. The second component entails the development under a joint venture arrangement with the Cebu City government of the remaining 40 hectares to host residential condominiums and retirement villages. As of December 31, 2011, the Company had a land bank of approximately 2,2882,305 hectares of raw land for the development of its various projects, including approximately 397 hectares of land under joint venture agreements, which the Company’s management believes is sufficient to sustain at least fiveseveral years of development and sales. Details of the Company’s raw land inventory as of December 31, 2011 are set out in the table below:
Company Under Joint Total Area % to Location Owned Venture (In Hectares) Total
Luzon NCR 6.1 21.7 27.8 1.2% Rizal 745.6 84.8 830.4 36.3% Bulacan 221.9 0.0 221.9 9.7% Cavite 364.3 83.7 448.0 19.6% Laguna 211.7 0.0 211.7 9.3% Batangas 141.8 43.7 185.5 8.1% Pampanga 0.0 58.3 58.3 2.5% Palawan 11.7 11.7 0.5% Sub-total 1,691.4 303.9 1,995.3 87.2%
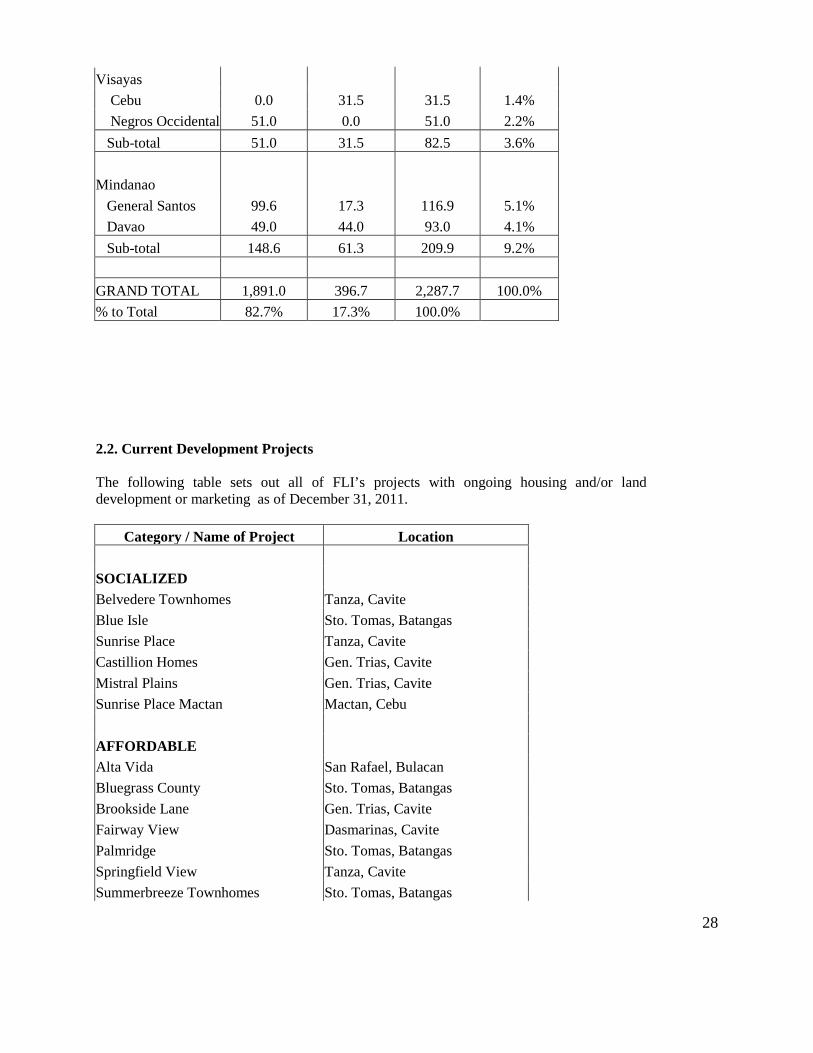
28
Visayas Cebu 0.0 31.5 31.5 1.4% Negros Occidental 51.0 0.0 51.0 2.2% Sub-total 51.0 31.5 82.5 3.6% Mindanao General Santos 99.6 17.3 116.9 5.1% Davao 49.0 44.0 93.0 4.1% Sub-total 148.6 61.3 209.9 9.2% GRAND TOTAL 1,891.0 396.7 2,287.7 100.0% % to Total 82.7% 17.3% 100.0% 2.2. Current Development Projects The following table sets out all of FLI’s projects with ongoing housing and/or land development or marketing as of December 31, 2011.
Category / Name of Project Location SOCIALIZED Belvedere Townhomes Tanza, Cavite Blue Isle Sto. Tomas, Batangas Sunrise Place Tanza, Cavite Castillion Homes Gen. Trias, Cavite Mistral Plains Gen. Trias, Cavite Sunrise Place Mactan Mactan, Cebu AFFORDABLE Alta Vida San Rafael, Bulacan Bluegrass County Sto. Tomas, Batangas Brookside Lane Gen. Trias, Cavite Fairway View Dasmarinas, Cavite Palmridge Sto. Tomas, Batangas Springfield View Tanza, Cavite Summerbreeze Townhomes Sto. Tomas, Batangas

29
Westwood Place Tanza, Cavite Woodville Gen. Trias, Cavite Aldea Real Calamba, Laguna Costas Villas (Ocean Cove 2) Davao City Primrose Hills Angono, Rizal The Glens at Park Spring San Pedro, Laguna Sommerset Lane Tarlac City Claremont Village Mabalacat, Pampanga Westwood Mansions Tanza, Cavite Tierra Vista San Rafael, Bulacan Aldea del Sol Mactan, Cebu Raintree Prime Residences Dasmarinas, Cavite La Brisa Townhomes Calamba, Laguna Alta Vida Prime San Rafael, Bulacan Amare Homes Tanauan, Batangas Anila Park Taytay, Rizal Austine Homes Pampanga The Residences @ Castillon Homes Tanza, Cavite Valle Dulce Tanza, Cavite MIDDLE-INCOME Corona Del Mar Pooc, Talisay, Cebu City Filinvest Homes- Tagum Tagum City, Davao NorthviewVillas Quezon City Ocean Cove Davao City Orange Grove Matina, Pangi, Davao City Spring Country Batasan Hills, Quezon City Spring Heights Batasan Hills, Quezon City Southpeak San Pedro, Laguna The Pines San Pedro, Laguna Villa San Ignacio Zamboanga City Highlands Pointe Taytay, Rizal Manor Ridge at Highlands Taytay, Rizal Ashton Fields Calamba, Laguna Montebello Calamba, Laguna Hampton Orchards Bacolor, Pampanga The Enclave at Filinvest Heights Quezon City Escala (La Constanera) Talisay, Cebu West Palms Puerto Princesa, Palawan Filinvest Homes - Butuan Butuan, Agusan Del Norte

30
La Mirada of the South Binan, Laguna Tamara Lane (formerly Imari) Caloocan City Viridian at Southpeak San Pedro, Laguna Nusa Dua (Residential) Tanza, Cavite The Tropics Cainta, Rizal Princeton Heights Molino, Cavite One Oasis - Ortigas Pasig, Metro Manila One Oasis - Davao Davao City Bali Oasis 1 Pasig, Metro Manila One Oasis Cebu Mabolo, Cebu City Maui Oasis Sta. Mesa, Manila Capri Oasis Pasig, Metro Manila Sorrento Oasis Pasig, Metro Manila Amalfi Oasis South Road Properties, Cebu San Remo Oasis South Road Properties, Cebu The Linear Makati City Studio City Filinvest Corporate City, Alabang The Levels Filinvest Corporate City, Alabang Somerset Lane, Ph 2 Tarlac Asiana Oasis Paranaque, Metro Manila Bali Oasis 2 Pasig City, Metro Manila Studio Zen Pasay City, Metro Manila Vinia Residences & Versaflats Edsa, Quezon City HIGH-END Brentville International Mamplasan, Binan, Laguna Prominence 2 Mamplasan, Binan, Laguna Village Front Binan, Laguna Mission Hills - Sta. Catalina Antipolo, Rizal Mission Hills - Sta. Isabel Antipolo, Rizal Mission Hills - Sta Sophia Antipolo, Rizal Banyan Ridge San Mateo, Rizal The Ranch San Mateo, Rizal The Arborage at Brentville Int'l Mamplasan, Binan, Laguna Banyan Crest San Mateo, Rizal Arista Talisay, Batangas Orilla Talisay, Batangas Bahia Talisay, Batangas Kembali Arista Samal Island, Davao

31
LEISURE - FARM ESTATES Forest Farms Angono, Rizal Mandala Residential Farm San Mateo, Rizal Nusa Dua Tanza, Cavite LEISURE - PRIVATE MEMBERSHIP CLUB Timberland Sports and Nature Club San Mateo, Rizal LEISURE - RESIDENTIAL RESORT DEVELOPMENT Kembali Coast Samal Island, Davao Laeuna De Taal Talisay, Batangas Entrepreneurial - Micro Small & Medium Enterprise Village Asenso Village - Calamba Calamba, Laguna INDUSTRIAL Filinvest Technology Park Calamba, Laguna CONDOTEL Grand Cenia Hotel & Residences Cebu City On-going developments of the abovementioned projects are expected to require additional capital but FLI believes that it will have sufficient financial resources for these anticipated requirements. 2.3. Investment Properties FLI’s recent acquisition of major assets and equity interests in September 2006 involve three strategic investment properties, namely: Festival Supermall, PBCom Tower and Northgate Cyberzone. Please refer to Section 1.6.2 for a detailed discussion of these properties. 2.4. Property and Equipment FLI is renting office spaces located at San Juan City, Metro Manila with an aggregate floor area of 4,369 square meters for its head office. The term of the lease is 5 years, subject to renewal upon mutual agreements between FLI and the lessor. FLI is also renting spaces for its sales offices in Quezon City, Rizal, Pampanga, Tarlac, Puerto Princesa City, Cebu City, Davao City, Butuan, Tagum and Zamboanga City. The terms of the leases are usually for one year, and thereafter, the terms of the lease shall be on a month-to-month basis, or upon the option of both parties, a new contract is drawn. Total rental expense

32
in 2011 amounted to P 47.11 million. The Company does not intend to acquire properties for the next 12 months except as needed in the ordinary course of business. Item 3. LEGAL PROCEEDINGS
FLI is subject to lawsuits and legal actions in the ordinary course of its real estate development and other allied activities. However, FLI does not believe that the lawsuits or legal actions to which it is a party will have a significant impact on its financial position or result of operations.
Following are the cases involving certain properties of FLI that may have impact on its financial position, but which it believes will be eventually resolved in its favor:
a. FLI vs. Abdul Backy, et al., G.R. No. 174715, Supreme Court This is a civil action for the declaration of nullity of deeds of conditional and absolute sales of certain real properties located in Tambler, General Santos City executed between FLI and the plaintiffs' patriarch, Hadji Gulam Ngilay. The Regional Trial Court (“RTC”) of Las Piñas City (Br. 253) decided the case in favor of FLI and upheld the sale of properties. On appeal, the Court of Appeals rendered a decision partly favorable to FLI but nullified the sale of some properties involved. FLI’s petition for review on certiorari to question that portion of the decision that is unfavorable to FLI, is still pending with the Supreme Court.
b. Emelita Alvarez, et al. vs. FDC, DARAB Case No. IV-RI-010-95
Adjudication Board, Department of Agrarian Reform On or about March 15, 1995 certain persons claiming to be beneficiaries under the Comprehensive Agrarian Reform Program (CARP) of the National Government filed an action for annulment/cancellation of sale and transfer of titles, maintenance of peaceful possession, enforcement of rights under CARP plus damages before the Regional Agrarian Reform Adjudicator, Adjudication Board, Department of Agrarian Reform. The property involved, located in San Mateo, Rizal, was purchased by FDC from the Estate of Alfonso Doronilla. A motion to dismiss is still pending resolution.
c. Republic of the Philippines vs. Rolando Pascual, et al. Civil Case No. 7059, Regional Trial Court The National Government through the Office of the Solicitor General filed suit against Rolando Pascual, Rogelio Pascual and FLI for cancellation of title and reversion in favor of the Government of properties subject of a joint venture agreement between the said individuals and FLI. The Government claims that the subject properties covering about 73.33 hectares are not alienable and disposable being part of the forestlands. The case was dismissed by the RTC of General Santos City (Br. 36) on November 16, 2007 for lack of merit. The Office of the Solicitor General has appealed the dismissal to the Court of Appeals, where it is still pending.
d. FLI vs. Eduardo Adia, et al G.R. 192929 Supreme Court
Various CLOA holders based in Brgy. Hugo Perez, Trece Martirez City filed a complaint with the RTC of Trece Martirez against FLI for recovery of possession with damages, claiming that in 1995 they

33
surrendered possession of their lands to FLI so that the same can be developed pursuant to a joint venture arrangement allegedly entered into with FLI. They now seek to recover possession of said lands pending the development thereof by FLI. The RTC rendered a decision ordering FLI to vacate the subject property. FLI appealed the decision to the Court of Appeals, which affirmed the RTC decision. FLI filed a petition for review on certiorari before the Supreme Court. On 10 January 2011, the Supreme Court granted FLI’s motion to admit a supplemental petition and required respondent to comment on the supplemental petition within 10 days from notice.
e. Antonio E. Cenon and Filinvest Land Inc. vs. San Mateo Landfill, Mayor Jose Rafael Diaz
Brgy. Pintong Bukawe, Director Julian Amador and the Secretary, Department of Environment and Natural Resources Civil Case No. 2273-09 On February 09, 2009, FLI filed an action for injunction and damages against the respondents to stop and enjoin the construction of a 19-hectare landfill in a barangay in close proximity to Timberland Heights in San Mateo, Rizal. FLI sought preliminary and permanent injunctive reliefs and damages and is seeking the complete and permanent closure of the dumpsite. Trial for this case is ongoing. FLI is not aware of any other information as to any other legal proceedings known to be contemplated by government authorities or any other entity. Item 4. SUBMISSION OF MATTERS TO A VOTE OF SECURITY HOLDERS There was no matter which was submitted to a vote of security holders in 2011. Part II – OPERATIONAL AND FINANCIAL INFORMATION
Item 5. MARKET FOR ISSUER’S COMMON EQUITY & RELATED STOCKHOLDER MATTERS
The Company’s common shares were listed on the PSE in 1993. The following table shows, for the periods indicated, the high, low and period end closing prices of the shares as reported in the PSE.
Period Share Prices 2011 High Low Close
4th Quarter 1.19 0.98 0.99 3rd Quarter 1.33 1.02 1.10 2nd Quarter 1.35 1.14 1.17 1st Quarter 1.41 1.01 1.15
2010 High Low Close
4th Quarter 1.49 1.26 1.31

34
3rd Quarter 1.50 0.91 1.32 2nd Quarter 1.04 0.88 0.96 1st Quarter 0.95 0.74 0.89
The number of common shareholders of record as of December 31, 2011 was 6,033. Common shares outstanding as of December 31, 2011 were 24,249,759,506 shares. Top 20 Common Stockholders as of December 31, 2011: Name No. of Shares % to total
1 Filinvest Development Corp. 12,969,648,868 53.48% 2 PCD Nominee Corp. (Non-Filipino) 6,114,525,921 25.21% 3 PCD Nominee Corp. (Filipino) 4,831,724,132 19.92% 4 Rivercrest Realty Corp. 61,111,250 0.25% 5 Michael Gotianun 11,235,913 0.05% 6 Lucio W. Yan &/or Clara Y. Yan 10,687,500 0.04% 7 Ana Go & / or Go Kim Pa 8,250,000 0.03% 8 Joseph M. Yap &/or Josephine G. Yap 7,694,843 0.03% 9 R. Magdalena Bosch 4,877,928 0.02%
10 Luis Rodrigo Fernandez 4,064,940 0.02% 11 Luis L. Fenandez or Veronica P. Fernandez ITF Carlo 4,064,940 0.02% 12 Enrique P. Fernandez 4,064,940 0.02% 13 Luis L. Fernandez 4,064,940 0.02% 14 Veronica P. Fernandez 4,064,940 0.02% 15 Luis L. Fenandez or Veronica P. Fernandez ITF Marco 4,064,940 0.02% 16 Lilian So Lim 3,469,832 0.01% 17 Emily Benedicto 3,468,750 0.01% 18 Alberto Mendoza &/or Jeanie C. Mendoza 3,349,871 0.01%

35
19 Filinvest Capital Inc. 2,890,625 0.01% 20 Lucio W. Yan 2,890,625 0.01%
The Company’s entire preferred shares of 8 billion shares were all issued to FDC. No securities were sold within the past two years which were not registered under the Revised Securities Act &/or Securities Regulation Code. Dividends On January 8, 2007, the Board of Directors approved an annual cash dividend payments ratio for the Company’s issued shares of twenty percent (20%) of its consolidated net income for the preceding year, subject to compliance with applicable laws and regulations and the absence of circumstances which may restrict the payment of such dividends, including, but not limited to, when Company undertakes major projects and developments requiring substantial cash expenditures, or when the Company is restricted from paying cash dividends by its loan covenants, if any. The Board of Directors may at any time modify such dividend payout ratio depending on the results of operations, future projects and plans of the Company. On April 15, 2011 the Board of Directors approved the declaration and payment from unappropriated retained earnings of cash dividend of P 0.039 per share or a total of P 950.59 million for all shareholders of record as of May 13, 2011. On April 30, 2010, the Board of Directors approved the declaration and payment from unappropriated retained earnings of cash dividend of P 0.033 per share or a total of P 800.24 for all shareholders of record as of May 18, 2010. On April 29, 2009, the Board of Directors approved the declaration and payment from unappropriated retained earnings of cash dividend of P 0.033 per share as regular and special cash dividends of P 0.015 and P 0.018 respectively or a total of P 800.24 for all shareholders of record as of May 14, 2009. Item 6. MANAGEMENT DISCUSSION AND ANALYSIS AND PLAN OF OPERATION Plan of Operations for 2012 FLI’s business strategy has placed emphasis on the development and sale of affordable and middle-market residential lots and housing units to lower and middle-income markets throughout the Philippines. FLI expects to remain focused on core residential real estate development business which now includes newly developed innovative concepts such as medium rise buildings and high rise condominium projects, residential farm estates, entrepreneurial communities, and leisure developments in response to the demands of the Philippine market. The Company is also expanding its retail and BPO office-building portfolio to generate recurring revenues. In 2012, FLI plans to launch about P 14.5 billion worth of projects, 20% more than the value of projects launched in 2011, equivalent to over 12,000 units. This includes 14 new projects and 19 additional phases of existing projects. New projects include two socialized housing projects and three new affordable

36
housing projects in Batangas, Cavite and Laguna. In addition, FLI plans on launching two new MRB projects, Girin Oasis in Cainta, Rizal and Pasig City, and its first MRB project in Quezon City. This will bring to thirteen the number of MRB projects under the “Oasis” brand. Middle-income projects include a new subdivision within Timberland Heights in San Mateo, Rizal. A condotel at Timberland Heights will also be launched. FLI is targeting to spend about P 15 billion for capital expenditures in 2012, more than double the amount spent in 2011. The bulk is earmarked for the construction of the various residential projects of FLI, covering all market segments. 2012’s capex also includes P 2.5 billion for the construction of new buildings and expansion of mall to create additional office and retail space. At Northgate Cyberzone, a BPO office building is also under construction and will add close to 20,000 square meters of GLA in the first half of 2013 to FLI’s current portfolio of over 170,000 square meters of GLA from twelve buildings as of the end of 2011. A fourteenth building is targeted to break ground within 2012 with a GLA of 13,000 square meters. Filinvest Building, along EDSA in Mandaluyong City, is targeted for completion within the third quarter of 2012. This five-storey BPO building will have approximately 7,000 square meters of GLA. This is FLI’s first BPO office building outside Northgate Cyberzone. FLI recently won the bid for the Build Transfer Operate (BTO) of a 1.2-hectare property in Salinas Drive, Lahug, Cebu City in the Province of Cebu. The lot was used to be occupied by the Bagong Buhay Rehabilitation Center and the Cebu City Treatment and Rehabilitation Center. FLI plans to construct four BPO office buildings on the site. The construction of the first building is targeted to start in early 2013. This is FLI’s first BPO office building project outside Metro Manila. Meanwhile, land development has commenced on the expansion of Festival Supermall at Filinvest Corporate City. The expansion project will add over 57,000 square meters of GLA, and is targeted to be completed in phases, from the fourth quarter of 2013. Within 2012, FLI also plans to start renovating the existing mall in phases, which is targeted to be completed in 2016. Additional retail space will also come from the Il Corso lifestyle strip of Citta di Mare, in the South Road Properties in Cebu. The first two phases covering 7 hectares will have over 35,000 square meters of GLA. Land development started in late 2011. Adoption of PFRS 9, (Financial Instruments: Recognition and Measurements) Pursuant to the International Financial Reporting Standards 9 issued by the International Accounting Standards Board (IASB) relating to the classification and measurements of financial assets and liabilities, which was approved by the Financial Reporting Standards Council (FRSC) as PFRS 9 with mandatory affectivity date to January 01, 2015, the Group has early adopted PFRS 9 with date of initial application of January 1, 2011 for the following merits:
a) Adoption of PFRS 9 is inevitable, hence, adopting it in 2011 rather than later is operationally more efficient;
b) This enables the Group to manage better its earnings and capital as the business model approach introduced by PFRS 9 aims to align the accounting standards with the Group’s risk, capital, and asset-liability management practices; and
c) Corollary to better managed earnings and capital is stability in the Group’s earnings.

37
These changes in accounting policy are applied from January 01, 2011 without restatement of prior periods’ financial statements. The Group chose to apply the limited exemption not to restate comparative information, thereby resulting in the following impact:
• Comparative information for prior periods is not restated. The classification and measurement requirements previously applied in accordance with PAS 39, Financial Instruments: Recognition and Measurement and disclosures required in PFRS 7, Financial Instruments: Disclosures are retained for the comparative periods.
• The Group discloses the accounting policies for both the current period and the comparative periods, one applying PFRS 9 and one applying PAS 39.
• As comparative information is not restated, the Group is not required to provide a third statement of financial information at the beginning of the earliest comparative period in accordance with PAS 1, Presentation of Financial Statements.
Impact of Change in Accounting Policy In accordance with the transition provisions of PFRS9, the classification of financial assets that the group held at the date of initial application was based on the facts and circumstances of the business model in which the financial assets were held at that date. Presented below are the effects in the Group’s financial statements as a result of the application of PFRS 9 beginning January 01, 2011: Original
New Measurement Carrying New Carrying
Original Measurement Category Amount Under Amount under
Category Under PAS 39 Under PFRS 9 PAS 39 PFRS 9
Loans and receivables
Cash and cash equivalents:
Cash on hand and in banks Financial assets at amortized cost 486,179 486,179
Short-term deposits Financial assets at amortized cost 667,127 667,127
Contracts receivables;
Contracts receivable Financial assets at amortized cost 8,085,680 8,085,680
Receivables from government
and financial institutions Financial assets at amortized cost 367,228 367,228
Due from related parties Financial assets at amortized cost 246,757 246,757
Other receivables:
Receivables from homeowners'
association - net Financial assets at amortized cost 109,136 109,136
Receivables from tenants - net Financial assets at amortized cost 229,151 229,151
Others Financial assets at amortized cost 99,552 99,552

38
Other assets (short-term deposits):
Deposits Financial assets at amortized cost 29,080 29,080
Total loans and receivables 10,319,890 10,319,890
AFS financial assets
Investment in shares of stocks:
Quoted Financial assets at fair value
through other comprehensive
income 3,321 3,321
Unquoted Financial assets at fair value
through other comprehensive
income 21,305 21,305
Total AFS financial assets 24,626 24,626
Grand Total 10,344,516 10,344,516 As a result of the adoption of PFRS 9, the balance of the revaluation reserve on available-for-sale financial assets in 2010 was reclassified into revaluation reserve on financial assets at fair value through other comprehensive income as at January 01, 2011. The adoption of PFRS 9 related to classification and measurement of financial liabilities has no material impact on the Group’s financial statements. As of December 31, 2011, the Group’s financial liabilities are classified and measured at amortized cost. Results of Operations for 2011 In 2011, FLI launched P 12.1 billion worth of projects, 17% more than the value of projects launched in 2010. FLI launched 11 new projects and 22 additional phases of existing projects, equivalent to 6,503 units, across all segments nationwide. Among the new projects were six affordable housing projects located in Batangas, Bulacan, Cavite, Pampanga and Rizal. FLI also launched two new mid-rise building (MRB) projects, Bali Oasis 2 in Pasig City and Asiana Oasis in Paranaque City. The Company also introduced two new high-rise buildings, Studio Zen in Pasay City, and Vinia Residences and Versaflats along EDSA, Quezon City. Year ended December 31, 2011 compared to year ended December 31, 2010 For the year ended December 31, 2011, FLI‘s operating regular net income registered a year on year growth of 21.2% or P514.41 million from P 2,425.93 million in 2010 to P2,940.34 million in 2011. The 2010 net income excludes the P 526.30 million one-time extraordinary gain (recorded as Gain from re-measurement of previously held interest in a business combination and Excess of fair value of net identifiable assets over consideration transferred in a business combination) arising from FLI’s acquisition of Africa-Israel’s 40% ownership each in CPI and FAPI. This one time gain had shored up FLI’s net income for 2010 to P 2,952.23 million. Revenues and other income

39
FLI recorded real estate sales of P6,953.47 million in 2011, higher by 23.02% than the real estate sales in 2010 of P 5,652.37 million. Recorded sales in 2011 consisted mostly of sales of affordable and middle-income lots and housing units including the medium-rise-buildings and condominium projects, which are accounted for based on the stage of completion. Thirteen buildings in various MRB projects were completed in 2011. In 2011, the Group launched 11 new projects and 22 additional phases of existing projects with total sales value of P 12.1 billion. Among these are additional buildings in MRB projects like Bali Oasis, Maui Oasis, One Oasis Cebu and Sorrento Oasis. Revenue from Rental services increased by P 117.02 million or by 8.29% to P 1,528.29 million in 2011 from P1,411.27 million in 2010. This increase was brought about by higher rental revenues generated by CPI from Northgate Cyberzone buildings resulting from higher take up rate of Vector 1 in 2011. Other sources of revenue from rental services include the ready-built-factories in Filinvest Technology Park in Calamba, Laguna. Equity in net earnings from an associate also increased to P 63.41 million in 2011 from P 55.22 million in 2010 or by 14.83% due to higher earnings of Filinvest Alabang, Inc. (FAI) where FLI is a 20% equity holder. The acquisition by FLI of the 40% interest of Africa-Israel Properties (Phils.), Inc. in CPI and the 40% interest of Africa-Israel Investments (Phils.) Inc., in FAPI resulted in FLI’s recognition of a gain from remeasurement of previously held interest of P 517.24 and excess of fair value of net identifiable assets over consideration transferred of P9.06 in 2010 in accordance with the International Financial Reporting Standards (IFRS) 3 – Business Combinations. There is no extraordinary gain from transactions in 2011. The Group also recorded a foreign exchange gain of P 1.30 million in 2011 compared to a foreign exchange gain of P 8.56 million earned in 2010 due to lower foreign currency deposits in 2011. Other income increased by 12.16% or by P 61.15 million from P 502.95 million in 2010 to P564.10 million in 2011 due to higher amusement and other sales of the mall, service fees and amounts collected from tenants in excess of expenses incurred. Cost and Expenses
With the higher sales, the corresponding cost of real estate sales increased by 20.54% from P2,996.82 million in 2010 to P 3,612.28 million in 2011. Cost of rental services likewise increased by 6.17% from P 400.88 million in 2010 to P 425.65 million in 2011.
Total operating expenses increased to P 1,663.30 million in 2011 from P 1,393.69 million in 2010.
General and administrative expenses increased by P 120.79 million or by 15.1% to P920.89 million in 2011 from P 800.10 million in 2010.
The following are the significant movements in the general and administrative expense accounts which resulted primarily from the increased volume of business: 69% increase in amusement and recreation expenses, from P 27.36 million in 2010 to P 46.15 million in 2011. 24% increase in salaries, wages & employee benefits 22% increase in transportation & travel 22% increase in outside services

40
61% increase in depreciation and amortization, from P 46.98 million in 2010 to P 75.40 million in 201 – Mainly because of the opening of Vector 1 in last quarter of 2010. 76% increase in retirement cost, from P 12.74 million in 2010 to P 22.38 million in 2011. 45% increase in insurance expenses, from P 17.96 million in 2010 to P 25.96 million in 2011.
Selling and marketing expenses increased by 25.07% to P 742.41 million in 2011 from P593.59 million in 2010 mainly due to the increase in broker’s commission, advertising, promotion and sales generation expenses as a result of increasing sales volume and activities. Interest and other financial charges increased by 12.66% to P 469.40 million in 2011 from P 416.66 million in 2010. This was brought about by availment of loans amounting to P 3,350.00 million in 2011 and the issuance of the fixed-rate retail bonds totaling P3.0 billion in July 2011 to finance the current projects of the Group, especially its various MRB’s, high rise buildings and condotel projects. Provision for Income Tax
Provision for income tax decreased by 3.57% in 2011 from P 561.75 million in 2010 to P 541.71 million in 2011. Provision for current income tax increased to P 488.06 million in 2011 from P475.03 million in 2010 or an increase of P 13.03 million or by 2.74% due to higher taxable income brought about by higher revenues. Provision for deferred income tax decreased by P 33.08 million or by 38.14% from P86.72 million in 2010 to P 53.64 million in 2011 due to provisions for doubtful accounts on other receivables and due to lower capitalization of borrowing costs. Financial Condition As of December 31, 2011, FLI’s total consolidated assets stood at P 68.30 billion, higher by 10.40% than the P 61.87 billion as at the previous year-end. 34% Decrease in Cash and cash equivalents Funds were used for the development of existing and new projects and for the construction of new IT buildings (investment properties) and for raw land acquisitions. 8% Increase in Contracts receivable Contracts receivable increased due to additional sales booked during the current period. 33% Increase in Due from related parties The increase was due to temporary advances made to affiliates in the regular course of business. These advances are expected to be collected within the following year.
. 55% Increase in Other receivables This account increased due to down payments made to contractors which are to be applied against their billings and ordinary advances to joint venture partners which will be offset against the proceeds from sales of the joint venture inventories. Decrease in Available-for-sale financial assets / Increase in financial assets at fair value through other comprehensive income The decrease was brought about by the redemption of certain investments upon maturity in 2011. The remaining shares of stock include unlisted preferred shares in a public utility company and are categorized under “Financial assets at Fair Value Through Other Comprehensive Income”. This resulted from the early adoption by the Group of PFRS 9 as earlier discussed.

41
26% Increase in Real estate inventories The movement in this account was mainly due to development and construction costs set up for new projects and additional phases of existing projects. 10% Increase in Land and land development The increase in this account was mainly due to acquisition of new properties in various parts of the country which are intended for development of housing projects and payment made to the Cebu City Government for the purchase of part of the 10.6 hectare SRP property. 11% Decrease in Investment in an associate The decrease in this account was mainly due to dividend income received from the associate during the year. 5% Increase in Investment properties The increase was mainly due to the transfer of a building under construction to Investment properties account upon completion of its construction. 13% Decrease in Property and equipment The decrease in this account was mainly due to the reclassification of a building into Investment properties account after completion of its construction. 18% Increase in Deferred tax assets The increase was mainly due to provisions made for doubtful accounts on other receivables. 94% Increase in Other assets The increase in this account was mainly due to higher creditable withholding tax and input vat for the year. 12% Increase in Income tax payable The Increase in income tax payable was due to higher tax accruing on the taxable income earned for the year resulting from improved operational results. 41% Decrease in Due to related parties The decrease was due to payments made to affiliates on advances made in the regular course of business. 22% Increase in Loans payable The increase was due to additional borrowings made to finance the various projects of the Company. 61% Increase in Bonds payable The increase was due to the issuance of Fixed Rate Retail Bonds by the Company with an aggregate principal amount of P 3 billion in July 2011 to finance the various projects of the Company. 22% Increase in Retirement liabilities The increase was due to the accrual of the liability to the retirement fund for the year, net of cash contributions to the fund. 17% Increase in Retained earnings This was brought about by the Company’s net income of P 2.94 billion for the year net of cash dividends paid in 2011.

42
Performance Indicators
Financial Ratios Particulars 2011 2010 Earnings per Share Basic 0.12 0.12 Earnings per Share Diluted 0.12 0.12
Debt to Equity Ratio Notes Payable & Long-term
Debt
Total Stockholder's Equity 0.38 0.29
Debt Ratio Total Liabilities Total Assets 0.36 0.33
Ebitda to Total EBITDA
Interest Paid Total Interest Payment 5.10 4.76
Price Earnings Ratio Closing Price of Share Earnings Per share 8.16 10.76
Other Disclosures Aside from the possible material increase in interest rates of the outstanding long-term debts with floating rates, there are no known trends, events or uncertainties or any material commitments that may result to any cash flow or liquidity problems of FLI within the next 12 months. The Company is not in default or breach of any note, loan, lease or other indebtedness or financing arrangements requiring it to make payments, or any significant amount in its accounts payable that have not been paid within the stated terms. There are no known trends, events or uncertainties that have had or are reasonably expected to have favorable or unfavorable impact on net sales or revenues or income from continuing operations of FLI. Except for income generated from retail leasing, there are no seasonal aspects that have a material effect on FLI’s financial conditions or results of operations. The operating activities of FLI are carried uniformly over the calendar year; there are no significant elements of income or loss that did not arise from the company’s continuing operations. There are no known events that will trigger the settlement of a direct or contingent financial obligation that is material to the Company. There are no off-balance sheet transactions, arrangements, obligations (including contingent obligations), and other relationships to the Company with unconsolidated entities or other persons created during the reporting period, except those discussed.

43
FLI plans to issue P 11.0 billion worth of fixed-rate bonds, subject to the approval of the Securities and Exchange Commission (SEC). FLI intends to issue the bonds in two tranches. The first tranche, worth P 7.0 billion, will be issued within the second quarter of 2012, while the second tranche worth P 4.0 billion will be issued later in the year. The bonds will have a term of seven (7) years. The Registration Statement for the bond issue was filed with the SEC on April 4, 2012. The Philippine Rating Services Corporation (PhilRatings) has assigned a PRS Aaa rating for FLI’s proposed issuance of an additional P 11.0 billion fixed-rate bonds. PhilRatings have also maintained the PRS Aaa rating for FLI’s P 5.0 billion outstanding fixed-rate bonds (P 500.0 million bonds due in 2012 and P 4.5 billion bonds due in 2014) and its P 3.0 billion outstanding bonds due in 2016. “Obligations rated PRS Aaa are of the highest quality with minimal credit risk. The obligor’s capacity to meet its financial commitment on the obligation is extremely strong.” Results of Operations for 2010 Year ended December 31, 2010 compared to year ended December 31, 2009 FLI registered a net income of P2,952.23 million in 2010, higher by 46.28% than the net income of P2,018.20 million in 2009. Revenues FLI recorded real estate sales of P 5,652.37 million in 2010, higher by 53.82% than the real estate sales in 2009 of P 3,674.75 million. This year’s recorded sales consist mostly of sales of middle-income lots and housing units including the medium-rise-buildings and condominium project, which are accounted for based on the stage of completion. Effective January 1, 2010, the Group changed the percentage being used to estimate on when the buyer’s investment is considered adequate to meet the probability criteria that economic benefits will flow to the Group and warrant revenue recognition. Prior to 2010, the Group has estimated the percentage to be at least 20% payment of the total selling price received from the buyer. The recent change in the Group’s business focus on low to middle income segment, experience over the past years, and information gathered that other industry players are adopting the same threshold, prompted the Group to revisit and accordingly revise the estimate from payment of 20% to 10% payment of the total selling price. It is at this level of investment that it is highly probable that the buyer will commit to the sale transaction, and thus, it is probable that economic benefits will flow to the Group. The change in estimate increased the real estate sales by P=
1.09 billion for the year ended December 31, 2010.
With the higher sales, the corresponding cost of real estate sales increased by 67.53% from P1,788.85 million in 2009 to P 2,996.82 million in 2010. The higher cost of sales was likewise due to an increased proportion of sales of medium-rise-buildings. Rental income increased by P 223.83 million or by 18.85% to P 1,411.27 million in 2010 from P1,187.44 million in 2009. This was brought about by higher rental revenues generated from Northgate Cyberzone buildings due to a full period of leasing revenues from ihub 1 and ihub 2, which opened in the latter part of 2009 and the Company’s acquisition of the remaining 40% equity interest in CPI in February 2010, resulting in the consolidation of 100% of CPI rental income in 2010. Other sources of rental income include the Festival Supermall in Filinvest Corporate City in Alabang, PBCom Tower in Makati City and the ready-built-factories in Filinvest Technology Park in Calamba, Laguna.

44
Interest income also increased by P 164.65 million or by 41.09% from P 400.71 million in 2009 to P 565.36 million in 2010 due to higher interest generated from short-term investments, bank deposits and from higher installment contracts receivable. Equity in net earnings from an associate also increased to P 55.22 million in 2010 from P 37.53 million in 2009 or by 47.14% due to higher earnings of Filinvest Alabang, Inc. (FAI) where FLI is a 20% equity holder. The acquisition by FLI of the 40% interest of Africa-Israel Properties (Phils.), Inc. in CPI and the 40% interest of Africa-Israel Investments (Phils.) Inc., in FAPI resulted in FLI’s recognition of a gain from remeasurement of previously held interest of P 517.24 and excess of fair value of net identifiable assets over consideration transferred of P9.06 in 2010 in accordance with the International Financial Reporting Standards (IFRS) 3 – Business Combinations. The Group also recorded a foreign exchange gain of P 8.57 million in 2010, an improvement from a foreign exchange gain of P 2.40 million earned in 2009. Other income increased by 32.01% or by P 121.97 million from P 380.98 million in 2009 to P502.95 million in 2010 due to increase in amusement and other sales of the mall, dividend income and service fees. Expenses
Total expenses increased to P 2,211.23 million in 2010 from P 1,728.49 million in 2009.
General and administrative expenses increased by P 160.99 million or by 15.48% to P1,200.99 million in 2010 from P 1,039.99 million in 2009.
The following are the significant movements in the general and administrative expense accounts: 13.62% increase in depreciation & amortization (mainly due to the consolidation of 100% of CPI in 2010) 9.13% increase in salaries, wages & employee benefits 7.31% increase in rental expense 5.24 % increase in taxes and licenses 11.91% increase in transportation & travel 12.57% increase in outside services 22.67% increase in Mall manpower cost 33.34% increase in Mall amusement center cost 43.05% increase in repairs & maintenance 11.27% increase in communications, light & power 8.84% increase in direct cost of saleable items of the mall 32.86% increase in entertainment expenses of the mall 35.39% increase in other general & administrative expenses
Selling and marketing expenses increased by 23.61% to P 593.59 million in 2010 from P480.21 million in 2009 due to increase in broker’s commission, advertising and promotion and sales generation expenses. Interest and other financial charges increased by 100.04% to P 416.66 million in 2010 from P208.28 million in 2009. This was brought about by the issuance of the fixed-rate retail bonds totaling P 5.0 billion in November 2009 to finance the current projects of the Group, especially its various MRB, high rise building and condotel projects.

45
Provision for Income Tax
Provision for income tax increased by 278.86% in 2010 from P 148.27 million in 2009 to P561.75 million in 2010. Provision for current income tax increased to P 475.03 million in 2010 from P 253.35 million in 2009 or an increase of P 221.68 million or by 87.5% due to higher taxable income brought about by higher revenues.
Provision for deferred income tax also increased by P 191.79 million or by 182.53% due to the adjustment made in 2009 relative to the corresponding deferred income tax on unrealized gain on installment sales.
Financial Condition
As of December 31, 2010, FLI’s total consolidated assets stood at P 61.87 billion, higher by 5.04% than the P 58.90 billion as at the previous year-end. 69% Decrease in Cash and Cash Equivalents
Funds were used for the development of existing and new projects and for the construction of new IT buildings (investment properties) and for raw land acquisitions. Funds were also used to acquire the 40% interest of Africa-Israel Properties (Phils.), Inc. in CPI and the 40% interest of Africa-Israel Investments (Phils.) Inc., in FAPI in February 2010.
. 13% Increase in Other Receivables
This account increased due to additional advances made to Timberland Sports and Nature Club (TSNC, Inc.). Moreover, the acquisition by FLI of the 40% interest of Africa-Israel Properties (Phils.), Inc. in CPI and the 40% interest of Africa-Israel Investments (Phils.) Inc., in FAPI contributed to the increase because of the 100% consolidation of CPI and FAPI in 2010. Higher receivables from tenants of FSI and CPI in the current year also added to the increase in this account. 54% Decrease in Available-for-Sale Financial Assets The decrease was due to the maturity in July 2010 of certain bonds previously held by the Company. 22% Increase in Real Estate Inventories The movement in this account was mainly due to (a) development and construction costs set up for projects launched during the year; (b) acquisitions of new properties in various parts of Metro Manila which are mostly intended for medium-rise-buildings development; (c) payment made to the Cebu City government for the purchase of part of the 10.6 hectare SRP property; and (d) acquisition by FLI of the 40% interest of Africa-Israel Investments (Phils.) Inc., in FAPI. 11% Increase in Investment in an associate The increase represents the equity share of the Group in the current net earnings of FAI. 17% Increase in Investment properties The increase was due to the acquisition by FLI of the 40% interest of Africa-Israel Properties (Phils.) Inc., in CPI and the restatement of CPI buildings at fair value as at February 08, 2010 when the 40% interest of Africa-Israel Properties (Phils.), Inc.in CPI was acquired. 48% Increase in Property and Equipment

46
The increase in this account was mainly due to the acquisition by FLI of the 40% interest of Africa-Israel Properties (Phils.) Inc. in CPI and the restatement of buildings under construction at fair value as at February 08, 2010 when the 40% interest of Africa-Israel Properties (Phils.), Inc. in CPI was acquired. 16% Decrease in Goodwill The decrease resulted from the re-computation of the difference between the total consideration given for the acquisition of CPI and the equity value of CPI as at February 08, 2010. 7% Decrease in Other Assets The decrease was mainly due to lower input taxes in 2010. Increase in Income Tax Payable The Increase in income tax payable was due to higher tax accruing on the taxable income earned for the year. 77% Increase in Due to Related Parties The increase was due to temporary advances from affiliates, which were all in the regular course of business. These advances are expected to be paid or liquidated within the first quarter of the following year. 30% Increase in Pension Liability The increase was due to the accrual of the liability to the retirement fund for the year, net of cash contributions to the fund. 8% Increase in Deferred Income Tax Liabilities The increase in this account was mainly due to the capitalization of part of interests on long-term loans. 29% Increase in Retained Earnings This was brought about by the Company’s net income of P 2.95 billion for the year net of cash dividends paid in 2010. Performance Indicators
Financial Ratios Particulars 2010 2009 2008 Earnings per Share Basic 0.122 0.090 0.080 Earnings per Share Diluted 0.122 0.090 0.080
Debt to Equity Ratio Notes Payable & Long-
term Debt
Total Stockholder's Equity 29% 30% 19%
Debt Ratio Total Liabilities Total Assets 33% 33% 29%
Ebitda to Total EBITDA Interest Paid Total Interest Payment 4.87 4.53 6.06

47
Price Earnings Ratio Closing Price of Share Earnings Per share 10.76 10.00 4.88
Other Disclosures On December 28, 2009, FLI executed separate deeds of sale for the acquisition by FLI of the 40% interest of Africa-Israel Properties (Phils.), Inc. in CPI and the 40% interest of Africa-Israel Investments (Phils.) Inc. in FAPI subject to the full payment by FLI of the purchase price and delivery to FLI of certain required documents for closing. The sale by Africa-Israel of its interests in the two companies was part of Africa-Israel’s global portfolio rebalancing and consolidation activity. On the other hand, the acquisition of Africa-Israel’s interests will enable FLI to consolidate its share in the strong and stable recurring revenue streams from the two companies as well as provide incremental development potential to FLI’s existing revenue streams. The transaction was officially completed on February 08, 2010, making CPI and FAPI wholly owned subsidiaries of FLI. Aside from the possible material increase in interest rates of the outstanding long-term debt, there are no known trends, events or uncertainties or any material commitments that may result to any cash flow or liquidity problems of FLI within the next 12 months. The Company is not in default or breach of any note, loan, lease or other indebtedness or financing arrangements requiring it to make payments, or any significant amount in its accounts payable that have not been paid within the stated terms. There are no known trends, events or uncertainties that have had or are reasonably expected to have favorable or unfavorable impact on net sales or revenues or income from continuing operations of FLI. Except for income generated from retail leasing, there are no seasonal aspects that have a material effect on FLI’s financial conditions or results of operations. The operating activities of FLI are carried uniformly over the calendar year; there are no significant elements of income or loss that did not arise from the company’s continuing operations. There are no known events that will trigger the settlement of a direct or contingent financial obligation that is material to the Company. There are no off-balance sheet transactions, arrangements, obligations (including contingent obligations), and other relationships to the Company with unconsolidated entities or other persons created during the reporting period, except those discussed.
The Company also intends to continue carrying out, through its joint venture companies, an intensive marketing campaign so as to maintain a high occupancy rate in the Festival Supermall, PBCom Tower and Northgate Cyberzone properties; thereby, maximizing its leasing revenues.Results of Operations for 2009
Year ended December 31, 2009 compared to year ended December 31, 2008
FLI registered a net income of P 2,018.20 million in 2009, higher by 8.10% than the net income of P 1,187.00 million in 2008.

48
Revenues FLI recorded real estate sales of P 3,674.75 million in 2009, slightly higher than real estate sales in 2008 of P 3,507.56 million. This year’s recorded sales consist mostly of sales of middle-income lots and housing units including the medium-rise-buildings and condominium projects which are accounted for based on the stage of completion. With the higher sales, the corresponding cost of real estate sales increased by 12.82% from P 1,585.59 million in 2008 to P1,788.85 million in 2009. Also, higher construction cost of medium rise buildings contributed to the increased cost of sales. Rental income increased by P 52.91 million or by 4.66% to P 1,187.44 million in 2009 from P 1,134.53 million in 2008. This was brought about by higher rental revenues generated from Filinvest Supermall and Northgate Cyberzone buildings. Other sources of rental income include the PBCom Tower in Makati City and the ready-built-factories in Filinvest Technology Park in Calamba, Laguna. Interest income increased by P 30.46 million or by 8.23% from P 370.24 million in 2008 to P400.71 million in 2009 due to higher interest generated from short-term investments and bank deposits while equity in net earnings from an associate decreased to P 37.53 million in 2009 from P 67.57 million in 2008 or by 44.46% due to lower earnings by Filinvest Alabang Inc. (FAI) where FLI is a 20% equity holder. The Group also recorded a foreign exchange gain of P 2.40 million in 2009 compared to a foreign exchange gain of P 7.35 million in 2008 due to a more stable Peso compared to U.S. Dollar in 2009. Other income increased by 75.11% or by P 163.42 million from P 217.56 million in 2008 to P 380.98 million in 2009, this is due to increase in amusement and other sales of the mall, dividend income and service fees. Expenses
Total expenses increased to P 1,728.49 million in 2009 from P 1,587.56 million in 2008.
General and administrative expenses slightly increased by P 44.53 million or by 4.47% to P1,039.99 million in 2009 from P 995.46 million in 2008.
The following are the significant movements in the general and administrative expense accounts: 6.12% increase in salaries, wages and employee benefits due to additional manpower hired to cope up with the increasing volume of business. 9.03% increase in rent expense due to increase in office rental rates and mall land lease which was based on gross rental revenues earned by the mall. 24.60% increase in taxes and licenses because of higher revenues. 10.10% decrease in transportation & travel because of fewer provincial visits made. 17.00% increase in other general & administrative expenses due to higher expenses for insurance, data processing, dues & subscriptions and office supplies.
Selling and marketing expenses slightly decreased by 0.75% to P 480.21 million in 2009 from P483.87 million in 2008.
Interest and other financial charges increased by 92.44 % to P 208.28 million in 2009 from P108.23 million in 2008, brought about by higher interest rates and loans availed of during the last quarter of 2008 and issuance of the fixed-rate retail bonds amounting to P 5.0 billion in November 2009.
Provision for Income Tax
Provisions for income tax decreased by 43.98% in 2009 from P 264.66 million in 2008 to P148.27 million in 2009. Provisions for current income tax dropped to P 253.35 million in 2009 from P 377.74 million in 2008 or a decrease of P 124.39 million or by 32.93% due to lower income tax rate and tax incentives

49
availed by the Company. The Corporate income tax rate was reduced to 30% from 35% effective January 01, 2009.
Provisions for deferred income tax also decreased by P 8.00 million or by 7.08% due to reversals made on deferred tax liabilities.
Financial Condition
As of December 31, 2009, FLI’s total consolidated assets stood at P 58.90 billion, higher by 10.74% than the P 53.19 billion as at the previous year end. 137% Increase in Cash and Cash Equivalents
The increase in Cash and Cash Equivalents represents mainly proceeds from the Company’s issuance of fixed rate retail bonds amounting to P 5.0 billion in November 2009. The funds will be used to finance the development of existing and new projects of the Company lined up for the following year. 128% Increase in Due from related parties Interest bearing advances in the ordinary course of business were made to affiliates in 2009. These are expected to be collected in the following year. . 10% Decrease in Other Receivables Other Receivables decreased due to aggressive collection efforts by the Company which reduced those amounts due from various Homeowners Associations and from tenants. Advances to contractors representing down payments were applied against their billings. 12% Increase in Real Estate Inventories The movement in this account was mainly due to development and construction costs set up for projects launched during the year and acquisitions of new properties in various parts of Metro Manila, Rizal, Cebu & Davao which were mostly intended for medium rise buildings development and includes the first payment made to the Cebu City government in connection with the purchase of 10.6 hectares SRP property. Increase in Available-for-sale Financial Assets The increase was due to investment made in a 10 year zero-coupon bond of the National Power Corporation maturing on July 13, 2010. 15 % Increase in Property & Equipment Property and equipment increased due to ongoing building constructions of CPI to create additional office space to meet the growing demand from BPOs and call center locators. Building and leasehold improvements and acquisition of additional equipment also contributed to the increase. 20% Increase in Other Assets The Increase was mainly due to increase in input vat and creditable withholding tax. 34% Decrease in Income Tax Payable The decrease in income tax payable was due to the lower income tax rate applied to taxable net income and due to availment of tax incentives by the Company. 81% Decrease in Due to Related Parties Advances from certain related parties were settled in 2009.

50
14% Increase in Pension Liability The increase was due to the accrual of the liability to the retirement fund for the period, net of cash contributions and payments made to and from the fund. 7% Decrease in Deferred income tax liabilities The decrease was due to reversals made on deferred tax liabilities pertaining to sales recorded under the installment method of previous years. Recording of sales was changed using the full accrual method. Increase in Bonds Payable The Company issued fixed rate retail bonds amounting to P 5.0 billion in November 2009 to finance the construction of various projects and the acquisition of various properties for future projects. 20% Increase in Retained Earnings This was brought about by the Company’s net income of P 2.02 billion posted during the year net of cash dividends paid in 2009.
Performance Indicators:
Financial Ratios Particulars 2009 2008 2007
Earnings per Share Basic 0.090 0.080 0.071
Earnings per Share Diluted 0.090 0.080 0.071
Debt to Equity Ratio Notes Payable & Long Term Debt 0.30 : 1 0.19 : 1 0.10 : 1 Total Stockholder's Equity
Debt Ratio Total Liabilities 33% 29% 22% Total Assets
Ebitda to Total Ebitda 4.53 times 6.06 times 5.96 times Interest Paid Total Interest Payment
Price Earnings Ratio Closing Price of Share 10.00 times 4.88 times 19.15 times

51
Earnings per Share
Other Disclosures Aside from the possible material increase in interest rates of the outstanding long-term debt, there are no known trends, events or uncertainties or any material commitments that may result to any cash flow or liquidity problems of FLI within the next 12 months. The Company is not in default or breach of any note, loan, lease or other indebtedness or financing arrangements requiring it to make payments, or any significant amount in its accounts payable that have not been paid within the stated terms. There are no known trends, events or uncertainties that have had or are reasonably expected to have favorable or unfavorable impact on net sales or revenues or income from continuing operations of FLI. Except for income generated from retail leasing, there are no seasonal aspects that have a material effect on FLI’s financial conditions or results of operations. The operating activities of FLI are carried uniformly over the calendar year; there are no significant elements of income or loss that did not arise from the company’s continuing operations. There are no known events that will trigger the settlement of a direct or contingent financial obligation that is material to the Company. There are no off-balance sheet transactions, arrangements, obligations (including contingent obligations), and other relationships to the Company with unconsolidated entities or other persons created during the reporting period, except those discussed. Item 8. CHANGES IN AND DISAGREEMENTS WITH ACCOUNTANT ON ACCOUNTING AND FINANCIAL DISCLOSURE SyCip, Gorres, Velayo & Co (SGV) has been the duly appointed independent auditors for the years covered by this report. There has been no termination nor change in the said appointment. There has been no disagreement with FLI’s independent accountants on any matter of accounting principles or practices, financial statement disclosure, or auditing scope or procedure. PART III – CONTROL AND COMPENSATION INFORMATION Item 9. DIRECTORS AND PRINCIPAL OFFICERS OF THE REGISTRANT Andrew L. Gotianun, Sr. Chairman
Mr. Gotianun, 84, Filipino, is the founder of the Filinvest group of companies and is presently serving in various capacities in the member companies of the group, including Filinvest Alabang, Inc. ("FAI") and EastWest Banking Corporation (“EWBC”) and Pacific Sugar Holdings Corporation ("PSHC") where he is Chairman and President.

52
Mercedes T. Gotianun Chairman Emeritus
Mrs. Gotianun, 83, Filipino, has been a director of FLI since 1991 to 2010 and its Chief Executive Officer from 1997 to 2007. She is also a director of FAI. She was involved in the operations of Family Bank and Trust Co. since its founding in 1970 and was President and Chief Executive Officer of the bank from 1978 to 1984. She obtained her university degree from the University of the Philippines.
Andrew T. Gotianun, Jr. Co-Vice Chairman
Mr. Gotianun, 60, Filipino, has been a director of FLI since 1990. He is also a director of FDC and FAI. He served as director of Family Bank and Trust Co. from 1980 to 1984. He has been in the realty business for more than 16 years. He obtained his bachelor of Science (Major in Accounting) degree from the Republican College in 1981.
Joseph M. Yap Director, President & Chief Executive Officer
Mr. Yap, 61, Filipino, has been the President and a member of FLI's Board since 1997. He was appointed Chief Executive Officer in 2007. He served as First Vice President of Family Bank & Trust Co. in charge of credit and collection from 1982 to 1984. Prior to that, he held financial management positions with Nestle with assignements in New York, Switzerland and Manila from 1976 to 1982. He obtained his Master's Degree in Business Administration from Harvard University in 1976.
Lourdes Josephine G. Yap Co-Vice Chairman
Mrs. Yap, 56, Filipino, has been a director of FLI since 1990. Mrs. Yap, who was elected as the Chairman of FLI's Executive Committee in 2010, is also a Director and the President of FDC, The Palms Country Club, Inc., and FAI. She obtained her Master’s Degree in Business Administration from the University of Chicago in 1977.
Jonathan T. Gotianun Director
Mr. Gotianun, 58, Filipino, has been a director of FLI since 1990. He is also the Chairman of FDC, the President of Davao Sugar Central Co., Inc. and Cotabato Sugar Central Co., Inc., and Chairman of EastWest Banking Corporation. He served as director and Senior Vice President of Family Bank & Trust Co. until 1984. He obtained his Master's Degree in Business Administration from Northwestern University in 1976.
Efren C. Gutierrez Director
Mr. Gutierrez, 76, Filipino, was a director of FLI from 1994 to 2001, and was re-elected to FLI’s Board in 2006. He served as the President of FAI from 1999 to 2005. He is a director of The Palms Country Club, Inc. He obtained his Bachelor of Laws degree from the University of the Philippines.

53
Cirilo T. Tolosa Independent Director
Mr. Tolosa, 72, Filipino, has been an independent director of FLI since 2007. He was a partner at Sycip Salazar Hernandez and Gatmaitan, retiring from the said law firm in February 2005. He is at present a partner in the law firm Tolosa Romulo Agabin and Flores. He has been chairman of the boards of Daystar Commercial Enterprises, Inc., Daystar Development Corporation, Lou-Bel Development Corporation and GMA Lou-Bel Condominium Corporation for at least 10 years, and corporate secretary of De La Salle University System, Inc. and De La Salle Philippines, Inc. since 2003 and 2005, respectively.
Lamberto U. Ocampo Independent Director
Mr. Ocampo, 86, Filipino, was an independent director of FLI from 2002 to 2008. In 2008, however, the Commission temporarily disqualified Mr. Ocampo for his failure to attend at least 50% of the total number of Board meetings in 2007. In the annual meeting of 2009, he was re-appointed as an Independent Director. Mr. Ocampo is a Civil Engineer by profession. He served as director of DCCD Engineering Corporation from 1957 to April 2001, as its Chairman of the Board from 1993 to 1995, and President from 1970 to 1992. He Obtained his Master's Degree in Engineering from the University of California-Berkeley.
Cornelio C. Gison Director
Mr. Gison, 70, Filipino, has been a director of FLI since 2006. Prior to joining FLI's Board, he was Undersecretary of the Philippine Department of Finance from 2000 to 2003. He is a member of the Advisory Board of the Metropolitan Bank & Trust Co., and a director of Intex Holdings Group.
Nelson M. Bona Chief Financial Officer & Senior Vice President
Mr. Bona, 61, Filipino, was appointed as FLI’s Chief Financial Officer in January 2007. He is also the Treasurer of FDC. He was formerly an Executive Vice President of EastWest Bank and the Managing Director of Millenia Broadband Communications, Inc. and Filinvest Capital, Inc.
Efren M. Reyes Treasurer and Senior Vice President
Mr. Reyes, 61, Filipino, has served with the Filinvest Group in various capacities since 1980 and has been FLI’s Treasurer and Senior Vice President since 1997. Prior to joining the Filinvest Group, he was an audit manager with SGV & Co. He obtained his Bachelor of Science in Business Administration (Major in Accounting) degree from the University of the East.

54
Pablito A. Perez Corporate Secretary & First Vice President
Mr. Perez, 55, Filipino, is FLI’s General Counsel and Head of its Legal Department. Admitted to the Philippine Bar in 1984, he holds a law degree from San Beda College of Law and a Master of Laws degree from the University of Pennsylvania.
The members of the Nomination Committee of FLI are Andrew L. Gotianun Sr. (chair), Josephine G. Yap and Lamberto U. Ocampo. The Chairman Emeritus Mercedes T. Gotianun and the head of FLI’s Human Resources Department sits in the committee in an ex-officio capacity. The Audit Committee of FLI is composed of Cirilo T. Tolosa (chair), Cornelio C. Gison, and Jonathan T. Gotianun. Mr. Andrew L. Gotianun, Sr. is the spouse of Ms. Mercedes T. Gotianun and the father of Mr. Andrew T. Gotianun Jr., Mr. Jonathan T. Gotianun, Mr. Michael Edward T. Gotianun and Ms. Josephine G. Yap. Ms. Yap is married to Mr. Joseph M. Yap. The Directors of the Company are elected at the annual stockholders’ meeting to hold office until the next succeeding annual meeting and until their respective successors have been appointed or elected and qualified. Officers are appointed or elected annually by the Board of Directors at its first meeting following the annual stockholders’ meeting each to hold office until the corresponding meeting of the Board of Directors in the next year or until a successor shall have been elected, appointed or shall have qualified. There is no person who is not an executive officer of the Company who is expected to make a significant contribution to the business. The Company, however, engages the regular services of consultants. At December 31, 2011, the Company had 7 consultants in the area of business development, marketing, planning and design and construction management. Except as discussed in section 1.11, there are no transactions or any proposed transactions during the last two years, to which the Company was or is to be a party, in which any director or officer, any nominee for election as a director, any security holder or any member of the immediate family or any of the persons mentioned in the foregoing had or is to have a direct or indirect material interest. Involvement in Certain Legal Proceedings of Directors and Executive Officers
Except for (a) criminal cases filed in 2007 before the Department of Justice (DOJ) in I.S. 2007-001 and 2007-011 and which were dismissed by the DOJ on March 26, 2009 and April 07, 2009, respectively; and (b) a criminal proceeding under Presidential Decree 1689 (filed against Mr. Joseph M. Yap and other FLI officers) arising from alleged unlawful collection of subdivision dues and other charges being collected by a homeowner’s association which was dismissed by the City prosecutors office, none of the members of FLI’s Board nor its executive officers are involved in any criminal, bankruptcy or insolvency investigations or proceedings for the past five years and up to December 31, 2011, nor have they been found by judgment or decree to have violated securities or commodities law and enjoined from engaging in any business, securities, commodities or banking activities.
Item 10. EXECUTIVE COMPENSATION
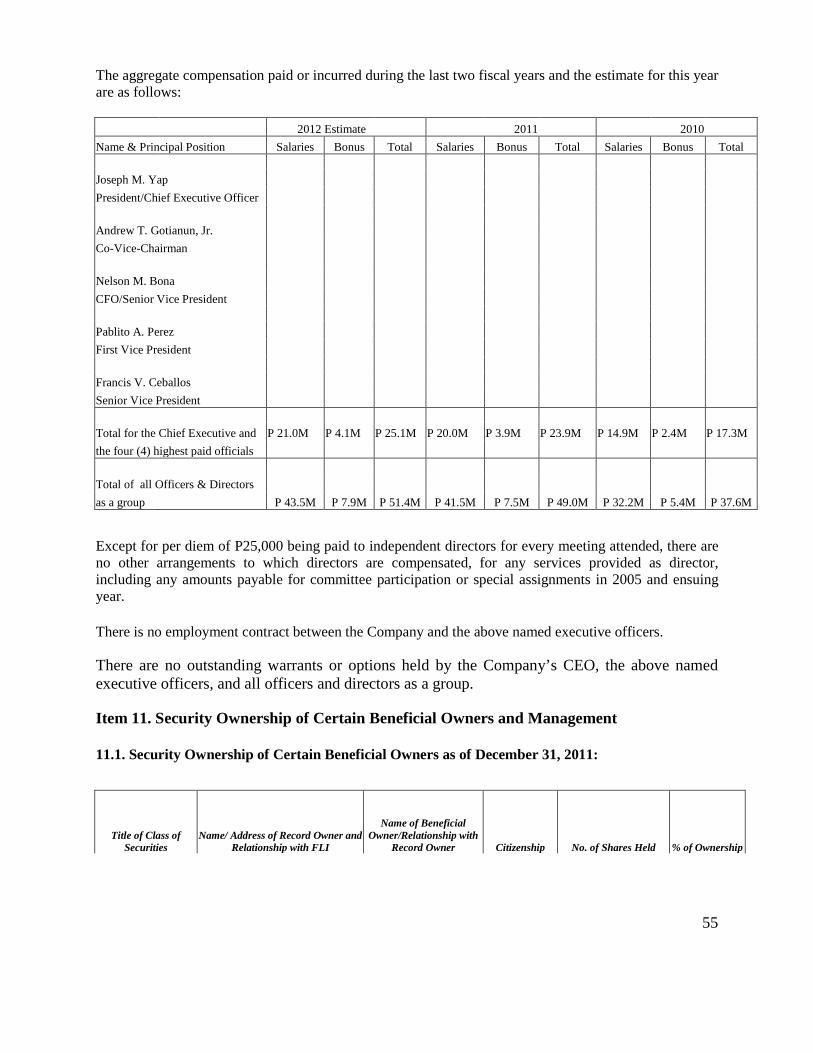
55
The aggregate compensation paid or incurred during the last two fiscal years and the estimate for this year are as follows: 2012 Estimate 2011 2010 Name & Principal Position Salaries Bonus Total Salaries Bonus Total Salaries Bonus Total Joseph M. Yap President/Chief Executive Officer Andrew T. Gotianun, Jr. Co-Vice-Chairman Nelson M. Bona CFO/Senior Vice President Pablito A. Perez First Vice President Francis V. Ceballos Senior Vice President Total for the Chief Executive and P 21.0M P 4.1M P 25.1M P 20.0M P 3.9M P 23.9M P 14.9M P 2.4M P 17.3M the four (4) highest paid officials Total of all Officers & Directors as a group P 43.5M P 7.9M P 51.4M P 41.5M P 7.5M P 49.0M P 32.2M P 5.4M P 37.6M
Except for per diem of P25,000 being paid to independent directors for every meeting attended, there are no other arrangements to which directors are compensated, for any services provided as director, including any amounts payable for committee participation or special assignments in 2005 and ensuing year.
There is no employment contract between the Company and the above named executive officers.
There are no outstanding warrants or options held by the Company’s CEO, the above named executive officers, and all officers and directors as a group.
Item 11. Security Ownership of Certain Beneficial Owners and Management
11.1. Security Ownership of Certain Beneficial Owners as of December 31, 2011:
Title of Class of Securities
Name/ Address of Record Owner and Relationship with FLI
Name of Beneficial Owner/Relationship with
Record Owner Citizenship No. of Shares Held % of Ownership

56
Preferred Filinvest Development Corporation 173 P. Gomez St. San Juan, M.Mla.
N.A. Filipino 8,000,000,000 ( R ) 100%
Common Filinvest Development Corporation N.A. Filipino 12,969,648,868 ( R ) 53.00%
Common PCD Nominee Corporation (Non-Filipino)
Total Shares Non-Filipino 6,114,525,921 ( R ) 24.99%
G/F, Philippine Stock Exchange Tower, Ayala Ave., Makati City
Common PCD Nominee Corporation (Filipino) G/F, Philippine Stock ExchangeTower, Ayala Avenue, Makati City
(No single shareholder owns at least 5% of total shares)
Filipino 4,831,724,132 ( R ) 19.74%
Total number of shares of all record and beneficial owners as a group is 8,000,000,000 preferred shares representing 100% of the total outstanding preferred shares, and 24,249,759,506 common shares representing 100% of the total outstanding common shares. Ms. Josephine G. Yap is usually appointed by Filinvest Development Corporation (“FDC”) as its representative with authority to vote FDC’s shares in stockholders’ meetings of FLI. 11.2. Security Ownership of Management as of December 31, 2011
Class of Securities Name and Address
Amount and Nature of
Ownership Citizenship % of Ownership
Common Andrew L. Gotianun, Sr. 76 (D) Negligible 173 P. Gomez St. San Juan MM 962 ( I ) Filipino
Common Andrew T. Gotianum Jr. 406,571 (D) " 173 P. Gomez St. San Juan MM 1,025 ( I ) Filipino
Common Joseph M. Yap 2,781,829 (D) " 173 P. Gomez St. San Juan MM Filipino
Common Lourdes Josephine G. Yap 76 (D) " 173 P. Gomez St. San Juan MM 6 ( I ) Filipino
Common Jonathan T. Gotianum 61 (D) " 173 P. Gomez St. San Juan MM 6 ( I ) Filipino
Common Michael Edward T. Gotianum 11,235,913 (D) " 173 P. Gomez St. San Juan MM 25,207,590 ( I ) Filipino

57
Common Efren C. Gutierrez 13,083 (D) " 173 P. Gomez St. San Juan MM 2,177,463 ( I ) Filipino
Common Lamberto U. Ocampo 1 (D) " 173 P. Gomez St. San Juan MM Filipino
Common Cornelio C. Gison 1 (D) " c/o 173 P. Gomez St. San Juan MM Filipino
Common Cirilo T. Tolosa 1 (D) " c/o 173 P. Gomez St. San Juan MM Filipino
Common Joseph and Josephine Yap 7,694,843 (D) " 173 P. Gomez St. San Juan MM 1,506,800 ( I ) Filipino
Common Andrew L. Gotianun, Sr. and/or Mercedes 18,022,477 (D) Filipino " T. Gotianun 173 P. Gomez St. San Juan MM
Common Luis T. Fernandez 4,064,940 (D) Filipino " 173 P. Gomez St. San Juan MM 98,927 ( I ) Total ownership of all directors and officers as a group is 0.17%. Interests of the above directors/executive officers in the Company’s common shares are direct.
a) No person holds more than 5% of the common stock under a voting trust or similar agreement. b) There has been no change in control of FLI since the beginning of last year.
11.3. Voting Trust Holders of 5% or more There are no persons holding 5% or more of a class of shares under any voting trust or similar agreement. 11.4. Changes in Control There are no arrangements that may result in change in control of the Company.
Item 12. CERTAIN RELATIONSHIPS AND RELATED TRANSACTIONS
The Company and its subsidiaries, in their normal course of business, have certain related party transactions with affiliates principally consisting of advances and intercompany charges.
Please refer to the Detailed Discussion on the Company’s Subsidiaries, Joint Ventures, Affiliate and Related Party Transactions in Section 1.3, 1.4, 1.5 and 1.11, respectively. PART lV - COMPLIANCE WITH LEADING PRACTICES ON CORPORATE GOVERNANCE
FLI’s Manual on Corporate Governance was approved on August 29, 2002 in order to monitor and assess the FLI’s compliance with leading practices on good corporate governance as specificied in its Corporate Governance Manual and Philippine SEC circulars. The Manual on Corporate Governance highlights areas for compliance improvement and sets out actions to be taken by FLI. FLI submits a certificate attesting to compliance with the Manual to the Philippine SEC and the PSE before the end of each year. FLI began submitting the certificate of compliance to the Philippine SEC and the PSE in 2003.
FLI is in substantial compliance with its Manual for Corporate Governance as demonstrated by the following: (a) the election of two (2) independent directors to the Board; (b) the appointment of members

58
of the audit, nomination and compensation committees; (c) the conduct of regular quarterly board meetings and special meetings, the faithful attendance of the directors at these meetings and their proper discharge of duties and responsibilities as such directors; (d) the submission to the SEC of reports and disclosures required under the Securities Regulation Code; (e) FLI’s adherence to national and local laws pertaining to its operations; and (f) the observance of applicable accounting standards by FLI. In order to keep itself abreast with the leading practices on corporate governance, FLI encourages the members of top level management and the Board to attend and participate at seminars on corporate governance initiated by accredited institutions. Furthermore, FLI has also raised its level of reporting to adopt and implement prescribed International Accounting Standards. On February 28, 2011, FLI has filed a Revised Manual on Corporate Governance in compliance with the directive of the SEC on additional mandatory provisions to be incorporated thereto. FLI welcomes proposals, especially from institutions and entities such as the SEC, PSE and the Institute of Corporate Directors, to improve corporate governance. There is no known material deviation from FLI’s Revised Manual on Corporate Governance. PART V – EXHIBITS AND SCHEDULES
Item 13. EXHIBITS AND REPORTS ON SEC Form 12-C
a) Exhibits
Exhibits as indicated in the Index to Exhibits are either not applicable to the Company or require no answer.
b) Reports on SEC Form 17-C
The following reports on SEC Form 17-C were filed during the last six-month period of 2011:
Report Items Reported Date
13-Jun-11 Informing SEC, that the Corporation's executive committee has approved on June 09, 2011 the Corporation's plan to issue and float via public offering of a five (5) years and three (3) months unsecured fixed-rate peso denominated debt securities (Retail Bonds) with an aggregate principal amount of up to P 3 Billion. Proceeds of the Retail Bonds issuance will be used by the Corporation to additionally finance capital requirements for 2011.
27-Jun-11 Circulation of press release entitled "Filinvest Land Inc., gets approval for P 3 Billion Fixed Rate Bonds" which announced that the SEC hqas issued a "Certificate of Permit to Offer Securities for Sale" for its P 3 billion bonds.
7-Jul-11 Circulation of press release entitled "Filinvest Land Raises P 3 billion from Bonds" which announced that FLI succesfully raised P 3 billion from its retail bonds which closed ojn June 30 and was issued on July 7, 2011. The bonds have a term of five years and three months and have a yield of 6.1962% per annum.

59
12-Aug-11 Circulation of a pressw release entitled "Filinvest Land's First Half 2011 Net Income Jumps 28%" which announced that FLI's net income for the first half of 2011 jumped by 28% year-on-year to P 1.282 billion, from P 988 million during the same period in 2010.
11-Nov-11 Circulation of press release entitled "Filinvest Land's Net Income for the First Nine Months of 2011 Increases by 15%" which announced that FLI reported that its core net income increased by 15% for the first nine months of 2011 to P 1.661 billion, from P 1.45 billion during the same period in 2010.
17-Nov-11 Informing SEC that the Philippine Dealing and Exchange Corp. (PDEx) has approved the listing of the 5-year and 3-month P 3 billion fixed rate bonds issued by Filinvest Land, Inc. The said listing shall be effective November 29, 2011.
7-Dec-11 Circulation of a press release entitled "Filinvest Land Expands its BPO Office Portfolio" which announced that FLI remains very bullish on the BPO sector and is rapidly expanding its office portfolio to meet the needs of the industry. FLI announced that it has completed the construction of its latest BPO office building at Northgate Cyberzone in Filinvest Coprorate City, Alabang. Vector Two is being turned ovver for tenant fit outs and is expected to start contribbuting to revenues starting in January 2012.
INDEX TO FINANCIAL STATEMENTS AND SUPPLEMENTARY SCHEDULES
Form 17 A, Item 7
Consolidated Financial Statements Statement of Management’s Responsibility for Financial Statements Report of Independent Public Accountant Report of Independent Auditors on Supplementary Schedules Consolidated Balance Sheets as of December 31, 2011 and 2010 Consolidated Statement of Income and Retained Earnings for the years ended December 31, 2011, 2010 and 2009 Consolidated Statements of Cash Flows for the years ended December 31, 2011, 2010 and 2009

60
Notes to Consolidated Financial Statements
Supplementary Schedules A. Marketable Securities (Cash Equivalents) See Note 6, page 34 * B. Accounts Receivable from Directors, Officers, Employees, Related Parties and Principal Stockholders See Note 8, page 36-37 * C. Investment in Securities See Note 10, page 38-39 * D. Advances to Unconsolidated Subsidiaries and Affiliates See Note 18, page 47-49 * E. Property, Plant and Equipment See Note 12 & 13 page 40-42 * F. Accumulated Depreciation See Note 12 &13, page 40-42 * G. Intangible Assets – Other Assets See Note 14, page 42 * H. Long-Term Debt See Note 16, page 43-46 * I. Bonds Payable See Note 17, page 47 * J. Indebtedness to Affiliates and Related Parties (Long-Term Loans from Related Companies) See Note 18, page 47-49 * K Guarantees of Securities of Other Issuers See Note 18, page 47-49 * L. Capital Stock See Note 26, page 54-55 * * Accompanying Notes to Audited Consolidated Financial Statements

SIGNATURES
PumunttollErequiremcntsofselionlToffiecodcandscctiotrl4lofdecor?omtioncode.rhh Epod is sisned on behalfof the isuer by ihe undeEi8n€d. therunlo duly audDtiad, in lheCiry ofsd Juan, Metro Mdila on April ,2012.
ColpoBte Infomoi'on Offi(c.
suBs(RrBr DAN'|D.woRNroo"r"*r" 'h ' .2 7 APR ?0l#"ntserrr ibinieror. ie 'Conmu.ity Td Cedificotcs {d /or driveE license. as follows:
CdtNo. Dll€ oflsstr.
5544t52 2/27^255A4157 2n1h2
Drivd s Lisse EOI-05 001056
AIILIO L. S EDO
Not. Coc No. 52 ?0t0UnrilDccm5.:31.2012
t3DodaAii.ii Sr.IrtlxcotiveHonrs.BrS
ldiri!.CjrylllP o.ll. N.. 2?71,1-./l-3la/F&ev
P',lli i\c. 95?il97l r1 | t! t:t,r.nilu.I i c l lN . . l3 lJ? 59


*SGVMC116622*
INDEPENDENT AUDITORS’ REPORT The Stockholders and the Board of Directors Filinvest Land, Inc. 173 P. Gomez Street San Juan, Metro Manila We have audited the accompanying consolidated financial statements of Filinvest Land, Inc. and its subsidiaries, which comprise the consolidated statements of financial position as at December 31, 2011 and 2010, and the consolidated statements of income, statements of comprehensive income, statements of changes in equity and statements of cash flows for each of the three years in the period ended December 31, 2011, and a summary of significant accounting policies and other explanatory information. Management’s Responsibility for the Consolidated Financial Statements Management is responsible for the preparation and fair presentation of these consolidated financial statements in accordance with Philippine Financial Reporting Standards, and for such internal control as management determines is necessary to enable the preparation of consolidated financial statements that are free from material misstatement, whether due to fraud or error. Auditors’ Responsibility Our responsibility is to express an opinion on these consolidated financial statements based on our audits. We conducted our audits in accordance with Philippine Standards on Auditing. Those standards require that we comply with ethical requirements and plan and perform the audit to obtain reasonable assurance about whether the consolidated financial statements are free from material misstatements. An audit involves performing procedures to obtain audit evidence about the amounts and disclosures in the consolidated financial statements. The procedures selected depend on the auditor’s judgment, including the assessment of the risks of material misstatement of the consolidated financial statements, whether due to fraud or error. In making those risk assessments, the auditor considers internal control relevant to the entity’s preparation and fair presentation of the consolidated financial statements in order to design audit procedures that are appropriate in the circumstances, but not for the purpose of expressing an opinion on the effectiveness of the entity’s internal control. An audit also includes evaluating the appropriateness of accounting policies used and the reasonableness of accounting estimates made by management, as well as evaluating the overall presentation of consolidated financial statements. We believe that the audit evidence we have obtained is sufficient and appropriate to provide a basis for our audit opinion.
SyCip Gorres Velayo & Co. 6760 Ayala Avenue 1226 Makati City Philippines
Phone: (632) 891 0307 Fax: (632) 819 0872 www.sgv.com.ph BOA/PRC Reg. No. 0001, January 25, 2010, valid until December 31, 2012 SEC Accreditation No. 0012-FR-2 (Group A), February 4, 2010, valid until February 3, 2013
A member firm of Ernst & Young Global Limited

*SGVMC116622*
- 2 - Opinion In our opinion, the consolidated financial statements present fairly, in all material respects, the financial position of Filinvest Land, Inc. and its subsidiaries as at December 31, 2011 and 2010, and their financial performance and their cash flows for each of the three years in the period ended December 31, 2011 in accordance with Philippine Financial Reporting Standards. SYCIP GORRES VELAYO & CO. Michael C. Sabado Partner CPA Certificate No. 89336 SEC Accreditation No. 0664-AR-1 (Group A), March 11, 2011, valid until March 10, 2014 Tax Identification No. 160-302-865 BIR Accreditation No. 08-001998-73-2009, June 1, 2009, valid until May 31, 2012 PTR No. 3174824, January 2, 2012, Makati City March 14, 2012

*SGVMC116622*
INDEPENDENT AUDITORS’ REPORT ON SUPPLEMENTARY SCHEDULES The Stockholders and the Board of Directors Filinvest Land, Inc. 173 P. Gomez Street San Juan, Metro Manila We have audited in accordance with Philippine Standards on Auditing, the consolidated financial statements of Filinvest Land, Inc. and its subsidiaries (the Group) as at and for the years ended December 31, 2011 and 2010 and for each of the three years in the period ended December 31, 2011 included in this Form 17-A and have issued our report thereon dated March 14, 2012. Our audits were made for the purpose of forming an opinion on the basic consolidated financial statements taken as a whole. The schedules listed in the Index to Consolidated Financial Statements and Supplementary Schedules are the responsibility of the Group’s management. These schedules are presented for purposes of complying with the Securities Regulation Code Rule 68, as Amended (2011) and are not part of the basic consolidated financial statements. These schedules have been subjected to the auditing procedures applied in the audit of the basic consolidated financial statements and, in our opinion, fairly state, in all material respects, the financial data required to be set forth therein in relation to the basic consolidated financial statements taken as a whole. SYCIP GORRES VELAYO & CO. Michael C. Sabado Partner CPA Certificate No. 89336 SEC Accreditation No. 0664-AR-1 (Group A), March 11, 2011, valid until March 10, 2014 Tax Identification No. 160-302-865 BIR Accreditation No. 08-001998-73-2009, June 1, 2009, valid until May 31, 2012 PTR No. 3174824, January 2, 2012, Makati City March 14, 2012
SyCip Gorres Velayo & Co. 6760 Ayala Avenue 1226 Makati City Philippines
Phone: (632) 891 0307 Fax: (632) 819 0872 www.sgv.com.ph BOA/PRC Reg. No. 0001, January 25, 2010, valid until December 31, 2012 SEC Accreditation No. 0012-FR-2 (Group A), February 4, 2010, valid until February 3, 2013
A member firm of Ernst & Young Global Limited

*SGVMC116622*
FILINVEST LAND, INC. AND SUBSIDIARIES CONSOLIDATED STATEMENTS OF FINANCIAL POSITION (Amounts in Thousands of Pesos) December 31 2011 2010
ASSETS Cash and cash equivalents (Notes 4, 6, 18, 19 and 29) P=1,153,306 P=1,758,725 Contracts receivable (Notes 4, 7, and 29) 8,452,908 7,845,871 Due from related parties (Notes 18, and 29) 246,757 185,922 Other receivables (Notes 4, 8, 19 and 29) 2,483,014 1,603,566 Financial assets at fair value through other comprehensive
income (Notes 2, 3, 10 and 29) 24,626 – Available-for-sale financial assets (Notes 3, 10 and 29) – 123,070 Real estate inventories (Notes 9 and 19) 19,064,138 15,141,005 Land and land development (Notes 4, 9 and 19) 14,091,543 12,807,811 Investment in an associate (Notes 11 and 27) 3,799,798 4,276,391 Investment properties (Notes 3, 4, 12 and 19) 12,201,609 11,599,167 Property and equipment (Notes 3, 4, and 13) 1,289,870 1,474,952 Deferred income tax assets (Notes 19 and 28) 18,071 15,312 Other assets (Notes 4, 14 and 19) 909,248 467,703 Goodwill (Notes 1, 3 and 4) 4,567,242 4,567,242
P=68,302,130 P=61,866,737
LIABILITIES AND EQUITY
Liabilities Accounts payable and accrued expenses
(Notes 4, 7, 15, 19 and 29) P=6,154,962 P=6,340,028 Income tax payable (Notes 4 and 28) 183,208 163,870 Loans payable (Notes 4, 16, 19 and 29) 8,511,007 6,961,167 Bonds payable (Notes 17 and 29) 7,977,009 4,949,241 Due to related parties (Notes 18, 19 and 29) 48,411 82,643 Retirement liabilities (Notes 3 and 24) 59,208 48,440 Deferred income tax liabilities - net (Notes 4 and 28) 1,687,326 1,630,097 Total Liabilities 24,621,131 20,175,486
Equity Common stock (Notes 1 and 26) 24,470,708 24,470,708 Preferred stock (Note 26) 80,000 80,000 Additional paid-in capital 5,612,321 5,612,321 Treasury stock (Note 26) (221,041) (221,041) Retained earnings (Note 26) 13,379,836 11,390,088 Revaluation reserve on financial assets at fair value through
other comprehensive income (Notes 2 and 10) (2,619) − Revaluation reserve on available-for-sale
financial assets (Note 10) − (2,619) Share in other components of equity of an associate (Note 11) 361,794 361,794 Total Equity 43,680,999 41,691,251
P=68,302,130 P=61,866,737 See accompanying Notes to Consolidated Financial Statements.

*SGVMC116622*
FILINVEST LAND, INC. AND SUBSIDIARIES CONSOLIDATED STATEMENTS OF INCOME (Amounts in Thousands of Pesos, Except Earnings Per Share Figures) Years Ended December 31 2011 2010 2009
REVENUE (Note 19) Real estate sales P=6,953,469 P=5,652,374 P=3,674,751 Rental services (Notes 12 and 25) 1,528,290 1,411,269 1,187,442
EQUITY IN NET EARNINGS OF AN ASSOCIATE (Note 11) 63,407 55,217 37,527
OTHER INCOME Interest income (Notes 7 and 22) 542,113 565,355 400,708 Foreign currency exchange gain - net 1,304 8,565 2,404 Gain from remeasurement of previously held interest
in a business combination (Note 4) − 517,240 − Excess of fair value of net identifiable assets over
consideration transferred in a business combination (Note 4) − 9,058 −
Others (Notes 18 and 23) 564,101 502,952 380,981 9,652,684 8,722,030 5,683,813
COSTS (Note 19) Real estate sales 3,612,285 2,996,824 1,788,853 Rental services 425,653 400,884 374,604
OPERATING EXPENSES General and administrative expenses
(Notes 20 and 24) 920,892 800,104 665,386 Selling and marketing expenses (Note 21) 742,408 593,588 480,215
INTEREST AND OTHER FINANCE CHARGES (Notes 16, 17 and 22) 469,400 416,655 208,281
6,170,638 5,208,055 3,517,339
INCOME BEFORE INCOME TAX 3,482,046 3,513,975 2,166,474
PROVISION FOR (BENEFIT FROM) INCOME TAX (Notes 19 and 28)
Current 488,062 475,029 253,351 Deferred 53,644 86,720 (105,077) 541,706 561,749 148,274
NET INCOME (Note 27) P=2,940,340 P=2,952,226 P=2,018,200
EARNINGS PER SHARE (Note 27) Basic / Diluted P=0.12 P=0.12 P=0.09 See accompanying Notes to Consolidated Financial Statements.
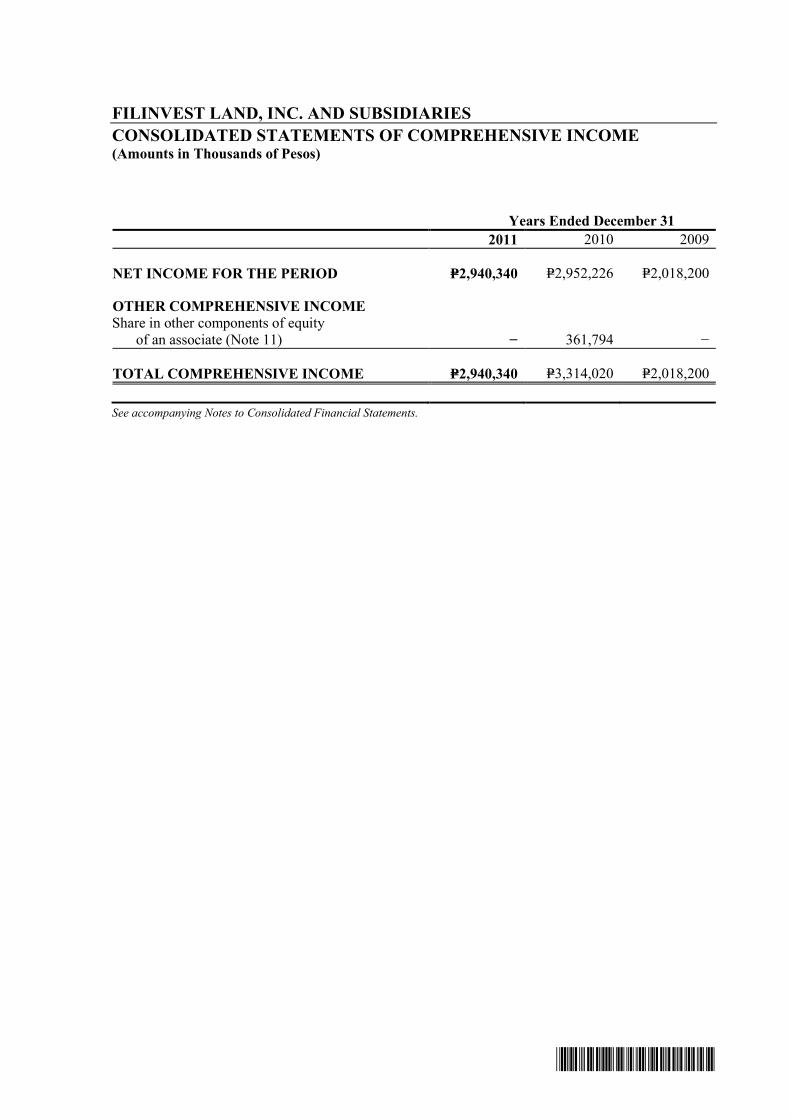
*SGVMC116622*
FILINVEST LAND, INC. AND SUBSIDIARIES CONSOLIDATED STATEMENTS OF COMPREHENSIVE INCOME (Amounts in Thousands of Pesos) Years Ended December 31 2011 2010 2009
NET INCOME FOR THE PERIOD P=2,940,340 P=2,952,226 P=2,018,200
OTHER COMPREHENSIVE INCOME Share in other components of equity
of an associate (Note 11) − 361,794 −
TOTAL COMPREHENSIVE INCOME P=2,940,340 P=3,314,020 P=2,018,200 See accompanying Notes to Consolidated Financial Statements.

*SGVMC116622*
FILINVEST LAND, INC. AND SUBSIDIARIES CONSOLIDATED STATEMENTS OF CHANGES IN EQUITY (Amounts in Thousands of Pesos)
Common Stock
(Note 26)
Preferred Stock
(Note 26)
Additional Paid-in Capital
Treasury Stock
(Note 26) Retained Earnings
Revaluation reserve on Financial
Assets at FVTOCI
(Note 10)
Revaluation Reserve on
Available-for-sale Financial
Assets (Note 10)
Share in Revaluation
Increment on Land at
Deemed Cost of an Associate
(Note 11)
Share in Other
Components of Equity of
an Associate (Note 11) Total
For the Year Ended December 31, 2011 Balances as of December 31, 2010,
as previously stated P=24,470,708 P=80,000 P=5,612,321 (P=221,041) P=9,513,666
P=− (P=2,619) P=1,876,422 P=361,794 P=41,691,251 Reclassification of share in revaluation increment
on land at deemed cost of an associate − − − − 1,876,422
− − (1,876,422) − − Balances as of December 31, 2010, after
reclassification 24,470,708 80,000 5,612,321 (221,041) 11,390,088 − (2,619) − 361,794 41,691,251
Effect of initial application of PFRS 9 (Note 2) − − − − − (2,619) 2,619 − − − Balances as of January 1, 2011 24,470,708 80,000 5,612,321 (221,041) 11,390,088 (2,619) − − 361,794 41,691,251 Comprehensive income Net income for the year − − − − 2,940,340 − − − − 2,940,340 Dividends (Note 26) − − − − (950,592) − − − − (950,592) Balances as of December 31, 2011 P=24,470,708 P=80,000 P=5,612,321 (P=221,041) P=13,379,836 (P=2,619) P=− P=− P=361,794 P=43,680,999
For the Year Ended December 31, 2010 Balances as of December 31, 2009 P=24,470,708 P=80,000 P=5,612,321 (P=221,041) P=7,361,682 P=− (P=2,619) P=1,876,422 P=− P=39,177,473 Reclassification of share in revaluation increment
on land at deemed cost of an associate − − − − 1,876,422 − − (1,876,422) − − Balances as of December 31, 2009, after
reclassification 24,470,708 80,000 5,612,321 (221,041) 9,238,104 − (2,619) − − 39,177,473 Comprehensive income: Net income for the year − − − − 2,952,226 − − − − 2,952,226 Share in other components of equity of an
associate (Note 11) − − − − − − − − 361,794 361,794 Total comprehensive income − − − − 2,952,226 − − − 361,794 3,314,020 Dividends (Note 26) − − − − (800,242) − − − − (800,242) Balances as of December 31, 2010 P=24,470,708 P=80,000 P=5,612,321 (P=221,041) P=11,390,088 P=− (P=2,619) P=− P=361,794 P=41,691,251

- 2 -
*SGVMC116622*
Common Stock
(Note 26)
Preferred Stock
(Note 26)
Additional Paid-in Capital
Treasury Stock
(Note 26) Retained Earnings
Revaluation reserve on
Financial Assets at FVTOCI
(Note 10)
Revaluation Reserve on
Available-for-sale Financial
Assets (Note 10)
Share in Revaluation
Increment on Land at
Deemed Cost of an Associate
(Note 11)
Share in Other
Components of Equity of
an Associate (Note 11) Total
For the Year Ended December 31, 2009 Balances as of January 1, 2009 P=24,470,708 P=80,000 P=5,612,321 (P=221,041) P=6,143,724 P=− (P=2,619) P=1,876,422 P=− P=37,959,515 Reclassification of share in revaluation increment
on land at deemed cost of an associate − − − − 1,876,422 − − (1,876,422) − − Balances as of January 1, 2009,
after reclassification 24,470,708 80,000 5,612,321 (221,041) 8,020,146 − (2,619) − − 37,959,515 Comprehensive income: Net income for the year − − − − 2,018,200 − − − − 2,018,200 Dividends (Note 26) − − − − (800,242) − − − − (800,242) Balances as of December 31, 2009 P=24,470,708 P=80,000 P=5,612,321 (P=221,041) P=9,238,104 P=− (P=2,619) P=− P=− P=39,177,473
See accompanying Notes to Consolidated Financial Statements.

*SGVMC116622*
FILINVEST LAND, INC. AND SUBSIDIARIES CONSOLIDATED STATEMENTS OF CASH FLOWS (Amounts in Thousands of Pesos) Years Ended December 31 2011 2010 2009
CASH FLOWS FROM OPERATING ACTIVITIES Income before income tax P=3,482,046 P=3,513,975 P=2,166,474 Adjustments for: Interest income (Note 22) (542,113) (565,355) (400,708) Interest expense (Note 22) 445,482 377,537 179,930 Depreciation and amortization (Notes 12 and 13) 287,120 269,398 247,479 Equity in net earnings of an associate (Note 11) (63,407) (55,217) (37,527) Loss on redemption of financial assets at fair value through other comprehensive income 1,782 − − Dividend income (51) (772) (1,548) Excess of fair value of net identifiable assets
over consideration transferred in a business combination (Note 4) − (9,058) −
Gain from remeasurement of previously held interest in a business combination (Note 4) − (517,240) −
Gain on sale of investment property (Note 12) − − (14,454) Operating income before changes in operating assets
and liabilities 3,610,859 3,013,268 2,139,646 Changes in operating assets and liabilities Decrease (increase) in: Contracts receivable (607,037) (183,205) 201,038 Due from related parties (60,835) 42,636 (105,276) Other receivables (879,448) (163,173) 163,270 Real estate inventories (4,153,392) (2,673,950) (1,429,335) Other assets (277,700) 3,365 (74,753) Increase (decrease) in: Accounts payable and accrued expenses 196,609 (351,777) (121,951) Retirement liabilities (Note 24) 10,768 11,042 4,707 Net cash generated from (used in) operations (2,160,176) (301,794) 777,346 Interest received 544,780 572,311 390,927 Income taxes paid (522,368) (384,929) (291,230) Dividends received 51 772 1,548 Net cash provided by (used in) operating activities (2,137,713) (113,640) 878,591
CASH FLOWS FROM INVESTING ACTIVITIES Acquisitions of raw land (1,053,473) (762,241) (506,713) Acquisitions of investment properties and property
and equipment (Notes 12 and 13) (804,171) (221,422) (163,678) Dividends received from associate (Note 11) 540,000 − − Proceeds from maturity of financial assets at fair value
through other comprehensive income (Note 10) 93,662 − − Proceeds from maturity of available-for-sale
securities (Note 10) − 242,172 − Acquisitions of available-for-sale securities (Note 10) − (95,444) (219,910) Proceeds from sale of investment properties (Note 12) − − 35,679 Acquisition of businesses - net of cash acquired (Note 4) − (920,698) − Net cash used in investing activities (1,223,982) (1,757,633) (854,622) (Forward)

- 2 -
*SGVMC116622*
Years Ended December 31 2011 2010 2009
CASH FLOWS FROM FINANCING ACTIVITIES Proceeds from loans availment (Note 16) P=4,220,000 P=120,000 P=− Proceeds from bond offering (Note 17) 3,000,000 − 4,936,405 Payments of loans payable (Note 16) (2,652,667) (606,833) (61,600) Payments of cash dividend (Note 26) (950,592) (800,242) (800,242) Interest paid (826,233) (876,122) (571,783) Increase (decrease) in amounts due to related parties (34,232) 35,923 (202,495) Net cash provided by (used in) financing activities 2,756,276 (2,127,274) 3,300,285
NET INCREASE (DECREASE) IN CASH AND CASH EQUIVALENTS (605,419) (3,998,547) 3,324,254
CASH AND CASH EQUIVALENTS AT BEGINNING OF YEAR 1,758,725 5,757,272 2,433,018
CASH AND CASH EQUIVALENTS AT END OF YEAR P=1,153,306 P=1,758,725 P=5,757,272
See accompanying Notes to Consolidated Financial Statements.

*SGVMC116622*
FILINVEST LAND, INC. AND SUBSIDIARIES NOTES TO CONSOLIDATED FINANCIAL STATEMENTS 1. Corporate Information
Filinvest Land, Inc. (the Parent Company or FLI) is a property developer engaged mainly in the development of residential subdivisions, construction of housing units and leasing activities. It was incorporated and domiciled in the Philippines where its shares are publicly traded. Formerly Citation Homes, Inc., the Parent Company was incorporated on November 24, 1989 and later changed its name to the present one on July 12, 1993. The Parent Company and its Subsidiaries (collectively referred to as “the Group”) offer a range of real estate products from socialized and affordable housing to middle -income and high-end housing, various types of subdivision lots, medium-rise residential buildings, farm estates, industrial parks, residential resort projects, a private membership club and condominium buildings. The Group also leases out commercial spaces in a mall in Alabang, Muntinlupa City, as well as office spaces in Makati City and Alabang, Muntinlupa City. The Parent Company’s registered office address is 173 P. Gomez Street, San Juan City, Metro Manila.
The Group’s parent company is Filinvest Development Corporation (FDC), a publicly listed entity. ALG Holdings Corporation (ALG) is the Group’s ultimate parent company.
In September 2006, the Group entered into a series of transactions pursuant to which it acquired (1) 60% ownership interest in Filinvest Asia Corporation (FAC) from FDC; (2) 60% ownership interest in Cyberzone Properties, Inc. (CPI) from Filinvest Alabang, Inc. (FAI); and (3) Festival Supermall structure from FAI. In exchange for acquiring these assets, the Group issued a total of about 5.64 billion common shares to FDC and FAI and assumed P=2.50 billion outstanding debts of FDC and FAI. The business combinations resulted in the recognition of goodwill amounting to P=5.45 billion, which comprises the fair value of expected synergies arising from the acquisitions.
In September 2006, the Group also entered into a joint venture agreement with Africa Israel Investments (Phils.), Inc. (AIIPI) to undertake the development of a club and portion of a land in San Mateo, Rizal by incorporation of Filinvest AII Philippines Inc. (FAPI).
On February 8, 2010, the Parent Company acquired the remaining 40% interests in CPI from Africa-Israel Properties (Phils.), Inc. (AIPPI) and FAPI from Africa-Israel Investments (Phils.), Inc. (AIIPI) to obtain control from the previous joint ventures. Prior to the acquisition, the Parent Company accounted for its investments in the joint ventures under the proportionate consolidation. The acquisition resulted in CPI and FAPI becoming wholly-owned subsidiaries of the Parent Company. The acquisition of the joint ventures’ interests was accounted for as business combination (see Note 4).
The accompanying consolidated financial statements were approved and authorized for issue by the Board of Directors (BOD) on March 14, 2012.
2. Summary of Significant Accounting Policies
Basis of Preparation The accompanying consolidated financial statements are prepared using the historical cost basis, except for financial assets at fair value through other comprehensive income (FVTOCI) in 2011 and available-for-sale financial assets in 2010 that are measured at fair value. Amounts are in thousand pesos except as otherwise indicated.

- 2 -
*SGVMC116622*
The Group’s consolidated financial statements are presented in Philippine Peso (Peso), which is also the functional currency, under Philippine Financial Reporting Standards (PFRS), of the Parent Company and its subsidiaries, joint ventures and an associate. Statement of Compliance The accompanying consolidated financial statements of the Group have been presented in compliance with PFRS.
Basis of Consolidation The consolidated financial statements include the accounts of the Parent Company and the following subsidiaries, and the corresponding percentages of ownership as at December 31:
2011 2010 2009 FAPI* 100% 100% − CPI* 100% 100% − Homepro Realty Marketing, Inc. (Homepro) 100% 100% 100% Property Maximizer Professional Corp. (Promax) 100% 100% 100% Property Specialist Resources, Inc. (Prosper) 100% 100% 100% Leisurepro, Inc. (Leisurepro) 100% 100% 100%
The Group’s share in the assets, liabilities and net income of the following joint ventures are proportionately consolidated into the Group’s consolidated financial statements:
2011 2010 2009 FAC 60% 60% 60% CPI* − − 60% FAPI* − − 60% *In 2010, CPI and FAPI became wholly-owned subsidiaries of the Parent Company (see Note 4).
These entities are treated as joint ventures despite the Group’s interest of above 50% due to the existence of contractual arrangements between the parties and certain special voting rights requiring consent from both the Group and the other venturers in making strategic and financial decisions.
The financial statements of the subsidiaries, joint ventures and associate are prepared for the same reporting period as the Parent Company using consistent accounting policies.
Subsidiaries are fully consolidated from the date of acquisition, being the date on which the Group obtains control, and continue to be consolidated until the date when such control ceases. All intra-group balances, transactions, unrealized gains and losses resulting from intra-group transactions and dividends are eliminated in full.
A change in the ownership interest of a subsidiary, without a loss of control, is accounted for as an equity transaction. If the Group loses control over a subsidiary, it:
• Derecognizes the assets (including goodwill) and liabilities of the subsidiary • Recognizes the fair value of the consideration received • Recognizes the fair value of any investment retained • Recognizes any surplus or deficit in profit or loss • Reclassifies the Group’s share of components previously recognized in other comprehensive
income to profit or loss or retained earnings, as appropriate.

- 3 -
*SGVMC116622*
Changes in Accounting Policies and Disclosures The accounting policies adopted are consistent with those of the previous financial year, except for the adoption of the following new and amended PFRS, Philippine Accounting Standards (PAS) and Philippine Interpretations of International Financial Reporting Interpretations Committee (IFRIC) which became effective on January 1, 2011, except for PFRS 9, Financial Instruments which is effective on January 1, 2015 but adopted by the Group starting on January 1, 2011. Except as otherwise indicated, the adoption of these new accounting standards and amendments have no material impact on the Group’s financial statements.
• PAS 24, Related Party Disclosures (Amended), clarifies the definition of a related party to
simplify the identification of such relationships and to eliminate inconsistencies in its application. The revised standard introduces a partial exemption of disclosure requirements for government-related entities. Early adoption is permitted for either the partial exemption for government-related entities or for the entire standard.
• PAS 32, Financial Instruments: Presentation (Amendment) – Classification of Rights Issues,
amended the definition of a financial liability in order to classify rights issues (and certain options or warrants) as equity instruments in cases where such rights are given pro rata to all of the existing owners of the same class of an entity’s non-derivative equity instruments, or to acquire a fixed number of the entity’s own equity instruments for a fixed amount in any currency.
• Philippine Interpretation IFRIC 14 (Amendment), Prepayments of a Minimum Funding
Requirement, provides guidance on assessing the recoverable amount of a net pension asset. The amendment permits an entity to treat the prepayment of a minimum funding requirement as an asset.
• Philippine Interpretation IFRIC 19, Extinguishing Financial Liabilities with Equity
Instruments, clarifies that equity instruments issued to a creditor to extinguish a financial liability qualify as consideration paid. The equity instruments issued are measured at their fair value. In case that this cannot be reliably measured, the instruments are measured at the fair value of the liability extinguished. Any gain or loss is recognized immediately in profit or loss.
• Improvements to PFRSs 2010
Improvements to PFRSs, an omnibus of amendments to standards, deal primarily with a view to removing inconsistencies and clarifying wording. The adoption of the following amendments resulted in changes to accounting policies but did not have any impact on the financial position or performance of the Group:
§ PFRS 3, Business Combinations § PFRS 7, Financial Instruments: Disclosures § PAS 1, Presentation of Financial Statements § PAS 27, Consolidated and Separate Financial Statements § Philippine Interpretation IFRIC 13, Customer Loyalty Programmes

- 4 -
*SGVMC116622*
Early Adoption of PFRS 9, Financial Instruments The impact on the financial statements of the Group’s adoption of PFRS 9 is described below: PFRS 9, Financial Instruments The International Accounting Standards Board (IASB) issued International Financial Reporting Standards 9, Financial Instruments in November 2009 and October 2010 relating to the classification and measurements of financial assets and financial liabilities, respectively. It was approved for adoption by the Financial Reporting Standards Council (FRSC) as PFRS 9, Financial Instruments (PFRS 9) in March 2010. The FRSC adopted requirements on the classification and measurement of financial assets in March 2010 and the requirements on the accounting for financial liabilities in November 2010. The Philippine Securities and Exchange Commission (SEC) has issued guidelines on the implementation of PFRS 9 on May 16, 2011 under SEC Memorandum Circular No. 3. The standard was originally effective for annual periods beginning on or after January 1, 2013, with early application permitted, but was amended to defer the mandatory effectivity date to January 1, 2015. The standard is applied retrospectively when adopted. For annual reporting periods beginning before January 1, 2012, an entity can choose not to restate the comparative periods.
The Group has early adopted PFRS 9 with date of initial application of January 1, 2011 for the following merits: (a) Adoption of PFRS 9 is inevitable, hence, adopting it in 2011 rather than later is operationally
more efficient; (b) This enables the Group to manage better its earnings and capital as the business model
approach introduced by PFRS 9 aims to align the accounting standards with the Group’s risk, capital, and asset-liability management practices; and
(c) Corollary to better managed earnings and capital is stability in the Group’s earnings.
These changes in accounting policy are applied from January 1, 2011 without restatement of prior periods’ financial statements. The Group chose to apply the limited exemption not to restate comparative information, thereby resulting in the following impact: • Comparative information for prior periods is not restated. The classification and measurement
requirements previously applied in accordance with PAS 39, Financial Instruments: Recognition and Measurement and disclosures required in PFRS 7, Financial Instruments: Disclosures) are retained for the comparative periods.
• The Group discloses the accounting policies for both the current period and the comparative periods, one applying PFRS 9 and one applying PAS 39.
• As comparative information is not restated, the Group is not required to provide a third statement of financial information at the beginning of the earliest comparative period in accordance with PAS 1, Presentation of Financial Statements.
The standard introduces new classification and measurement requirements for financial assets, which replaced the classification and measurement requirements previously included in PAS 39, Financial Instruments: Recognition and Measurement. PFRS 9 specifies how an entity should classify and measure its financial assets. It requires all financial assets to be classified in their entirety on the basis of the entity’s business model for managing the financial assets and the contractual cash flow characteristics of the financial assets. Financial assets are measured either at amortized cost or fair value.

- 5 -
*SGVMC116622*
Debt instruments are measured at amortized cost only if (i) the asset is held within a business model whose objective is to hold assets in order to collect contractual cash flows and (ii) the contractual terms of the financial asset give rise on specified dates to cash flows that are solely payments of principal and interest on the principal amount outstanding. If either of the two criteria is not met, the financial asset is classified as at fair value through profit or loss (FVTPL). Additionally, even if the asset meets the amortized cost criteria, the Group may choose at initial recognition to designate the financial asset at FVTPL if doing so eliminates or significantly reduces an accounting mismatch. Investments in equity instruments are classified and measured at FVTPL except if the equity investment is not held for trading and is designated by the Group at fair value through other comprehensive income (FVTOCI). If the equity investment is designated at FVTOCI, all gains and losses, except for dividend income recognized in accordance with PAS 18, Revenue, including disposal costs are recognized in other comprehensive income and are not subsequently reclassified to profit or loss. Impact of Change in Accounting Policy In accordance with the transition provisions of PFRS 9, the classification of financial assets that the Group held at the date of initial application was based on the facts and circumstances of the business model in which the financial assets were held at that date. Presented below are the effects in the Group’s financial statements as a result of the application of PFRS 9 beginning January 1, 2011:
Original Measurement Category Under PAS 39
New Measurement Category Under PFRS 9
Original Carrying
Amount under PAS 39
New Carrying Amount under
PFRS 9 Loans and receivables Cash and cash equivalents: Cash on hand and in banks Financial assets at
amortized cost P=486,179 P=486,179 Short-term deposits Financial assets at
amortized cost 667,127 667,127 Contracts receivable: Contracts receivable Financial assets at
amortized cost 8,085,680 8,085,680 Receivables from government and
financial institutions Financial assets at
amortized cost 367,228 367,228 Due from related parties Financial assets at
amortized cost 246,757 246,757 Other receivables: Receivable from homeowners’
association - net Financial assets at
amortized cost 109,136 109,136 Receivable from tenants - net Financial assets at
amortized cost 229,151 229,151 Others Financial assets at
amortized cost 99,552 99,552 Other assets (short-term deposits): Deposits Financial assets at
amortized cost 29,080 29,080 Total loans and receivables P=10,319,890 P=10,319,890
(Forward)

- 6 -
*SGVMC116622*
Original Measurement Category Under PAS 39
New Measurement Category Under PFRS 9
Original Carrying
Amount under PAS 39
New Carrying Amount under
PFRS 9 AFS financial assets Investments in shares of stocks: Quoted Financial assets at FVTOCI P=3,321 P=3,321 Unquoted Financial assets at FVTOCI 21,305 21,305 Total AFS financial assets 24,626 24,626 P=10,344,516 P=10,344,516 As a result of the adoption of PFRS 9, the balance of the revaluation reserve on available-for-sale financial assets in 2010 was reclassified into revaluation reserve on financial assets at fair value through other comprehensive income as at January 1, 2011. The adoption of PFRS 9 related to classification and measurement of financial liabilities has no material impact on the Group’s financial statements. As of December 31, 2011, the Group’s financial liabilities are classified and measured at amortized cost. Adoption of Philippine Interpretations Committee (PIC) Questions and Answers (Q&As) No. 2011-05 The Group adopted PIC Q&As No. 2011-05. This interpretation requires that revaluation increment resulting from the use of revalued amounts of property, plant and equipment as deemed cost at the date of transition to PFRS, should be closed out to the opening retained earnings in the financial statements at the earliest period presented and not to another equity category. Such amount closed to retained earnings shall not form part of retained earnings available for dividends distribution. Such transfer to retained earnings is a voluntary change in accounting policy and does not change any information previously provided to the financial statements users. In such case, the inclusion of an additional statement of financial position would not significantly influence the economic decisions of users in evaluating historical financial information and is not considered material to financial statements prepared in accordance with PFRS. In accordance with the general requirements under PFRS 1 and the above PIC Q&A, the Group closed out the ‘share in revaluation increment on land at deemed costs of an associate’ with a balance of P=1.88 billion as of January 1, 2009 to retained earnings. The ‘share in revaluation increment on land at deemed costs of an associate’ pertains to the remaining balance of the deemed cost adjustment on certain land properties of an associate which arose when the Group transitioned to PFRS in 2005. This adjustment to retained earnings has no effect on profit or loss and earnings per share for the years ended December 31, 2011, 2010 and 2009. The Group opted not to prepare an additional statement of financial position because the Group believes that such close out would not significantly influence the economic decisions of users of financial statements in evaluating historical financial information and is not considered material to financial statements prepared in accordance with PFRS.
Standards Issued but not yet Effective Standards, interpretations, amendments to standards and improvements to standards issued but not yet effective up to the date of issuances of the Group’s financial statements are listed below. The Group will adopt these standards and interpretations when these become effective. Except as otherwise indicated, the Group does not expect the adoption of these new and amended standards and interpretations to have significant impact on its consolidated financial statements.
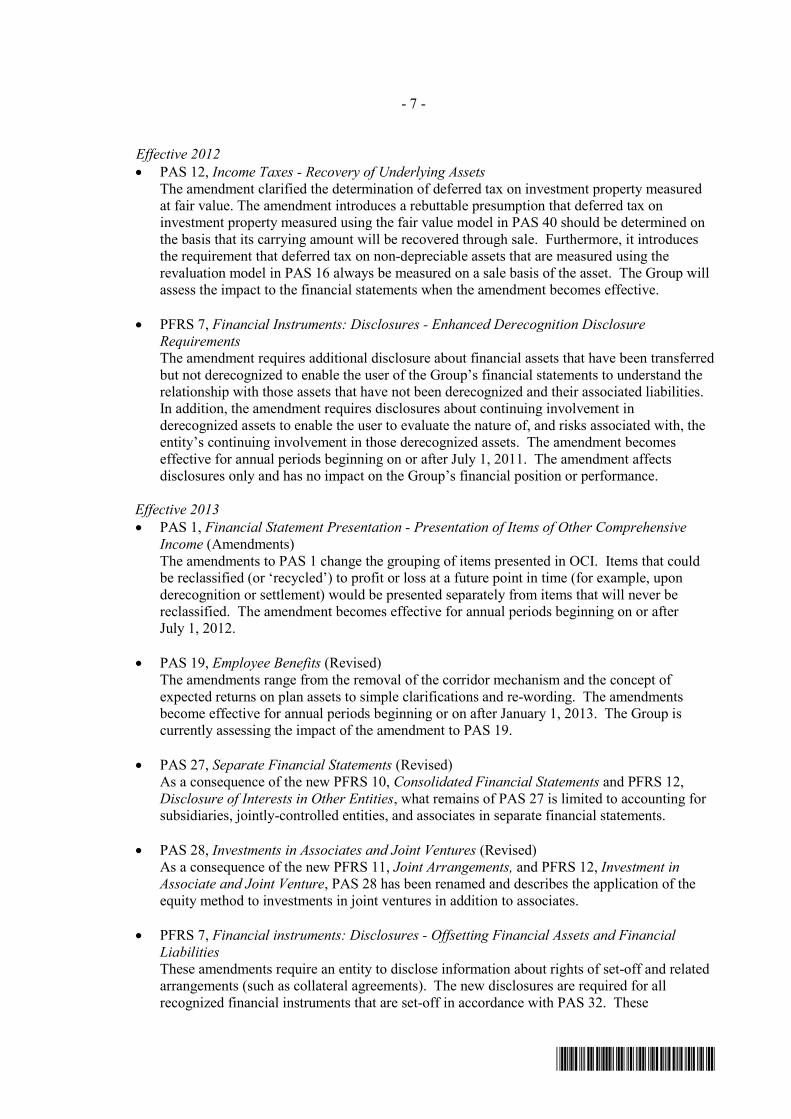
- 7 -
*SGVMC116622*
Effective 2012 • PAS 12, Income Taxes - Recovery of Underlying Assets
The amendment clarified the determination of deferred tax on investment property measured at fair value. The amendment introduces a rebuttable presumption that deferred tax on investment property measured using the fair value model in PAS 40 should be determined on the basis that its carrying amount will be recovered through sale. Furthermore, it introduces the requirement that deferred tax on non-depreciable assets that are measured using the revaluation model in PAS 16 always be measured on a sale basis of the asset. The Group will assess the impact to the financial statements when the amendment becomes effective.
• PFRS 7, Financial Instruments: Disclosures - Enhanced Derecognition Disclosure
Requirements The amendment requires additional disclosure about financial assets that have been transferred but not derecognized to enable the user of the Group’s financial statements to understand the relationship with those assets that have not been derecognized and their associated liabilities. In addition, the amendment requires disclosures about continuing involvement in derecognized assets to enable the user to evaluate the nature of, and risks associated with, the entity’s continuing involvement in those derecognized assets. The amendment becomes effective for annual periods beginning on or after July 1, 2011. The amendment affects disclosures only and has no impact on the Group’s financial position or performance.
Effective 2013 • PAS 1, Financial Statement Presentation - Presentation of Items of Other Comprehensive
Income (Amendments) The amendments to PAS 1 change the grouping of items presented in OCI. Items that could be reclassified (or ‘recycled’) to profit or loss at a future point in time (for example, upon derecognition or settlement) would be presented separately from items that will never be reclassified. The amendment becomes effective for annual periods beginning on or after July 1, 2012.
• PAS 19, Employee Benefits (Revised)
The amendments range from the removal of the corridor mechanism and the concept of expected returns on plan assets to simple clarifications and re-wording. The amendments become effective for annual periods beginning or on after January 1, 2013. The Group is currently assessing the impact of the amendment to PAS 19.
• PAS 27, Separate Financial Statements (Revised) As a consequence of the new PFRS 10, Consolidated Financial Statements and PFRS 12, Disclosure of Interests in Other Entities, what remains of PAS 27 is limited to accounting for subsidiaries, jointly-controlled entities, and associates in separate financial statements.
• PAS 28, Investments in Associates and Joint Ventures (Revised) As a consequence of the new PFRS 11, Joint Arrangements, and PFRS 12, Investment in Associate and Joint Venture, PAS 28 has been renamed and describes the application of the equity method to investments in joint ventures in addition to associates.
• PFRS 7, Financial instruments: Disclosures - Offsetting Financial Assets and Financial Liabilities These amendments require an entity to disclose information about rights of set-off and related arrangements (such as collateral agreements). The new disclosures are required for all recognized financial instruments that are set-off in accordance with PAS 32. These

- 8 -
*SGVMC116622*
disclosures also apply to recognized financial instruments that are subject to an enforceable master netting arrangement or ‘similar agreement’, irrespective of whether they are set-off in accordance with PAS 32. The amendments require entities to disclose, in a tabular format unless another format is more appropriate, the following minimum quantitative information. This is presented separately for financial assets and financial liabilities recognized at the end of the reporting period:
a. The gross amounts of those recognized financial assets and recognized financial liabilities; b. The amounts that are set-off in accordance with the criteria in PAS 32 when determining
the net amounts presented in the statement of financial position; c. The net amounts presented in the statement of financial position; d. The amounts subject to an enforceable master netting arrangement or similar agreement
that are not otherwise included in (b) above, including: i. Amounts related to recognized financial instruments that do not meet some or all of
the offsetting criteria in PAS 32; and ii. Amounts related to financial collateral (including cash collateral); and
e. The net amount after deducting the amounts in (d) from the amounts in (c) above.
• PFRS 10, Consolidated Financial Statements PFRS 10 replaces the portion of PAS 27 that addresses the accounting for consolidated financial statements. It also includes the issues raised in SIC-12, Consolidation-Special Purpose Entities. PFRS 10 establishes a single control model that applies to all entities including special purpose entities. The changes introduced by PFRS 10 will require management to exercise significant judgment to determine which entities are controlled, and therefore, are required to be consolidated by a parent, compared with the requirements that were in PAS 27. The Group is currently assessing the impact of the amendment.
• PFRS 11, Joint Arrangements
PFRS 11 replaces PAS 31, Interests in Joint Ventures and SIC-13, Jointly-Controlled Entities - Non-monetary Contributions by Venturers. PFRS 11 removes the option to account for jointly-controlled entities (JCEs) using proportionate consolidation. Instead, JCEs that meet the definition of a joint venture must be accounted for using the equity method.
• PFRS 12, Disclosures of Interests in Other Entities PFRS 12 includes all of the disclosures that were previously in PAS 27 related to consolidated financial statements, as well as all of the disclosures that were previously included in PAS 31 and PAS 28. These disclosures relate to an entity’s interests in subsidiaries, joint arrangements, associates and structured entities. A number of new disclosures are also required.
• PFRS 13, Fair Value Measurement
PFRS 13 establishes a single source of guidance under IFRS for all fair value measurements. PFRS 13 does not change when an entity is required to use fair value, but rather provides guidance on how to measure fair value under PFRS when fair value is required or permitted.

- 9 -
*SGVMC116622*
Effective 2014 • PAS 32, Financial Instruments: Presentation - Offsetting Financial Assets and Financial
Liabilities These amendments to PAS 32 clarify the meaning of “currently has a legally enforceable right to set-off” and also clarify the application of the PAS 32 offsetting criteria to settlement systems (such as central clearing house systems) which apply gross settlement mechanisms that are not simultaneous. While the amendment is expected not to have any impact on the net assets of the Group, any changes in offsetting is expected to impact leverage ratios and regulatory capital requirements. The amendments to PAS 32 are to be retrospectively applied for annual periods beginning on or after January 1, 2014. The Group is currently assessing impact of the amendments to PAS 32.
Effective 2015 • Philippine Interpretation IFRIC 15, Agreements for the Construction of Real Estate
This interpretation covers accounting for revenue and associated expenses by entities that undertake the construction of real estate directly or through subcontractors. The interpretation requires that revenue on construction of real estate be recognized only upon completion, except when such contract qualifies as construction contract to be accounted for under PAS 11, Construction Contracts, or involves rendering of services in which case revenue is recognized based on stage of completion. Contracts involving provision of services with the construction materials and where the risks and reward of ownership are transferred to the buyer on a continuous basis will also be accounted for based on stage of completion. The SEC and the Financial Reporting Standards Council (FRSC) have deferred the effectivity of this interpretation until the final Revenue standard is issued by International Accounting Standards Board (IASB) and an evaluation of the requirements of the final Revenue standard against the practices of the Philippine real estate industry is completed.
The Group expects that the adoption of this interpretation will impact the revenue recognition on its selected high-rise and medium rise projects.
The Group will assess the impact of the above new and amended accounting standards and interpretations effective subsequent to December 31, 2011 on the Group’s financial statements in the period of initial application. Additional disclosures required by these new and amended accounting standards will be included in the financial statements when these are adopted. Accounting Policies
Cash and Cash Equivalents Cash includes cash on hand and in banks. Cash equivalents are short-term, highly liquid investments that are readily convertible to known amounts of cash with original maturities of three months or less from dates of placement and are subject to an insignificant risk of change in value.
Financial Instruments
Date of recognition Financial assets and liabilities are recognized in the consolidated statement of financial position when the Group becomes a party to the contractual provisions of the instrument. Purchases or sales of financial assets that require delivery or assets within the time frame established by regulation or convention in the marketplace are recognized on the trade date.

- 10 -
*SGVMC116622*
Initial recognition of financial instruments Financial assets and liabilities are recognized initially at fair value. The fair value of financial instruments that are actively traded in organized financial markets are determined by reference to quoted market bid prices at the close of the business at the reporting date. Determination of fair value The fair value of investments that are actively traded in organized financial markets is determined by reference to quoted market prices at the close of business on the reporting date. For financial instruments where there is no active market, fair value is determined using valuation techniques. Such techniques include using recent arm’s-length market transactions; reference to the current market value of another instrument which is substantially the same; discounted cash flow analysis or other valuation models. In the absence of a reliable basis of determining fair value, investments in unquoted equity securities are carried at cost net of impairment, if any. Classification, Reclassification and Measurement of Financial Assets and Financial Liabilities (as at and from January 1, 2011) For purposes of classifying financial assets, an instrument is an ‘equity instrument’ if it is a nonderivative and meets the definition of ‘equity’ for the issuer (under PAS 32, Financial Instruments: Presentation), except for certain non-derivative puttable instruments presented as equity by the issuer. All other non-derivative financial instruments are ‘debt instruments’. Financial assets at amortized cost Financial assets are measured at amortized cost if both of the following conditions are met: • the asset is held within the Group’s business model whose objective is to hold assets in order
to collect contractual cash flows; and • the contractual terms of the instrument give rise on specified dates to cash flows that are solely
payments of principal and interest on the principal amount outstanding. Financial assets meeting these criteria are measured initially at fair value plus transaction costs. They are subsequently measured at amortized cost using the effective interest method less any impairment in value, with the interest calculated recognized as Interest income in the consolidated statement of income. The Group classified cash and cash equivalents, contracts receivable, other receivables, due from related parties and other assets as financial assets at amortized cost (see Notes 6, 7, 8, 18 and 29). The Group may irrevocably elect at initial recognition to classify a financial asset that meets the amortized cost criteria above as at FVTPL if that designation eliminates or significantly reduces an accounting mismatch had the financial asset been measured at amortized cost. As of December 31, 2011, the Group has not made such designation. Financial assets at FVTOCI At initial recognition, the Group can make an irrevocable election (on an instrument-by-instrument basis) to designate equity investments as at FVTOCI. Designation at FVTOCI is not permitted if the equity investment is held for trading.

- 11 -
*SGVMC116622*
A financial asset is held for trading if: • it has been acquired principally for the purpose of selling it in the near term; or • on initial recognition it is part of a portfolio of identified financial instruments that the Group
manages together and has evidence of a recent actual pattern of short-term profit-taking; or • it is a derivative that is not designated and effective as a hedging instrument or a financial
guarantee. Equity investments as at FVTOCI are initially measured at fair value plus transaction costs. Subsequently, they are measured at fair value, with no deduction for sale or disposal costs. Gains and losses arising from changes in fair value are recognized in other comprehensive income and accumulated in “Revaluation reserve on financial assets at FVTOCI” in the consolidated statement of financial position. Where the asset is disposed of, the cumulative gain or loss previously recognized in “Revaluation reserve on financial assets at FVTOCI” is not reclassified to profit or loss, but is reclassified to Retained earnings. Included under this category are the Group’s investments in quoted and unquoted shares of stocks (see Notes 10 and 29). Dividends earned on holding these equity instruments are recognized in the consolidated statement of income when the Group’s right to receive the dividends is established in accordance with PAS 18, Revenue, unless the dividends clearly represent recovery of a part of the cost of the investment.
Financial assets at FVTPL Debt instruments that do not meet the amortized cost criteria, or that meet the criteria but the Group has chosen to designate as at FVTPL at initial recognition, are measured at FVTPL. Equity investments are classified as at FVTPL, unless the Group designates an investment that is not held for trading as at FVTOCI at initial recognition. The Group has no financial assets at FVTPL as of December 31, 2011. Reclassification of financial assets The Group can reclassify financial assets if the objective of its business model for managing those financial assets changes. The Group is required to reclassify the following financial assets: • from amortized cost to FVTPL if the objective of the business model changes so that the
amortized cost criteria are no longer met; and • from FVTPL to amortized cost if the objective of the business model changes so that the
amortized cost criteria start to be met and the instrument’s contractual cash flows meet the amortized cost criteria.
Reclassification of financial assets designated as at FVTPL at initial recognition is not permitted. A change in the objective of the Group's business model must be effected before the reclassification date. The reclassification date is the beginning of the next reporting period following the change in the business model.
- 12 -
*SGVMC116622*
Financial liabilities Financial liabilities are classified as at FVTPL when the financial liability is either held for trading or it is designated as at FVTPL. A financial liability is held for trading if: • it has been incurred principally for the purpose of repurchasing it in the near term; or • on initial recognition, it is part of a portfolio of identified financial instruments that the Group
manages together and has evidence of a recent actual pattern of short-term profit-taking; or it is a derivative that is not designated and effective as a hedging instrument or a financial guarantee.
Management may designate a financial liability at FVTPL upon initial recognition when the following criteria are met, and designation is determined on an instrument by instrument basis: • The designation eliminates or significantly reduces the inconsistent treatment that would
otherwise arise from measuring the liabilities or recognizing gains or losses on them on a different basis; or
• The liabilities are part of a group of financial liabilities which are managed and their performance evaluated on a fair value basis, in accordance with a documented risk management or investment strategy; or
• The financial instrument contains an embedded derivative, unless the embedded derivative does not significantly modify the cash flows or it is clear, with little or no analysis, that it would not be separately recorded.
As of December 31, 2011, the Group has no financial liability at FVTPL. Financial liabilities at amortized cost Financial liabilities are measured at amortized cost using the effective interest method, except for: a. financial liabilities at fair value through profit or loss which are measured at fair value; and b. financial liabilities that arise when a transfer of a financial asset does not qualify for
derecognition or when the continuing involvement approach applies. Financial liabilities at amortized cost consist primarily of accounts payable and accrued expenses, loans payable, bonds payable and due to related parties (see Notes 15, 16, 17, 18 and 29).
Classification, Reclassification and Measurement of Financial Assets and Financial Liabilities (Prior to January 1, 2011) Classification of financial instruments Financial assets and liabilities are further classified into the following categories: financial asset or financial liability at FVPL, loans and receivables, held-to-maturity (HTM) investments, available-for-sale (AFS) financial assets and other financial liabilities. The Company determines the classification at initial recognition and re-evaluates this designation at every reporting date. The classification depends on the purpose for which the investments were acquired and whether they are quoted in an active market. Management determines the classification of its investments at initial recognition and, where allowed and appropriate, re-evaluates such designation at every reporting date.

- 13 -
*SGVMC116622*
All regular way purchases and sales of financial assets are recognized on the trade date, i.e., the date that the Group commits to purchase the asset. Regular way purchases or sales are purchases or sales of financial assets that require delivery of assets within the period generally established by regulation or convention in the marketplace. As of December 31, 2010, the Group has no financial assets or liabilities at FVPL and HTM financial assets. The Group has the following categories of financial assets and financial liabilities:
(a) Loans and receivables Loans and receivables are non-derivative financial assets with fixed or determinable payments that are not quoted in an active market. Loans and receivables are subsequently carried at amortized cost, less any allowance for impairment in the consolidated statement of financial position. Amortization is determined using the effective interest rate (EIR) method and is included in the interest income account in the consolidated statement of income. The losses arising from impairment of such financial assets are recognized in the consolidated statement of income. Gains and losses are recognized in profit or loss when the loans and receivables are derecognized, impaired and amortized.
Included under this category are the Group’s cash and cash equivalents, contracts receivable, other receivables, due from related parties and other deposits (see Notes 6, 7, 8, 18 and 29). (b) AFS Financial Assets AFS financial assets are nonderivative financial assets that are either classified in this category or not classified in any of the other categories. AFS financial assets are carried at fair value in the consolidated statement of financial position. Changes in the fair value of such assets are accounted for as “Revaluation reserve on available-for-sale financial assets” account under other comprehensive income until the investment is derecognized or until the investment is determined to be impaired at which time the cumulative gain or loss previously reported in other comprehensive income is included in the consolidated statement of income.
AFS financial assets also include unquoted equity investments, which are carried at cost, less any accumulated impairment in value, due to unpredictable nature of future cash flows and the lack of other suitable methods for arriving at a reliable fair value.
Included under this category are the Group’s investments in bonds and quoted and unquoted shares of stocks (see Notes 10 and 29). (c) Other Financial Liabilities at Amortized Cost Other financial liabilities at amortized cost pertain to issued financial instruments or their components that are not classified or designated at FVPL and contain contractual obligations to deliver cash or another financial asset to the holder or to settle the obligation other than by the exchange of a fixed amount of cash or another financial asset for a fixed number of own equity shares. The components of issued financial instruments that contain both liability and equity elements are accounted for separately, with the equity component being assigned the residual amount after deducting from the instrument as a whole the amount separately determined as the fair value of the liability component on the date of issue.

- 14 -
*SGVMC116622*
After initial recognition, these liabilities are subsequently measured at amortized cost using the effective interest method. Amortized cost is calculated by taking into account any discount or premium on the issue and fees that are an integral part of the EIR.
Other financial liabilities at amortized cost consist primarily of accounts payable and accrued expenses, loans payable, bonds payable and due to related parties (see Notes 15, 16, 17, 18 and 29). Impairment of Financial Assets The Group assesses at each reporting date whether there is objective evidence that a financial asset or group of financial assets is impaired. Assets Carried at Amortized Cost (prior to January 1, 2011) If there is objective evidence that an impairment loss on loans and receivables carried at amortized cost has been incurred, the amount of the loss is measured as the difference between the asset’s carrying amount and the present value of estimated future cash flows (excluding future credit losses that have not been incurred) discounted at the financial asset’s original EIR (i.e. the EIR computed at initial recognition). The carrying amount of the asset shall be reduced either directly or through use of an allowance account. The amount of the loss shall be recognized in the consolidated statement of income. The Group first assesses whether objective evidence of impairment exists individually for financial assets that are individually significant, and individually or collectively for financial assets that are not individually significant. If it is determined that no objective evidence of impairment exists for an individually assessed financial asset, whether significant or not, the asset is included in the Group financial assets with similar credit risk characteristics. Assets that are individually assessed for impairment and for which an impairment loss is or continues to be recognized are not included in a collective assessment of impairment.
If, in a subsequent period, the amount of the impairment loss decreases and the decrease can be related objectively to an event occurring after the impairment was recognized, the previously recognized impairment loss is reversed. Any subsequent reversal of an impairment loss is recognized in the consolidated statement of income, to the extent that the carrying value of the asset does not exceed its amortized cost at the reversal date.
AFS Financial Assets (prior to January 1, 2011) For AFS financial assets, the Group assesses at each reporting date whether there is objective evidence that a financial asset or group of financial assets is impaired.
In case of equity investments classified as AFS, this would include a significant or prolonged decline in the fair value of the investments below its cost. Where there is evidence of impairment, the cumulative loss - measured as the difference between the acquisition cost and the current fair value, less any impairment loss on that financial asset previously recognized in the consolidated statement of income - is removed from equity and recognized in the consolidated statement of income. Impairment losses on equity investments are not reversed through the consolidated statement of income. Increases in fair value after impairment are recognized directly in equity.

- 15 -
*SGVMC116622*
In the case of debt instruments classified as AFS financial asset, impairment is assessed based on the same criteria as financial assets carried at amortized cost. Interest continues to be accrued at the original effective interest rate on the reduced carrying amount of the asset and is recorded as part of interest income in the consolidated statement of income. If, in subsequent year, the fair value of a debt instrument increased and the increase can be objectively related to an event occurring after the impairment loss was recognized in the consolidated statement of income, the impairment loss is reversed through the consolidated statement of income.
If there is objective evidence that an impairment loss on an unquoted equity instrument that is not carried at fair value because its fair value cannot be reliably measured, or on a derivative asset that is linked to and must be settled by delivery of such an unquoted equity instrument has been incurred, the amount of the loss is measured as the difference between the asset’s carrying amount and the present value of estimated future cash flows discounted at the current market rate of return for a similar financial asset.
Derecognition of Financial Assets and Liabilities Financial Assets A financial asset is derecognized when • the rights to receive cash flows from the asset have expired; • the Group retains the right to receive cash flows from the asset, but has assumed an obligation
to pay them in full without material delay to a third party under a ‘pass-through’ arrangement; or
• the Group has transferred its rights to receive cash flows from the asset and either (a) has transferred substantially all the risks and rewards of the asset, or (b) has neither transferred nor retained substantially all risks and rewards of the asset, but has transferred control of the asset.
Where the Group has transferred its rights to receive cash flows from an asset and has neither transferred nor retained substantially all the risks and rewards of an asset nor transferred control of the asset, the asset is recognized to the extent of the Group’s continuing involvement in the asset. Continuing involvement that takes the form of a guarantee over the transferred asset is measured at the lower of the original carrying amount of the asset and the maximum amount of consideration that the Group could be required to repay.
Financial Liabilities A financial liability is derecognized when the obligation under the liability expires, is discharged or cancelled. Where an existing financial liability is replaced by another from the same lender on substantially different terms, or the terms of an existing liability are substantially modified, such an exchange or modification is treated as a derecognition of the original liability and the recognition of a new liability, and the difference in the respective carrying amounts is recognized in the consolidated statement of income. Real Estate Inventories Property acquired, developed and constructed for sale in the ordinary course of business, rather than to be held for rental or capital appreciation, is held as inventory and is measured at the lower of cost and net realizable value. It also includes investments in club shares accounted as inventory when the Group acts as the developer and its intent is to sell the developed property.

- 16 -
*SGVMC116622*
Cost includes cost of land, amounts paid to contractors for construction, borrowing costs, planning and design costs, costs of site preparation, professional fees for legal services, property transfer taxes, construction overheads and other related costs. Net realizable value is the estimated selling price in the ordinary course of the business, based on market prices at the reporting date and discounted for the time value of money if material, less costs to completion and the estimated costs of sale. The cost of inventory recognized in profit or loss on disposal is determined with reference to the specific costs incurred on the property sold and an allocation of any non-specific costs based on the relative size of the property sold.
Land and Land Development Land and land development consists of properties for future development that are carried at the lower of cost or NRV. The cost of land and land development include the (a) land acquisition, (b) costs incurred relative to acquisition and transfer of land title in the name of the Group such as real property taxes and (c) costs incurred on initial development of the raw land in preparation for future projects. They are classified to subdivision lots and housing units for sale under “real estate inventories” when the project construction starts and the necessary permits are secured.
Investment in an Associate The Group’s investment in an associate is accounted for under the equity method of accounting. An associate is an entity in which the Group has significant influence and which is neither a subsidiary nor a joint venture.
Under the equity method, the investment in an associate is carried in the consolidated statement of financial position at cost plus post-acquisition changes in the Group’s share of net assets of the associate. After application of the equity method, the Group determines whether it is necessary to recognize any additional impairment loss with respect to the Group’s net investment in the associate. The consolidated statement of income reflects the share of the results of operations of the associate.
Where there has been a change recognized directly in the equity of the associate, the Group recognizes its share of any changes and discloses this, when applicable, in the consolidated statement of changes in equity. The reporting dates of the associate and the Group are identical and the associates’ accounting policies conform to those used by the Group for like transactions and events in similar circumstances. After application of the equity method, the Group determines whether it is necessary to recognize an additional impairment loss on investment in an associate. The Group determines at the end of each reporting period whether there is any objective evidence that the investment in an associate is impaired. If this is the case, the Group calculates the amount of impairment as the difference between the recoverable amount of the investment in the associate and its carrying value and recognize the amount in the consolidated income statement. Interests in Joint Ventures The Group has interests in joint ventures which are accounted for by the proportionate consolidation of assets, liabilities, income and expenses on a line-by-line basis.

- 17 -
*SGVMC116622*
A joint venture is a contractual agreement whereby two or more parties undertake an economic activity that is subject to joint control. The Group recognizes its interest in the joint venture using proportionate consolidation. The Group combines its share of each of the assets, liabilities, income and expenses of the joint venture with similar terms, line by line, in its consolidated financial statements. The financial statements of the joint venture are prepared for the same reporting year as the Group, using consistent accounting policies. Adjustments are made to bring into line any dissimilar accounting policies that may exist.
When the Group contributes or sells assets to the joint venture, any portion of gain or loss from the transaction is recognized based on the substance of the transaction. When the Group purchases assets from the joint venture, the Group does not recognize its share of the profits of the joint venture from the transaction until it resells the assets to an independent party. The joint venture is proportionately consolidated until the date on which the Group ceases to have joint control over the joint venture. The Group also has interests in joint ventures which are jointly-controlled assets. The Group recognizes in its consolidated financial statements its share in the jointly-controlled assets, the liabilities that it incurred and its share in any of the liabilities it incurred jointly with the venture partner and income and expenses that it incurred.
Investment Properties Investment properties consist of properties that are held to earn rentals. Investment properties, except for land, are carried at cost less accumulated depreciation and any impairment in value. Land is carried at cost less any impairment, if any.
Depreciation of investment properties is computed using the straight-line method over their useful lives. Buildings and ready-built factories are depreciated over their estimated useful lives of 20 to 50 years. Machinery and equipment are depreciated over their estimated useful lives of 5 years.
Investment property is derecognized when it is either disposed of or permanently withdrawn from use and there is no future economic benefit expected from its disposal or retirement. Any gains or losses on the retirement or disposal of an investment property are recognized in the consolidated statement of income in the year of retirement or disposal. Transfers are made to investment property when there is a change in use, evidenced by ending of owner-occupation, commencement of an operating lease to another party or ending of construction or development. Transfers are made from investment property when there is a change in use, evidenced by commencement of owner-occupation or commencement of development with a view to sale.
Transfers between investment property, owner-occupied property and inventories do not change the carrying amount of the property transferred and they do not change the cost of that property for measurement or disclosure purposes. Property and Equipment Property and equipment, except for land, are carried at cost less accumulated depreciation and amortization and any impairment in value. Land is carried at cost less any impairment in value. The initial cost of property and equipment comprises its purchase price and any directly attributable costs of bringing the asset to its working condition and location for its intended use including borrowing cost.

- 18 -
*SGVMC116622*
Construction-in-progress, is stated at cost. This includes cost of construction and other direct costs. Construction-in-progress is not depreciated until such time as the relevant assets are completed and put into operational use.
Expenditures incurred after the property and equipment have been put into operations, such as repairs and maintenance and overhaul costs, are normally charged to income in the year in which the costs are incurred. In situations where it can be clearly demonstrated that the expenditures have resulted in an increase in the future economic benefits expected to be obtained from the use of an item of property and equipment beyond its originally assessed standard of performance, the expenditures are capitalized as an additional cost of property and equipment.
Depreciation is computed on the straight-line basis over the estimated useful lives of the assets, as follows:
Buildings 20 years Machinery and equipment 5 years Transportation equipment 5 years Furniture and fixtures 3-5 years
Leasehold improvements are amortized over the estimated useful lives of the improvements or the lease term, whichever is shorter.
The useful life as well as the depreciation and amortization method is reviewed periodically to ensure that the period and the method of depreciation and amortization are consistent with the expected pattern of economic benefits from items of property and equipment.
When assets are retired or otherwise disposed of, the cost of the related accumulated depreciation and amortization and accumulated provision for impairment losses, if any, are removed from the accounts and any resulting gain or loss is credited to or charged against current operations.
Impairment of Nonfinancial Assets The carrying values of assets (e.g., real estate inventories, investment in an associate, property and equipment, and investment properties) are reviewed for impairment when events or changes in circumstances indicate the carrying values may not be recoverable. If any such indication exists and where the carrying values exceed the estimated recoverable amounts, the assets or cash-generating units are written down to their recoverable amounts. The recoverable amount of the asset is the greater of fair value less cost to sell and value-in-use. In assessing value-in-use, the estimated future cash flows are discounted to their present value using a pre-tax discount rate that reflects current market assessment of the time value of money and the risks specific to the asset. For an asset that does not generate largely independent cash inflows, the recoverable amount is determined for the cash-generating unit to which the asset belongs. Impairment losses are recognized in the consolidated statement of income.
For assets excluding goodwill, an assessment is made at each reporting date as to whether there is any indication that previously recognized impairment losses may no longer exist or may have decreased. If such indication exists, the Group estimates the asset’s or cash-generating unit’s recoverable amount. A previously recognized impairment loss is reversed only if there has been a change in the assumptions used to determine the asset’s recoverable amount since the last impairment loss was recognized. The reversal is limited so that the carrying amount of the asset does not exceed its recoverable amount, nor exceed the carrying amount that would have been determined, net of depreciation and amortization, had no impairment loss been recognized for the

- 19 -
*SGVMC116622*
asset in prior years. Such reversal is recognized in the consolidated statement of income unless the asset is carried at revalued amount, in which case the reversal is treated as a revaluation increase.
Goodwill is tested for impairment annually as at December 31 and when circumstances indicate that the carrying value may be impaired.
Impairment is determined for goodwill by assessing the recoverable amount of each cash-generating unit (or group of cash-generating units) to which the goodwill relates. Where the recoverable amount of the cash-generating unit is less than their carrying amount an impairment loss is recognized. Impairment losses relating to goodwill cannot be reversed in future periods.
Other Assets Other assets pertain to resources controlled by the Group as a result of past events and from which future economic benefits are expected to flow to the Group.
Value-added Tax (VAT) Revenues, expenses, assets and liabilities are recognized net of the amount of VAT, except where the VAT incurred on a purchase of assets or services is not recoverable from the taxation authority, in which case the VAT is recognized as part of the cost of acquisition of the asset or as part of the expense item as applicable.
The net amount of VAT recoverable and payable from the taxation authority is included as part of
“Other assets” and “Accounts payable and accrued expenses” in the consolidated statement of financial position, respectively. Earnings Per Share (EPS) Basic EPS is computed by dividing net income applicable to common stock by the weighted average number of common shares outstanding, after giving retroactive effect for any stock dividends, stock splits or reverse stock splits during the period.
Diluted EPS is computed by dividing net income by the weighted average number of common shares outstanding during the period, after giving retroactive effect for any stock dividends, stock splits or reverse stock splits during the period, and adjusted for the effect of dilutive options and dilutive convertible preferred shares. If the required dividends to be declared on convertible preferred shares divided by the number of equivalent common shares, assuming such shares are converted would decrease the basic EPS, then such convertible preferred shares would be deemed dilutive.
Where the effect of the assumed conversion of the preferred shares and the exercise of all outstanding options have anti-dilutive effect, basic and diluted EPS are stated at the same amount.
Revenue Recognition Revenue is recognized to the extent that it is probable that the economic benefits will flow to the Group and the revenue can be reliably measured. In arrangements where the Group is acting as principal to its customers, revenue is recognized on a gross basis. However, if the Group is acting as an agent to its customers, only the amount of net commission retained is recognized as revenue. The following specific recognition criteria must also be met before revenue is recognized:
Real Estate Sales Real estate revenue and cost from substantially completed projects is accounted for using the full accrual method. The percentage-of-completion method is used to recognize revenue from sales of

- 20 -
*SGVMC116622*
projects where the Group has material obligations under the sales contract to complete the project after the property is sold. Under this method, revenue is recognized as the related obligations are fulfilled, measured principally on the basis of the estimated completion of a physical proportion of the contract work. Any excess of collections over the recognized receivables are included in the “Accounts payable and accrued expenses” account in the liabilities section of the consolidated statement of financial position.
Collections from accounts which are not yet qualified for revenue recognition are treated as customer deposits included in the “Accounts payable and accrued expenses” account in the consolidated statement of financial position. Rental Income Rental income arising from investment properties are recognized in the consolidated statement of income either on a straight-line basis over the lease term or based on a certain percentage of the gross revenue of the tenants, as provided under the terms of the lease contract. Interest Income Interest is recognized as it accrues (using the effective interest rate method that is the rate that exactly discounts estimated future cash receipts through the expected life of the financial instrument to the net carrying amount of the financial asset). Dividend Income Dividend income is recognized when the Group’s right to receive the payment is established. Dividend income is included in the “Other income” account in the consolidated statement of income. Management Fees Management fees from administration, property management and other activities are recognized when services are rendered. Management fees are included in the “Other income” account in the consolidated statement of income. Income from Forfeited Reservations and Collections Income from forfeited reservation and collections is recognized when the deposits from potential buyers are deemed nonrefundable due to prescription of the period for entering into a contracted sale. Such income is also recognized, subject to the provisions of Republic Act 6552, Realty Installment Buyer Act, upon prescription of the period for the payment of required amortizations from defaulting buyers. Other Income Other income is recognized when services are rendered and when goods are delivered. Expenses “General and administrative expenses” and “Selling and marketing expenses” are expenses that are incurred in the course of the ordinary operations of the Group. These usually take the form of an outflow or depletion of assets such as cash and cash equivalents, real estate inventories, property and equipment and investment properties. Selling and marketing expenses are costs incurred to sell real estate inventories, which include commissions, advertising and promotions, among others. General and administrative expenses constitute costs of administering the business. Expenses are recognized in the consolidated statement of income as incurred.

- 21 -
*SGVMC116622*
Retirement Costs Retirement costs on the Group’s defined benefit retirement plan are actuarially computed using the projected unit credit valuation method. This method reflects services rendered by employees up to the date of valuation and incorporates assumptions concerning employees’ projected salaries.
Actuarial valuations are conducted with sufficient regularity, with option to accelerate when significant changes to underlying assumptions occur. Retirement cost includes current service cost, interest cost, expected return on any plan assets, actuarial gains and losses and the effect of any curtailment or settlement.
The liability recognized in the consolidated statement of financial position with respect to the defined benefit retirement plan is the present value of the defined benefit obligation at the reporting date less the fair value of the plan assets, if any. The defined benefit obligation is calculated annually by independent actuaries using the projected unit credit method. The present value of the defined benefit obligation is determined by discounting the estimated future cash outflows using interest rates that have terms to maturity approximating the terms of the related retirement liability.
Actuarial gains and losses are recognized as income or expense if the cumulative unrecognized actuarial gains and losses at the end of the previous reporting period exceeded the greater of 10% of the present value of defined benefit obligation or 10% of the fair value of plan assets. These gains and losses are recognized over the expected average remaining working life of the employees participating in the plans. Commission Expense Commissions paid to sales or marketing agents on the sale of pre-completed real estate units are deferred when recovery is reasonably expected and are charged to expense in the period in which the related revenue is recognized as earned. Commission expense is included in the “Selling and marketing expenses” account in the consolidated statement of income.
Borrowing Costs
Borrowing costs consists of interest and other costs that an entity incurs in connection with the borrowing of funds. They are capitalized if they are directly attributable to the acquisition, construction or production of a qualifying asset. Qualifying assets are assets that necessarily take a substantial period of time to get ready for its intended use or sale. Interest and other financing costs incurred during the construction period on borrowings used to finance property development are capitalized as part of development costs (included in “Real estate inventories” in the consolidated statement of financial position). Capitalization of borrowing costs commences when the activities to prepare the asset are in progress and expenditures and borrowing costs are being incurred. Capitalization of borrowing costs ceases when substantially all the activities necessary to prepare the asset for its intended sale are completed. If the carrying amount of the asset exceeds its recoverable amount, an impairment loss is recorded.
All other borrowing costs are expensed as incurred.
Foreign Currency-Denominated Transactions The functional and presentation currency of the Parent Company and its subsidiaries, joint ventures and associate is the Philippine Peso. Transactions denominated in foreign currencies are recorded in Philippine Peso based on the exchange rates prevailing at the transaction dates. Foreign currency denominated monetary assets and liabilities are translated to Philippine Peso at exchange rates prevailing at the reporting date. Foreign exchange differentials between rate at transaction date and rate at settlement date or reporting date of foreign currency denominated monetary assets or liabilities are credited to or charged against current operations.

- 22 -
*SGVMC116622*
Equity The Group records common and preferred stocks at par value and additional paid-in capital as the excess of the total contributions received over the aggregate par values of the equity shares. The Group considers the underlying substance and economic reality of its own equity instrument and not merely its legal form in determining its proper classification. When any member of the Group purchases the Parent Company’s capital stock (treasury shares), the consideration paid, including any attributable incremental costs, is deducted from equity until the shares are cancelled, reissued or disposed of. Where such shares are subsequently sold or reissued, any consideration received, net of any directly attributable incremental transaction costs and the related tax effects is included in consolidated equity.
Retained earnings represents accumulated earnings of the Group, and any other adjustments to it as required by other standards, less dividends declared. The individual accumulated earnings of the subsidiaries and accumulated equity earnings from an associate included in the consolidated retained earnings are available for dividend declaration when these are declared as dividends by the subsidiaries and associate as approved by their respective Board of Directors. Retained earnings are further restricted for the payment of dividends to the extent of the cost of common shares held in treasury. The Parent Company's retained earnings available for dividend declaration as of December 31, 2011, 2010 and 2009 amounted to P=8.88 billion, P=6.56 billion and P=5.64 billion, respectively. Own equity instruments which are reacquired are carried at cost and are deducted from equity. No gain or loss is recognized in profit or loss on the purchase, sale, issue or cancellation of the Parent Company’s own equity instruments. When the shares are retired, the capital stock account is reduced by its par value and excess of cost over par value upon retirement is debited to additional paid-in capital to the extent of the specific or average additional paid in capital when the shares were issued and to retained earnings for the remaining balance. Income Tax Current Income Tax Current income tax assets and liabilities for the current and prior periods are measured at the amount expected to be recovered from or paid to the taxation authorities. The tax rates and tax laws used to compute the amount are those that are enacted or substantively enacted at the reporting date.
Deferred Income Tax Deferred income tax is provided, using the liability method, on all temporary differences at the reporting date between the tax bases of assets and liabilities and their carrying amounts for financial reporting purposes.
Deferred income tax liabilities are recognized for all taxable temporary differences, except; (a) where deferred income tax liability arises from the initial recognition of goodwill or of an asset or liability in a transaction that is not a business combination and, at the time of the transaction, affects neither the accounting profit nor taxable profit or loss; and (b) in respect of taxable temporary differences associated with investments in subsidiaries, associates and interests in joint ventures, where the timing of the reversal of the temporary differences can be controlled and it is probable that the temporary differences will not reverse in the foreseeable future.

- 23 -
*SGVMC116622*
Deferred income tax assets are recognized for all deductible temporary differences, carryforward benefit of the excess of minimum corporate income tax (MCIT) over regular corporate income tax (RCIT) and unused net operating loss carryover (NOLCO), to the extent that it is probable that taxable profit will be available against which the deductible temporary differences and carryforward of MCIT and unused NOLCO can be utilized.
The carrying amount of deferred income tax assets is reviewed at each reporting date and reduced to the extent that it is no longer probable that sufficient taxable profit will be available to allow all or part of the deferred tax asset to be utilized.
Deferred income tax assets and liabilities are measured at the tax rates that are expected to apply to the year when the asset is realized or the liability is settled, based on tax rates (and tax laws) that have been enacted or substantively enacted at the reporting date.
Deferred income tax assets and deferred income tax liabilities are offset, if a legally enforceable right exists to offset current income tax assets against current income tax liabilities and the deferred income taxes relate to the same taxable entity and the same taxation authority.
Operating Leases Group as Lessor Leases where the Group does not transfer substantially all the risks and rewards of ownership of the asset are classified as operating leases. Initial direct costs incurred in negotiating an operating lease are added to the carrying amount of the leased asset and recognized over the lease term on the same bases as rental income.
Group as Lessee Lease payments under operating lease are recognized as expense based on the terms of the lease contract.
Segment Reporting The Group’s operating businesses are organized and managed separately according to the nature of the products and services provided, with each segment representing a strategic business unit that offers different products and serves different markets. Financial information on business segments is presented in Note 5 to the consolidated financial statements.
Provisions A provision is recognized when the Group has a present obligation (legal or constructive) as a result of a past event, it is probable that an outflow of resources embodying economic benefits will be required to settle the obligation and a reliable estimate can be made of the amount of the obligation. If the effect of the time value of money is material, provisions are determined by discounting the expected future cash flows at a pre-tax rate that reflects current market assessment of the time value of money and, where appropriate, the risks specific to the liability. Where discounting is used, the increase in the provision due to the passage of time is recognized as interest expense. When the Group expects part or all of provision to be reimbursed or recovered, the reimbursement is recognized as a separate asset, but only when the reimbursement is virtually certain.
Contingencies Contingent liabilities are not recognized in the consolidated financial statements. They are disclosed unless the possibility of an outflow of resources embodying economic benefits is remote. Contingent assets are not recognized in the consolidated financial statements but are disclosed when an inflow of economic benefits is probable.

- 24 -
*SGVMC116622*
Events after the Reporting Date Any post year-end event up to the date of the auditor’s report that provides additional information about the Group’s position at reporting date (adjusting event) is reflected in the consolidated financial statements. Any post year-end event that is not an adjusting event is disclosed, when material, in notes to the consolidated financial statements.
3. Significant Accounting Judgments and Estimates
The preparation of the accompanying consolidated financial statements in compliance with PFRS requires management to make judgments, estimates and assumptions that affect the amounts reported in the consolidated financial statements and accompanying notes. Future events may occur which can cause the assumptions used in arriving at those estimates to change. The effects of any changes in estimates will be reflected in the consolidated financial statements as they become reasonably determinable. Estimates and judgments are continually evaluated and are based on historical experience and other factors, including expectations of future events that are believed to be reasonable under the circumstances.
Judgments In the process of applying the Group’s accounting policies, management has made the following judgments, apart from those involving estimations, which have the most significant effect on the amounts recognized in the financial statements.
Determination of the Group’s functional currency
Based on the economic substance of the underlying circumstances relevant to the Group, the functional currency of each entity within the Group has been determined to be the Peso. It is the currency that mainly influences the Group’s operations. Classification of Financial Instruments The Group classifies financial instruments, or its component parts, on initial recognition as a financial asset, a financial liability or an equity instrument in accordance with the substance of the contractual agreement and the definitions of the instruments. The substance of a financial instrument, rather than its legal form, governs its classification in the statement of financial position. The Group determines the classification at initial recognition and re-evaluates this designation at every reporting date.
Real Estate Revenue Recognition Selecting an appropriate revenue recognition method for a real estate sale transaction requires certain judgments based on, among others:
§ Buyer’s commitment on sale which may be ascertained through the significance of the buyer’s
initial payments in relation to the total contract price; and § Stage of completion of the project development.
Operating Lease Commitments - The Group as Lessor The Group has entered into various property leases on its investment property portfolio. The Group has determined that it retains all significant risks and rewards of ownership on these properties which are leased out on operating leases.

- 25 -
*SGVMC116622*
Operating Lease Commitments - The Group as Lessee The Group has entered into various leases for its occupied offices. The Group has determined that all significant risks and rewards of ownership are retained by the respective lessors on offices it leases under operating leases.
Determining Classification of Investment in Club Project Being a real estate developer, the Group determines how investment in club project shall be accounted for. In determining whether this shall be accounted for as inventories or as financial instruments, the Group considers its role in the development of the Club and its intent for holding the related club shares. The Group classifies such shares as inventories when the Group acts as the developer and its intent is to sell the developed property. Management’s Use of Estimates The key assumptions concerning the future and other key sources of estimation uncertainty at the reporting date that have a significant risk of causing a material adjustment to the carrying amounts of assets and liabilities within the next financial year are discussed below: Fair Valuation in Business Combination In relation to the Parent Company’s acquisition of the remaining 40% share in CPI and in FAPI in 2010 which were accounted for as business combinations (see Note 4), the Group hired the services of an independent valuer to determine the fair values of CPI’s investment properties, and FAPI’s inventories. The independent appraiser used income approach using discounted cash flow model.
Major assumptions used in the cashflows include rental rates, vacancy allowances and the discount rate. Discount rate used is 14% determined using capital asset pricing model while escalation of rental rates is assumed to be 5% per annum. Major assumptions used in the cashflows of FAPI’s inventories include inventory selling price escalation, remaining development cost and the discount rate. Discount rate used is 13.5% determined using the capital asset pricing model. Escalation of real estate inventory prices is assumed to be 5% annually for lots and housing units and at 5% every two years for club shares. For equity valuation of CPI, the independent valuer also determined the fair values of the additional facilities to be constructed in the future using income approach following the discounted cash flows model. Major assumptions used in the cashflows include the estimation of development costs, soft cost, development profit, market rent, annual escalation and vacancy allowance. Discount rate used is 14.5% determined using capital asset pricing model. For equity valuation of FAPI, the same major assumptions were used for the cashflows of FAPI’s inventories as discussed above.
Estimate on when the buyer’s investment is qualified for revenue recognition on real estate sales Starting January 1, 2010, the Group changed its basis of estimating on when the buyer’s investment is considered adequate to meet the probability criteria that economic benefits will flow to the Group and warrant revenue recognition. The recent change in the Group’s business focus on low to middle income segment, experience over the past years, and information gathered that other industry players are adopting the same threshold, prompted the Group to revisit and accordingly revise the basis of estimating the level of buyer’s payments that is highly probable that the buyer will commit to the sale transaction, and thus, it is probable that economic benefits will flow to the Group. The change in estimate increased the real estate sales by P=1.09 billion and net income by P=221.87 million for the year ended December 31, 2010.

- 26 -
*SGVMC116622*
Evaluation of Impairment of Financial Assets at Amortized Cost The Group reviews loans and receivables, other than cash and cash equivalents, at each reporting date to assess whether an allowance for impairment should be recorded in the consolidated statements of income. If there is objective evidence that an impairment loss on loans and receivables, other than cash and cash equivalents, carried at amortized cost has been incurred, the carrying amount of the asset shall be reduced either directly or through use of an allowance account. The amount of the loss shall be recognized in the consolidated statement of income. The Group maintains allowance for doubtful accounts based on the result of the individual and collective assessment. Under the individual assessment, impairment loss is determined as the difference between the receivables carrying balance and recoverable amount. Factors considered in individual assessment are payment history, account status and term. The collective assessment would require the Group to classify its receivables based on the credit risk characteristics (customer type, payment history, account status and term) of the customers. Impairment loss is then determined based on historical loss experience of the receivables grouped per credit risk profile adjusted on the basis of current observable data to reflect the effects of current conditions. The methodology and assumptions used for the individual and collective assessments are based on management’s judgment and estimate. Therefore, the amount and timing of recorded expense for any period would differ depending on the judgments and estimates made for the period. Based on the Group’s experience, its loans and receivables are highly collectible or collectible on demand. The receivables are collateralized by the corresponding real estate properties sold. In few cases of buyer defaults, the Group can repossess the collateralized properties and resell them at the prevailing market prices. The Group has an outstanding allowance for impairment loss on its other receivables amounting to P=62.98 million and P=54.09 million as of December 31, 2011 and 2010, respectively (see Note 8). The carrying values of financial assets at amortized cost in 2011 and loans and receivables in 2010 amounted to P=10.32 billion and P=10.41 billion, respectively (see Note 29). Evaluation of Impairment of Available-for-sale Financial Assets (Prior to January 1, 2011) The Group assesses at each reporting date whether there is objective evidence that an investment or a group of investments is impaired. In the case of equity investments classified as AFS financial assets, objective evidence would include a significant or prolonged decline in the fair value of the investment below its cost. Where there is evidence of impairment, the cumulative loss, measured as the difference between the acquisition cost and the current fair value, less any impairment loss on that investment previously recognized in the consolidated statement of comprehensive income, is removed from consolidated statement of comprehensive income and recognized it in the consolidated statement of income. Impairment losses on equity investments are not reversed through the consolidated statement of income; increases in their fair value after impairment are recognized directly in the consolidated statement of comprehensive income. As at December 31, 2010, the Group did not recognize impairment on its AFS financial assets. The carrying value of AFS financial assets amounted to P=123.07 million as of December 31, 2010 (see Notes 10 and 29).

- 27 -
*SGVMC116622*
Estimating Useful Lives of Investment Properties and Property and Equipment The Group estimates the useful lives of its investment properties and property and equipment based on the years over which these assets are expected to be available for use. The estimated useful lives of investment properties and property and equipment are reviewed at least annually; and, are updated if expectations differ from previous estimates due to physical wear and tear as well as technical or commercial obsolescence on the use of these assets. It is possible that future results of operations could be materially affected by changes in estimates brought about by changes in factors mentioned above. The carrying value of investment properties amounted to P=12.20 billion and P=11.60 billion as of December 31, 2011 and 2010, respectively (see Note 12). The carrying value of property and equipment amounted to P=1.29 billion and P=1.47 billion as of December 31, 2011 and 2010, respectively (see Note 13).
Recognition of Deferred Income Taxes The Group reviews the carrying amounts of deferred taxes at each reporting date and reduces deferred income tax assets to the extent that it is no longer probable that sufficient taxable profit will be available to allow all or part of the deferred income tax assets to be utilized. However, there is no assurance that the Group will generate sufficient future taxable profit to allow all or part of its deferred income tax assets to be utilized. The carrying value of recognized net deferred tax assets amounted to P=0.02 million and P=0.02 million as of December 31, 2011 and 2010, respectively (see Note 28). The deductible temporary differences for which no deferred income tax assets were recognized amounted to P=0.05 million and P=0.03 million as of December 31, 2011 and 2010, respectively (see Note 28). The carrying value of recognized net deferred tax liabilities amounted to P=1.69 billion and P=1.63 billion as of December 31, 2011 and 2010 (see Note 28). Evaluation of Impairment on Nonfinancial Assets The Group reviews its real estate inventories, investment in an associate, property and equipment, and investment properties for impairment of value. This includes consideration of certain indicators of impairment such as significant change in asset usage, significant decline in asset’s market value, obsolescence or physical damage of an asset, plans of discontinuing the real estate projects, and, significant negative industry or economic trends. If such indicators are present, and where the carrying amount of the asset exceeds its recoverable amount, the asset is considered impaired and is written down to recoverable amount. The recoverable amount is the asset’s fair value less cost to sell, except for investments, which have recoverable value determined using value-in-use. The fair value less cost to sell is the amount obtainable from the sale of an asset in an arms-length transaction while value in use is the present value of estimated future cash flows expected to arise from the investments. Recoverable amounts are estimated for individual assets or, if it is not possible, for the cash-generating unit to which the asset belongs. As at December 31, 2011 and 2010, the Group did not record impairment on any of its nonfinancial assets. The carrying value of the nonfinancial assets amounted to P=50.45 billion and P=45.30 billion as of December 31, 2011 and 2010, respectively (see Notes 9, 11, 12 and 13).
Evaluation of Impairment on Goodwill Goodwill is tested for impairment annually and when circumstances indicate that the carrying value may be impaired. The Group’s impairment test for goodwill is based on value-in-use calculations that use a discounted cash flow model. The Group availed of the services of an independent appraiser to compute for the value-in-use. The cash flows are derived from budget and do not include restructuring activities that the Group is not yet committed to nor significant
- 28 -
*SGVMC116622*
future investments that will enhance the asset base of the cash generating unit being tested. The recoverable amount is most sensitive to the discount rate used for the discounted cash flow model as well as the expected future cash-inflows and the growth rates used. The pre-tax discount rates used in 2011 and 2010 are 12% and 14.5%, respectively. The discount rates are based on the yield of government bonds applicable to the term of forecast as of the valuation date adjusted to reflect the current market assessment of the risk specific to the cash generating units. The growth rates used beyond the forecast period for different cash-generating units range from 5% to 10% in 2011 and 2010. As of December 31, 2011 and 2010 the Group did not recognize any impairment on its goodwill. The carrying value of goodwill amounted to P=4.57 billion as of December 31, 2011 and 2010 (see Note 4).
Estimating Retirement Liabilities and Other Retirement Benefits The determination of the Group’s obligation and cost for retirement and other retirement benefits is dependent on selection of certain assumptions used by actuaries in calculating such amounts. Those assumptions are described in Note 24 and include among others, discount rates and rates of salary increase. While the Group believes that the assumptions are reasonable and appropriate, significant differences in actual experience or significant changes in assumptions may materially affect retirement obligations. Retirement liabilities amounted to P=59.21 million and P=48.44 million as at December 31, 2011 and 2010, respectively (see Note 24). Retirement costs included under “General and administrative expenses” account amounted to P=22.38 million, P=12.74 million and P=12.64 million in 2011, 2010 and 2009, respectively (see Note 24). Fair Values of Financial Instruments The preparation of consolidated financial statements in compliance with PFRS requires certain financial assets and liabilities to be carried at fair value, which requires the use of extensive accounting estimates and judgments. While significant components of fair value measurement were determined using verifiable objective evidence (i.e. interest rate), the amount of changes in fair value would differ due to usage of different valuation methodology. Any changes in fair value of these financial assets and liabilities would affect directly the Group’s consolidated net income and other comprehensive income (see Note 29).
Contingencies The Group is currently involved in various legal proceedings. The estimate of the probable costs for the resolution of these claims has been developed in consultation with outside counsel handling the defense in these matters and based upon analysis of potential results. The Group currently does not believe these proceedings will have material effect on the Group’s financial position. It is possible, however, that future results of operations could be materially affected by changes in the estimates or in the effectiveness of the strategies relating to these proceedings (see Note 30).

- 29 -
*SGVMC116622*
4. Business Combinations in 2010 and Goodwill
On February 8, 2010, the Parent Company acquired the remaining 40% interests in CPI from Africa-Israel Properties (Phils.), Inc. (AIPPI) and FAPI from Africa-Israel Investments (Phils.), Inc. (AIIPI) to obtain control from the previous joint ventures. Prior to the acquisition, the Parent Company accounted for its investments in the joint ventures under the proportionate consolidation. The acquisition resulted in CPI and FAPI becoming wholly-owned subsidiaries of the Parent Company. The acquisition of the joint ventures’ interests was accounted for as business combination.
Below are the details of the business combination transactions:
a.) Acquisition of CPI
Cash paid by the Parent Company to AIPPI for the remaining 40% share in CPI amounted to P=780.00 million.
Goodwill on the business combination of CPI is determined as follows (in thousands):
Amount of consideration for the 40% interest acquired P=780,000 Add acquisition date fair value of previously held 60% interest 2,932,947 Less acquisition date fair value of net identifiable assets 3,386,394 Goodwill P=326,553
The goodwill recognized amounting to P=326.55 million comprises the expected cash flows from future expansion of CPI operations. The acquisition of the remaining interest in CPI will enable the Group to consolidate its share in the strong and stable recurring revenue streams from the company as well as provide incremental development potential to the Group’s existing revenue streams. With a more diversified portfolio, the Group expects to generate a more stable recurring revenue from its retail and office investment properties. These recurring revenues can, in turn, be used to provide internally generated funding for other projects.
The increase in the fair value of the previously held 60% interest in CPI over the carrying amount at acquisition date of P=343.19 million is included in the consolidated statement of income for the year ended December 31, 2010 as “Gain from remeasurement of previously held interest in a business combination”. Acquisition date fair values of net identifiable assets follow (in thousands):
Cash and cash equivalents P=453,537 Receivables from tenants 69,386 Other receivables 29,612 Other current assets 23,276 Investment properties and property and equipment 4,180,000 Accounts payable and accrued expenses (260,978) Income tax payable (3,009) Reservation fee and other deposits (26,144) Security deposits (103,426) Loans payable (908,000) Deferred income tax liabilities - net (67,860) Acquisition date fair value of net identifiable assets P=3,386,394

- 30 -
*SGVMC116622*
The gross contractual amount of CPI’s receivables amounted to P=114.93 million. All contractual cash flows are expected to be collected. Prior to business combination, the Parent Company had existing receivable from CPI of P=41.85 million which was settled outside the business combination. This did not have any impact on the cost of acquisition and resulting goodwill. From the date of acquisition to December 31, 2010, CPI had contributed P=431.94 million of revenue and other income and P=283.10 million to net income of the Group. If the combination had taken place at the beginning of the year, contributions to revenue and other income would have been P=480.65 million, while contributions to net income would have been P=308.35 million for the year ended December 31, 2010.
b.) Acquisition of FAPI Cash paid by the Parent Company to AIIPI for the remaining 40% share in FAPI amounted to P=383.23 million. Excess of fair value of net identifiable assets over the consideration paid on the business combination of FAPI follows (in thousands):
Amount of consideration for the 40% interest acquired P=383,226 Add acquisition date fair value of previously held 60% interest 744,505 Less acquisition date fair value of net identifiable assets 1,136,789 Excess of fair value of identifiable net assets over consideration P=9,058
Excess of fair value of net identifiable assets over the consideration paid is shown as a separate line item in the consolidated statements of income.
The increase in fair value of previously held 60% interest in FAPI over the carrying amount at acquisition date of P=174.05 million is included in the consolidated statement of income for the year ended December 31, 2010 as “Gain from remeasurement of previously held interest in a business combination”. Acquisition date fair values of the identifiable assets follow (in thousands):
Cash and cash equivalents P=152,782 Contracts receivable 229,719 Due from a related party 103,222 Other receivables 24,520 Real estate inventories 1,360,000 Other assets 7,742 Accounts payable and accrued expenses (403,263) Loans payable (250,000) Deferred tax liabilities (87,933) Acquisition date fair value of net identifiable assets P=1,136,789
The gross contractual amount of FAPI’s receivables amounted to P=315.10 million. All contractual cash flows are expected to be collected.

- 31 -
*SGVMC116622*
Prior to business combination, the Parent Company had existing receivables from FAPI of P=104.05 million which was settled outside the business combination. This did not have any impact on the cost of acquisition and resulting excess of fair value of identifiable net assets over consideration.
From the date of acquisition to December 31, 2010, FAPI had contributed P=393.02 million of revenue and other income and P=100.03 million to net income of the Group. If the combination had taken place at the beginning of the year, contributions to revenue and other income would have been P=396.11 million, while contributions to net income would have been P=101.18 million for the year ended December 31, 2010.
Net cash payments for the business combinations with CPI and FAPI are shown below (in thousands):
Cash consideration paid for: CPI P=780,000 FAPI 383,226 1,163,226 Cash and cash equivalents acquired from: CPI (181,415) FAPI (61,113) P=920,698
Total gain from remeasurement of previously-held interests in CPI and FAPI amounted to P=517.24 million, shown as part of ‘Revenue and Other Income’ in the consolidated statements of income.
Had CPI and FAPI been consolidated from January 1, 2010, the consolidated revenues and other income would have been P=8.77 billion, while the consolidated net income would have been P=2.98 billion for the year ended December 31, 2010.
All transaction costs related to the business combination were paid by previous owners.
None of the goodwill recognized is expected to be deductible for income tax purposes.
Goodwill in the Group’s consolidated statements of financial position consists of (amount in thousands):
Festival Supermall structure P=3,745,945 FAC 494,744 CPI 326,553 P=4,567,242
Below is the movement of goodwill (in thousands):
2011 2010 Balance at beginning of period P=4,567,242 P=5,445,488 Acquisition − (878,246) Balance at end of period P=4,567,242 P=4,567,242

- 32 -
*SGVMC116622*
5. Segment Reporting
For management purposes, the Group is organized into the following business units:
Real Estate This involves the acquisition of land, planning and development of large-scale fully integrated residential communities as well as the development and sale of residential lots, housing units, medium-rise residential buildings, farm estates, industrial parks, residential resort projects, a private membership club and condominium buildings.
Leasing This involves the operations of Festival Supermall (the Mall) and the leasing of office spaces in Makati City and Alabang, Muntinlupa City.
Management monitors the operating results of its business units separately for the purpose of making decisions about resource allocation and performance assessment. Segment performance is evaluated based on profit or loss, which in certain respects, are measured similarly as net income in the consolidated financial statements.
The chief operating decision-maker has been identified as the executive committee. This committee reviews the Group’s internal reports in order to assess performance and allocate resources. Management has determined the operating segments based on these reports. The Group does not report its results based on geographical segments because the Group operates only in the Philippines.
No operating segments have been aggregated to form the above reportable segments.
Transfer prices between segments are on an arm’s length basis and have the terms equivalent to transactions entered into with third parties.
The financial information about the financial position and result of operations of these business segments for the years ended December 31, 2011 and 2010 are summarized below (amounts in thousands). December 31, 2011
Real Estate Operations
Leasing Operations Combined
Adjustments and
Eliminations Consolidated Revenue and other income except equity
in net earnings of an associate: External P=8,830,409 P=1,705,147 P=10,535,556 (P=946,279) P=9,589,277 Inter-segment 86,978 − 86,978 (86,978) − 8,917,387 1,705,147 10,622,534 (1,033,257) 9,589,277 Equity in net earnings of an associate 63,407 − 63,407 − 63,407 P=8,980,794 P=1,705,147 P=10,685,941 (P=1,033,257) P=9,652,684 Net income P=2,854,587 P=1,006,460 P=3,861,047 (P=920,707) P=2,940,340 Adjusted EBITDA P=3,271,867 P=1,322,607 P=4,594,474 (P=962,732) P=3,631,742 Segment assets P=51,159,365 P=16,461,257 P=67,620,622 P=681,508 P=68,302,130 Less deferred tax assets − 18,071 18,071 − 18,071 Net segment assets P=51,159,365 P=16,443,186 P=67,602,551 P=681,508 P=68,284,059 (Forward)

- 33 -
*SGVMC116622*
Real Estate Operations
Leasing Operations Combined
Adjustments and
Eliminations Consolidated Segment liabilities P=22,458,323 P=2,105,878 P=24,564,201 P=56,930 P=24,621,131 Less deferred tax liabilities 1,530,346 − 1,530,346 156,980 1,687,326 Net segment liabilities P=20,927,977 P=2,105,878 P=23,033,855 (P=100,050) P=22,933,805 Cash flows from: Operating activities (P=4,045,451) P=1,929,657 (P=2,115,794) (P=2,000) (P=2,137,713) Investing activities (371,365) 93,662 (277,703) (946,279) (1,223,982) Financing activities 3,064,751 (399,459) 2,665,292 90,984 2,756,276
December 31, 2010
Real Estate Operations
Leasing Operations Combined
Adjustments and
Eliminations Consolidated Revenue and other income except equity in
net earnings of an associate: External P=6,646,054 P=1,517,102 P=8,163,156 P=503,657 P=8,666,813 Inter-segment 72,355 − 72,355 (72,355) − 6,718,409 1,517,102 8,235,511 431,302 8,666,813 Equity in net earnings of an associate 55,217 − 55,217 − 55,217 P=6,773,626 P=1,517,102 P=8,290,728 P=431,302 P=8,722,030 Net income P=1,688,568 P=798,163 P=2,486,731 P=465,495 P=2,952,226 Adjusted EBITDA P=1,982,527 P=1,065,223 P=3,047,750 (P=28,906) P=3,018,844 Segment assets P=46,610,847 P=14,215,162 P=60,826,009 P=1,040,728 P=61,866,737 Less deferred tax assets − 15,312 15,312 − 15,312 Net segment assets P=46,610,847 P=14,199,850 P=60,810,697 P=1,040,728 P=61,851,425 Segment liabilities P=18,079,390 P=2,121,169 P=20,200,559 (P=25,073) P=20,175,486 Less deferred tax liabilities 1,466,473 − 1,466,473 163,624 1,630,097 Net segment liabilities P=16,612,917 P=2,121,169 P=18,734,086 (P=188,697) P=18,545,389 Cash flows from: Operating activities (P=416,392) P=230,397 (P=185,995) P=72,355 (P=113,640) Investing activities (1,604,802) (152,831) (1,757,633) − (1,757,633) Financing activities (2,007,716) (47,203) (2,054,919) (72,355) (2,127,274)
December 31, 2009
Real Estate Operations
Leasing Operations Combined
Adjustments and
Eliminations Consolidated Revenue and other income except equity
in net earnings of an associate: External P=4,275,394 P=1,370,892 P=5,646,286 P=− P=5,646,286 Inter-segment 42,833 − 42,833 (42,833) − 4,318,227 1,370,892 5,689,119 (42,833) 5,646,286 Equity in net earnings of an associate 37,527 − 37,527 − 37,527 P=4,355,754 P=1,370,892 P=5,726,646 (P=42,833) P=5,683,813 Net income P=1,393,680 P=624,520 P=2,018,200 P=− P=2,018,200 Adjusted EBITDA P=1,165,931 P=1,040,350 P=2,206,281 (P=57,719) P=2,148,562 Segment assets P=45,263,101 P=12,516,948 P=57,780,049 P=1,135,176 P=58,915,225 Less deferred tax assets − 10,873 10,873 − 10,873 Net segment assets P=45,263,101 P=12,506,075 P=57,769,176 P=1,135,176 P=58,904,352 Segment liabilities P=18,164,745 P=1,564,053 P=19,728,798 P=8,954 P=19,737,752 Less deferred tax liabilities 1,369,053 − 1,369,053 136,560 1,505,613 Net segment liabilities P=16,795,692 P=1,564,053 P=18,359,745 (P=127,606) P=18,232,139 Cash flows from: Operating activities P=164,868 P=619,725 P=784,593 P=93,998 P=878,591 Investing activities (740,018) (114,604) (854,622) − (854,622) Financing activities 3,498,127 (103,844) 3,394,283 (93,998) 3,300,285

- 34 -
*SGVMC116622*
Investing activities consist of acquisitions of raw land and additions to property and equipment, investment properties and other investments.
The following table shows a reconciliation of the adjusted earnings before interest, taxes, depreciation and amortization (EBITDA) to income before income tax:
2011 2010 2009 (In Thousands) Adjusted EBITDA P=3,631,742 P=3,018,844 P=2,148,562 Depreciation and amortization
(Note 20) (287,120) (243,649) (214,446) Operating profit 3,344,622 2,775,195 1,934,116 Interest income (Note 22) 542,113 565,355 400,708 Interest and other finance charges
(Note 22) (469,400) (416,655) (208,281) Equity in net earnings of an associate
(Note 11) 63,407 55,217 37,527 Foreign currency exchange gain - net 1,304 8,565 2,404 Excess of fair value of net
identifiable assets over consideration transferred in a business combination (Note 4) − 9,058 −
Gain from remeasurement of previously held interest in a business combination (Note 4) − 517,240 −
Income before income tax P=3,482,046 P=3,513,975 P=2,166,474
6. Cash and Cash Equivalents This account consists of:
2011 2010 (In Thousands) Cash on hand and in banks P=486,179 P=325,903 Short-term deposits 667,127 1,432,822 P=1,153,306 P=1,758,725
Cash in bank earns interest at the prevailing bank deposit rates. Short-term deposits are made for varying periods up to three (3) months depending on the immediate cash requirements of the Group and earn interest at the respective short-term deposit rates. Interest income earned on the Group’s cash and cash equivalents amounted to P=43.82 million, P=104.03 million and P=62.78 million in 2011, 2010 and 2009, respectively (see Note 22).
There is no cash restriction on the Group’s cash and cash equivalents as at December 31, 2011 and 2010.

- 35 -
*SGVMC116622*
7. Contracts Receivable
This account consists of:
2011 2010 (In Thousands) Contracts receivable P=8,085,680 P=6,826,127 Receivables from government and financial
institutions 367,228 1,019,744 P=8,452,908 P=7,845,871
Contracts receivable are collectible over varying periods within 2 to 10 years. These receivables arising from real estate sales are collateralized by the corresponding real estate properties sold.
Receivables from government and financial institutions pertain to bank and government financed real estate sales. Receivables from government and financial institutions are collectible within one year.
The following table presents the breakdown of contracts receivable by maturity dates:
2011 2010
Due Within
One Year Due After One Year Total
Due Within One Year
Due After One Year Total
(In Thousands) Contracts receivable P=948,557 P=7,137,123 P=8,085,680 P=1,453,546 P=5,372,581 P=6,826,127 Receivables from government and financial institutions 367,228 − 367,228 1,019,744 − 1,019,744 P=1,315,785 P=7,137,123 P=8,452,908 P=2,473,290` P=5,372,581 P=7,845,871
Interest income recognized on contracts receivable amounted to P=423.85 million, P=375.61 million and P=251.04 million in 2011, 2010 and 2009, respectively (see Note 22). Interest rates on contracts receivable range from 11.5% to 19% per annum in 2011, 2010 and 2009.
The Group entered into various agreements with financial institutions whereby the Group sold its contracts receivable with a provision that the Group should buy these receivables back when certain conditions happen such as receivables becoming overdue for two to three consecutive months, when the contract to sell has been cancelled, when the accounts remain outstanding after the lapse of 5-year holding period, when property covering the receivables becomes subject to complaint or legal action and the account’s interest rate becomes lower than the bank’s interest rate. The proceeds from the sale were used to fund development and construction of various projects.
The Group’s liability for receivables discounted included under “Accounts payable and accrued expenses” account amounted to P=1.95 billion and P=1.77 billion as of December 31, 2011 and 2010, respectively (see Note 15).
Interest paid on the loans obtained from discounting receivables amounted to P=84.08 million, P=99.30 million and P=165.98 million in 2011, 2010 and 2009, respectively.

- 36 -
*SGVMC116622*
The Group has a mortgage insurance contract with Home Guaranty Corporation (HGC), a government insurance company for a retail guaranty line. In 2010, additional P=4.00 billion retail guaranty line was granted and on July 20, 2011, the Board of HGC approved the grant of another P=4.00 billion guaranty line to the Group. As of December 31, 2011 and 2010, the contracts covered by the guaranty line amounted to P=6.75 billion and P=5.74 billion, respectively, including receivables sold with buy back provisions. The remaining P=4.76 billion and P=1.91 billion guaranty line was not yet utilized by the Group as of December 31, 2011 and 2010, respectively.
8. Other Receivables This account consists of:
2011 2010 (In Thousands) Advances to joint venture partners and contractors P=1,865,615 P=1,025,468 Receivables from tenants 256,112 281,783 Advances to employees 179,560 120,037 Receivables from homeowners’ associations 145,150 170,146 Others 99,552 60,219 2,545,989 1,657,653 Allowance for doubtful accounts 62,975 54,087 P=2,483,014 P=1,603,566
“Advances to joint venture partners and contractors” are ordinary advances which are normally offset against the share of the joint venture partners from sale of the joint venture properties and contractors’ billing for development and construction contracts.
“Receivables from tenants” represent charges to tenants for rentals and utilities normally collectible within a year. Allowance for doubtful accounts amounted to P=26.96 million and P=54.09 million as of December 31, 2011 and 2010, respectively. Provision for doubtful accounts amounted to P=1.36 million and P=7.58 million in 2010 and 2009, respectively. No provision was provided in 2011.
“Advances to employees” represent advances for project costs, marketing activities, travel and other expenses arising from the ordinary course of business which are liquidated upon the accomplishment of the purposes for which the advances were granted. “Receivables from homeowner’s associations” represent claims from the homeowner’s association of the Company’s projects for the payments of the expenses on behalf of the association. A provision for doubtful accounts amounting to P=36.01 million was provided in 2011 for portion that is doubtful of collection (see Note 20).
“Others” include receivables from buyers relating to insurance and registration of properties.
All other receivables except for a portion in advances to joint venture partners and contractors are due within one year.

- 37 -
*SGVMC116622*
Below is the movement of the allowance for doubtful accounts:
2011 2010 (In Thousands) Balance at beginning of year P=54,087 P=54,293 Provisions (Note 20) 36,014 1,361 Write-off (27,126) (1,567) Balance at end of year P=62,975 P=54,087
9. Real Estate Inventories and Land and Land Development
This account consists of:
2011 2010 (In Thousands) Land and land development P=14,091,543 P=12,807,811
2011 2010 (In Thousands) Subdivision lots and housing units for sale P=18,372,781 P=14,454,575 Investment in club project 691,357 686,430 P=19,064,138 P=15,141,005
The above inventories are stated at cost. The cost of land and land development include the (a) land acquisition, (b) costs incurred relative to acquisition and transfer of land title in the name of the Group such as real property taxes and (c) costs incurred on initial development of the raw land in preparation for future projects. They are classified to subdivision lots and housing units for sale when the project construction starts and the necessary permits are secured. Cost of units sold as of December 31, 2011, 2010 and 2009 amounted to P=3.61 billion, P=3.00 billion and P=1.79 billion, respectively. Borrowing costs capitalized as part of real estate inventories amounted to P=447.37 million, P=527.83 million, and P=363.50 million in 2011, 2010 and 2009, respectively. Capitalization rate is 5%, 9% and 6% in 2011, 2010 and 2009, respectively. In February 2009, the Parent Company signed an agreement with the Cebu City Government to develop 50.6 hectares of the South Road Properties, a 300-hectare reclaimed land project located in Cebu City. The agreement involves:
(a) purchase by the Group of 10.6 hectares of the property to be developed into a modern urban
center consisting of residential, office, commercial, hotel and leisure buildings and a public promenade - a 1 kilometer long waterfront lifestyle strip that will offer a range of seaside leisure activities. Payments made to the Cebu City Government in 2011 and 2010 amounted to P=255.5 million and P=342.0 million, respectively, with the remaining balance of the total purchase price payable over the next three years after December 31, 2011. As of December 31, 2011, the Group has started the land development activities for future construction.

- 38 -
*SGVMC116622*
(b) development of 40 hectares of the property under a profit-sharing arrangement with the Cebu City Government. The profit sharing of FLI and the Cebu City Government is 90% and 10%, respectively. The 40 hectares will be developed in four (4) phases over a 20-year period with the Group contributing the development costs, as well as the marketing and management services. The Group plans to develop the 40 hectares mainly into a residential resort town composed of Italian-inspired residential communities which will also include a central open space area called as The Piazza. The Piazza, patterned after the famous Italian central parks, will contain a church, a school, a soccer field, numerous al fresco restaurants, neighborhood stores and support outlets. The Group expects to turnover the first building for buyer's occupancy by December 2012.
As of December 31, 2011, the Group has started the construction of two five-storey medium rise building on the joint development properties.
Please refer to Note 18 for major land purchases in 2011. In May 2010, the Group purchased land in Cainta, Rizal for P=623.72 million, of which P=81.17 million and P=93.56 million was paid in 2011 and 2010, respectively. The Group is committed to pay the remaining balance in monthly installments starting June 30, 2011 until May 31, 2015. As of December 31, 2011, no development has started yet on the property.
In March 2009, the Group purchased certain parcels of land in Pasig City, Metro Manila with an aggregate area of 2 hectares. Purchase price of P=149.65 million is payable in seven (7) semi-annual installments, of which the first payment of P=11.22 million was made in March 2009, upon signing of the Deed of Absolute Sale and second payment of P=13.84 million was made in September 2009.
Total payments made by the Group in 2011 and 2010 amounted to P=55.37 million and P=41.53 million, respectively. The outstanding balance of the purchase price, which is included in “Accounts payable” (see Note 15), is secured by a real estate mortgage over certain properties of the Group located in Alabang, Muntinlupa City and Antipolo, Rizal.
The Parent Company has mortgaged a total of 10.6 hectares of developed land located in Antipolo and Alabang with a total fair market value of P=170.68 million as of December 31, 2011 and 2010. There are no unusual purchase commitments for years 2011, 2010 and 2009.
10. Financial Assets at Fair Value Through Other Comprehensive Income and Available-for- Sale Financial Assets
Financial assets at fair value through other comprehensive income account as of December 31, 2011 consist of (amounts in thousands):
Quoted: Investments in shares of stock P=3,321 3,321 Unquoted investments in shares of stock 21,305 P=24,626

- 39 -
*SGVMC116622*
Available-for-sale financial assets account as of December 31, 2010 consists of (amounts in thousands):
Quoted: Investment in bonds P=95,444 Investments in shares of stock 3,321 98,765 Unquoted investments in shares of stock 24,305 P=123,070
Upon adoption of PFRS 9 effective January 1, 2011 (see Note 2), the Group is allowed to classify equity securities not held for trading as financial assets at FVTOCI. The unrealized loss on investment in quoted shares of stocks included under ‘Revaluation reserve on available-for-sale financial assets’ (prior to January 1, 2011) amounted to P=2.62 million 2010. There were no movements in the unrealized loss on investment in quoted shares of stocks recognized in the consolidated statements of financial position as of December 31, 2011 and 2010. The adoption of PFRS 9 allowed the Company to reclassify the ‘revaluation reserve on available for sale financial assets’ as ‘revaluation reserve on financial assets through other comprehensive income’ on January 1, 2011.
Investment in bonds pertains to a dollar investment with face value of US$2.00 million at 103.895 or US $2.08 million, acquired in July 2010 maturing on July 18, 2013, with put option on July 18, 2011. The Company exercised the put option in 2011.
Unquoted investments in shares of stock include unlisted preferred shares in a public utility company which the Group will continue to carry as part of the infrastructure that it provides for its real estate development projects. These are carried at cost less impairment, if any.
11. Investment in an Associate This account consists of:
2011 2010 (In Thousands) At equity: Acquisition cost P=800,000 P=800,000 Accumulated equity in net earnings: Balance at the beginning of year 1,238,175 1,182,958 Dividends received (540,000) − Equity in net earnings for the year 63,407 55,217 Balance at end of year 761,582 1,238,175 1,561,582 2,038,175 Share in revaluation increment on land
at deemed cost 1,876,422 1,876,422 Share in other components of equity 361,794 361,794 P=3,799,798 P=4,276,391

- 40 -
*SGVMC116622*
The Parent Company has a 20% interest in FAI which is involved primarily in the development of commercial buildings, residential condominiums and land. FAI is also involved in leasing of commercial real estate, marketing, managing mall and theater operations.
As of December 31, 2009, FAI had 21% interest in the Parent Company, making the Parent
Company also an associate of FAI. In 2010, the Group’s parent company, FDC, purchased the 21% ownership interest of FAI in the Parent Company. The transaction resulted to the following: (a) increase in FDC’s ownership interest in the Parent Company from 49.14% to 53.48%; (b) net gain from the transaction recognized in FAI’s equity amounting to P=1.81 billion of which 20% or P=361.79 million was taken up by the Parent Company in its consolidated financial statements as “share in other components of equity of an associate”; and (c) the Parent Company becoming no longer an associate of FAI as of December 31, 2010.
On October 26, 2011 FAI declared cash dividend of P=0.45 per share for a total of P=2.70 billion for all stockholders of record as of October 26, 2011. The Group received its 20% share in the dividends amounting to P=540.00 million.
Land at deemed cost of an associate consists of land held by FAI for long-term rental yields and for capital appreciation, with estimated aggregate fair value of P=18.10 billion determined as of December 31, 2007 based on a third party appraisal using market data approach. In the market data approach, the value of the land is based on sales and listings of comparable property registered within the vicinity.
Summarized financial information of FAI is as follows:
2011 2010 (In Thousands) Total assets P=31,801,206 P=33,107,248 Total liabilities 10,038,635 9,253,243 Revenue and other income 2,067,194 1,541,874 Cost and expenses 1,223,680 1,177,074 Gross profit 685,087 343,196 Income from operations 846,630 389,582 Net income before equity take up on the Group 608,775 276,085
12. Investment Properties
The rollforward analysis of this account as of December 31 follows:
2011
Land Buildings and
Improvements Machinery and
Equipment Total (In Thousands) Cost Balances at beginning of year P=3,968,263 P=8,890,511 P=34,657 P=12,893,431 Additions and transfers 374 945,354 14,510 960,238 Balances at end of year 3,968,637 9,835,865 49,167 13,853,669 Accumulated Depreciation Balances at beginning of year − 1,280,277 13,987 1,294,264 Depreciation and transfers − 353,498 4,298 357,796 Balances at end of year − 1,633,775 18,285 1,652,060 Net Book Value P=3,968,637 P=8,202,090 P=30,882 P=12,201,609

- 41 -
*SGVMC116622*
2010
Land Buildings and Improvements
Machinery and Equipment Total
(In Thousands) Cost Balances at beginning of year P=3,962,849 P=7,002,568 P=− P=10,965,417 Additions and transfers 5,414 401,400 34,657 441,471 Additions from business combination
(Note 4) − 1,486,543 − 1,486,543 Balances at end of year 3,968,263 8,890,511 34,657 12,893,431 Accumulated Depreciation Balances at beginning of year – 1,027,566 − 1,027,566 Depreciation and transfers – 252,711 13,987 266,698 Balances at end of year − 1,280,277 13,987 1,294,264 Net Book Value P=3,968,263 P=7,610,234 P=20,670 P=11,599,167
Investment properties consist mainly of the commercial mall and buildings acquired as part of the exchange transaction in September 2006 (see Note 1).
The aggregate fair value of the Group’s investment properties amounted to P=19.76 billion as of December 31, 2011 and 2010, based on a third party appraisal using the market data approach for land and income approach using discounted cash flow analysis for buildings.
In the market data approach, the value of investment properties is based on sales and listings of comparable property registered within the vicinity. The technique of this approach requires establishing comparable property by reducing reasonable comparative sales and listing to a common denominator. This is done by adjusting the difference between the subject properties and those actual sales and listing regarded as comparable. The properties used as basis of comparison are situated within the immediate vicinity of the subject properties. While in the income approach, all expected cash flows from the use of the assets were projected and discounted using the appropriate discount rate reflective of the market expectations.
Rental income from investment properties amounted to P=1.54 billion, P=1.41 billion and, P=1.19 billion in 2011, 2010 and 2009, respectively. Operating expenses from investment properties amounted to P=425.65 million, P=400.88 million and, P=374.60 million in 2011, 2010 and 2009, respectively.
13. Property and Equipment The rollforward analysis of this account as of December 31 follows:
2011
Buildings Machinery and
Equipment Transportation
Equipment Furniture
and Fixtures Leasehold
Improvements Construction
in Progress Total (In Thousands) Cost Balances at beginning of year P=9,085 P=170,050 P=72,610 P=47,881 P=22,846 P=1,418,101 P=1,740,573 Additions - net of transfers 166,398 5,032 662 1,364 9,359 (338,832) (156,017) Write off − − − (50) − − (50) Balances at end of year 175,483 175,082 73,272 49,195 32,205 1,079,269 1,584,506 Accumulated Depreciation and
Amortization Balances at beginning of year 2,774 151,863 48,854 40,833 21,297 − 265,621 Depreciation and amortization - net of
transfers (Note 20) 10,392 6,587 7,518 2,939 1,629 − 29,065 Write off − − − (50) − − (50) Balances at end of year 13,166 158,450 56,372 43,722 22,926 – 294,636 Net Book Value P=162,317 P=16,632 P=16,900 P=5,473 P=9,279 P=1,079,269 P=1,289,870

- 42 -
*SGVMC116622*
2010
Buildings Machinery and
Equipment Transportation
Equipment Furniture
and Fixtures Leasehold
Improvements Construction
in Progress Total (In Thousands) Cost Balances at beginning of year P=30,664 P=188,757 P=56,276 P=45,369 P=21,615 P=916,016 P=1,258,697 Additions - net of transfers (18,536) (18,707) 16,334 1,203 674 (201,017) (220,049) Additions from business combination
(Note 4) − − − 1,309 557 703,102 704,968 Disposals (3,043) − − − − − (3,043) Balances at end of year 9,085 170,050 72,610 47,881 22,846 1,418,101 1,740,573 Accumulated Depreciation and
Amortization Balances at beginning of year 8,844 153,042 42,477 38,055 20,503 − 262,921 Depreciation and amortization - net of
transfers (Note 20) (6,070) (1,179) 6,377 2,778 794 − 2,700 Balances at end of year 2,774 151,863 48,854 40,833 21,297 − 265,621 Net Book Value P=6,311 P=18,187 P=23,756 P=7,048 P=1,549 P=1,418,101 P=1,474,952
Capitalized borrowing costs amounted to P=12.33 million, P=26.22 million and, P=29.90 million in 2011, 2010 and 2009, respectively. Capitalization rate is 4.03%, 4.6% and 4.8% in 2011, 2010 and 2009, respectively.
14. Other Assets This account consists of:
2011 2010 (In Thousands) Input taxes P=427,222 P=154,499 Creditable withholding taxes 326,348 211,305 Deposits 55,325 59,528 Construction materials and supplies 19,222 27,042 Prepaid expenses and others 81,131 15,329 P=909,248 P=467,703
“Input taxes” represents the VAT due or paid on purchases of goods and services subjected to VAT that the Group can claim against any future liability to the Bureau of Internal Revenue for output VAT on sale of goods and services subjected to VAT.
“Creditable withholding taxes” is the tax withheld by the withholding agents from payments to the sellers which is creditable against the income tax payable.
“Prepaid expenses and others” includes commissions paid to brokers relating to the sales of real estate inventories which do not qualify yet for revenue recognition. Such amount will be recognized as expense when the qualification for revenue recognition has been met.
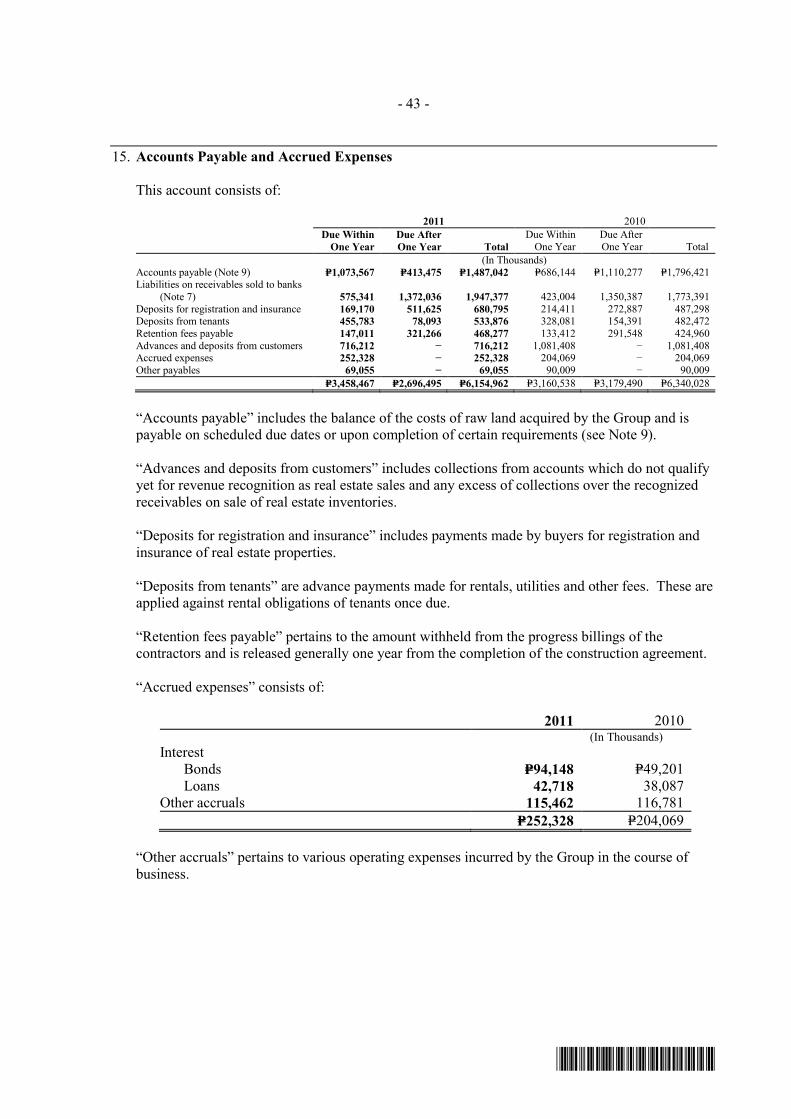
- 43 -
*SGVMC116622*
15. Accounts Payable and Accrued Expenses
This account consists of:
2011 2010
Due Within
One Year Due After One Year Total
Due Within One Year
Due After One Year Total
(In Thousands) Accounts payable (Note 9) P=1,073,567 P=413,475 P=1,487,042 P=686,144 P=1,110,277 P=1,796,421 Liabilities on receivables sold to banks
(Note 7) 575,341 1,372,036 1,947,377 423,004 1,350,387 1,773,391 Deposits for registration and insurance 169,170 511,625 680,795 214,411 272,887 487,298 Deposits from tenants 455,783 78,093 533,876 328,081 154,391 482,472 Retention fees payable 147,011 321,266 468,277 133,412 291,548 424,960 Advances and deposits from customers 716,212 − 716,212 1,081,408 − 1,081,408 Accrued expenses 252,328 − 252,328 204,069 − 204,069 Other payables 69,055 − 69,055 90,009 − 90,009 P=3,458,467 P=2,696,495 P=6,154,962 P=3,160,538 P=3,179,490 P=6,340,028
“Accounts payable” includes the balance of the costs of raw land acquired by the Group and is payable on scheduled due dates or upon completion of certain requirements (see Note 9).
“Advances and deposits from customers” includes collections from accounts which do not qualify yet for revenue recognition as real estate sales and any excess of collections over the recognized receivables on sale of real estate inventories.
“Deposits for registration and insurance” includes payments made by buyers for registration and insurance of real estate properties.
“Deposits from tenants” are advance payments made for rentals, utilities and other fees. These are applied against rental obligations of tenants once due.
“Retention fees payable” pertains to the amount withheld from the progress billings of the contractors and is released generally one year from the completion of the construction agreement.
“Accrued expenses” consists of:
2011 2010 (In Thousands) Interest Bonds P=94,148 P=49,201 Loans 42,718 38,087 Other accruals 115,462 116,781 P=252,328 P=204,069
“Other accruals” pertains to various operating expenses incurred by the Group in the course of business.

- 44 -
*SGVMC116622*
16. Loans Payable This account consists of:
2011 2010 (In Thousands) Term loans from a financial institution P=1,575,000 P=2,025,000 Developmental loans from local banks 6,936,007 4,936,167 8,511,007 6,961,167 Less current portion of loans 1,635,884 1,652,667 Long term portion of loans payable P=6,875,123 P=5,308,500
a. Term Loans from a Financial Institution
On June 17, 2005, the Group entered into a Local Currency Loan Agreement with a foreign financial institution whereby the Group was granted a credit line facility amounting to P=2.25 billion. In October 2005, the Group availed of P=1.13 billion or half of the total amount granted. The loan is payable in 10 semi-annual installments commencing December 2010 and ending June 2015. This loan carries a fixed interest rate of 7.72% per annum. In July 2007, the Group availed the remaining balance of the facility amounting to P=1.12 billion. The loan is also payable in 10 semi-annual installments commencing December 2010 and ending June 2015. This loan has a fixed annual interest rate of 7.90%. Both loans were guaranteed by FDC (see Note 18). Principal payments made in 2011 amounted to P=450.00 million.
b. Developmental Loans from Local Banks These include loans obtained from local banks. Details as of December 31 follow (in thousands):
2011 2010 Collateral Unsecured loan obtained in October 2008 with interest rate equal to
91-day PDS Treasury Fixing (PDST-F) rate plus a spread of up to1.5% per annum, payable quarterly in arrears. The principal is payable in eleven (11) equal quarterly installments starting March 2011 up to September 2013 and lump sum full payment due in December 2013. Current portion as of December 31, 2011 and 2010 amounted to P=166.67 million,. P=833,333 P=1,000,000 Clean
Unsecured loan obtained in June 2011 with interest rate equal to 91-day PDST-F rate plus a spread of up to 1% per annum, payable quarterly in arrears. The principal is payable in twelve (12) equal quarterly installments starting June 2013 up to June 2016. 750,000 − Clean
Unsecured loan obtained in March 2011 with interest rate equal to 91-day PDST-F rate plus a spread of up to 1% per annum, payable quarterly in arrears, 50% of the principal is payable in twelve (12) equal quarterly installments starting June 2013 up to March 2016 and the remaining 50% of the principal is payable in full in March 2016. 750,000 − Clean
Unsecured loan obtained in May 2011 with interest rate equal to 91-day PDST-F rate plus a spread of up to 1% per annum but not lower than 4.5%, payable quarterly in arrears, 50% of the principal is payable in twelve 12 equal quarterly installments starting August 2013 up to May 2016 and balance of 50% is payable in full in May 2016. 600,000 − Clean
(Forward)

- 45 -
*SGVMC116622*
2011 2010 Collateral Unsecured 5-year loan obtained in September 2008 payable in eleven
(11) quarterly amortizations starting December 2010 with a balloon payment at maturity date in September 2013 with interest rate equal to 91-day PDST-F rate plus fixed spread of 2% per annum, payable quarterly. Principal payments in 2010 amounted to P=27.08 million. Current portion as of December 31, 2011 and 2010 amounted to P=108.33 million. P=514,584 P=622,917 Clean
Unsecured loan obtained in April 2011 with interest rate equal to 91-day PDST-F rate plus a spread of up to 1% per annum, payable quarterly in arrears. The principal is payable in twelve (12) equal quarterly installments starting July 2013 up to April 2016. 500,000 − Clean
Unsecured loans obtained in August 2008 with interest rate equal to 91-day PDST-F rate plus a spread of up to 1% per annum. The principal is payable in twelve (12) equal quarterly installments starting November 2010 up to August 2013. Principal payments in 2011 and 2010 amounted to P=250.0 million and P=62.50 million, respectively. Current portion as of December 31, 2011 and 2010 amounted to P=250.00 million. 437,500 687,500 Clean
Unsecured loan obtained in November 2008 with interest rate equal to 91-day PDST-F rate plus a spread of up to 2% per annum, payable quarterly in arrears. The principal is payable in eleven (11) equal quarterly installments starting November 2010 up to September 2013 and lump sum full payment due in December 2013. Principal payments in 2011 amounted to P=83.33 million. Current portion as of December 31, 2011 and 2010 amounted to P=83.33 million. 416,667 500,000 Clean
Unsecured loan granted on November 2011 with a term of five years with interest rate 4.375% (inclusive of GRT), payable quarterly in arrears. The principal is payable in twelve (12) equal quarterly installments starting February 2014 up to November 2016. 400,000 − Clean
Unsecured loan obtained in June 2008 with interest rate equal to 91-day PDST-F rate plus a spread of up to 1.5% per annum, payable quarterly in arrears. Part of the principal is payable in eleven (11) equal quarterly installments starting June 2010 up to March 2013 and lump sum full payment due in June 2013. Principal payments in 2011 and 2010 amounted to P=83.33 million and P=20.83 million, respectively. Current portion as of December 31, 2011 and 2010 amounted to P=83.33 million. 375,000 458,333 Clean
Unsecured loan obtained in December 2011 with interest of 4.50% per annum (inclusive of GRT), payable quarterly in arrears. The principal is payable in twelve (12) equal quarterly installments starting March 2014 up to December 2016. 350,000 − Clean
Unsecured loan obtained by the Group in October 2008 with interest rate equal to 91-day PDST-F rate plus a spread of up to 1% per annum. The principal is payable in twelve (12) quarterly equal installments starting March 2011 up to September 2013. Current portion as of December 31, 2011 and 2010 amounted P=166.67 million. 333,333 500,000 Clean
Unsecured loans granted in May and December 2007 payable over 5-year period inclusive of 2 year grace period; 50% of the loan is payable in twelve (12) equal quarterly amortizations and balance payable on final maturity. The loans carry interest equal to 91-day PDST-F rate plus fixed spread of 2% per annum payable quarterly in arrears. Principal payments in 2011 and 2010 amounted to P=50.00 million and P=10.42 million, respectively. Current portion as of December 31, 2011 and 2010 amounted to P=190.00 million and P=50.00 million, respectively. 189,999 240,000 Clean
(Forward)

- 46 -
*SGVMC116622*
2011 2010 Collateral Unsecured 5-year loan obtained in March 2008, of which 50% of the
principal is payable in twelve (12) equal quarterly installments starting September 2010 and the remaining 50% balance is to be paid in lump sum at maturity in June 2013, with interest rate equal to 3-month PDST-F rate plus a spread of up to 2% per annum, payable quarterly in arrears. Principal payments in 2011 and 2010 amounted to P=41.66 million and P=12.50 million, respectively. Current portion as of December 31, 2011 and 2010 amounted to P=41.66 million. P=177,083 P=218,750 Clean
Unsecured loan granted on April 2010 with a term of five years with 50% of principal payable in 12 equal quarterly amortization to commence on July 2012 and 50% payable on maturity. The loan carries interest equal to 3-month PDST-F rate plus a spread of 1.5% per annum. Current portion as of December 31, 2011 amounted to P=15.00 million 120,000 120,000 Clean
Unsecured loan granted on November 10, 2011 with a term of 7 years with 2 year grace period on principal repayment. Interest for the first 92 days is 4.5% per annum inclusive of GRT, subject to quarterly repricing and payable quarterly in arrears. 50% of principal is payable in 20 equal quarterly amortizations commencing on February 10, 2014 and 50% is payable on maturity. 120,000 − Clean
Unsecured loan obtained on December 15, 2006 payable in twenty (20) equal quarterly amortizations starting in March 2008, with interest rate equivalent to 91-day T-Bill rate plus fixed spread of 2% per annum, payable quarterly in arrears and secured by a mortgage of several buildings located at the Northgate Cyberzone and assignment of the corresponding rentals. Principal payments in 2011 and 2010 amounted to P=46.00 million. Current portion as of December 31, 2011 and 2010 amounted to P=46.00 million. 46,000 92,000 Clean
Unsecured loan obtained in July 2007 payable in twenty (20) equal quarterly amortizations starting in March 2008, with interest rate equal to 91-day T-Bill rate plus fixed spread of 2% per annum, payable quarterly in arrears and secured by a mortgage of several buildings located at the Northgate Cyberzone and assignment of the corresponding rentals. Principal payments in 2011 and 2010 amounted to P=40.00 million. Current portion as of December 31, 2011 and 2010 amounted to P=40.00 million. 40,000 80,000 Clean
Unsecured loan obtained in June 2008 with interest rate equal to 91-day PDST-F rate plus a spread of up to 1.25% per annum. The principal is payable in twelve (12) equal quarterly installments starting September 2010 up to June 2013. Principal payments in 2011 and 2010 amounted to P=416.67 million and P=41.67 million. Current portion as of December 31, 2010 amounted to P=166.67 million. The loan was paid in full in 2011. − 416,667 Clean
P=6,953,499 P=4,936,167
The agreements covering the abovementioned loans provide for restrictions and requirements with respect to, among others, declaration or making payment of dividends (except stock dividends); making distribution on its share capital; purchase, redemption or acquisition of any share of stock; incurrence or assumption of indebtedness; sale or transfer and disposal of all or a substantial part of its capital assets; restrictions on use of funds; maintaining certain financial ratios; and entering into any partnership, merger, consolidation or reorganization.
The Group has complied with these contractual agreements. There was neither default nor breach noted as of December 31, 2011. As of December 31, 2011, the unamortized deferred charges related to developmental loans from local banks amounted to P=17.49 million.

- 47 -
*SGVMC116622*
17. Bonds Payable
On November 19, 2009, the Parent Company issued fixed rate bonds (the “Bonds”) with aggregate principal amount of P=5.00 billion, comprised of three (3)-year fixed rate bonds due in 2012 and five (5)-year fixed rate bonds due in 2014. The 3-year bonds have a term of 3 years from the issue date, with a fixed interest rate of 7.5269% per annum. Interest is payable quarterly in arrears starting on February 19, 2010. The 5-year bonds have a term of 5 years and one (1) day from the issue date, with a fixed interest rate of 8.4615% per annum. Interest is payable quarterly in arrears starting on February 20, 2010. Unamortized debt issuance cost on bonds payable amounted to P=36.90 million and P=50.67 million as of December 31, 2011 and 2010 respectively. Accretion in 2011 and 2010 included as part of ‘Interest and other finance charges’ amounted to P=13.88 million and P=12.65 million, respectively (see Note 22). On July 7, 2011, the Group issued another fixed rate bonds with principal amount of P=3.00 billion and term of five (5) years from the issue date. The fixed interest rate is 6.1962% per annum, payable quarterly in arrears starting on October 19, 2011. Unamortized debt issuance cost on 2011 fixed rate bonds amounted to P=31.60 million as of December 31, 2011. Accretion in 2011 included as part of ‘Interest and other finance charges’ amounted to P=2.69 million. As of December 31, 2011 and 2010, the carrying value of bonds payable (net of unamortized deferred charges) amounted to P=7.98 billion and P=4.95 billion, respectively (see Note 22). Current portion of the bonds payable amounted to P=0.5 billion while the non-current portion amounted to P=7.5 billion.
18. Related Party Transactions
Parties are considered to be related if one party has the ability, directly or indirectly, to control the other party in making financial and operating decisions or the parties are subject to common control of the Group’s ultimate parent company. Related parties may be individuals or corporate entities.
Affiliates are entities under common control of ALG.
FDC, the parent company of FLI, guarantees the Group’s term loans from a financial institution with balance of P=1.58 billion and P=2.03 billion as of December 31, 2011 and 2010, respectively (see Note 16).
The Group leases from FDC, land and buildings located at San Juan City for its head office for a monthly rental of P=3.76 million in 2011, P=3.27 million in 2010, and P=2.84 million in 2009.
The Group maintains cash and short-term deposits accounts with a local bank under common control of FDC. Cash and short-term deposits balances with this local bank amounted to P=0.83 billion and P=0.33 billion as of December 31, 2011 and 2010 (see Note 6).

- 48 -
*SGVMC116622*
In 2007, the Group entered into a development agreement with GCK Realty Corporation (GCK), an affiliate. The agreement provides that the Parent Company shall undertake the construction of a condominium building on the land owned by GCK located in Kamputhaw, Cebu City.
The agreement further provides that the Parent Company shall shoulder all costs and expenses
necessary and incidental to the construction of the building. The saleable condominium units forming part of the building as developed shall be allocated between the Group and GCK on a 92% and 8% share, respectively.
GCK shall pay the Group management fee and the reimbursable commissions paid by the Group
to brokers based on certain percentage of the gross selling price of the units owned by GCK. In 2011 and 2010, management fee and reimbursable commissions recognized in the consolidated statements of income amounted to P=6.17 million and P=2.54 million, respectively.
The Group shall likewise set aside an amount equivalent to a certain percentage of all collections
received from the sale of units of GCK for expenses related to maintenance and upkeep of the building.
In 2010, the Group started to remit sales on the sold units belonging to GCK. Outstanding balance
due from GCK as of December 31, 2011 and 2010 amounted to P=46.15 million and P=15.44 million included in “advances to joint venture partners and contractors” under other accounts receivables, respectively.
In 2011, the Parent Company purchased from FAI a parcel of land located at Filinvest Corporate
City (FCC), Alabang, Muntinlupa City for total purchase price of P=429.01 million. The Parent Company is now developing a project on this property known as The Studio City.
Also in 2011, the Parent Company entered into a joint venture agreement with FAI and another
party for the development of condominium project known as The Levels. Under the agreement, FAI and the other party will contribute the land located in FCC and the Parent Company will shoulder the development and construction costs. The value of land contributed amounted to
P=815.64 million, 74% owned by FAI and 26% owned by the other party. The profit sharing for this project shall be 88%, 8.8% and 3.2% for FLI, FAI and the other party, respectively.
Aside from the abovementioned transactions, the Group also enters into transactions with FDC,
FAI, an associate and other related parties consisting mainly of interest-bearing and noninterest-bearing cash advances and share in various expenses such as payroll, supplies, and utilities provided by the Group. Interest rate is 6% for interest bearing advances in 2011 and 2010.
The Group made advances to its affiliate amounting to P=29.19 million and P=77.38 million in 2011 and 2010, respectively. The details of the account balances and transactions with related parties are as follows
(in thousands):
Rental Income (Expense) Management and
Marketing Fee Income Due from
Related Parties Due to
Related Parties 2011 2010 2011 2010 2011 2010 2011 2010 Parent – FDC (P=39,247) (P=41,149) P=15,625 P=4,673 P=13,116 P=18,815 P=64 P=20 Associate – FAI (89,030) (85,167) − − 5,172 9,609 16,741 15,353 Other affiliates − − − − 228,469 157,498 31,606 67,270 (P=128,277) (P=126,316) P=15,625 P=4,673 P=246,757 P=185,922 P=48,411 P=82,643
Management and marketing fee income is included in ‘Others’ under the Revenue and Other
Income section of the consolidated statements of income.

- 49 -
*SGVMC116622*
Key Management Personnel Compensation of key management personnel consists of short-term employee salaries and benefits amounting to P=23.90 million, P=17.30 million and P=13.00 million in 2011, 2010 and 2009, respectively. Post-employment benefits of key management personnel amounted to P=5.50 million, P=1.89 million and P=0.93 million in 2011, 2010 and 2009, respectively.
19. Interest in Joint Ventures
The amounts shown below are the Group’s 60% share of the assets, liabilities, income and expenses on its joint ventures (CPI, FAC and FAPI) which are proportionately consolidated into the Group’s consolidated financial statements as of December 31, 2011 and 2010 and for each of the years in the period ended December 31, 2011. As discussed in Note 4, the Parent Company acquired the remaining 40% interests in both CPI and FAPI in February 2010, making them wholly owned subsidiaries of the Parent Company. In 2011 and 2010, interest in joint venture pertains only to FAC.
2011 2010 (In Thousands) Assets Cash and cash equivalents P=64,262 P=54,632 Other receivables 18,955 14,647 Investment properties 905,788 951,861 Deferred tax assets 8,467 9,394 Other assets 63,316 61,398 P=1,060,788 P=1,091,932 Liabilities Accounts payable and accrued expenses P=112,851 P=98,178 Due to related parties 505 468 Loans payable 430,000 360,000 P=543,356 P=458,646
2011 2010 2009 (In Thousands) Revenue and other income P=199,016 P=185,294 P=590,940 Costs and expenses 81,959 86,088 307,904 Income before income tax 117,057 99,206 283,036 Provision for income tax 26,960 23,561 45,778 Net income P=90,097 P=75,645 P=237,258
2011 2010 2009 (In Thousands) Cash flows from: Operating activities (P=52,301) P=154,227 P=362,632 Investing activities 362 (2,179) (120,695) Financing activities 55,993 (102,008) (128,429)

- 50 -
*SGVMC116622*
The Group and its joint venture partners have joint control over the above entities despite the Group’s 60% share in the joint ventures. This is exhibited by the existence of special voting right of the joint venture partners in major operating and financial decisions affecting the joint ventures. In these joint ventures, the decisions require the unanimous consent of the parties sharing control.
The Group, in recent years, has preferred to enter into joint venture agreements with landowners instead of acquiring raw land. The Group’s interests in these joint ventures vary depending on the value of the land against the estimated development costs. These joint venture agreements entered into by the Group only relate to the development and sale of subdivision lots, with certain specified lots allocated to the joint venture partners to be sold on a lot-only basis.
The Group’s joint venture arrangements typically require the joint venture partners to contribute the land free from any lien, encumbrance and tenants or informal settlers to the project, with the Group bearing all costs related to and development and the construction of subdivision facilities. The Group and its joint venture partners then agree on the lot allocation based on joint venture sharing ratio. Sales and marketing costs are allocated to both the Group and the joint venture partners, with the joint venture agreements specifying a certain percentage of the contract price of the lots sold for the joint venture partners as the sales and marketing costs (including commissions to brokers) attributable to the sale of such lots. However, the Group is responsible for organizing and conducting actual sales and marketing activities. The share of each party from the units completed is based on the value of their contribution to the project. The Group handles the marketing and selling activities and the share of the other party for such expenses are deducted from the proceeds of the sale of its apportioned units.
20. General and Administrative Expenses The account consists of:
2011 2010 2009 (In Thousands) Salaries, wages and employee benefits P=280,164 P=226,090 P=207,182 Taxes and licenses 90,469 88,054 83,671 Depreciation and amortization
(Notes 12 and 13) 75,401 46,979 22,281 Transportation and travel 71,155 58,386 52,171 Outside services 55,994 45,876 40,755 Communications, light and water 47,671 50,293 21,150 Rent (Note 18) 47,110 49,314 42,268 Entertainment, amusement and
recreation (EAR) 46,153 27,355 20,589 Provision for doubtful accounts (Note 8) 36,014 1,361 7,580 Repairs and maintenance 31,448 37,403 26,146 Insurance 25,959 17,957 9,097 Retirement costs (Note 24) 22,375 12,742 12,635 Corporate advertisements 20,698 54,822 22,418 Office supplies 14,542 12,584 12,693 Dues and subscriptions 9,961 6,285 6,437 Others 45,778 64,603 78,313 P=920,892 P=800,104 P=665,386

- 51 -
*SGVMC116622*
21. Selling and Marketing Expenses The account consists of:
2011 2010 2009 (In Thousands) Selling, advertising and promotions P=260,340 P=199,757 P=147,315 Brokers’ commissions 232,158 209,090 194,483 Service fees 137,469 88,754 59,722 Sales office direct costs 64,738 54,420 43,662 Salaries and wages 35,753 34,937 29,404 Others 11,950 6,630 5,629 P=742,408 P=593,588 P=480,215
22. Interest and Other Finance Charges
The following table shows the component of interest income, interest expense and other financing charges recognized in the consolidated statements of income:
2011 2010 2009 (In Thousands) Interest income on: Contracts receivable (Note 7) P=423,847 P=375,614 P=251,042 Short-term deposits and others (Note 6) 118,266 189,741 149,666 P=542,113 P=565,355 P=400,708 Interest and other finance charges: Interest expense on loans and bonds
payable net of interest capitalized (Notes 16 and 17) P=426,643 P=364,708 P=177,867
Amortization of transaction costs of loans and bonds 18,839 12,829 2,063 Other finance charges 23,918 39,118 28,351 P=469,400 P=416,655 P=208,281
23. Other Income
The account consists of:
2011 2010 2009 (In Thousands) Forfeited reservations and payments P=276,943 P=321,397 P=42,559 Income from amusement centers, parking and other lease-related activities 205,648 121,719
210,531
Processing fees 55,450 55,312 108,818 Service fees 8,118 2,654 16,647 Others 17,942 1,870 2,426 P=564,101 P=502,952 P=380,981

- 52 -
*SGVMC116622*
24. Retirement Costs The Group has noncontributory defined benefit pension plan covering all full-time regular employees. The plan provides for lump-sum benefits equivalent to 100% of the employee’s salary for every year of creditable continuous service. The normal retirement age is 60 years old, however, an employee who attains the age of 55 with 15 years of service and opts for an early retirement is entitled to benefits ranging from 70% to 90% of the normal retirement pay depending on the age upon retirement. The Group updates the actuarial valuation every year by hiring the services of a third party professionally qualified actuary.
The components of retirement costs included in “General and administrative expenses” account in the consolidated statements of income are as follows:
2011 2010 2009 (In Thousands) Current service cost P=13,058 P=12,035 P=7,736 Interest cost 15,440 9,651 9,501 Expected return on plan assets (7,098) (7,522) (4,602) Net actuarial loss (gain) recognized 975 (1,422) − P=22,375 P=12,742 P=12,635
The amount of retirement liabilities recognized in the consolidated statements of financial position follows:
2011 2010 (In Thousands) Present value of benefit obligation P=199,287 P=181,650 Fair value of plan assets 103,504 101,398 95,783 80,252 Unrecognized net actuarial loss (36,575) (31,812) P=59,208 P=48,440
Changes in the present value of the defined benefit obligation are as follows:
2011 2010 (In Thousands) Balance at beginning of year P=181,650 P=113,604 Current service cost 13,058 12,035 Interest cost 15,440 9,651 Actuarial loss − 48,807 Benefits paid (10,861) (2,447) P=199,287 P=181,650

- 53 -
*SGVMC116622*
Changes in the fair value of plan assets are as follows:
2011 2010 (In Thousands) Balance at beginning of year P=101,398 P=107,464 Expected return on plan assets 7,098 7,522 Actuarial loss on plan assets (4,992) (13,588) P=103,504 P=101,398
The actual return on the plan assets amounted to P=2.11 million in 2011 and P=6.07 million in 2010.
The Group does not expect to contribute to its plan assets in the next 12 months.
The amounts of present value of defined benefit obligation, fair value of plan assets, deficit in the plan and experience adjustments arising on plan assets or liabilities recognized for the current and previous four periods follow:
2011 2010 2009 2008 2007 (In Thousands) Present value of obligation P=199,287 P=181,650 P=113,604 P=105,572 P=105,801 Fair value of plan assets 103,504 101,398 107,464 76,702 72,360 Deficit P=95,783 P=80,252 P=6,140 P=28,870 P=33,441 Experience adjustments P=− P=17,557 P=2,113 (P=862) (P=16,433) The major assumptions used to determine retirement benefits of the Group for the years ended December 31, 2011 and 2010 are as follows:
2011 2010 Discount rate 8.5% 8.5% Salary increase rate 8.0% 8.0% Expected return on plan assets 7.0% 7.0%
Major categories of plan assets as a percentage of the fair value of total plan assets are as follows:
2011 2010 Deposits in banks 70.20% 81.43% Other assets 29.80% 18.57% 100.00% 100.0%
25. Operating Leases
As lessor, future minimum rental receivables under renewable operating leases as of December 31, 2011 and 2010 are as follows:
2011 2010 (In Thousands) Within one year P=1,395,440 P=1,192,321 After one year but not more than five years 2,315,474 2,178,259 After five years 10,893 145,525 P=3,721,807 P=3,516,105

- 54 -
*SGVMC116622*
The Group entered into lease agreements with third parties covering real estate properties. These leases generally provide for either (a) fixed monthly rent (b) minimum rent or a certain percentage of gross revenue, whichever is higher. Most lease terms on commercial mall are renewable within one year except for anchor tenants. Rental income recognized based on a percentage of the gross revenue of mall tenants included in “Rental income” account in the consolidated statements of income amounted to P=217.01 million, P=213.12 and P=207.95 million. in 2011, 2010 and 2009, respectively.
As lessee, future minimum rental payables under operating leases as of December 31, 2011 and 2010 are as follows:
2011 2010 (In Thousands) Within one year P=181,986 P=94,453 After one year but not more than five years 577,730 478,360 After five years 730,158 698,825 P=1,489,874 P=1,271,638
The Group leases from FDC, land and buildings located at San Juan City for its head office for a fixed monthly rental with a term of five years.
26. Capital Stock
The details of the Parent Company’s common and preferred shares follow:
Common Shares Preferred Shares 2011 2010 2009 2011 2010 2009 (In Thousands, except par value figures) Authorized shares 33,000,000 33,000,000 33,000,000 8,000,000 8,000,000 8,000,000 Par value per share P=1 P=1 P=1 P=0.01 P=0.01 P=0.01 Issued and outstanding shares 24,470,708 24,470,708 24,470,708 8,000,000 8,000,000 8,000,000 Treasury shares 220,949 220,949 220,949 − − −
In 2011 and 2010, there was no issuance of additional common shares. Preferred Shares The preferred shares may be issued from time to time in one or more series as the BOD may determine, and authority is hereby expressly granted to the BOD to establish and designate each particular series of preferred shares, to fix the number of shares to be included in each of such series, and to determine the dividend rate and the issue price and other terms and conditions for each such shares. Dividends shall be cumulative from and after the date of issue of the preferred shares and no dividend shall be declared or paid on the common shares unless the full accumulated dividends on all preferred shares for all past dividend periods and for the current dividend period shall have been declared and paid by the Group. Preferred shares of each and any sub-series shall not be entitled to any participation or share in the retained earnings remaining after dividend payments shall have been made on the preferred shares. To the extent not set forth in the Articles of Incorporation, the specific terms and restrictions of each series of preferred shares shall be specified in such resolutions as may be adopted by the BOD prior to the issuance of each of such series (the “Enabling Resolutions”), which resolutions shall thereupon be deemed a part of the Amended Articles of Incorporation.

- 55 -
*SGVMC116622*
Preferred shares of each and any sub-series may be convertible to common shares as may be determined by the BOD and set forth in the Enabling Resolutions, in such manner and within such period as may be fixed in the Enabling Resolutions. As of December 31, 2011 and 2010, there is no Enabling Resolution by the BOD making the preferred shares convertible to common shares. As the dividend rate is yet to be determined by the BOD, there were no dividends in arrears on preferred shares as of December 31, 2011, 2010 and 2009.
Treasury Shares On December 20, 2007, the Parent Company’s BOD approved the buy-back of some of the issued shares of stock of the Parent Company over a period of twelve (12) months up to an aggregate amount of P=1.5 billion, in view of the strong financial performance of the Parent Company and the very large discrepancy that existed between the current share price and the net asset value of the Parent Company. Management believed that the Parent Company’s shares were undervalued, and the share buy-back program would enhance shareholder’s value.
The Parent Company had acquired 220.95 million shares at total cost of P=221.04 million in 2008. There were no additional acquisitions in 2011 and 2010.
Dividend Declaration On April 15, 2011 the BOD approved the declaration and payment from unappropriated retained earnings of cash dividend of P=0.039 per share or a total of P=950.59 million for all shareholders of record as of May 13, 2011. On April 30, 2010 the BOD approved the declaration and payment from unappropriated retained earnings of cash dividend of P=0.033 per share or a total of P=800.24 million for all shareholders of record as of May 18, 2010.
On April 29, 2009 the BOD approved the declaration and payment from unappropriated retained earnings of cash dividend of P=0.033 per share or a total of P=800.24 million for all shareholders of record as of May 14, 2009. Capital Management The Group prudently monitors its capital and cash positions and cautiously manages its expenditures and disbursements. Furthermore, the Group may also, from time to time seek other sources of funding, which may include debt or equity issues depending on its financing needs and market conditions.
The primary objective of the Group’s capital management is to ensure that it maintains a strong credit rating and healthy capital ratios in order to support its business and maximize shareholder value. No changes were made in capital management objectives, policies or processes for the years ended December 31, 2011 and 2010.

- 56 -
*SGVMC116622*
The Group monitors capital using debt-to-equity ratio, which is the long-term debt (loans payable and bonds payable) divided by total equity. The Group’s policy is to keep the debt to equity ratio not to exceed 2:1. The following table shows how the Group computes for its debt-to-equity ratio:
2011 2010 (In Thousands) Loans payable P=8,511,007 P=6,961,167 Bonds payable 7,977,009 4,949,241 Total long-term debt 16,488,016 11,910,408 Total equity 43,680,999 41,691,251 Debt-to-equity ratio 0.38:1.00 0.29:1.00
On August 12, 1993, SEC approved the registration of 2 billion common shares with issue price of P=5.25 per share. On December 15, 2006, SEC approved the registration of 3.7 billion common shares with issue price of P=1.60 per share. Below is the summary of the outstanding number of shares and holders of security as of December 31, 2011 (Amount in thousands):
Year
Number of Shares
Registered
Number of Holders of Securities
as of Year End January 1, 2010 24,249,759 6,305 Add/(Deduct) Movement − (156) December 31, 2010 24,249,759 6,149 Add/(Deduct) Movement − (100) December 31, 2011 24,249,759 6,049 Note: Exclusive of 220,949 treasury shares.
27. Earnings Per Share EPS amounts were computed as follows:
2011 2010 2009 (In Thousands, Except EPS Figures) a. Net income P=2,940,340 P=2,952,226 P=2,018,200 b. Weighted average number of outstanding
common shares (after considering treasury shares and reciprocal holdings in an associate in 2009) 24,249,759 24,249,759 23,218,791
Basic/Diluted EPS (a/b) P=0.12 P=0.12 P=0.09
Reciprocal holdings attributable to FAI’s ownership in the Parent Company is deducted from the total outstanding shares in computing for the weighted average number of outstanding common shares (see Note 11) for 2009. As discussed in Note 11, in 2011 and 2010, the Parent Company is no longer an associate of FAI as a result of FAI’s sale of its 21% equity interest in the Parent Company to FDC.

- 57 -
*SGVMC116622*
There were no potential dilutive shares in 2011, 2010 and 2009.
28. Income Tax
The components of the Group’s deferred income tax assets follow:
2011 2010 (In Thousands) Deferred income tax assets on: Advance rentals P=13,422 P=8,283 Provisions and accruals 4,624 6,194 Others 25 835 P=18,071 P=15,312
The components of the Group’s net deferred income tax liabilities follow:
2011 2010 (In Thousands) Deferred income tax liabilities on: Capitalization of borrowing costs P=1,568,510 P=1,463,878 Excess of fair value over cost of net assets
acquired in business combination 133,990 164,685 Others − 18,906 Deferred income tax assets on: Accrued retirement benefits (9,646) (14,514) Others (5,528) (2,858) P=1,687,326 P=1,630,097
The Group did not recognize deferred income tax assets on the following deductible temporary differences of subsidiaries since management believes that the tax benefit related to these assets will not reverse through income tax deductions in the near future.
2011 2010 (In Thousands) NOLCO P=44,081 P=23,514 MCIT 1,985 2,253 P=46,066 P=25,767
The carryforward benefits of the NOLCO and the excess of the MCIT over the RCIT, which can be claimed by the Group as credits against the RCIT, are as follows:
Year Incurred NOLCO MCIT Expiry Date (In Thousands) 2011 P=23,306 P=50 December 31, 2014 2010 20,775 395 December 31, 2013 2009 − 1,540 December 31, 2012 P=44,081 P=1,985

- 58 -
*SGVMC116622*
The following are the movements in NOLCO and MCIT:
NOLCO 2011 2010 (In Thousands) At January 1 P=23,514 P=13,563 Addition 23,306 20,845 Applied (665) (10,883) Expired (2,074) (11) At December 31 P=44,081 P=23,514
MCIT 2011 2010 (In Thousands) At January 1 P=2,253 P=1,858 Addition 50 395 Expired (318) − At December 31 P=1,985 P=2,253
The reconciliation of the provision for income tax at statutory tax rate to the actual provision for income tax follows:
2011 2010 2009 (In Thousands) Income tax at statutory tax rate P=1,044,614 P=1,054,193 P=649,942 Adjustments for: Tax-free net income on sales of
BOI-registered projects (Note 32) (186,855) (83,030) (99,772) Tax-free realized gross profit on socialized
housing units (118,188) (111,411) (19,948) Income covered by PEZA (Note 31) (90,138) (88,825) (57,208) Interest on HGC-enrolled contracts
receivables (84,919) (71,964) (138,983) Equity in net earnings of an associate (19,022) (16,565) (11,258) Income subjected to final tax (11,958) (36,085) (39,225) Nondeductible interest expense 7,047 7,244 6,849 Other nondeductible expenses 2,625 64,737 2,976 Income subjected to capital gains tax (1,401) (2,036) (2,581) Change in unrecognized deferred tax assets (99) 3,380 (8,539) Gain from remeasurement of previously
held interest in a business combination − (155,172) − Excess of fair value of net identifiable
assets over consideration transferred − (2,717) − Reversal of deferred gross profit on
installment sales − − (133,979) P=541,706 P=561,749 P=148,274
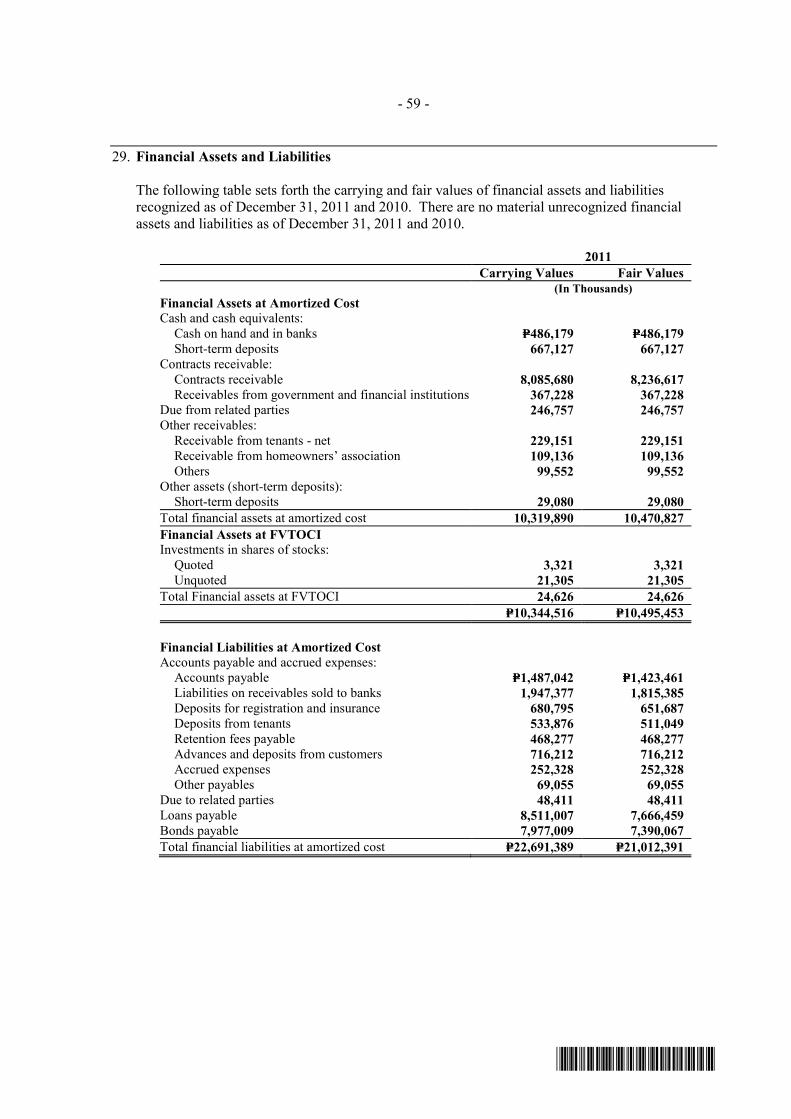
- 59 -
*SGVMC116622*
29. Financial Assets and Liabilities The following table sets forth the carrying and fair values of financial assets and liabilities
recognized as of December 31, 2011 and 2010. There are no material unrecognized financial assets and liabilities as of December 31, 2011 and 2010.
2011 Carrying Values Fair Values (In Thousands) Financial Assets at Amortized Cost Cash and cash equivalents: Cash on hand and in banks P=486,179 P=486,179 Short-term deposits 667,127 667,127 Contracts receivable: Contracts receivable 8,085,680 8,236,617 Receivables from government and financial institutions 367,228 367,228 Due from related parties 246,757 246,757 Other receivables: Receivable from tenants - net 229,151 229,151 Receivable from homeowners’ association 109,136 109,136 Others 99,552 99,552 Other assets (short-term deposits): Short-term deposits 29,080 29,080 Total financial assets at amortized cost 10,319,890 10,470,827 Financial Assets at FVTOCI Investments in shares of stocks: Quoted 3,321 3,321 Unquoted 21,305 21,305 Total Financial assets at FVTOCI 24,626 24,626 P=10,344,516 P=10,495,453
Financial Liabilities at Amortized Cost Accounts payable and accrued expenses: Accounts payable P=1,487,042 P=1,423,461 Liabilities on receivables sold to banks 1,947,377 1,815,385 Deposits for registration and insurance 680,795 651,687 Deposits from tenants 533,876 511,049 Retention fees payable 468,277 468,277 Advances and deposits from customers 716,212 716,212 Accrued expenses 252,328 252,328 Other payables 69,055 69,055 Due to related parties 48,411 48,411 Loans payable 8,511,007 7,666,459 Bonds payable 7,977,009 7,390,067 Total financial liabilities at amortized cost P=22,691,389 P=21,012,391

- 60 -
*SGVMC116622*
2010 Carrying Values Fair Values (In Thousands) Loans and Receivables Cash and cash equivalents: Cash on hand and in banks P=325,903 P=325,903 Short-term deposits 1,432,822 1,432,822 Contracts receivable: Contracts receivable 6,826,127 6,953,552 Receivables from government and financial institutions 1,019,744 1,019,744 Due from related parties 185,922 185,922 Other receivables: Receivable from tenants-net 227,696 227,696 Receivable from homeowners’ association 170,146 170,146 Others 60,219 60,219 Other assets (short-term deposits): Short-term deposits 30,707 30,707 Total loans and receivables 10,279,286 10,406,711 AFS Financial assets Investments in bonds 95,444 95,444 Investments in shares of stocks: Quoted 3,321 3,321 Unquoted 24,305 24,305 Total AFS financial assets 123,070 123,070 P=10,402,356 P=10,529,781
Other Financial Liabilities Accounts payable and accrued expenses: Accounts payable P=1,790,770 P=1,714,203 Liabilities on receivables sold to banks 1,773,391 1,653,192 Advances and deposits from customers 1,081,408 1,081,408 Deposits for registration and insurance 487,298 466,463 Deposits from tenants 482,472 461,843 Retention fees payable 424,960 424,960 Accrued expenses 204,069 204,069 Other payables 65,819 65,819 Due to related parties 82,643 82,643 Loans payable 6,961,167 6,885,063 Bonds payable 4,949,241 4,613,938 Total other financial liabilities P=18,303,238 P=17,653,601
The following methods and assumptions were used to estimate the fair value of each class of financial instrument for which it is practicable to estimate such value:
• Cash and cash equivalents, due from and to related parties, other receivables and other
assets: Due to the short-term nature of these accounts, their fair values approximate their carrying amounts.
• Contracts receivable: Estimated fair value of contracts receivable is based on the discounted
value of future cash flows using the prevailing interest rates for similar types of receivables as of the reporting date. Interest rates used are 2% and 1.83% in 2011 and 2010, respectively. Due to the short-term nature of receivables from government and financial institutions, carrying amounts approximate fair values.

- 61 -
*SGVMC116622*
• Financial assets at FVTOCI: Fair values were determined using quoted market prices at reporting date. Financial assets at FVTOCI not quoted in an active market are recorded at cost.
• AFS financial assets: Fair values were determined using quoted market prices at reporting
date. AFS financial assets not quoted in an active market are recorded at cost. • Accounts payable and accrued expenses: On accounts due within one year, the fair value of
accounts payable and accrued expenses approximates the carrying amounts. On accounts due for more than a year, estimated fair value is based on the discounted value of future cash flows using the prevailing interest rates on loans and similar types of payables as of the reporting date. Interest rates used are 4.28% and 4.98% in 2011 and 2010, respectively.
• Long-term debt: Estimated fair value on debts with fixed interest and not subjected to
quarterly repricing is based on the discounted value of future cash flows using the applicable interest rates for similar types of loans as of reporting date. Long term debt subjected to quarterly repricing is not discounted since it approximates fair value. The discount rates used range from 5.0% to 7.7% and 6.4% to 7.9% as of December 31, 2011 and 2010, respectively.
The following table shows financial instruments recognized at fair value as of December 31, 2011 and 2010, analyzed between those whose fair value is based on:
• quoted prices in active markets for identical assets or liabilities (Level 1); • those involving inputs other than quoted prices included in Level 1 that are observable for the
asset or liability, either directly or indirectly (Level 2); and • those with inputs for the asset or liability that are not based on observable market data
(unobservable inputs) (Level 3).
2011 2010 (In Thousands) Level 1: Financial assets at FVTOCI: Investment in bonds P=− P=95,444 Investment in shares of stock 3,321 3,321 P=3,321 P=98,765
There are no financial instruments recognized at fair value based on Levels 2 and 3 categories. There are no transfers in and out of Level 3 categories in 2011 and 2010.
Financial Risk Management Objectives and Policies The Group’s principal financial instruments are composed of cash and cash equivalents, contracts receivable and other receivables, due from related parties, financial assets at FVTOCI (from January 1, 2011), AFS financial assets (prior to January 1, 2011), accounts payable and accrued expenses, due to related parties and long-term debt. The main purpose of these financial instruments is to raise financing for the Group’s operations.

- 62 -
*SGVMC116622*
The main objectives of the Group’s financial risk management are as follows: • To identify and monitor such risks on an ongoing basis; • To minimize and mitigate such risks; and • To provide a degree of certainty about costs. The Group’s finance and treasury function operates as a centralized service for managing financial risks and activities as well as providing optimum investment yield and cost-efficient funding for the Group. The Group’s BOD reviews and approves the policies for managing each of these risks. The policies are not intended to eliminate risk but to manage it in such a way that opportunities to create value for the stakeholders are achieved. The Group’s risk management takes place in the context of the normal business processes such as strategic planning, business planning, operational and support processes. The main risks arising from the Group’s financial instruments are liquidity risk, credit risk and interest rate risk. The Group also monitors the foreign currency risk and market price risk arising from all financial instruments.
Liquidity Risk
Liquidity risk is defined as the risk that the Group will encounter difficulty in meeting obligations associated with financial liabilities that are settled by delivering cash or another financial asset. The Group seeks to manage its liquidity profile to be able to finance capital expenditures and service maturing debts. To cover its financing requirements, the Group intends to use internally generated funds and available long-term and short-term credit facilities.
As of December 31, 2011 and 2010, the Group has P=3.95 billion and P=3.39 billion, respectively, in undrawn uncommitted short-term credit lines, and, P=9.13 billion and P=10.81 billion, respectively, in undrawn committed long-term credit facilities.
As part of its liquidity risk management, the Group regularly evaluates its projected and actual cash flows. It also continuously assesses conditions in the financial markets for opportunities to pursue fund raising activities, in case any requirements arise. Fund raising activities may include bank loans and capital market issues.
The tables below summarize the maturity profile of the Group’s financial liabilities as of December 31, 2011 and 2010 based on contractual undiscounted payments.
2011
On demand Less than 3 months
3 months to 1 year 1 to 3 Years 3 to 5 years Over 5 years Total
(In Thousands) Accounts Payable and Accrued
Expenses Accounts payable P=800,912 P=272,655 P=− P=286,096 P=91,735 P=35,644 P=1,487,042 Liabilities on receivables sold
to banks − 115,893 459,448 576,429 562,348 233,259 1,947,377 Deposits for registration
and insurance 261 906 168,003 509,486 2,139 − 680,795 Deposits from tenants 43,648 93,095 319,040 33,273 2,486 42,334 533,876 Retention fees payable − − 147,011 321,266 − − 468,277
(Forward)

- 63 -
*SGVMC116622*
2011
On demand Less than 3 months
3 months to 1 year 1 to 3 Years 3 to 5 years Over 5 years Total
(In Thousands) Advances and deposits
from customers P=715,392 P=820 P=− P=− P=− P=− P=716,212 Accrued expenses 146,452 78,191 27,685 − − − 252,328 Other payables 21,932 47,123 − − − − 69,055 Interest on Accounts Payable and
Accrued Expenses − 1,660 58,847 80,784 45,620 12,155 199,066 1,728,597 610,343 1,180,034 1,807,334 704,328 323,392 6,354,028 Due to Related Parties 48,411 − − − − − 48,411 Loans Payable − 291,500 1,349,500 4,380,250 2,507,250 − 8,528,500 Bonds Payable − − 500,000 4,500,000 3,000,000 − 8,000,000 Interest on Loans and Bonds
Payable − 239,609 574,196 1,652,602 469,406 − 2,935,813 P=1,777,008 P=1,141,452 P=3,603,730 P=12,340,186 P=6,680,984 P=323,392 P=25,866,752
2010
On demand Less than 3 months
3 months to 1 year 1 to 3 Years 3 to 5 years Over 5 years Total
(In Thousands) Accounts Payable and Accrued
Expenses Accounts payable P=− P=143,262 P=537,231 P=1,074,462 P=35,815 P=− P=1,790,770 Liabilities on receivables sold
to banks − 114,211 308,793 696,976 361,304 292,107 1,773,391 Advances and deposits from
customers 1,081,408 − − − − − 1,081,408 Deposits for registration
and insurance − 68,222 146,189 146,189 121,824 4,874 487,298 Deposits from tenants 48,248 57,897 221,936 96,494 9,649 48,248 482,472 Accrued expenses 204,069 − − − − 204,069 Other payables 11,809 57,268 130,155 203,041 88,505 − 490,778 Interest on Accounts Payable and
Accrued Expenses − 1,428 24,382 133,048 67,569 29,211 255,638 1,141,465 646,357 1,368,686 2,350,210 684,666 374,440 6,565,824 Due to Related Parties 82,643 − − − − − 82,643 Loans Payable − 300,667 1,352,000 4,543,500 765,000 − 6,961,167 Bonds Payable − − − 500,000 4,500,000 − 5,000,000 Interest on Loans and Bonds
Payable − 176,597 668,351 1,292,536 445,945 − 2,583,429 Commitments − − 100,772 − − − 100,772 P=1,224,108 P=1,123,621 P=3,489,809 P=8,686,246 P=6,395,611 P=374,440 P=21,293,835
The tables below summarize the maturity profile of the Group’s financial assets held to manage liquidity as of December 31, 2011 and 2010:
2011
On demand Less than 3 months
3 months to 1 year 1 to 3 years 3 to 5 years Over 5 years Total
(In Thousands) Financial Assets at Amortized Cost Cash and cash equivalents: Cash on hand and in banks P=486,179 P=− P=− P=− P=− P=− P=486,179 Short-term deposits − 667,127 − − − − 667,127 Contracts receivable: Contracts receivable − 228,399 720,158 531,248 330,447 6,275,428 8,085,680 Receivables from government
and financial institutions − − 367,228 − − − 367,228 Due from related parties 246,757 − − − − − 246,757 Other receivables: Receivable from tenants-net 213,464 450 15,237 − − − 229,151 Receivable from homeowners’
associations 70,261 38,875 − − − − 109,136 Others 99,552 − − − − − 99,552 Other assets: Short-term deposits 29,080 − − − − − 29,080 Financial Assets at FVTOCI Investment in Bonds − − − − − − − Investments in shares of stocks: Quoted − − 3,321 − − − 3,321 Unquoted − − 21,305 − − − 21,305 P=1,145,293 P=934,851 P=1,127,249 P=531,248 P=330,447 P=6,275,428 P=10,344,516

- 64 -
*SGVMC116622*
2010
On demand Less than 3 months
3 months to 1 year 1 to 3 years 3 to 5 years Over 5 years Total
(In Thousands) Loans and Receivables Cash and cash equivalents: Cash on hand and in banks P=325,903 P=− P=− P=− P=− P=− P=325,903 Short-term deposits − 1,432,822 − − − − 1,432,822 Contracts receivable: Contracts receivable 369,741 1,083,805 2,057,027 1,513,353 1,802,201 6,826,127 Receivables from government and
financial institutions − − 1,019,744 − − − 1,019,744 Due from related parties 185,922 − − − − − 185,922 Other receivables: Receivable from tenants-net 227,696 − − − − − 227,696 Receivable from homeowners’
associations 170,146 − − − − − 170,146 Others 60,219 − − − − − 60,219 Other assets Short-term deposits 30,707 − − − − − 30,707 AFS Financial Assets Investment in bonds − − 95,444 − − − 95,444 Investments in shares of stocks: Quoted − − 3,321 − − − 3,321 Unquoted − − 24,305 − − − 24,305 P=1,000,593 P=1,802,563 P=2,226,619 P=2,057,027 P=1,513,353 P=1,802,201 P=10,402,356
Credit Risk Credit risk is the risk that a counterparty will not meet its obligations under a financial instrument or customer contract, leading to a financial loss. The Group is exposed to credit risk from its operating activities, primarily for its mortgage notes and contract receivables and other receivables.
It is the Group’s policy that buyers who wish to avail the in-house financing scheme be subjected to credit verification procedures. Receivable balances are being monitored on a regular basis and subjected to appropriate actions to manage credit risk. Moreover, as discussed in Note 7, the Group has a mortgage insurance contract with Home Guaranty Corporation for a retail guaranty line.
With respect to credit risk arising from the other financial assets of the Group, which comprise cash and cash equivalents, financial assets at FVTOCI (from January 1, 2011) and AFS financial assets (prior to January 1, 2011), the Group’s exposure to credit risk arises from default of the counterparty, with a maximum exposure equal to the carrying amount of these instruments.
The Group entered into various purchase agreements with financial institutions whereby the Group sold its contracts receivable with a provision that the Group should buy back these receivables in case these become overdue for two to three consecutive months or when the contract to sell has been cancelled. The table below shows the comparative summary of maximum credit risk exposure on assets as of December 31, 2011 and 2010:
2011 2010 (In Thousands) Financial Assets at Amortized Cost Cash and cash equivalents: Cash in banks P=486,179 P=319,404 Short-term deposits 667,127 1,432,822
(Forward)

- 65 -
*SGVMC116622*
2011 2010 (In Thousands) Contracts receivable: Contracts receivable P=8,085,680 P=6,826,127 Receivables from government and financial
institutions 367,228 1,019,744 Due from related parties 246,757 185,922 Other receivables: Receivables from tenants - net 229,151 227,696 Receivables from homeowners’ association 109,136 170,146 Others 99,552 60,219 Other asset: Short-term deposits 29,080 30,707 Total financial assets at amortized cost 10,319,890 10,272,787 Financial Assets at FVTOCI Investments in shares of stocks: Quoted 3,321 − Unquoted 21,305 − Total financial assets at FVTOCI 24,626 − AFS Financial Assets Investment in bonds − 95,444 Investments in shares of stocks: Quoted − 3,321 Unquoted − 24,305 Total AFS financial assets − 123,070 Commitments − 100,772 P=10,344,516 P=10,496,629
The Group’s commitments (off-balance sheet arrangements) pertain to forward and spot exchange contract entered into by Parent Company in connection with its US Dollar-denominated investments in bonds (see Note 10). Such transaction was recognized in the Group’s consolidated statement of financial position upon settlement.
The forward and spot exchange contract as of December 31, 2010 matured in July 2011.
Based on the Group’s experience, the said assets are highly collectible or collectible on demand. The Group holds as collaterals the corresponding properties which the third parties had bought on credit. In few cases of buyer defaults, the Group can repossess the collateralized properties and resell them at the prevailing market price.
The following tables show the credit quality by class of asset as of December 31, 2011 and 2010. The Group’s high-grade receivables pertain to receivables from related parties and third parties which, based on experience, are highly collectible or collectible on demand, and of which

- 66 -
*SGVMC116622*
exposure to bad debt is not significant. Receivables assessed to be of standard grade are those which had passed a certain set of credit criteria, and of which the Group has not noted any extraordinary exposure which calls for a substandard grade classification. December 31, 2011 Neither past due nor impaired
High grade Standard
Grade Past due but not impaired Impaired Total
(In Thousands) Cash and cash equivalents P=1,153,306 P=− P=− P=− P=1,153,306 Contracts receivable Contracts receivable − 7,683,840 401,840 − 8,085,680 Receivables from government
and financial institutions 367,228 − − − 367,228 Due from related parties 246,757 − − − 246,757 Other receivables Receivables from tenants − 229,151 − 26,961 256,112 Receivables from homeowners’ association − 109,136 − 36,014 145,150 Others − 99,552 − − 99,552 Other assets Short-term deposits 29,080 − − − 29,080 Financial assets at FVTOCI Investment in shares of stock Quoted 3,321 − − − 3,321 Unquoted 21,305 − − − 21,305 P=1,820,997 P=8,121,679 P=401,840 P=62,975 P=10,407,491
December 31, 2010 Neither past due nor impaired
High grade Standard
Grade Past due but not impaired Impaired Total
(In Thousands) Cash and cash equivalents P=1,752,226 P=− P=− P=− P=1,752,226 Contracts receivable Contracts receivable − 6,611,164 214,963 − 6,826,127 Receivables from government
and financial institutions 1,019,744 − − − 1,019,744 Due from related parties 185,922 − − − 185,922 Other receivables Receivables from tenants − 227,696 − 54,087 281,783 Receivables from homeowners’ association − 170,146 − − 170,146 Others − 60,219 − − 60,219 Other assets Short-term deposits 30,707 − − − 30,707 AFS financial assets Investment in bonds 95,444 − − − 95,444 Investment in shares of stock Quoted 3,321 − − − 3,321 Unquoted − 24,305 − − 24,305 P=3,087,364 P=7,093,530 P=214,963 P=54,087 P=10,449,944
As at December 31, 2011 and 2010, the analysis of contracts receivable that were past due but not impaired is as follows:
2011 Neither past Past due but not impaired
due nor
impaired Less than
30 days 30 to
60 days 60 to
90 days 90 to
120 days Over
120 days Total (In Thousands) Contracts receivable P=7,683,840 P=62,956 P=75,329 P=14,588 P=147,116 P=101,851 P=8,085,680 Receivables from governments and financial institutions 367,228 − − − − − 367,228 P=8,051,068 P=62,956 P=75,329 P=14,588 P=147,116 P=101,851 P=8,452,908

- 67 -
*SGVMC116622*
2010 Neither past Past due but not impaired
due nor
impaired Less than
30 days 30 to
60 days 60 to
90 days 90 to
120 days Over
120 days Total (In Thousands) Contracts receivable P=6,611,164 P=30,243 P=19,287 P=15,104 P=11,702 P=138,627 P=6,826,127 Receivables from governments and financial institutions 1,019,744 − − − − − 1,019,744 P=7,630,908 P=30,243 P=19,287 P=15,104 P=11,702 P=138,627 P=7,845,871
There is no concentration risk on the Group’s financial assets as of December 31, 2011 and 2010.
Market Risk Market risk is the risk that the fair value of future cash flows of a financial instrument will fluctuate because of changes in market prices. The Group’s financial instruments affected by market risk include loans payable, cash and cash equivalents and available-for sale financial assets.
a) Interest Rate Risk
The Group’s exposure to market risk for changes in interest rates relates primarily to the Group’s loans from various financial institutions. To manage interest rate risk, the Group renegotiates the interest rates for certain long term debts to convert them from fixed-rate debt to floating-rate debt as the Group believes that the current interest rate environment makes it more favorable to carry floating-rate debt. The following table demonstrates the sensitivity to a reasonably possible change in interest rates, with all other variables held constant, of the Group’s profit before tax (through the impact on floating rate borrowings). There is no other impact on the Group’s other comprehensive income other than those already affecting the profit and loss.
Increase (decrease)
in basis points
Effect on income before income tax
(In Thousands) 2011 +200 (P=138,720) -200 P=138,720 2010 +200 (P=98,723) -200 P=98,723
The sensitivity analysis shown above is based on the assumption that interest rate movement will most likely be limited to a two hundred basis point upward or downward fluctuation. The Group, used as basis of these assumptions, the annual percentage change of 3-month PDST-F rate for the past five years as obtained from PDEx. Effect on the Group’s income before tax is computed on the carrying amount of the Group’s floating rate loans payable as of December 31, 2011 and 2010.
The following tables set out the carrying amount (in thousands), by maturity, of the Group’s long-term debt that are exposed to interest rate risk:
91-day Treasury bill plus 1% to 2% margin
Variable interest rate Below 1 Year 1-2 Years 2-3 Years 3-4 Years
Over 4 Years Total
As of December 31, 2011 P=1,185,884 P=2,554,433 P=916,591 P=966,079 P=1,313,020 P=6,936,007 As of December 31, 2010 P=1,202,667 P=1,352,667 P=2,290,833 P=20,000 P=70,000 P=4,936,167

- 68 -
*SGVMC116622*
b) Foreign Currency Risk Financial assets and financing facilities extended to the Group were mainly denominated in Philippine Peso. As such, the Group’s exposure to this risk is not significant.
The following table demonstrates the sensitivity to a reasonably possible change in the US dollar exchange rate, with all other variables held constant, of the Group’s profit before tax (due to changes in the fair value of monetary assets and liabilities). PDEx closing rates used are P=43.84 on December 31, 2011 and 2010. There is no other impact on the Group’s other comprehensive income other than those already affecting the profit and loss.
Increase (decrease)
in US dollar rate
Effect on income before income tax
(In Thousands) 2011 +5% P=471 -5% (P=471) 2010 +5% P=2,750 -5% (P=2,750)
The sensitivity analysis shown above is based on the assumption that movement in US dollar-peso exchange rate will most likely be limited to five percent (5%) upward or downward fluctuation in 2010. The Group, used as basis of these assumptions, the annual percentage change of US dollar exchange rate for the past five years as obtained from BSP. Effect on the Group’s income before tax is computed on the carrying amount of the Group’s US dollar-denominated financial assets (cash in bank and short term investments) as of December 31, 2011 and 2010.
c) Equity Price Risk The table below demonstrates the sensitivity to a reasonably possible change in the market price of country club shares classified as financial assets at FVTOCI in 2011 and AFS investments in 2010, with all other variables held constant, of the Group’s equity. The impact on the Group’s equity already excludes the impact on transactions affecting the profit and loss.
Increase/ decrease
in market price Effect on equity (In Thousands)
2011 +5% P=153 -5% (P=153) 2010 +10% P=306 -10% (P=306)
The sensitivity analysis shown above is based on the assumption that movement in the price of investments in quoted equity securities will most likely be limited to five percent (5%) and ten percent (10%) upward or downward fluctuation in 2011 and 2010, respectively. The Group, used as basis of these assumptions, the annual percentage change of quoted prices for the past five years as obtained from published quotes of club share brokers.

- 69 -
*SGVMC116622*
30. Contingencies and Commitments
The Group is involved in various legal actions, claims and contingencies incident to the ordinary course of the business. Management believes that any amount the Group may have to pay in connection with any of these matters would not have a material adverse effect on the consolidated financial position or operating results.
In connection with the joint venture agreement entered into by the Parent Company with Cebu City Government, the Parent Company is committed to (a) purchase 10.6 hectares of the property payable in six (6) years, to be developed into a modern urban center and (b) develop 40 hectares of the property in four (4) phases, mainly mid-rise residential buildings, over a 20-year period.
31. Registration with PEZA
On February 13, 2002, the Group was registered with Philippine Economic Zone Authority (PEZA) pursuant to the provisions of the Republic Act (RA) No. 7916 as the Ecozone Developer/Operator to lease, sell, assign, mortgage, transfer or otherwise encumber the area designated as a Special Economic Zone (Ecozone) to be known as Filinvest Technology Park-Calamba.
Under the registration, the Group shall enjoy 5% preferential tax privilege on income generated from the Ecozone as opposed to the regular income tax rate.
On June 11, 2001, FAC was registered with PEZA as the developer/operator of PBCom Tower and as such it will not be entitled to any incentives, however, IT enterprises which shall locate in PBCom Tower shall be entitled to tax incentives pursuant to RA No. 7916.
On June 6, 2000, CPI was registered with PEZA as an ECOZONE Facilities Enterprise. As a registered enterprise, it is also entitled to certain tax and non-tax benefits such as exemption from payment of national and local taxes and instead a special tax rate of five percent (5%) of gross income.
The Group is also entitled to zero percent (0%) value-added tax for sales made to ECOZONE enterprises.
32. Registration with the Board of Investments (BOI)
The Group has registered the following projects with the BOI under the Omnibus Investments Code of 1987 (Executive Order No. 226):
As of December 31, 2011:
Name Reg. No. Date Registered Type of Registration Asenso Village -General Trias 2007-035 03/03/07 New Developer of Low-Cost Mass Housing Project Palmridge Phase 1 2007-042 03/13/07 New Developer of Low-Cost Mass Housing Project Asenso Village - Ciudad de Calamba 2007-110 06/28/07 New Developer of Micro, Small and Medium Enterprises Business Park Aldea Real 2007-163 09/12/07 New Developer of Low-Cost Mass Housing Project

- 70 -
*SGVMC116622*
Name Reg. No. Date Registered Type of Registration Summerbreeze 1 2007-191 10/26/07 New Developer of Low-Cost Mass Housing Project One Oasis - Ortigas (A to E) 2008-225 08/14/08 New Developer of Low-Cost Mass Housing Project Westwood Mansions 2008-257 09/02/08 New Developer of Low-Cost Mass Housing Project Palm Ridge - Phase 3 2008-310 11/17/08 New Developer of Low-Cost Mass Housing Project Summerbreeze 2 2008-311 11/17/08 New Developer of Low-Cost Mass Housing Project Park Spring - The Glens 2008-326 12/15/08 New Developer of Low-Cost Mass Housing Project One Oasis - Ortigas (F to M) 2011-120 06/15/11 New Developer of Low-Cost Mass Housing Project La Brisa Townhomes 2011-117 06/09/11 New Developer of Low-Cost Mass Housing Project The Linear 2011-121 06/15/11 New Developer of Low-Cost Mass Housing Project Bali Oasis 3 & 4 2011-134 06/27/11 New Developer of Low-Cost Mass Housing Project Ocean Cove 2011-133 06/27/11 New Developer of Low-Cost Mass Housing Project Villa Montserrat - Expansion 2011-132 06/27/11 New Developer of Low-Cost Mass Housing Project Escala @ Corona del Mar 2011-167 07/29/11 New Developer of Low-Cost Mass Housing Project Filinvest Homes Tagum Phase 1 2011-171 08/02/11 New Developer of Low-Cost Mass Housing Project Filinvest Homes Tagum Phase 2 2011-214 09/26/11 New Developer of Low-Cost Mass Housing Project One Oasis Davao 1, 2, 3 2011-194 09/02/11 New Developer of Low-Cost Mass Housing Project Villa Mercedita 2011-154 07/19/11 New Developer of Low-Cost Mass Housing Project Villa San Ignacio 2011-148 07/14/11 New Developer of Low-Cost Mass Housing Project Tierra Vista 2011-191 08/31/11 New Developer of Low-Cost Mass Housing Project Tamara Lane 2011-215 09/26/11 New Developer of Low-Cost Mass Housing Project Austine Homes 2011-252 11/25/11 New Developer of Low-Cost Mass Housing Project The Glens Phase 2 2011-216 09/26/11 New Developer of Low-Cost Mass Housing Project The Glens Phase 2 2011-217 09/26/11 New Developer of Low-Cost Mass Housing Project The Glens Phase 4 2011-218 09/26/11 New Developer of Low-Cost Mass Housing Project Somerset Lane 2011-273 12/21/11 New Developer of Low-Cost Mass Housing Project
As a registered enterprise, the Group is entitled to certain tax and nontax incentives, subject to certain conditions.

*SGVMC116622*
FILINVEST LAND, INC. AND SUBSIDIARIES SUPPLEMENTARY INFORMATION AND DISCLOSURES REQUIRED ON SRC RULE 68 AND 68.1 AS AMENDED DECEMBER 31, 2011 Philippine Securities and Exchange Commission (SEC) issued the amended Securities Regulation Code Rule SRC Rule 68 and 68.1 which consolidates the two separate rules and labeled in the amendment as “Part I” and “Part II”, respectively. It also prescribed the additional information and schedule requirements for issuers of securities to the public. Below are the additional information and schedules required by SRC Rule 68 and 68.1 as amended that are relevant to the Group. This information is presented for purposes of filing with the SEC and is not required part of the basic financial statements. Schedule A. Financial Assets in Equity Securities Below is the detailed schedule of financial assets in equity securities of the Group as of December 31, 2011:
Name of Issuing entity and association of each issue
Number of Shares
Amount Shown in the Statement
of Financial Position
Value Based on Market
Quotation at end of year
Income Received and Accrued
(In Thousands) Financial assets at FVTOCI Quoted: The Palms Country Club − P=3,060 P=3,060 P=− Philippine Long Distance
Telephone Company 26.1 261 261 − 3,321 3,321 − Unquoted: Manila Electric Company
(MERALCO) 1,744 17,435 17,435 − Timberland Sports and
Nature Club 3 2,995 2,995 − FITI 875 875 875 − 21,305 21,305 − P=24,626 P=24,626 P=−
The Group has no income received and accrued related to the financial assets at FVTOCI during the year. The Group’s investment in MERALCO is in unlisted preferred shares acquired in connection with the infrastructure that it provides for the Group’s real estate development projects. These are carried at cost less impairment, if any.

- 2 -
*SGVMC116622*
Schedule B. Amounts Receivable from Directors, Officers, Employees, Related Parties and Principal Stockholders (other than related parties) Below is the schedule of advances to employees of the Group with balances above P=100,000 as of December 31, 2011:
Name Balance at
beginning of year Additions Collections/ Liquidations
Balance at end of year
(In Thousands) Antonio Cenon P=24,331 P=138,776 (P=122,680) P=40,427 Archie Igot 3,090 6,720 (3,084) 6,726 Estrella Pable 7,446 607 (2,608) 5,445 Alan Barquilla 4,861 293 (273) 4,881 Marie Angeli Samala 5,081 8,605 (9,555) 4,131 Luis T. Fernandez 4,582 35,712 (36,135) 4,159 Tristaneil Las Marias 3,515 1,658 (1,422) 3,751 Julian Jr. Concepcion 3,726 1,318 (1,360) 3,684 Wilfredo Abuena 2,376 1,843 (788) 3,431 Adam Christopher C. Sacro − 4,842 (1,883) 2,959 Reynaldo Ascaño 2,139 1,350 (557) 2,932 Arvin L. Pamalaran 944 2,849 (1,022) 2,771 Michael B. Mamalateo 2,212 2,893 (2,685) 2,420 Carlo Chavez 2,204 702 (739) 2,167 Francelia M. Mozo 1,758 − − 1,758 Agnes L. Agcaoili 10 74,830 (73,124) 1,716 Boler L. Binamira Jr. 1,499 − (9) 1,490 Winnifred Lim 1,667 1,696 (1,972) 1,391 Jeannora B. Apasan − 1,948 (635) 1,313 Geraldine Marie De Gorostiza 305 1,171 (299) 1,177 Bernadette M. Ramos 1,146 7 − 1,153 Ma. Teresita Abad Santos 4,359 4,023 (7,230) 1,152 Clodualdo A. Agena 2,877 106 (1,889) 1,094 Pablito A. Perez 335 1,176 (439) 1,072 Edward Neil S. Aquino 1,045 − (33) 1,012 Rowena Sikat 3 4,012 (3,057) 958 Andres II J. Calizo 645 472 (215) 902 Sean Philip Imperial (76) 1,901 (986) 839 Novie C. Verano 833 − − 833 Estela Bibiano 863 − (100) 763 Eva Marie Bernardo 805 305 (522) 588 Dominador Casiño 3 1,043 (467) 579 Alberto Morales 825 301 (616) 510 Danilo Salonga 13 1,531 (1,038) 506 Salvador C. Reyes Jr. 279 1,581 (1,366) 494 Alexander James E. Jazminez 430 − − 430 Katrina Denise L. Madrid − 417 (1) 416 Ma. Consuelo G. Cosio 398 − − 398 Maria Felicidad D. Alfonso 1 4,943 (4,574) 370 Clarissa Grindulo 8 682 (329) 361 Rolando C. Acuesta 348 − − 348 Noel Advincula 334 141 (141) 334 Louie Henry Carandang 302 − − 302 Rogelio T. Chavez Jr. 4 500 (205) 299 Enrique Lingad 319 15 (90) 244 Majella Faduga 242 − − 242 Rafael Barretto 238 − − 238 Adrian V. Bancoro 17 33,856 (33,646) 227
(Forward)

- 3 -
*SGVMC116622*
Name Balance at
beginning of year Additions Collections/ Liquidations
Balance at end of year
(In Thousands) Julieta Castaños P=1,502 P=37 (P=1,321) P=218 Maria Louella D. Senia 203 28 (25) 206 Manuel dennis Molina 200 4 − 204 Edwin Esteller 54 950 (805) 199 Nilo S. Beriña (284) 679 (204) 191 Edgar Nocillado 519 2,508 (2,844) 183 Evelyn P. Michaud 169 − − 169 Thomas Salonga 48 4,257 (4,144) 161 Ma. Rowena M. Pasimio 159 − − 159 Trina C. Borgonia 158 − − 158 Susana Makabenta 147 538 (530) 155 Roy Vincent Lumayag 149 − − 149 Noel Oblefias 256 643 (755) 144 Kotcela E. Cayonda (23) 203 (38) 142 Laseo Masangcay 7 158 (26) 139 Ma. Elena G. Santos 137 − − 137 Jose Patrick H. Rosales 72 483 (422) 133 Paul Francisco 30 183 (85) 128 Edilberta I. Jasmin 5 146 (31) 120 Janice N. Trinanes − 125 (6) 119 Imelda L. Landicho 118 − − 118 Hazel Q. Magpuyo 117 − − 117 John Delmer P. Vitaliz 38 179 (102) 115 Jasper June Gaerlan 33 123 (45) 111 Bernarda T. Gitalan 33 242 (169) 106 Rey Ferdinand C. Maribao 110 282 (288) 104 Jocelyn SG. Sapsal 103 − − 103 Elmer Barros 93 43 (35) 101 Jeffrey Nisnisan 124 185 (208) 101 P=92,619 P=356,821 (P=329,857) P=119,583
These advances were obtained by the Group’s employees for expenses and disbursements necessary in carrying out their functions in the ordinary course of business such as for selling and marketing activities, official business trips, emergency and cash-on-delivery purchases of materials, equipment and supplies, repair of Group’s vehicles, model units and housing units, registration of titles, etc. The advances will be liquidated when the purposes for which these advances were granted are accomplished or completed. There were no amounts written off during the year and all receivables are expected to be collected/liquidated within the next twelve months. Schedule C. Amounts Receivable from Related Parties which are Eliminated During the Consolidation of Financial Statements Below is the schedule of receivables (payables) with related parties, which are eliminated in the consolidated financial statements as of December 31, 2011 (amounts in thousands):
Volume of Transactions Receivable Terms
Filinvest AII Philippines, Inc.
Share in expenses P=634 P=141,078
Non-interest bearing and to be settled
within the year
Property Maximizer Professional Corporation
Marketing fee
expense 103,908 203,698
Non-interest bearing and to be settled
within the year Share in expenses 57,196
(Forward)

- 4 -
*SGVMC116622*
Volume of Transactions Receivable Terms
Cyberzone Properties, Inc. (CPI)
Rental income P=86,978 P=46,886
Non-interest bearing and to be settled
within the year
Property Specialist Resources, Inc.
Marketing fee
expense 2,511 19,006
Non-interest bearing and to be settled
within the year Share in expenses 12,264
Leisurepro, Inc.
Marketing fee expense 2,406
5,482
Non-interest bearing and to be settled
within the year Share in expenses 3,922
Homepro Realty Marketing, Inc.
Marketing fee expense 3,851
4,168
Non-interest bearing and to be settled
within the year Share in expenses 2,638 P=420,318
Name Balance at
beginning of year Additions Collections Balance at end of year
Filinvest AII Philippines, Inc. 194,308 102,774 (156,004) 141,078 Property Maximizer Professional
Corporation 159,236 198,570 (154,108) 203,698 Cyberzone Properties, Inc. (CPI) 43,269 320,921 (317,304) 46,886 Property Specialist Resources, Inc. (3,219) 26,911 (4,686) 19,006 Leisurepro, Inc 6,093 3,041 (3,652) 5,482 Homepro Realty Marketing, Inc 6,428 2,582 (4,842) 4,168 406,115 654,799 (640,596) 420,318
The intercompany transactions between the FLI and the subsidiaries pertain to share in expenses, rental charges, marketing fee and management fee. There were no amounts written off during the year and all amounts are expected to be settled within the year. Related Party Transactions Due from related parties Below is the list of outstanding receivables from related parties of the Group presented in the consolidated statements of financial position as of December 31, 2011 (amount in thousands):
Relationship Nature
Balance at end of period
Timberland Sports and Nature Club Affiliate A, B P=171,131 GCK Realty Affiliate C, D 46,147 Filinvest Development Corp. Parent Company A, C, E 13,116 Davao Sugar Central Corp. Affiliate A 6,609 Filinvest Alabang, Inc. Associate A, C 5,172 East West Banking Corporation Affiliate A 4,012 Filarchipelago Hospitality, Inc. Affiliate A 302 The Palms Country Club Affiliate A 268 P=246,757

- 5 -
*SGVMC116622*
Nature of intercompany transactions The nature of the intercompany transactions with the related parties is described below:
A. Expenses - these pertain to the share of the Group of related parties in various common selling and marketing and general and administrative expenses.
B. Advances - these pertain to temporary advances to/from related parties for working capital requirements
C. Management and marketing fee D. Reimbursable commission expense E. Rentals
Schedule D. Intangible Asset As of December 31, 2011, the Group’s intangible asset consists of Goodwill. Goodwill in the Group’s consolidated statements of financial position arose from the acquisition of three major assets consisting of (in thousands):
Festival Supermall structure P=3,745,945 FAC 494,744 CPI 326,553 P=4,567,242
The beginning balance equal the ending balance. Schedule E. Long term debt Below is the schedule of long-term debt of the Group:
Type of Obligation Amount Current Noncurrent Term loans Guaranteed loan amounting to P=1.13 billion
and P=1.12 billion obtained in October 2005 and July 2007, respectively. Both loan principal is payable in 10 semi-annual installments commencing December 2010 and ending June 2015. The loans carry a fixed interest rate of 7.72% and 7.90% per annum, respectively. P=1,575,000 P=450,000 P=1,125,000
Developmental loans Unsecured loan obtained in October 2008 with
interest rate equal to 91-day PDS Treasury Fixing (PDST-F) rate plus a spread of up to1.5% per annum, payable quarterly in arrears. The principal is payable in eleven (11) equal quarterly installments starting March 2011 up to September 2013 and lump sum full payment due in December 2013. 833,333 166,667 666,666
(Forward)

- 6 -
*SGVMC116622*
Type of Obligation Amount Current Noncurrent Unsecured loan obtained in June 2011 with
interest rate equal to 91-day PDST-F rate plus a spread of up to 1% per annum, payable quarterly in arrears. The principal is payable in twelve (12) equal quarterly installments starting June 2013 up to June 2016. P=746,938 P=− P=746,938
Unsecured loan obtained in March 2011 with interest rate equal to 91-day PDST-F rate plus a spread of up to 1% per annum, payable quarterly in arrears, 50% of the principal is payable in twelve (12) equal quarterly installments starting June 2013 up to March 2016 and the remaining 50% of the principal is payable in full in March 2016 743,848 − 743,848
Unsecured loan obtained in May 2011 with interest rate equal to 91-day PDST-F rate plus a spread of up to 1% per annum but not lower than 4.5%, payable quarterly in arrears, 50% of the principal is payable in twelve 12 equal quarterly installments starting August 2013 up to May 2016 and balance of 50% is payable in full in May 2016 597,409 − 597,409
Unsecured 5-year loan obtained in September 2008 payable in eleven (11) quarterly amortizations starting December 2010 with a balloon payment at maturity date in September 2013 with interest rate equal to 91-day PDST-F rate plus fixed spread of 2% per annum, payable quarterly. 514,584 108,333 406,251
Unsecured loan obtained in April 2011 with interest rate equal to 91-day PDST-F rate plus a spread of up to 1% per annum, payable quarterly in arrears. The principal is payable in twelve (12) equal quarterly installments starting July 2013 up to April 2016. 497,985 − 497,985
Unsecured loans obtained in August 2008 with interest rate equal to 91-day PDST-F rate plus a spread of up to 1% per annum. The principal is payable in twelve (12) equal quarterly installments starting November 2010 up to August 2013. 437,500 250,000 187,500
Unsecured loan obtained in November 2008 with interest rate equal to 91-day PDST-F rate plus a spread of up to 2% per annum, payable quarterly in arrears. The principal is payable in eleven (11) equal quarterly installments starting November 2010 up to September 2013 and lump sum full payment due in December 2013. 416,667 83,333 333,334
(Forward)

- 7 -
*SGVMC116622*
Type of Obligation Amount Current Noncurrent Unsecuretd loan granted on November 2011
with a term of five years with interest rate 4.375% (inclusive of GRT), payable quarterly in arrears. The principal is payable in twelve (12) equal quarterly installments starting February 2014 up to November 2016. P=398,058 P=− P=398,058
Unsecured loan obtained in June 2008 with interest rate equal to 91-day PDST-F rate plus a spread of up to 1.5% per annum, payable quarterly in arrears. Part of the principal is payable in eleven (11) equal quarterly installments starting June 2010 up to March 2013 and lump sum full payment due in June 2013. 375,000 83,333 291,667
Unsecured loan obtained in December 2011 with interest of 4.50% per annum (inclusive of GRT), payable quarterly in arrears. The principal is payable in twelve (12) equal quarterly installments starting March 2014 up to December 2016. 348,270 − 348,270
Unsecured loan obtained by the Group in October 2008 with interest rate equal to 91-day PDST-F rate plus a spread of up to 1% per annum. The principal is payable in twelve (12) quarterly equal installments starting March 2011 up to September 2013. 333,333 166,667 166,666
Unsecured loans granted in May and December 2007 payable over 5-year period inclusive of 2 year grace period; 50% of the loan is payable in twelve (12) equal quarterly amortizations and balance payable on final maturity. The loans carry interest equal to 91-day PDST-F rate plus fixed spread of 2% per annum payable quarterly in arrears 189,999 189,999 −
Unsecured 5-year loan obtained in March 2008, of which 50% of the principal is payable in twelve (12) equal quarterly installments starting September 2010 and the remaining 50% balance is to be paid in lump sum at maturity in June 2013, with interest rate equal to 3-month PDST-F rate plus a spread of up to 2% per annum, payable quarterly in arrears. 177,083 41,667 135,416
Unsecured loan granted on April 2010 with a term of five years with 50% of principal payable in 12 equal quarterly amortization to commence on July 2012 and 50% payable on maturity. The loan carries interest equal to 3-month PDST-F rate plus a spread of 1.5% per annum 120,000 15,000 105,000
(Forward)

- 8 -
*SGVMC116622*
Type of Obligation Amount Current Noncurrent Unsecured loan granted on November 10,
2011 with a term of 7 years with 2 year grace period on principal repayment. Interest for the first 92 days is 4.5% per annum inclusive of GRT, subject to quarterly repricing and payable quarterly in arrears. 50% of principal is payable in 20 equal quarterly amortizations commencing on February 10, 2014 and 50% is payable on maturity. P=120,000 P=− P=120,000
Unsecured loan obtained on December 15, 2006 payable in twenty (20) equal quarterly amortizations starting in March 2008, with interest rate equivalent to 91-day T-Bill rate plus fixed spread of 2% per annum, payable quarterly in arrears and secured by a mortgage of several buildings located at the Northgate Cyberzone and assignment of the corresponding rentals. 46,000 46,000 −
Unsecured loan obtained in July 2007 payable in twenty (20) equal quarterly amortizations starting in March 2008, with interest rate equal to 91-day T-Bill rate plus fixed spread of 2% per annum, payable quarterly in arrears and secured by a mortgage of several buildings located at the Northgate Cyberzone and assignment of the corresponding rentals. 40,000 40,000 −
8,511,007 1,640,999 6,870,008 Bonds Fixed rate bonds with aggregate principal
amount of P=5.00 billion, comprised of three (3)-year fixed rate bonds due in 2012 and five (5)-year fixed rate bonds due in 2014 was issued by the Parent Company on November 19, 2009. The 3-year bonds have a term of 3 years from the issue date, with a fixed interest rate of 7.5269% per annum. Interest is payable quarterly in arrears starting on February 19, 2010. The 5-year bonds have a term of 5 years and one (1) day from the issue date, with a fixed interest rate of 8.4615% per annum. Interest is payable quarterly in arrears starting on February 20, 2010. 4,986,205 500,000 4,486,205
Fixed rate bonds with principal amount of P=3.00 billion and term of five (5) years from the issue date was issued by the Parent Company on July 7, 2011. The fixed interest rate is 6.1962% per annum, payable quarterly in arrears starting on October 19, 2011. 2,990,804 − 2,990,804
7,997,009 500,000 7,447,009 P=16,488,016 P=2,140,999 P=14,347,017

- 9 -
*SGVMC116622*
Amounts are presented net of unamortized deferred costs.
Schedule F. Indebtedness to Related Parties (Long Term Loans from Related Companies) Below is the list of outstanding payables to related parties of the Group presented in the consolidated statements of financial position as of December 31, 2011 (amount in thousands):
Relationship Nature
Balance at beginning
of period Balance at
end of period Pacific Sugar Holdings, Corp. Affiliate A P=54,337 P=26,768 Filinvest Alabang, Inc Affiliate A 15,353 16,741 ALG Holdings, Corp. Ultimate Parent A 1,512 2,608 Festival Supermall, Inc. - Management Affiliate A 11,421 2,229 Filinvest Development Corp. Parent Company A, C, E 20 65 P=82,643 P=48,411
Nature of intercompany transactions The nature of the intercompany transactions with the related parties is described below:
A. Expenses - these pertain to the share of the Group of related parties in various common selling and marketing and general and administrative expenses.
B. Advances - these pertain to temporary advances to/from related parties for working capital requirements
C. Management and marketing fee D. Reimbursable commission expense E. Rentals
Schedule H. Capital Stock
Title of issue
Number of shares
authorized
Number of shares issued
and outstanding
as shown under related balance sheet
caption
Number of shares
reserved for options,
warrants, conversion
and other rights
Number of shares held
by related parties
Directors, Officers and
Employees Others (In Thousands)
Common Shares 33,000,000 24,470,708 − 12,969,649 8,101 None Preferred Shares 8,000,000 8,000,000 − 8,000,000 − None

- 10 -
*SGVMC116622*
Group Structure Below is a map showing the relationship between and among the Group and its ultimate parent company, subsidiaries, and associates as of December 31, 2011:

- 11 -
*SGVMC116622*
Standards adopted by the Group Below is the list of all effective Philippine Financial Reporting Standards (PFRS), Philippine Accounting Standards (PAS) and Philippine Interpretations of International Financial Reporting Interpretations Committee (IFRIC) as of December 31, 2011:
PFRSs
Adopted/Not Adopted/ Not
Applicable PFRS 1, First-Time Adoption of Philippine Financial Reporting Standards Adopted PFRS 2, Share-based Payment Adopted PFRS 3, Business Combinations Adopted PFRS 4, Insurance Contracts Not Applicable PFRS 5, Non-current Assets Held for Sale and Discontinued Operations Not applicable PFRS 6, Exploration for and Evaluation of Mineral Resources Not applicable PFRS 7, Financial Instruments - Disclosures Adopted PAS 1, Presentation of Financial Statements Adopted PAS 2, Inventories Adopted PAS 7, Statement of Cash Flows Adopted PAS 8, Accounting Policies, Changes in Accounting Estimates and Errors Adopted PAS 10, Events after the Reporting Period Adopted PAS 11, Construction Contracts Not Applicable PAS 12, Income Taxes Adopted PAS 16, Property, Plant and Equipment Adopted PAS 17, Leases Adopted PAS 18, Revenue Adopted PAS 19, Employee Benefits Adopted PAS 20, Accounting for Government Grants and Disclosure of Government Assistance Not applicable PAS 21, The Effects of Changes in Foreign Exchange Rates Adopted PAS 23, Borrowing Costs Adopted PAS 24, Related Party Transactions (Amendment) Adopted PAS 26, Accounting and Reporting by Retirement Benefits Not applicable PAS 27, Consolidated and Separate Financial Statements Adopted PAS 28, Investment in Associates Adopted PAS 29, Financial Reporting in Hyperinflationary Economies Not applicable PAS 31, Interests in Joint Ventures Adopted PAS 32, Financial Instruments: Presentation (Amendment Adopted (Forward)

- 12 -
*SGVMC116622*
PFRSs
Adopted/Not Adopted/ Not
Applicable PAS 33, Earnings per share Adopted PAS 34, Interim Financial Statements Adopted PAS 36, Impairment of Assets Adopted PAS 37, Provisions, Contingent Liabilities and Contingent Assets Adopted PAS 38, Intangible Assets Adopted PAS 39, Financial Instruments: Recognition and Measurement Adopted PAS 40, Investment Property Adopted PAS 41, Agriculture Not applicable Philippine Interpretation IFRIC - 1, Changes in Existing Decommissioning, Restoration and Similar Liabilities Not applicable Philippine Interpretation IFRIC - 2, Members' Shares in Co-operative Entities and Similar Instruments Not applicable Philippine Interpretation IFRIC - 4, Determining whether an Arrangement contains a Lease Adopted Philippine Interpretation IFRIC - 5, Rights to Interests arising from Decommissioning, Restoration and Environmental Rehabilitation Funds Not applicable Philippine Interpretation IFRIC - 6, Liabilities arising from Participating in a Specific Market - Waste Electrical and Electronic Equipment Not applicable Philippine Interpretation IFRIC - 7, Applying the Restatement Approach under PAS 29 Financial Reporting in Hyperinflationary Economies Not applicable Philippine Interpretation IFRIC - 9, Reassessment of Embedded Derivatives Adopted Philippine Interpretation IFRIC - 10, Interim Financial Reporting and Impairment Adopted Philippine Interpretation IFRIC - 12, Service Concession Arrangements Not applicable Philippine Interpretation IFRIC - 13, Customer Loyalty Programmes Not applicable Philippine Interpretation IFRIC - 16, Hedges of a Net Investment in a Foreign Operation Not applicable Philippine Interpretation IFRIC - 17, Distributions of Non-cash Assets to Owners Not applicable Philippine Interpretation IFRIC - 18, Transfers of Assets from Customers Not applicable Philippine Interpretation IFRIC -19, Extinguishing Financial Liabilities with Equity Instruments Adopted (Forward)

- 13 -
*SGVMC116622*
PFRSs
Adopted/Not Adopted/ Not
Applicable Philippine Interpretation SIC - 7, Introduction of the Euro Not applicable Philippine Interpretation SIC - 10, Government Assistance - No Specific Relation to Operating Activities Not applicable Philippine Interpretation SIC - 12, Consolidation - Special Purpose Entities Not applicable Philippine Interpretation SIC - 13, Jointly Controlled Entities - Non-Monetary Contributions by Venturers Adopted Philippine Interpretation SIC - 15, Operating Leases - Incentives Adopted Philippine Interpretation SIC - 21, Income Taxes - Recovery of Revalued Non-Depreciable Assets Adopted Philippine Interpretation SIC - 25, Income Taxes - Changes in the Tax Status of an Entity or its Shareholders Not applicable Philippine Interpretation SIC - 27, Evaluating the Substance of Transactions Involving the Legal Form of a Lease Adopted Philippine Interpretation SIC - 29, Service Concession Arrangements: Disclosures Not applicable Philippine Interpretation SIC - 31, Revenue - Barter Transactions Involving Advertising Services Not applicable Philippine Interpretation SIC - 32, Intangible Assets - Web Site Costs Not applicable
Standards Issued but not yet Effective as of December 31, 2011
Standard(s)/Interpretation(s) /Amendment (s) issued but not yet
effective
Applicable to annual period
beginning on or after
Early application
allowed
Adopted/Not adopted/Not
applicable Amendments to PFRS 7: Disclosures -
Transfers of Financial Assets July 1, 2011 Yes Not adopted Amendments to PFRS 7: Disclosures -
Offsetting Financial Assets and Financial Liabilities January 1, 2013 Not mentioned Not adopted
PFRS 9, Financial Instruments January 1, 2015 Yes Adopted PFRS 10, Consolidated Financial Statements January 1, 2013 Yes Not adopted PFRS 11, Joint Arrangements January 1, 2013 Yes Not adopted PFRS 12, Disclosure of Interests in Other
Entities January 1, 2013 Yes Not adopted PFRS 13, Fair Value Measurement January 1, 2013 Yes Not adopted Amendments to PAS 1: Presentation of Items
of Other Comprehensive Income July 1, 2012 Yes Not adopted (Forward)

- 14 -
*SGVMC116622*
Standard(s)/Interpretation(s) /Amendment (s) issued but not yet
effective
Applicable to annual period
beginning on or after
Early application
allowed
Adopted/Not adopted/Not
applicable Amendments to PAS 12 - Deferred Tax:
Recovery of Underlying Assets January 1, 2012 Yes Not adopted PAS 19, Employee Benefits (Revised) January 1, 2013 Yes Not adopted PAS 27, Separate Financial Statements January 1, 2013 Yes Not adopted PAS 28, Investments in Associates and Joint
Ventures January 1, 2013 Yes Not adopted Amendments to PAS 32, Offsetting Financial
Assets and Financial Liabilities January 1, 2014 Yes Not adopted Philippine Interpretation IFRIC - 15,
Agreements for the Construction of Real Estate
Deferred by SEC and FRSC No Not adopted
Philippine Interpretation IFRIC - 20, Stripping Costs in the Production Phase of a Surface Mine January 1, 2013 Yes Not applicable
Financial Soundness Indicator Below are the financial ratios that are relevant to the Group for the year ended December 31, 2011:
Financial ratios Current ratio Current assets Current liabilities 1.75 Long term debt-to-equity ratio Long term debt 0.38 Equity Debt ratio Total liabilities 0.36 Total assets EBITDA to total interest paid EBITDA 4.40 Total interest paid Price Earnings Ratio Closing price* 8.16 Earnings per share
*Closing price at December 29, 2011 In computing the current ratio, the Group considered the following accounts as current (based on the maturity profile of each accounts): Assets
• Cash and cash equivalents • Contracts receivables • Due from related parties • Other receivables • Real estate inventories

- 15 -
*SGVMC116622*
Liabilities
• Accounts payable and accrued expenses • Due to related parties • Income tax payable • Loans payable • Bonds payable

*SGVMC116622*
FILINVEST LAND, INC. PARENT COMPANY UNAPPROPRIATED RETAINED EARNINGS AVAILABLE FOR DIVIDEND DISTRIBUTION (Amounts in Thousands of Pesos) Balance as of January 1, 2011 P=6,559,914 Net income actually earned/realized during the year Net income during the year 3,163,087 Non-actual/unrealized losses net of tax Movement in deferred tax assets (3,454) 3,268,139 Less: Dividend declarations during the year (950,592)
Total Parent Company Unappropriated Retained Earnings Available For Dividend Distribution, December 31, 2011 P=8,768,955