mozambique- local taxation under fiscal stress- … · mozambique- local taxation under fiscal...
TRANSCRIPT
MOZAMBIQUE- LOCAL TAXATION UNDER FISCAL
STRESS- WHAT OPTIONS, WHAT IMPLICATIONS?
BERNHARD WEIMER
5TH INTERNATIONAL WORKSHOP ON DOMESTIC REVENUE MOBILISATION FOR
IMPLEMENTING THE 2030 AGENDA:
THE ROLE OF SUBNATIONAL TAXATION
GDI / DIE, BONN, 13-14 SEPTEMBER, 2016
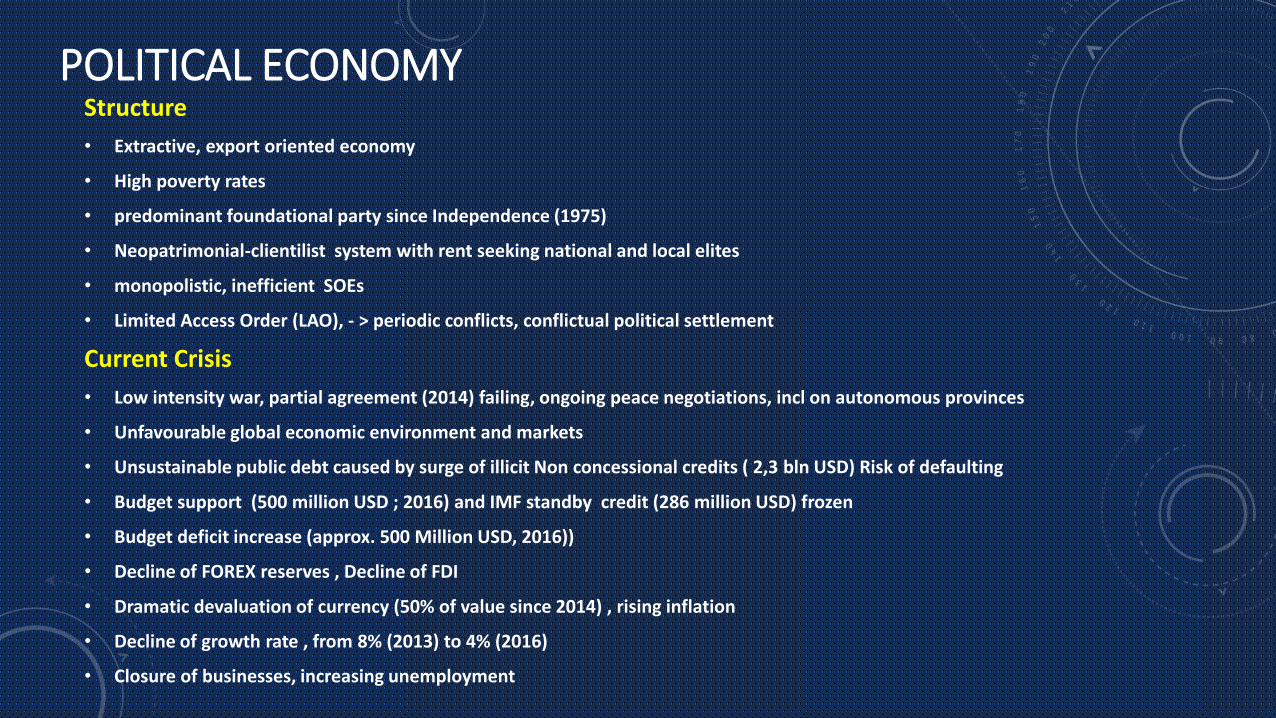
POLITICAL ECONOMYStructure
• Extractive, export oriented economy
• High poverty rates
• predominant foundational party since Independence (1975)
• Neopatrimonial-clientilist system with rent seeking national and local elites
• monopolistic, inefficient SOEs
• Limited Access Order (LAO), - > periodic conflicts, conflictual political settlement
Current Crisis
• Low intensity war, partial agreement (2014) failing, ongoing peace negotiations, incl on autonomous provinces
• Unfavourable global economic environment and markets
• Unsustainable public debt caused by surge of illicit Non concessional credits ( 2,3 bln USD) Risk of defaulting
• Budget support (500 million USD ; 2016) and IMF standby credit (286 million USD) frozen
• Budget deficit increase (approx. 500 Million USD, 2016))
• Decline of FOREX reserves , Decline of FDI
• Dramatic devaluation of currency (50% of value since 2014) , rising inflation
• Decline of growth rate , from 8% (2013) to 4% (2016)
• Closure of businesses, increasing unemployment
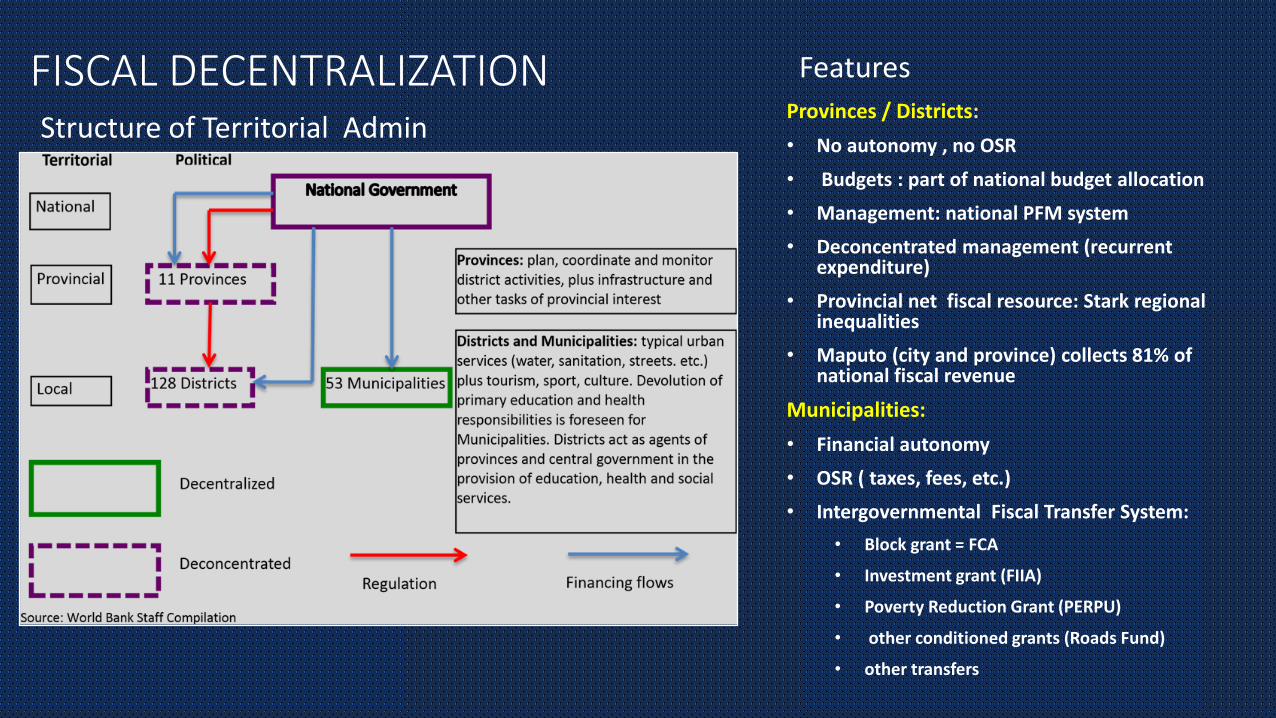
FISCAL DECENTRALIZATION Structure of Territorial Admin
Features
Provinces / Districts:
• No autonomy , no OSR
• Budgets : part of national budget allocation
• Management: national PFM system
• Deconcentrated management (recurrent expenditure)
• Provincial net fiscal resource: Stark regional inequalities
• Maputo (city and province) collects 81% of national fiscal revenue
Municipalities:
• Financial autonomy
• OSR ( taxes, fees, etc.)
• Intergovernmental Fiscal Transfer System:
• Block grant = FCA
• Investment grant (FIIA)
• Poverty Reduction Grant (PERPU)
• other conditioned grants (Roads Fund)
• other transfers
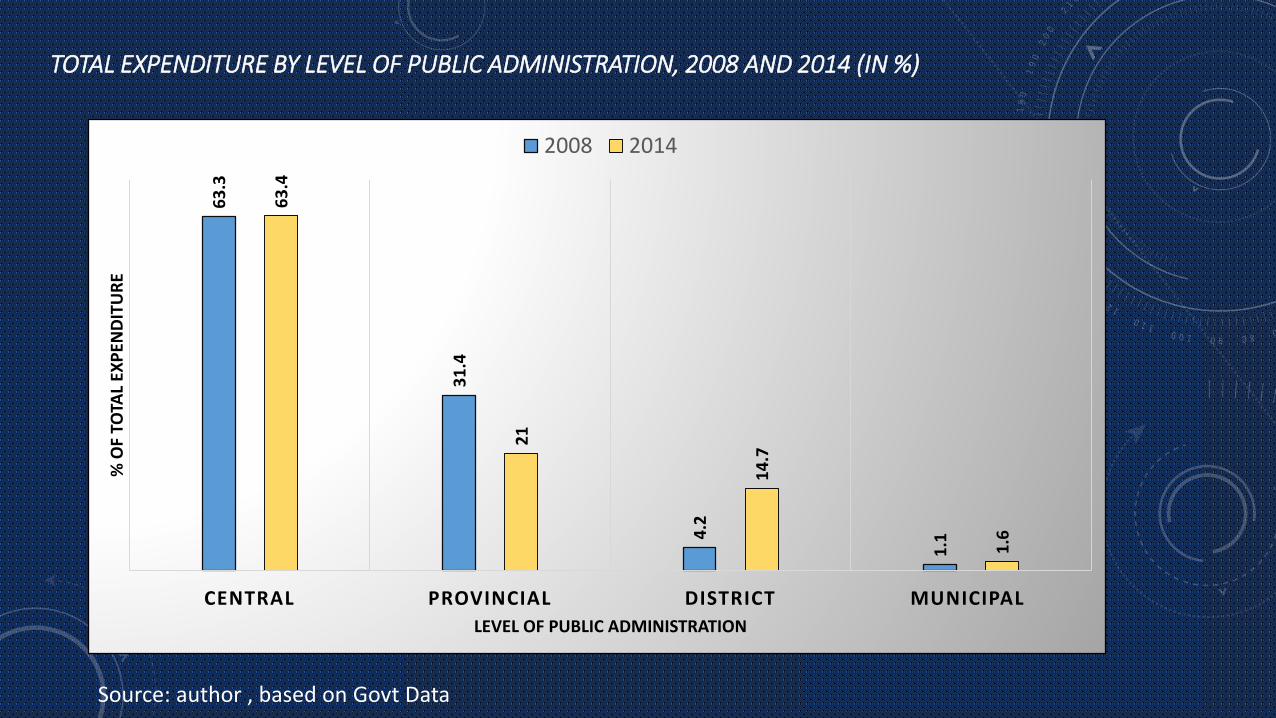
TOTAL EXPENDITURE BY LEVEL OF PUBLIC ADMINISTRATION, 2008 AND 2014 (IN %)
63
.3
31
.4
4.2
1.1
63
.4
21
14
.7
1.6
CENTRAL PROVINCIAL DISTRICT MUNICIPAL
% O
F TO
TAL
EXP
END
ITU
RE
LEVEL OF PUBLIC ADMINISTRATION
2008 2014
Source: author , based on Govt Data
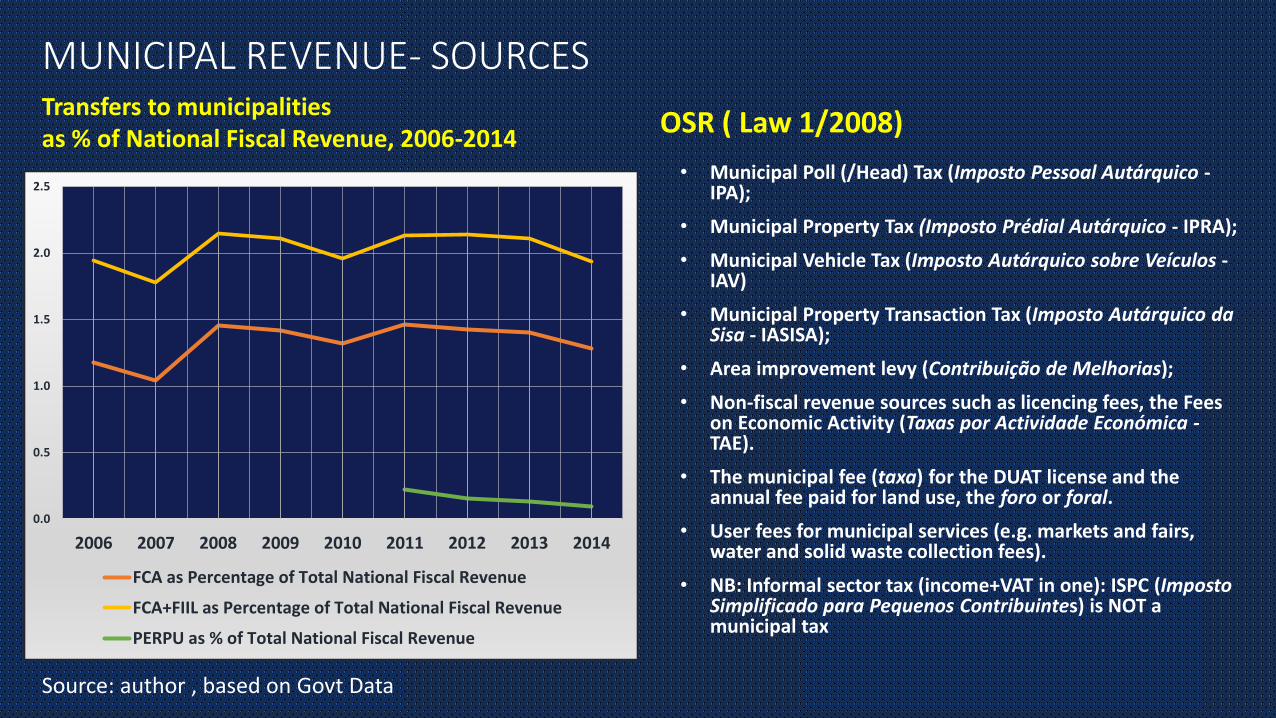
MUNICIPAL REVENUE- SOURCESTransfers to municipalities as % of National Fiscal Revenue, 2006-2014
OSR ( Law 1/2008)
• Municipal Poll (/Head) Tax (Imposto Pessoal Autárquico -IPA);
• Municipal Property Tax (Imposto Prédial Autárquico - IPRA);
• Municipal Vehicle Tax (Imposto Autárquico sobre Veículos -IAV)
• Municipal Property Transaction Tax (Imposto Autárquico da Sisa - IASISA);
• Area improvement levy (Contribuição de Melhorias);
• Non-fiscal revenue sources such as licencing fees, the Fees on Economic Activity (Taxas por Actividade Económica -TAE).
• The municipal fee (taxa) for the DUAT license and the annual fee paid for land use, the foro or foral.
• User fees for municipal services (e.g. markets and fairs, water and solid waste collection fees).
• NB: Informal sector tax (income+VAT in one): ISPC (Imposto Simplificado para Pequenos Contribuintes) is NOT a municipal tax
0.0
0.5
1.0
1.5
2.0
2.5
2006 2007 2008 2009 2010 2011 2012 2013 2014
FCA as Percentage of Total National Fiscal Revenue
FCA+FIIL as Percentage of Total National Fiscal Revenue
PERPU as % of Total National Fiscal Revenue
Source: author , based on Govt Data
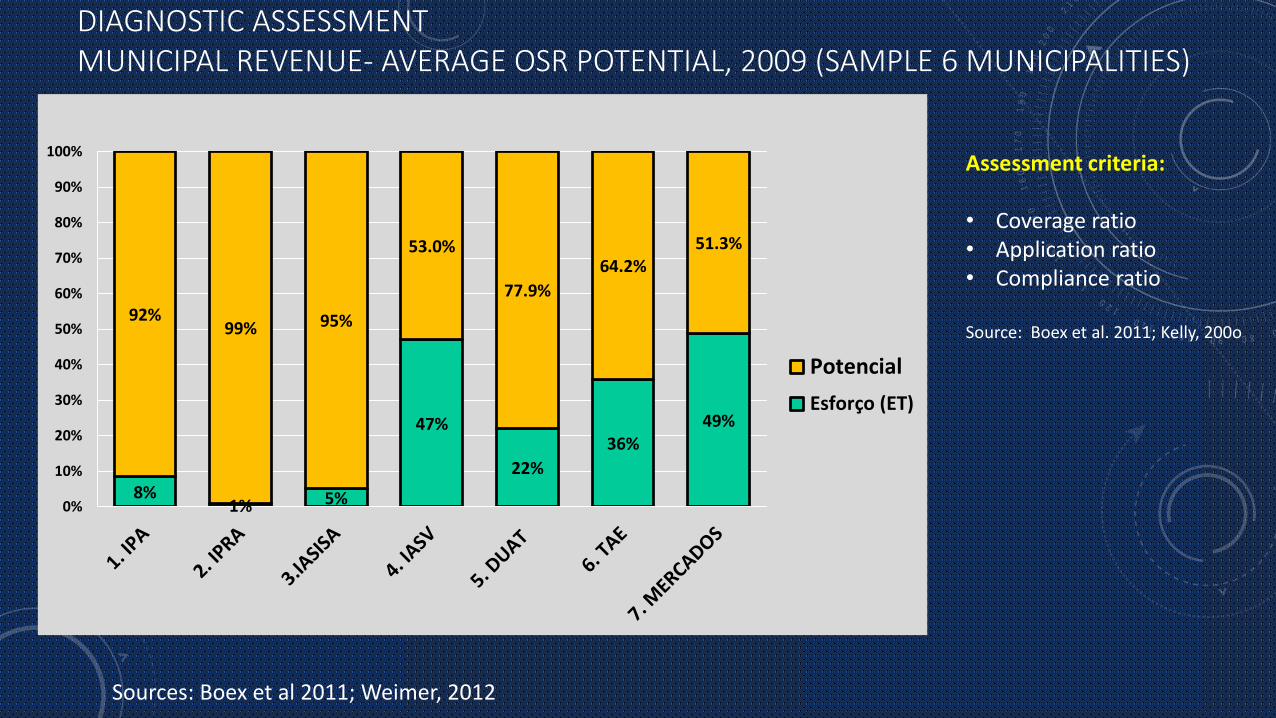
DIAGNOSTIC ASSESSMENTMUNICIPAL REVENUE- AVERAGE OSR POTENTIAL, 2009 (SAMPLE 6 MUNICIPALITIES)
8%1% 5%
47%
22%
36%49%
92%99% 95%
53.0%
77.9%
64.2%51.3%
0%
10%
20%
30%
40%
50%
60%
70%
80%
90%
100%
Potencial
Esforço (ET)
Sources: Boex et al 2011; Weimer, 2012
Assessment criteria:
• Coverage ratio• Application ratio• Compliance ratio
Source: Boex et al. 2011; Kelly, 200o

RESOURCE MOBILIZATION AND FISCAL SUSTAINABILITY: INDUSTRIAL CITY (962.100 INHAB)
Matola: OSR, transfers, 2011-2014 (US$) Matola: fiscal sustainability 2011-2014 (%)
0
5,000,000
10,000,000
15,000,000
20,000,000
25,000,000
30,000,000
2011 2012 2013 2014
Total OSR
Transfers (FCA+FIIL)
Donations
Total Revenue
0.0
20.0
40.0
60.0
80.0
100.0
120.0
140.0
160.0
2011 2012 2013 2014
OSR /RecurrentExpenditure
OSR+FCA /RecurrentExpenditure
Source: Author, PPIAF-SNTA

RESOURCE MOBILIZATION AND FISCAL SUSTAINABILITY: RURAL TOWN (170.000 INHAB)
Manhiça: OSR, transfers, 2011-2014 (US$) Manhiça: fiscal sustainability 2011-2014 (%)
0
5,000,000
10,000,000
15,000,000
20,000,000
25,000,000
30,000,000
2011 2012 2013 2014
Total OSR
Transfers (FCA+FIIL)
Donations
Total Revenue
2011 2012 2013 2014
OSR / RecurrentExpenditure
OSR+FCA /RecurrentExpenditure
Source: Author, PPIAF-SNTA
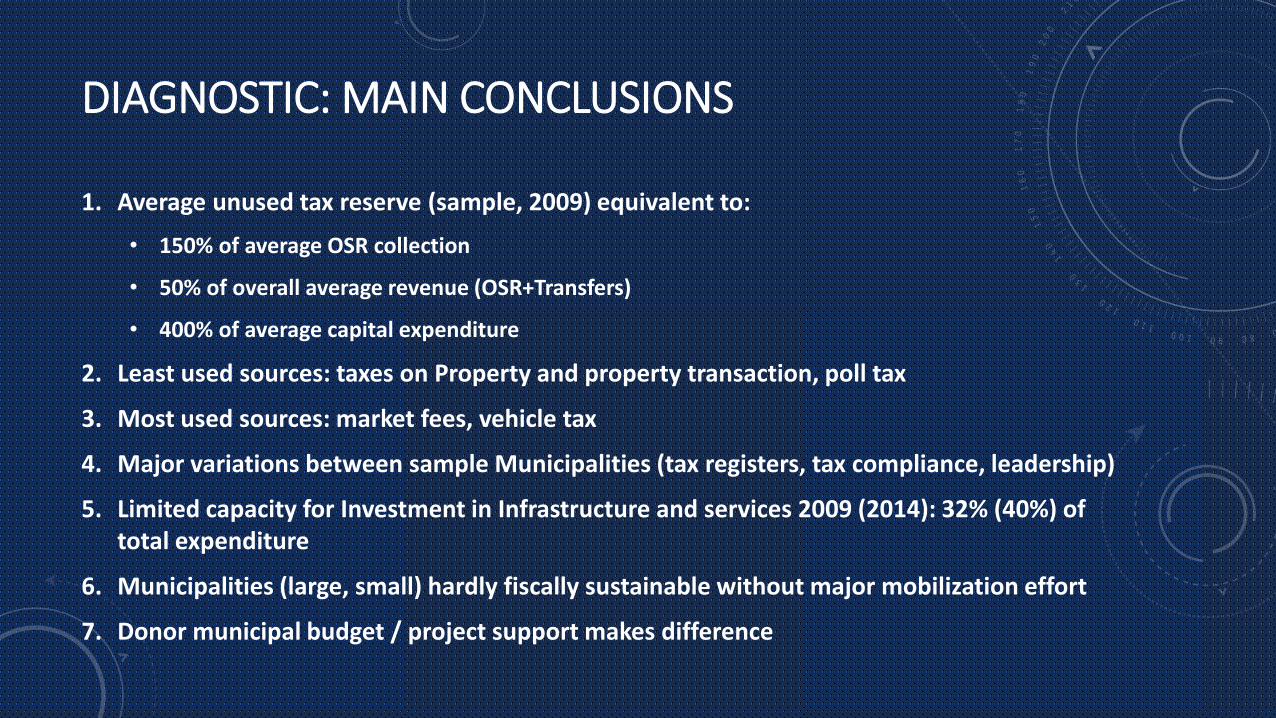
DIAGNOSTIC: MAIN CONCLUSIONS
1. Average unused tax reserve (sample, 2009) equivalent to:
• 150% of average OSR collection
• 50% of overall average revenue (OSR+Transfers)
• 400% of average capital expenditure
2. Least used sources: taxes on Property and property transaction, poll tax
3. Most used sources: market fees, vehicle tax
4. Major variations between sample Municipalities (tax registers, tax compliance, leadership)
5. Limited capacity for Investment in Infrastructure and services 2009 (2014): 32% (40%) of total expenditure
6. Municipalities (large, small) hardly fiscally sustainable without major mobilization effort
7. Donor municipal budget / project support makes difference
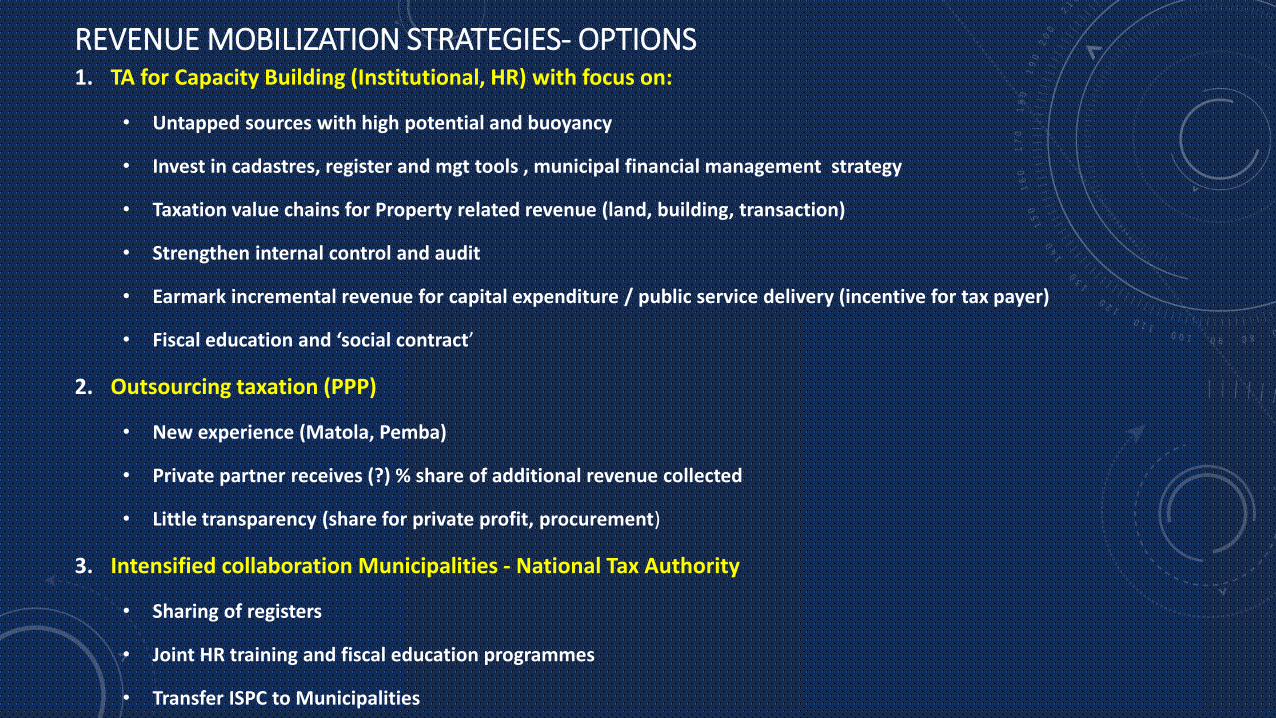
REVENUE MOBILIZATION STRATEGIES- OPTIONS1. TA for Capacity Building (Institutional, HR) with focus on:
• Untapped sources with high potential and buoyancy
• Invest in cadastres, register and mgt tools , municipal financial management strategy
• Taxation value chains for Property related revenue (land, building, transaction)
• Strengthen internal control and audit
• Earmark incremental revenue for capital expenditure / public service delivery (incentive for tax payer)
• Fiscal education and ‘social contract’
2. Outsourcing taxation (PPP)
• New experience (Matola, Pemba)
• Private partner receives (?) % share of additional revenue collected
• Little transparency (share for private profit, procurement)
3. Intensified collaboration Municipalities - National Tax Authority
• Sharing of registers
• Joint HR training and fiscal education programmes
• Transfer ISPC to Municipalities
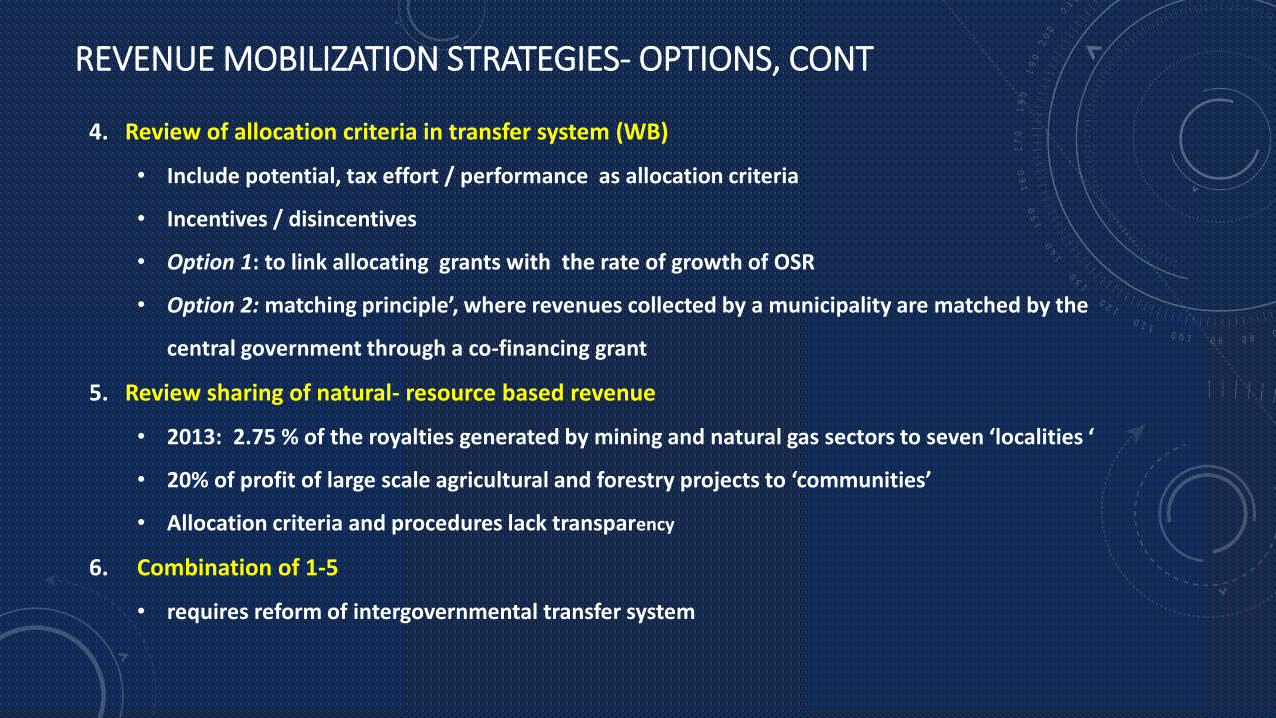
4. Review of allocation criteria in transfer system (WB)
• Include potential, tax effort / performance as allocation criteria
• Incentives / disincentives
• Option 1: to link allocating grants with the rate of growth of OSR
• Option 2: matching principle’, where revenues collected by a municipality are matched by the
central government through a co-financing grant
5. Review sharing of natural- resource based revenue
• 2013: 2.75 % of the royalties generated by mining and natural gas sectors to seven ‘localities ‘
• 20% of profit of large scale agricultural and forestry projects to ‘communities’
• Allocation criteria and procedures lack transparency
6. Combination of 1-5
• requires reform of intergovernmental transfer system
REVENUE MOBILIZATION STRATEGIES- OPTIONS, CONT

MAIN OBSTACLES TO REVENUE MOBILIZATION
1. Capacity Building (Option 1): has been mainstreamed in municipal support projects, with little overall success (with variations). Causes:
• Clientilist rent seeking and tax evasion practises by local elites and SOE
• Decentralized Corruption (sub-valorization of properties)
• Lack of incentives for performance (HR, leadership )
• Property tax: too complex, not commensurate with economic capacity
• Absence of internal control , external audits of municipal accounts
• Lack of citizens engagement and social control
2. Macroeconomic and fiscal crisis at national level produces
• Shrinking local economic and taxation base , transfers
• Declining purchasing power and availability of income
• Risk of double taxation (ISPC->national Tax Authority; local Business fee-> municipal tax department)
• Resistance to (local and national) taxation – > tax evasion
• Informalization of economy
3. Political crises implies
• Declining confidence in Government and ruling party
• Uncertainties, human and economic cost of war
• Potentially: Review of intergovernmental transfer system impacting on municipal revenue base and transfers
CONCLUDING QUESTIONS
Under what conditions can local revenue mobilization work in a LAO State, which
• Dos not deliver basic public goods and services with sufficient quality and coverage;
• Produces economic and fiscal crises not conducive to inclusive human , social and economic development , trust in government;
• Shows biased taxation favouring elite and big business to the detriment of ordinary citizens;
• Shows high rates of ‘Taxation by Corruption’ ( including by the national and local tax authorities), exacting a high cost and regressive effect on the poorer strata
• Lacks an institutionalized public (Habermas), in which rules of the game are discussed, established and controlled , incl in matters of fiscal policy and taxation?
THANK YOU